Australia Canada Germany Netherlands New Zealand South Africa United Kingdom United States World
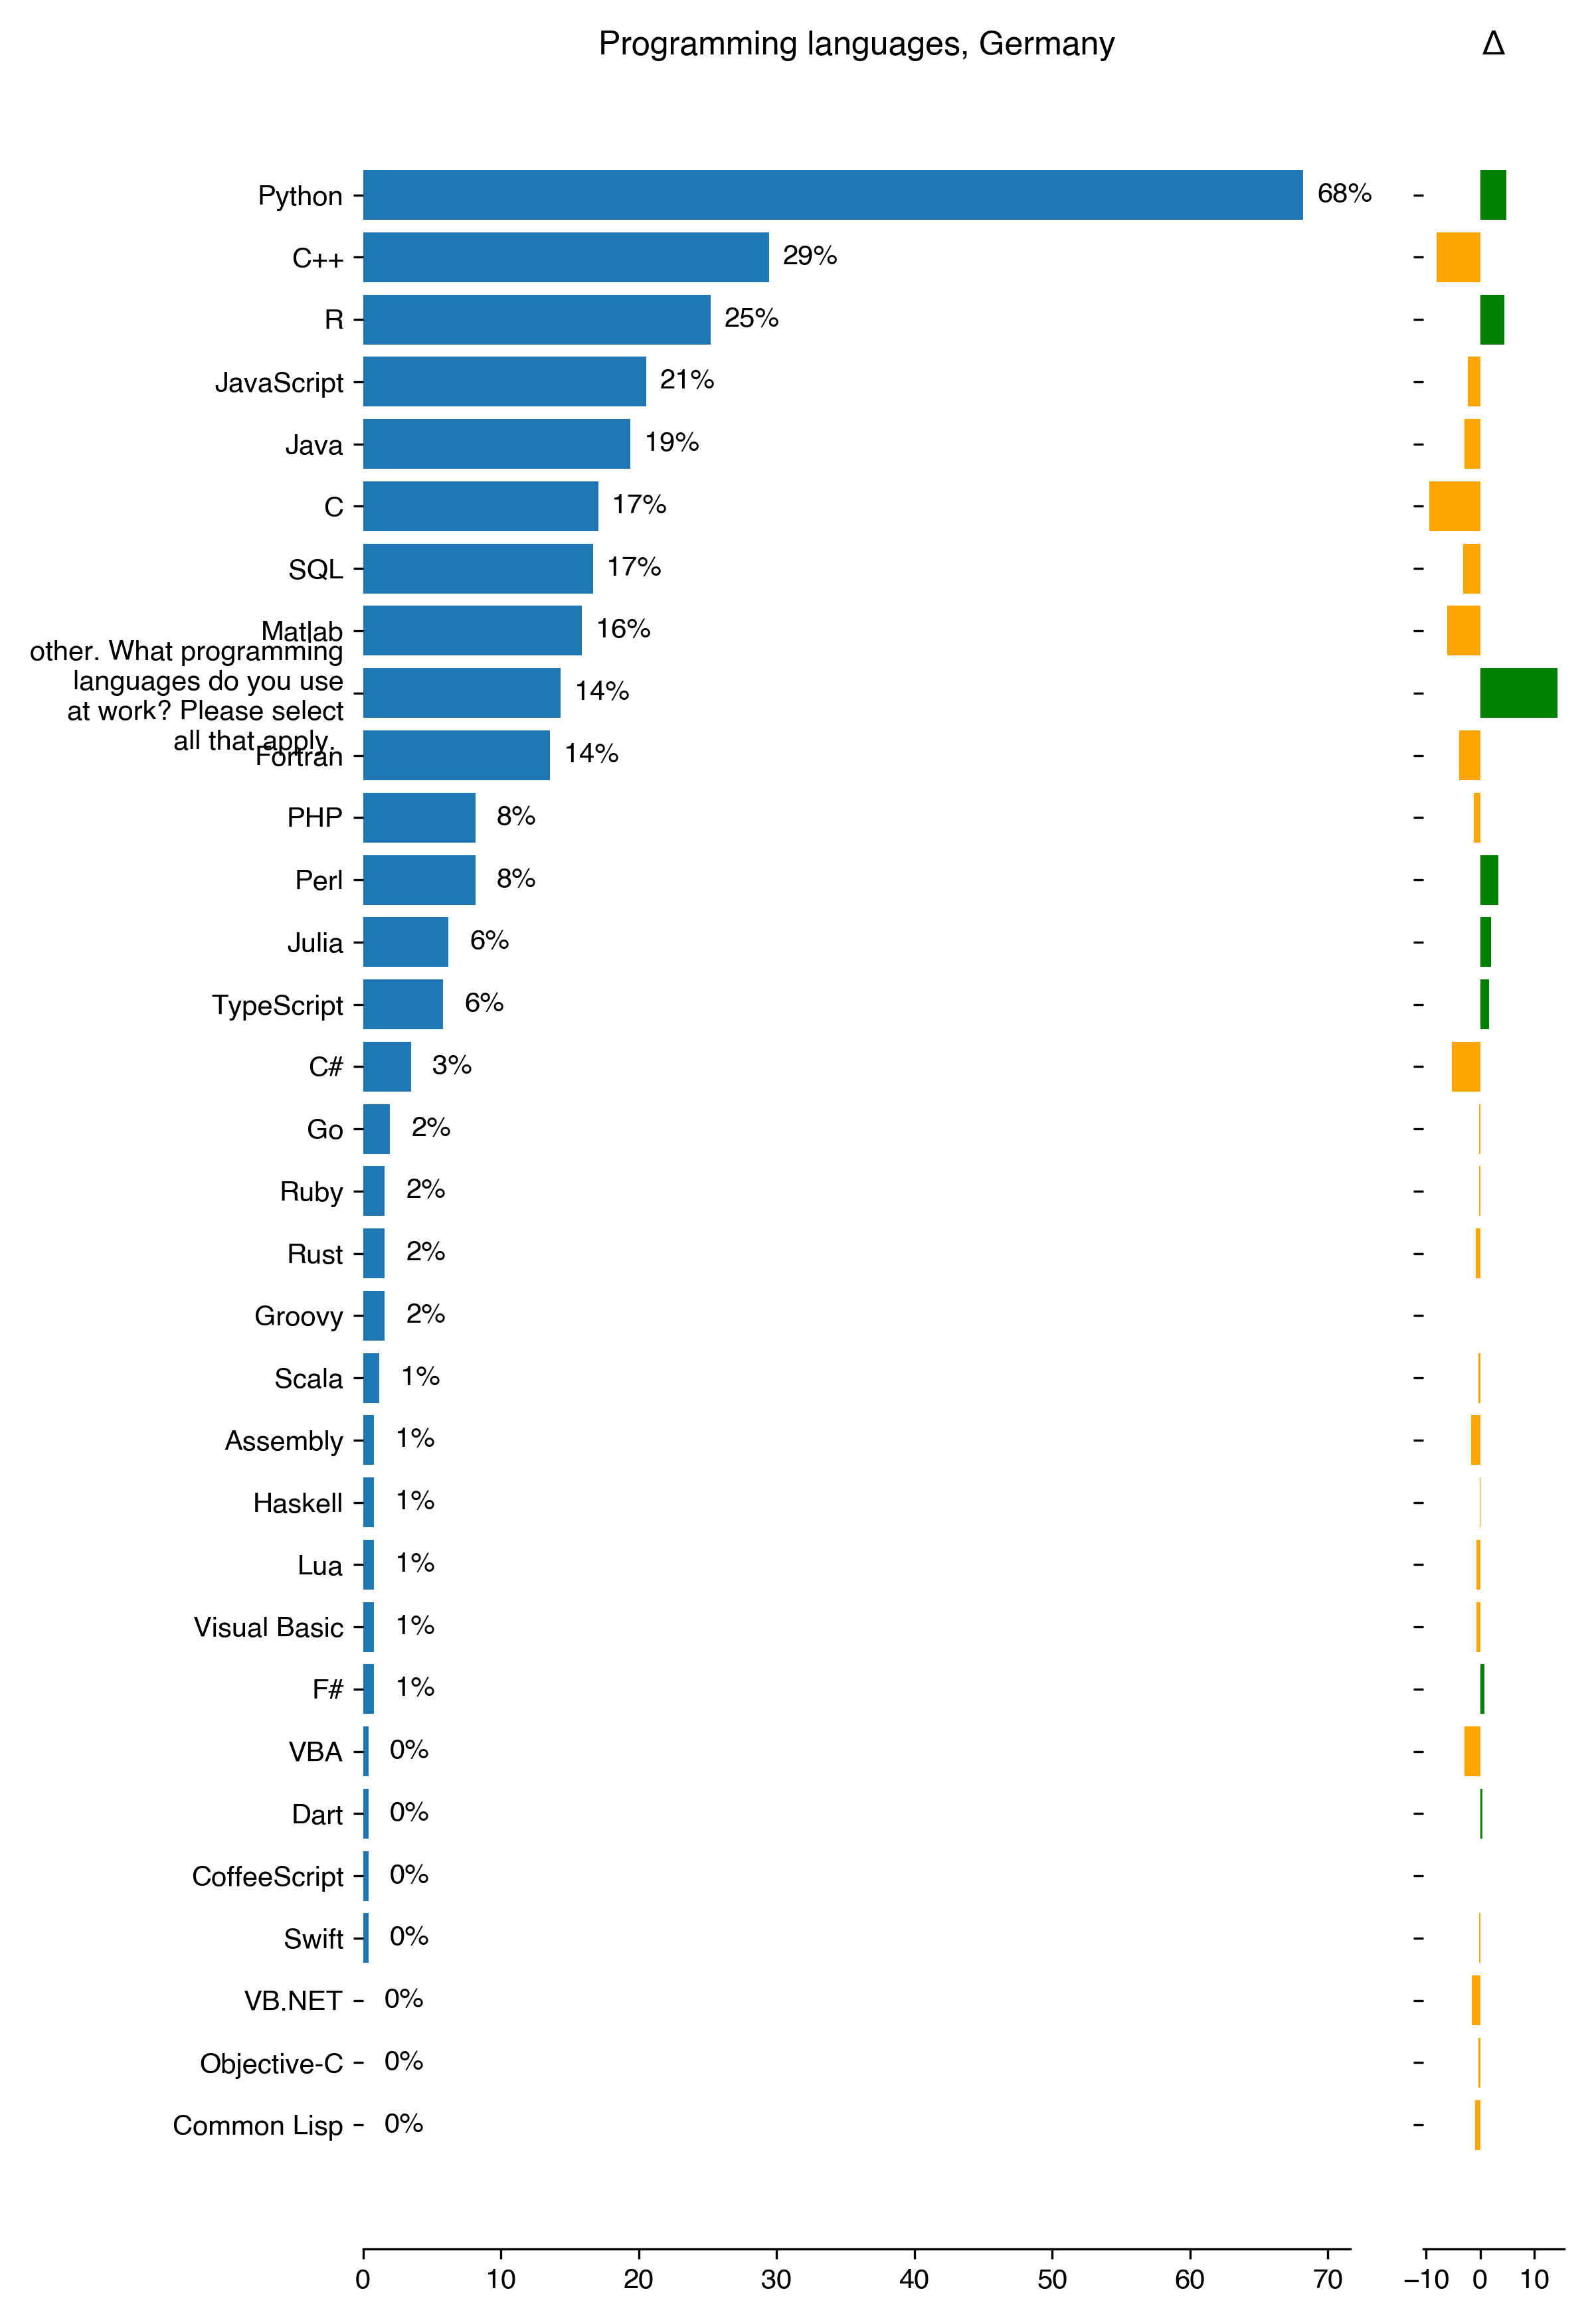
On technical details we wanted to know which of the programming languages are mostly used by the RSEs. We give them a multi-choice list inspired by the results published by Stackoverflow .
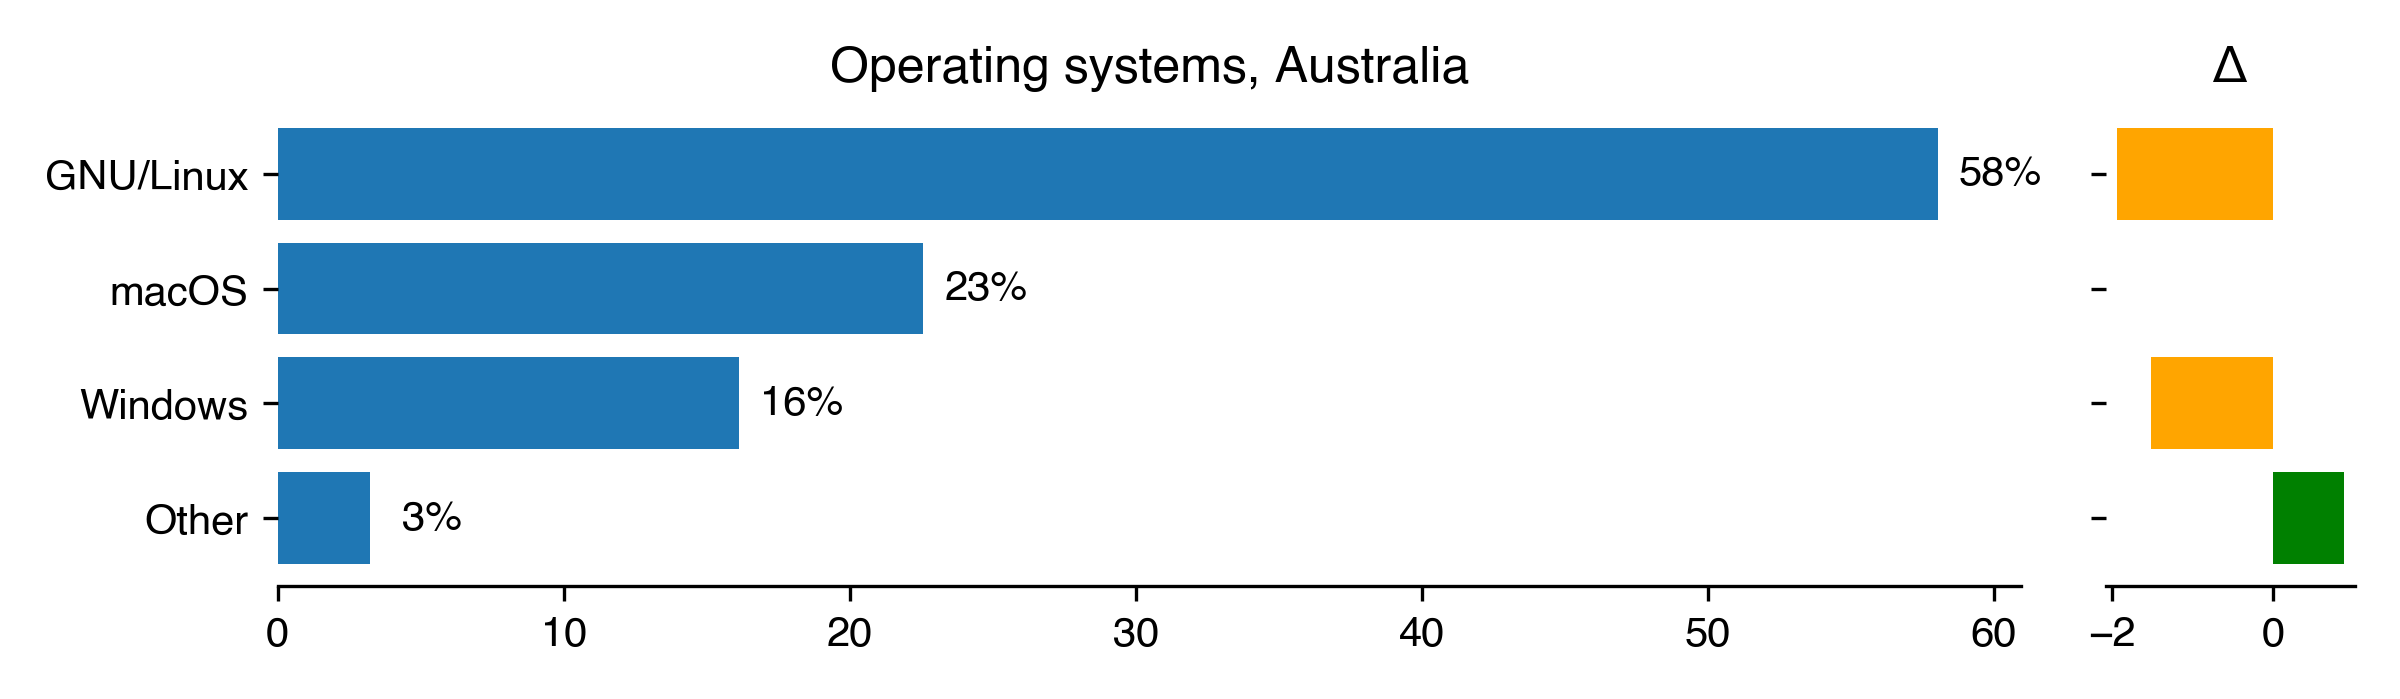
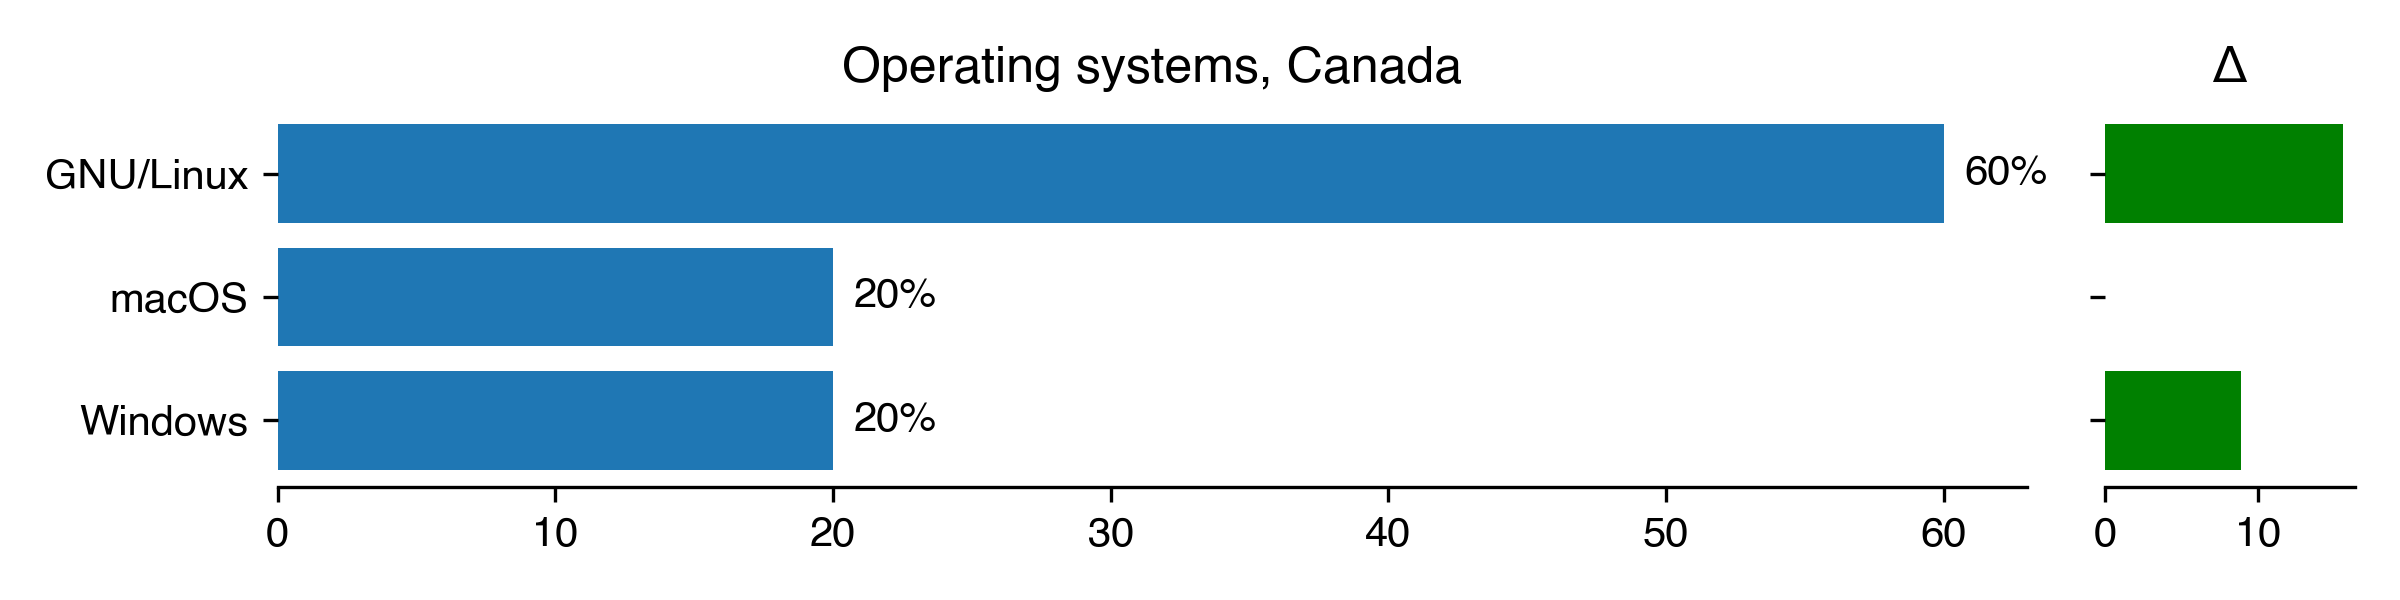
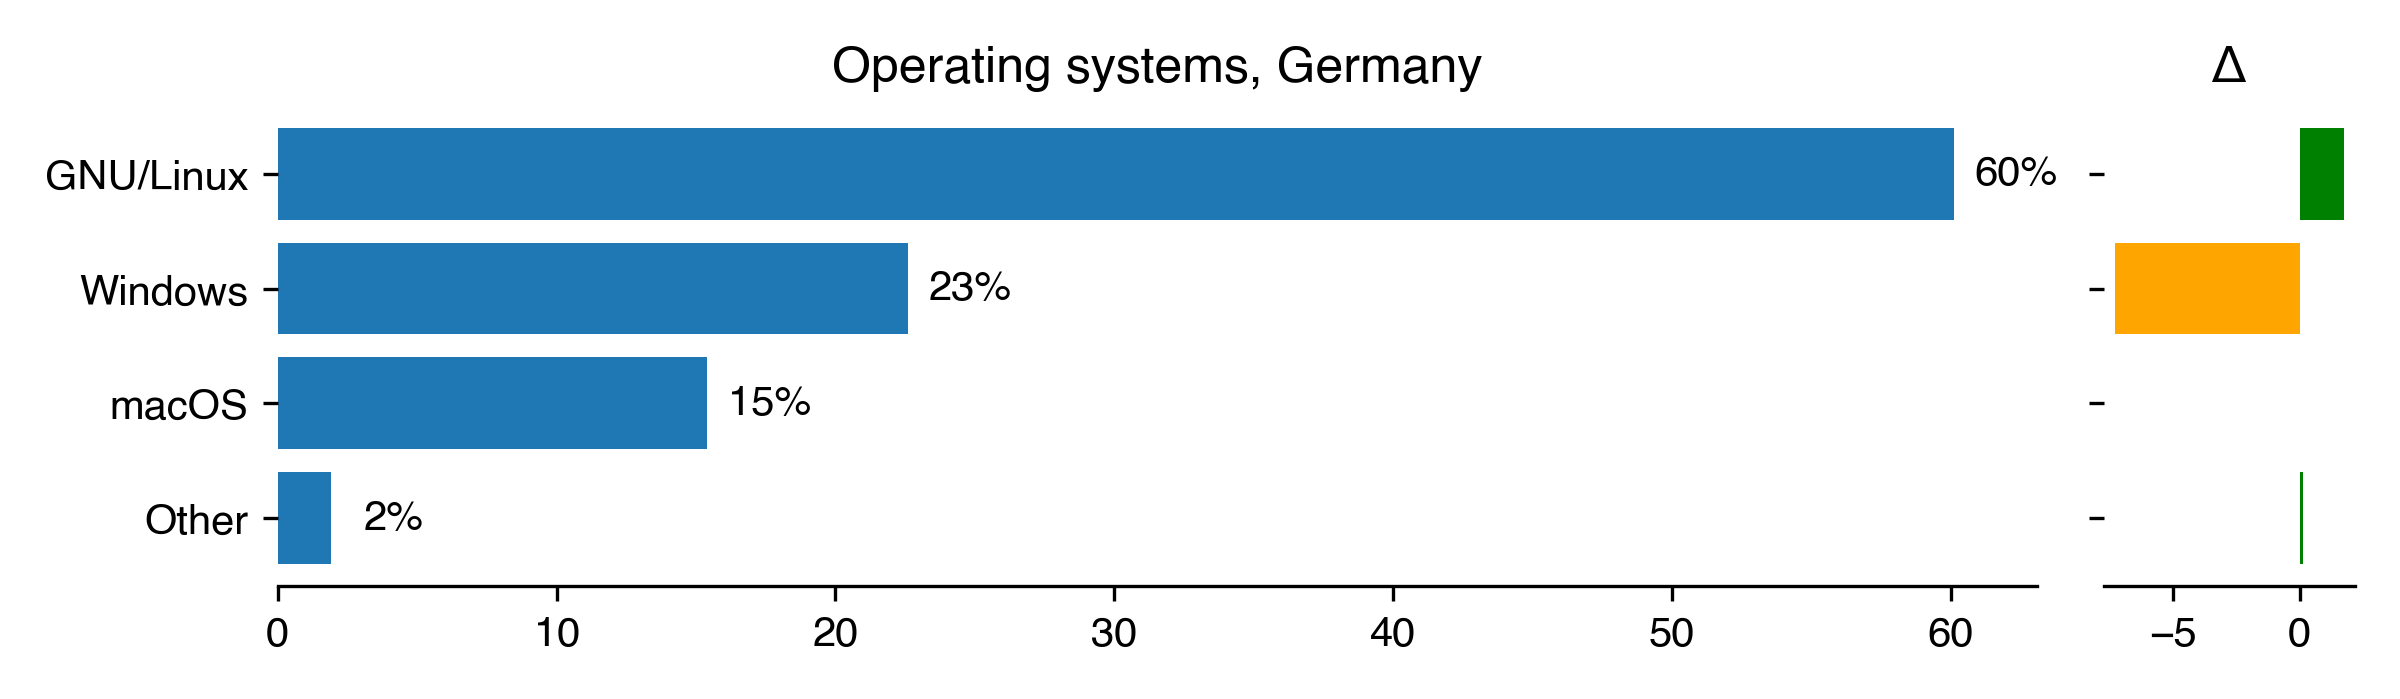
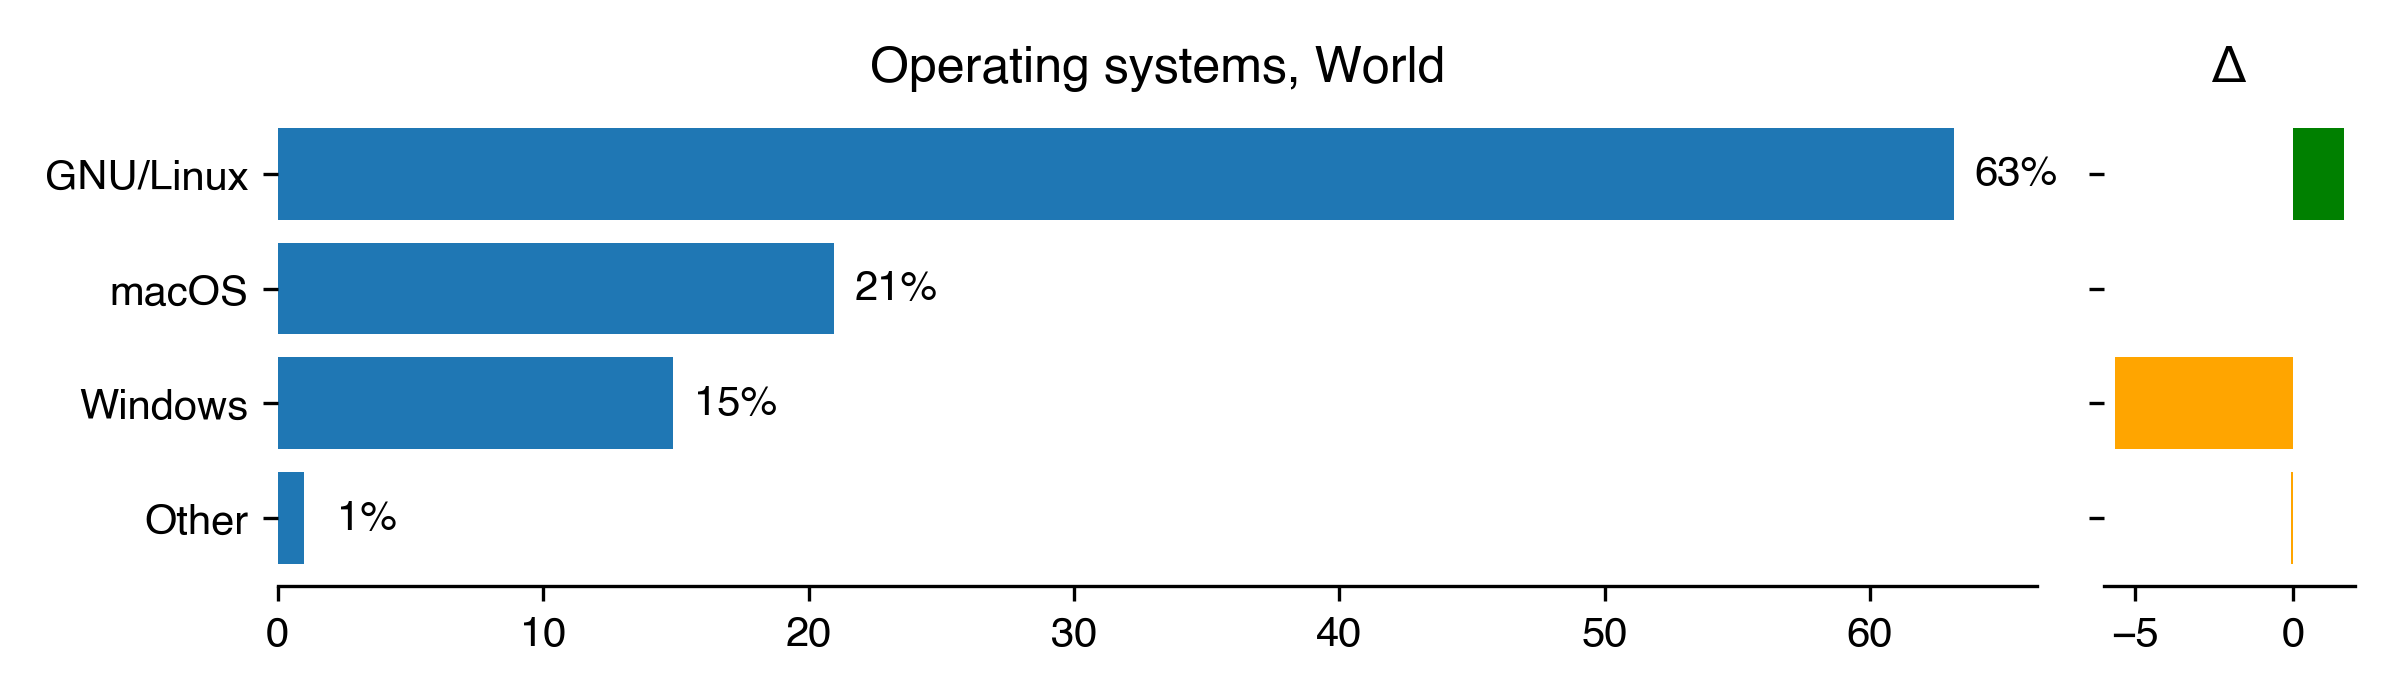
We also wanted to know which operating system they use for work.
Questions in this section:
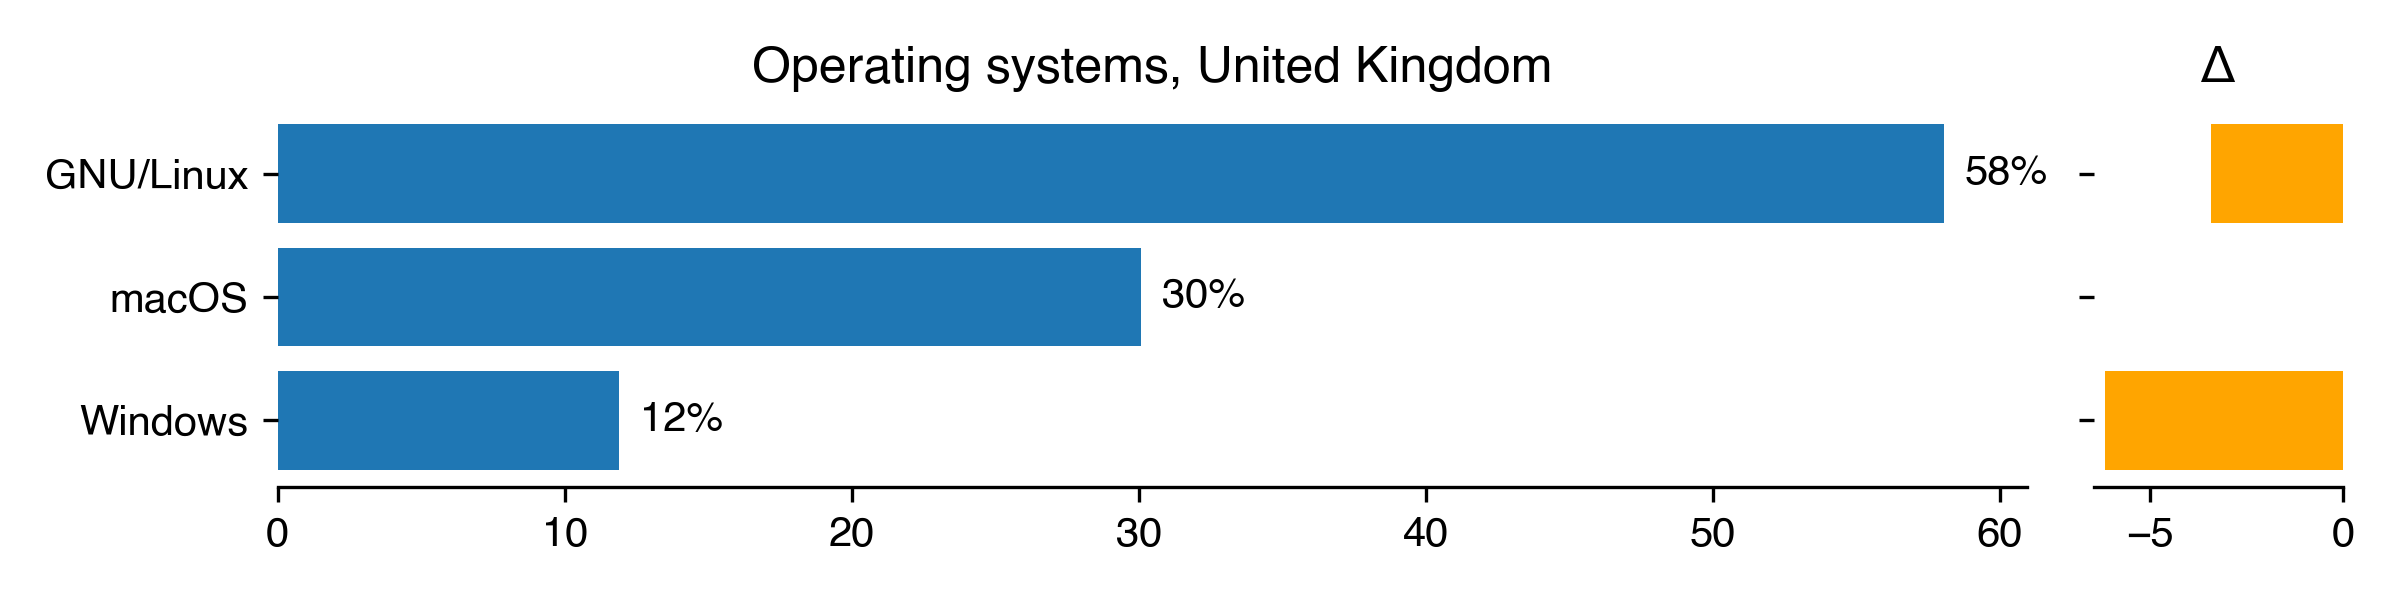
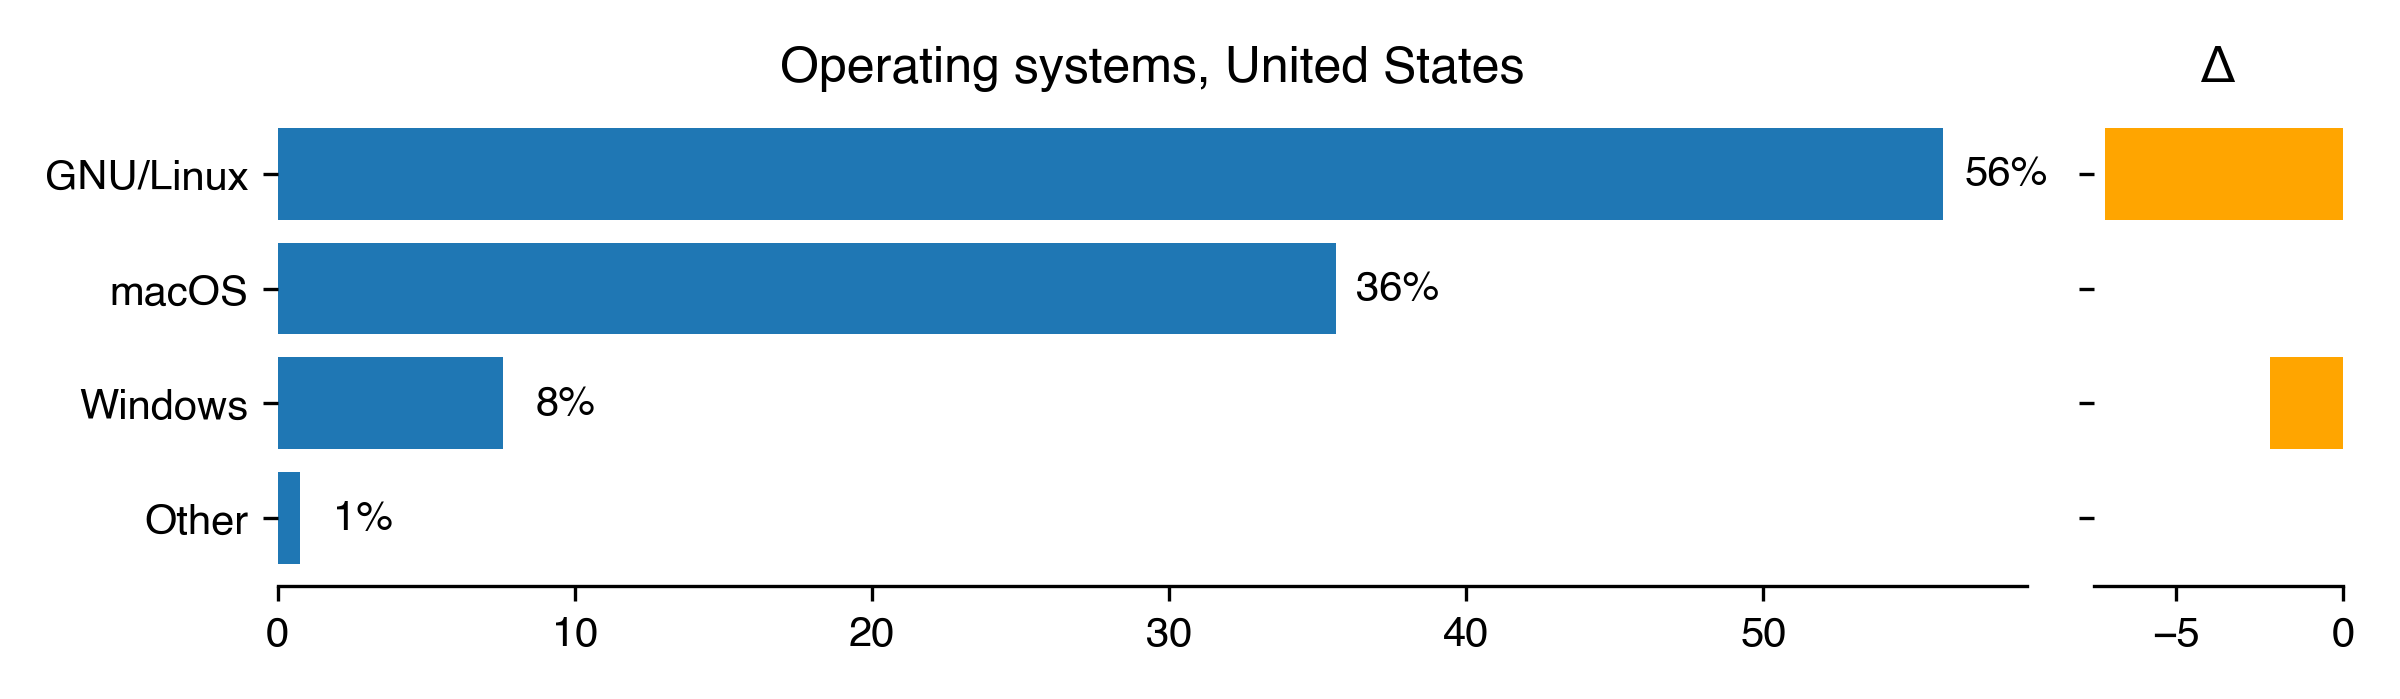
Which operating system do you primarily use for development? (one choice)
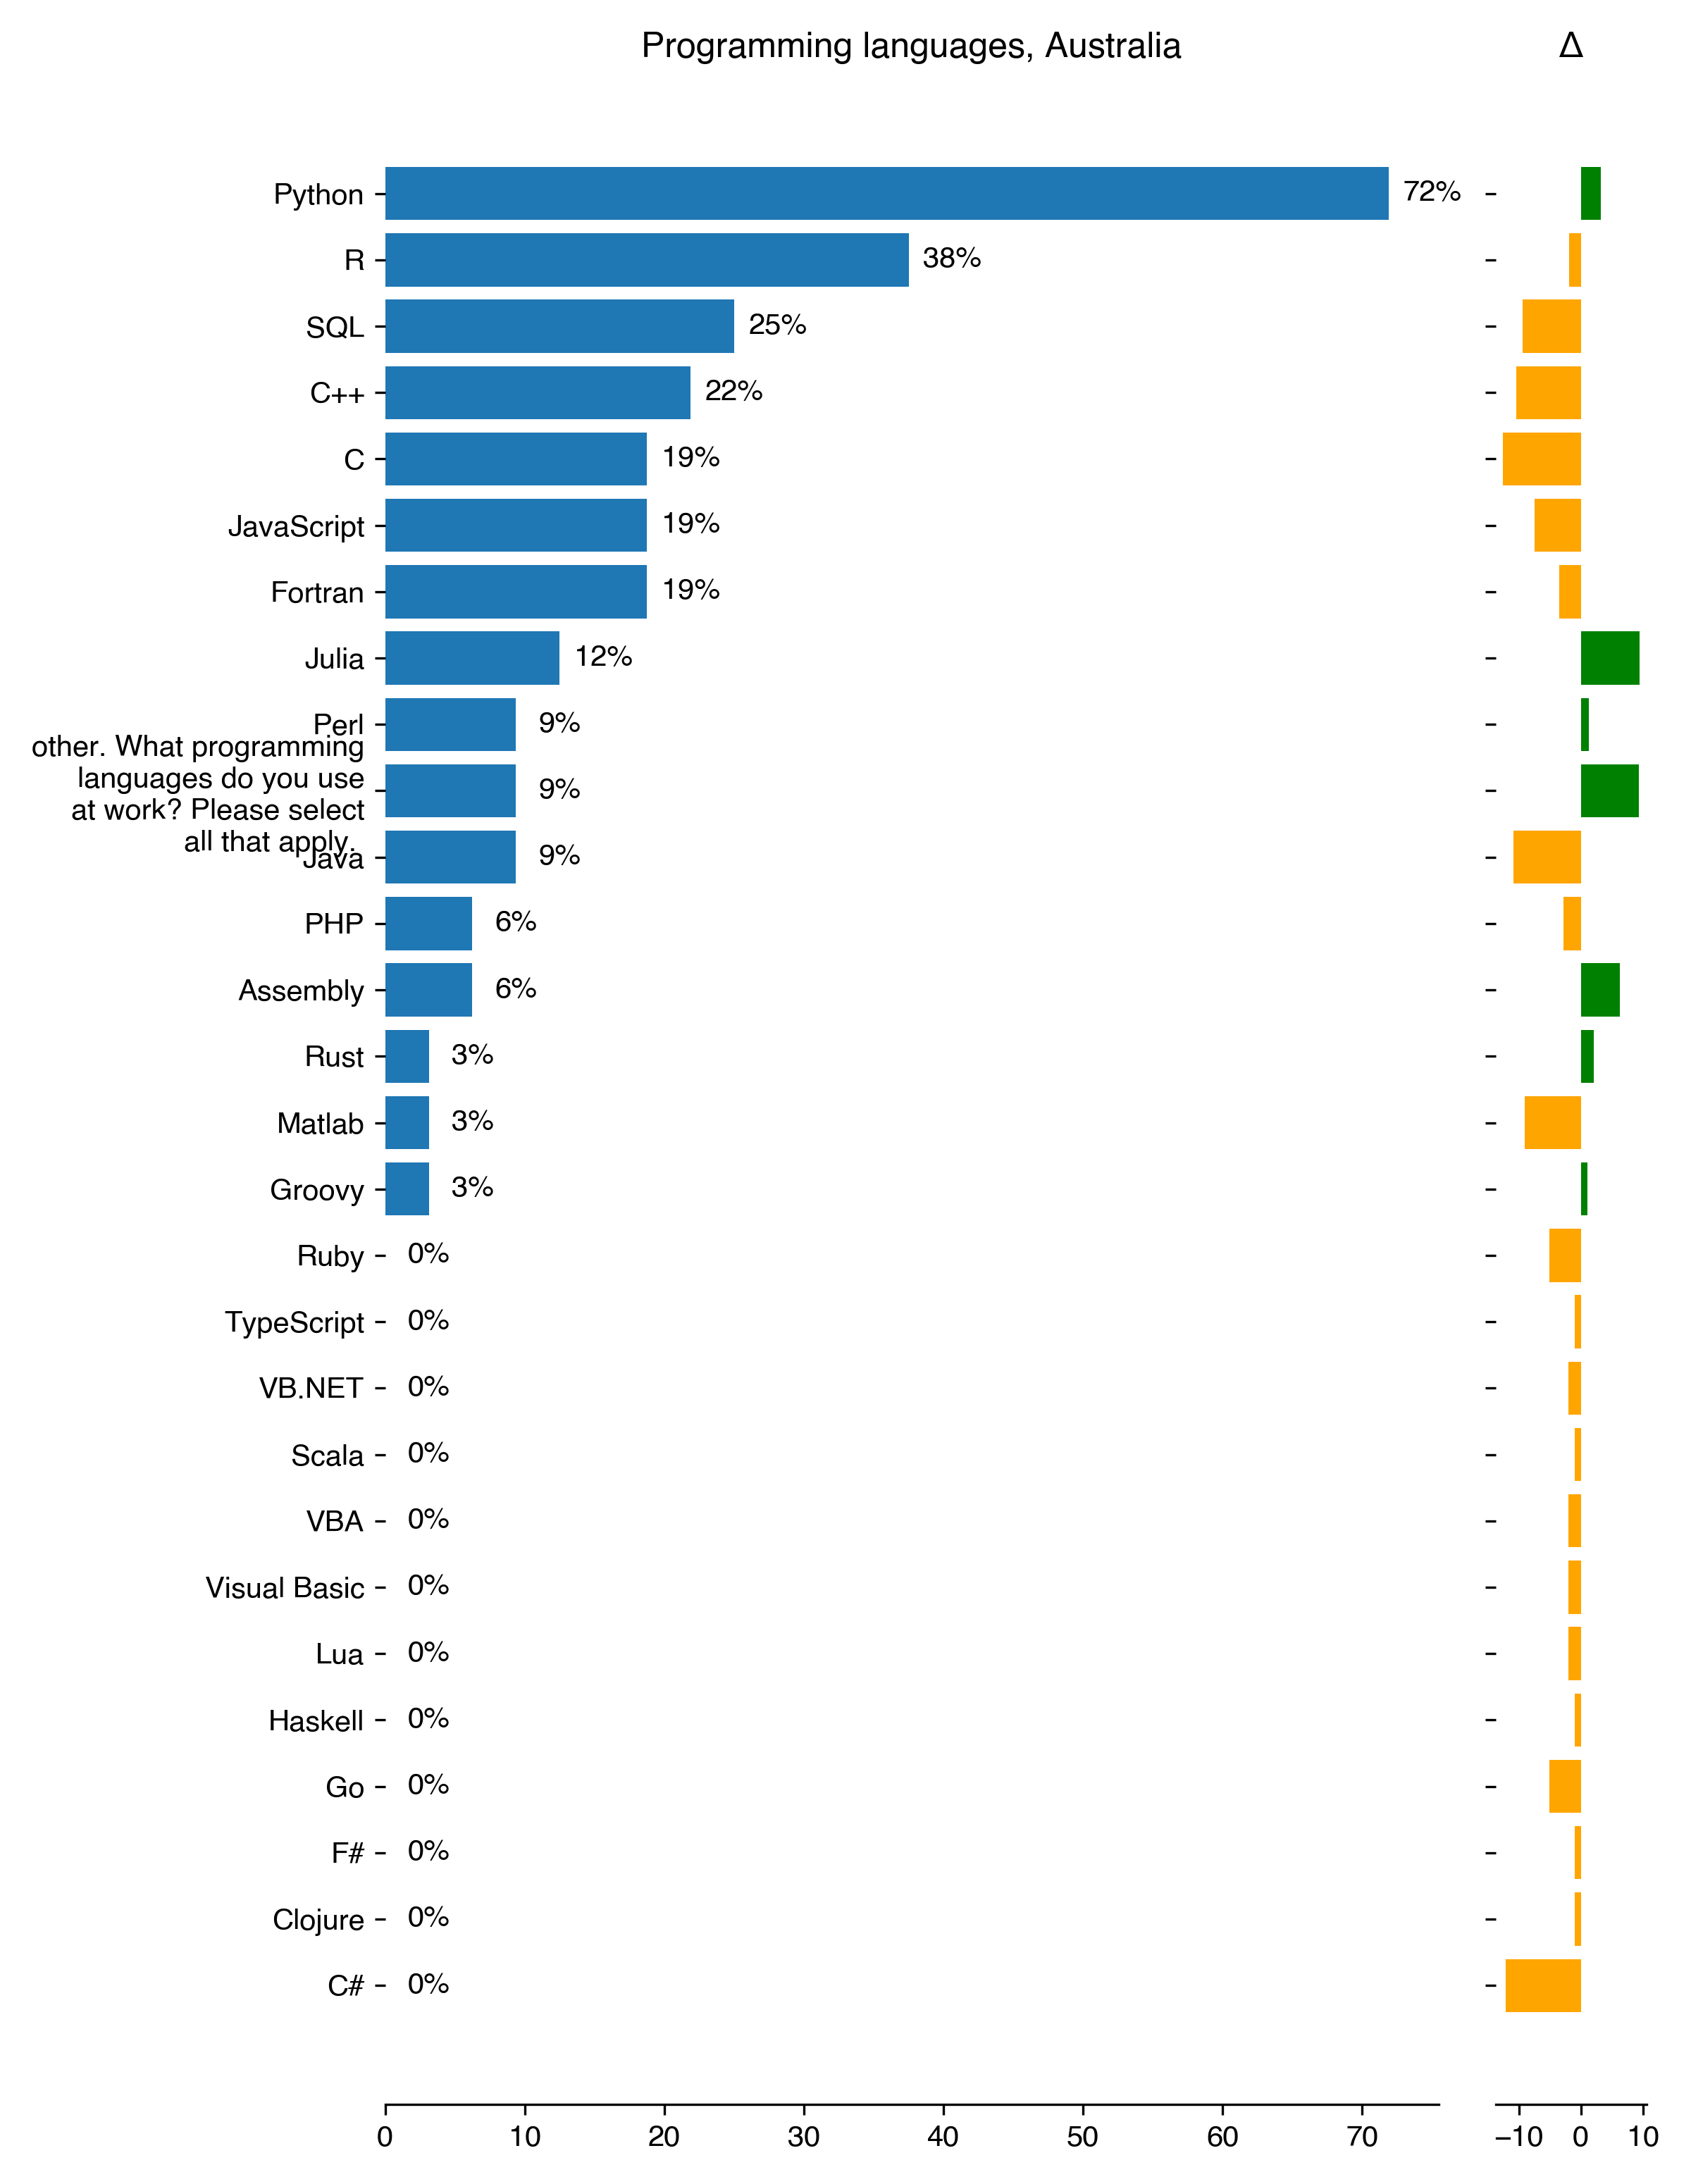
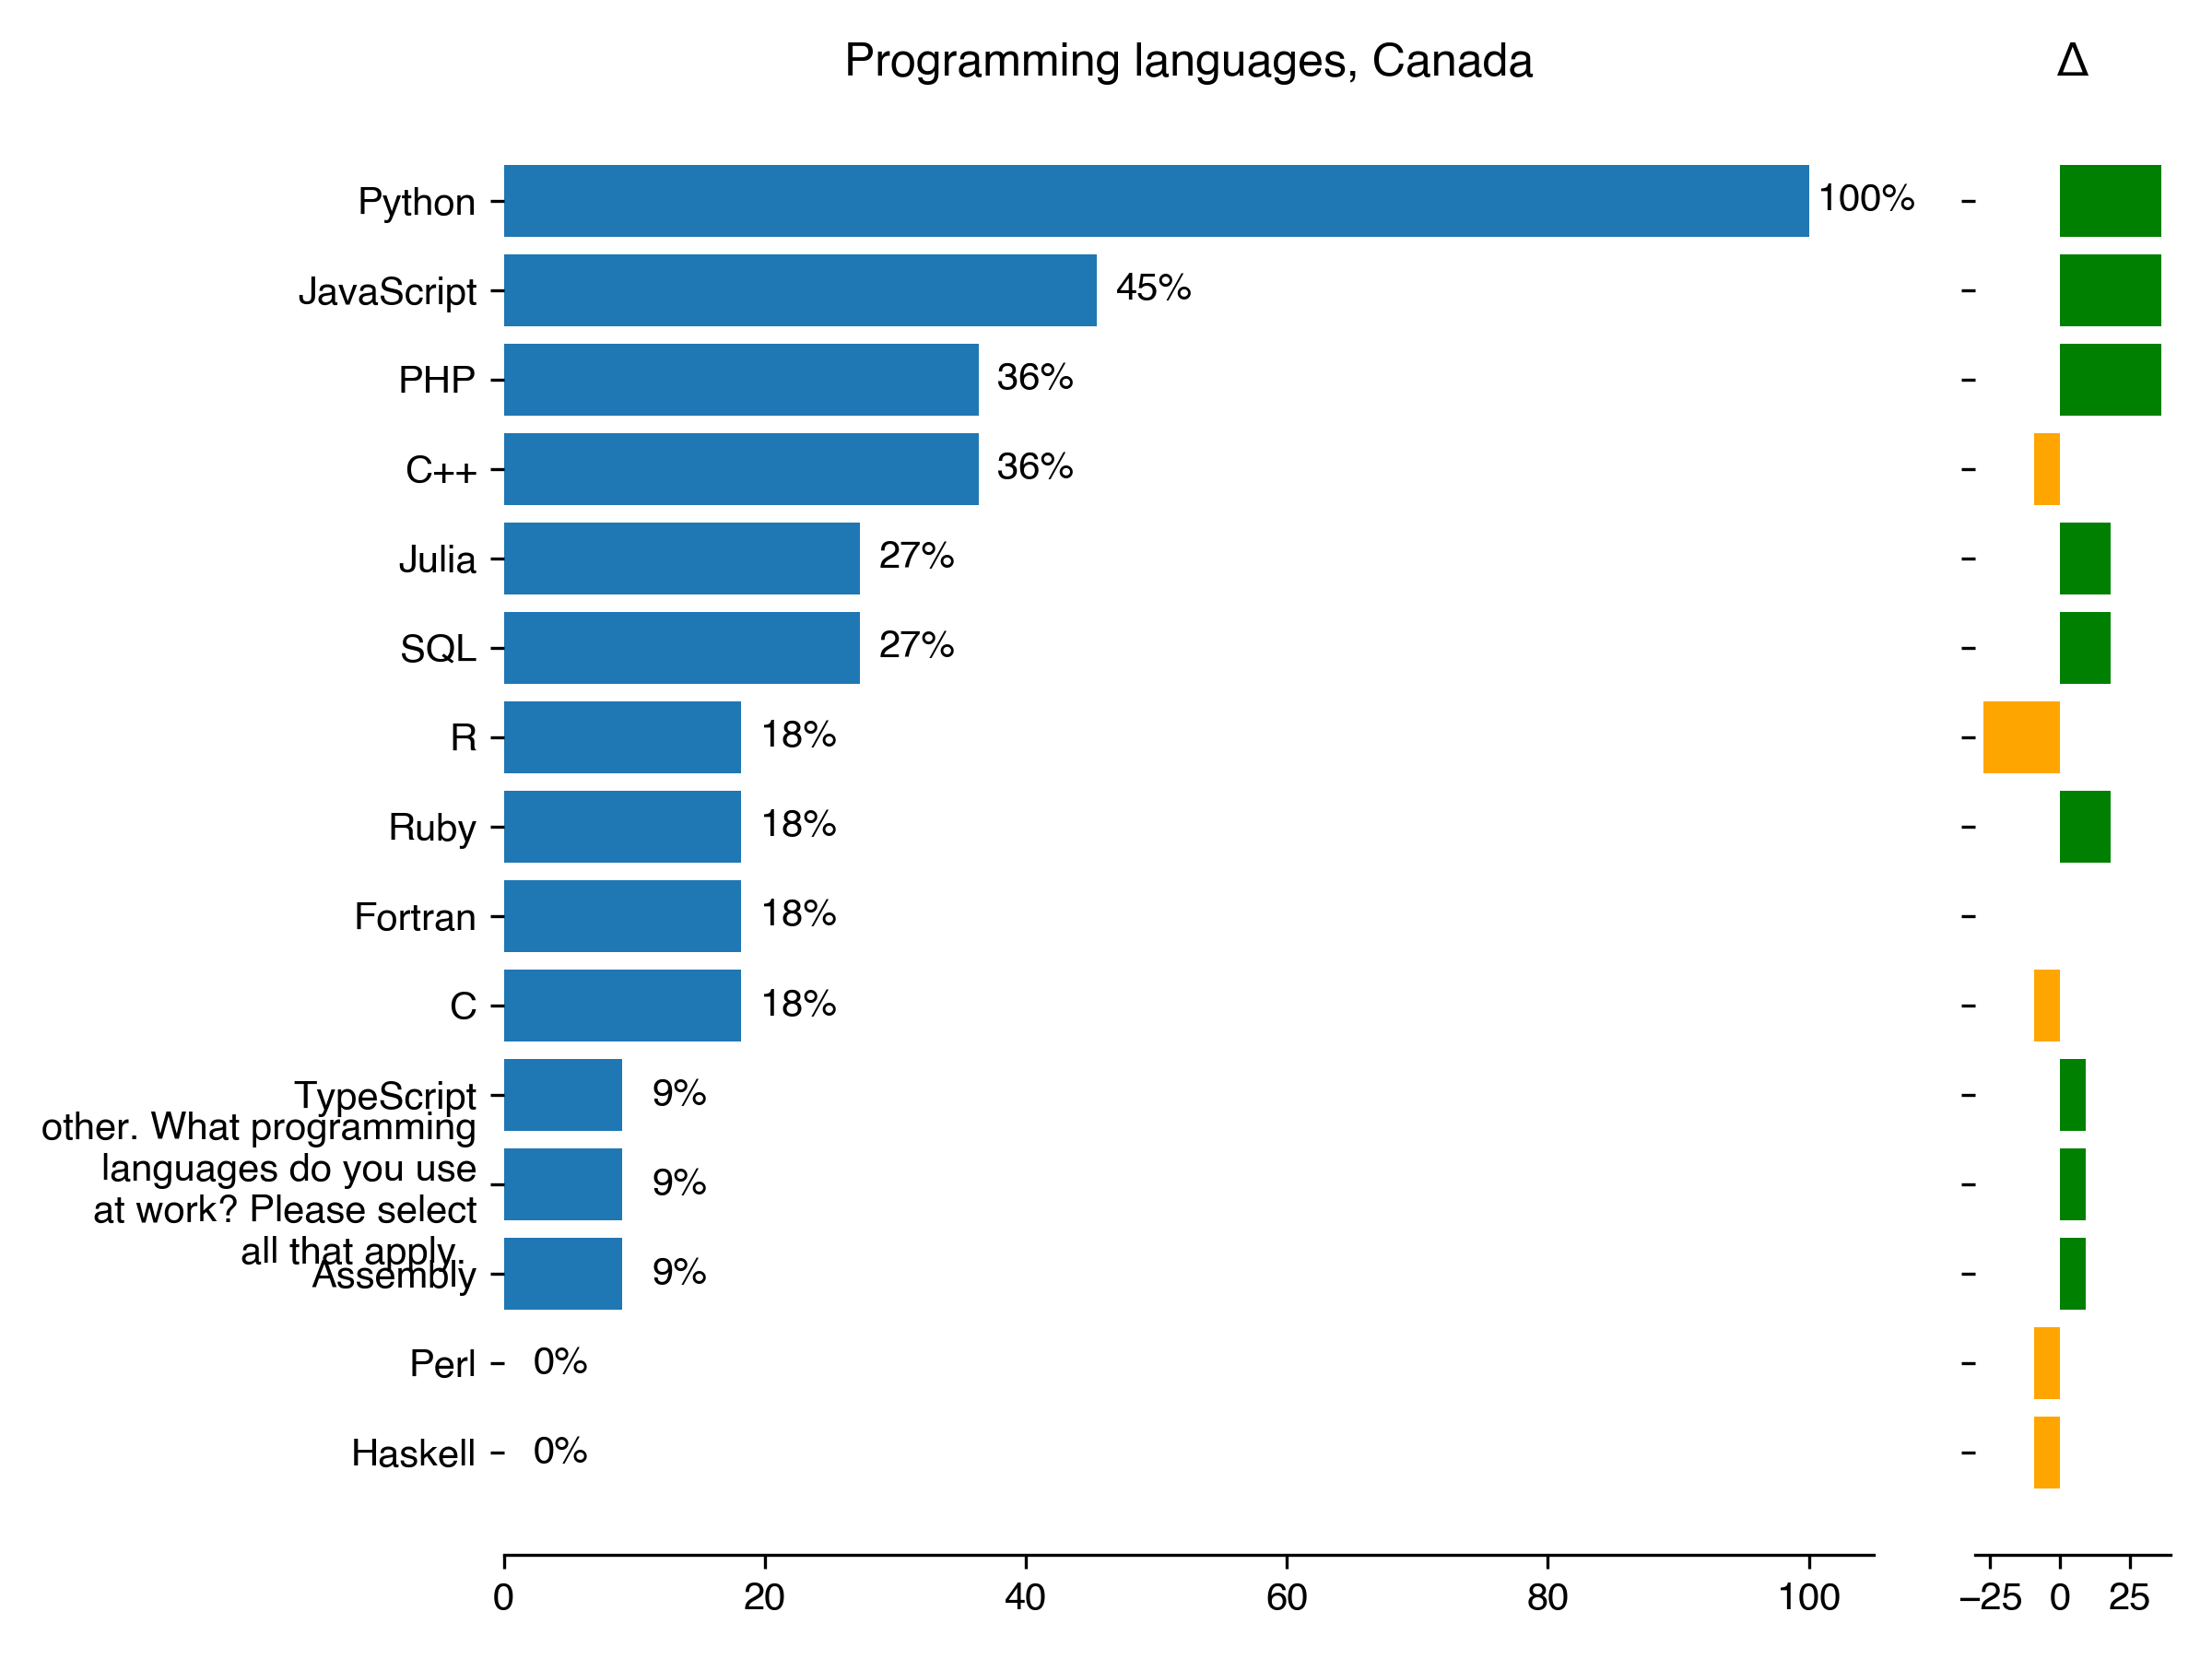
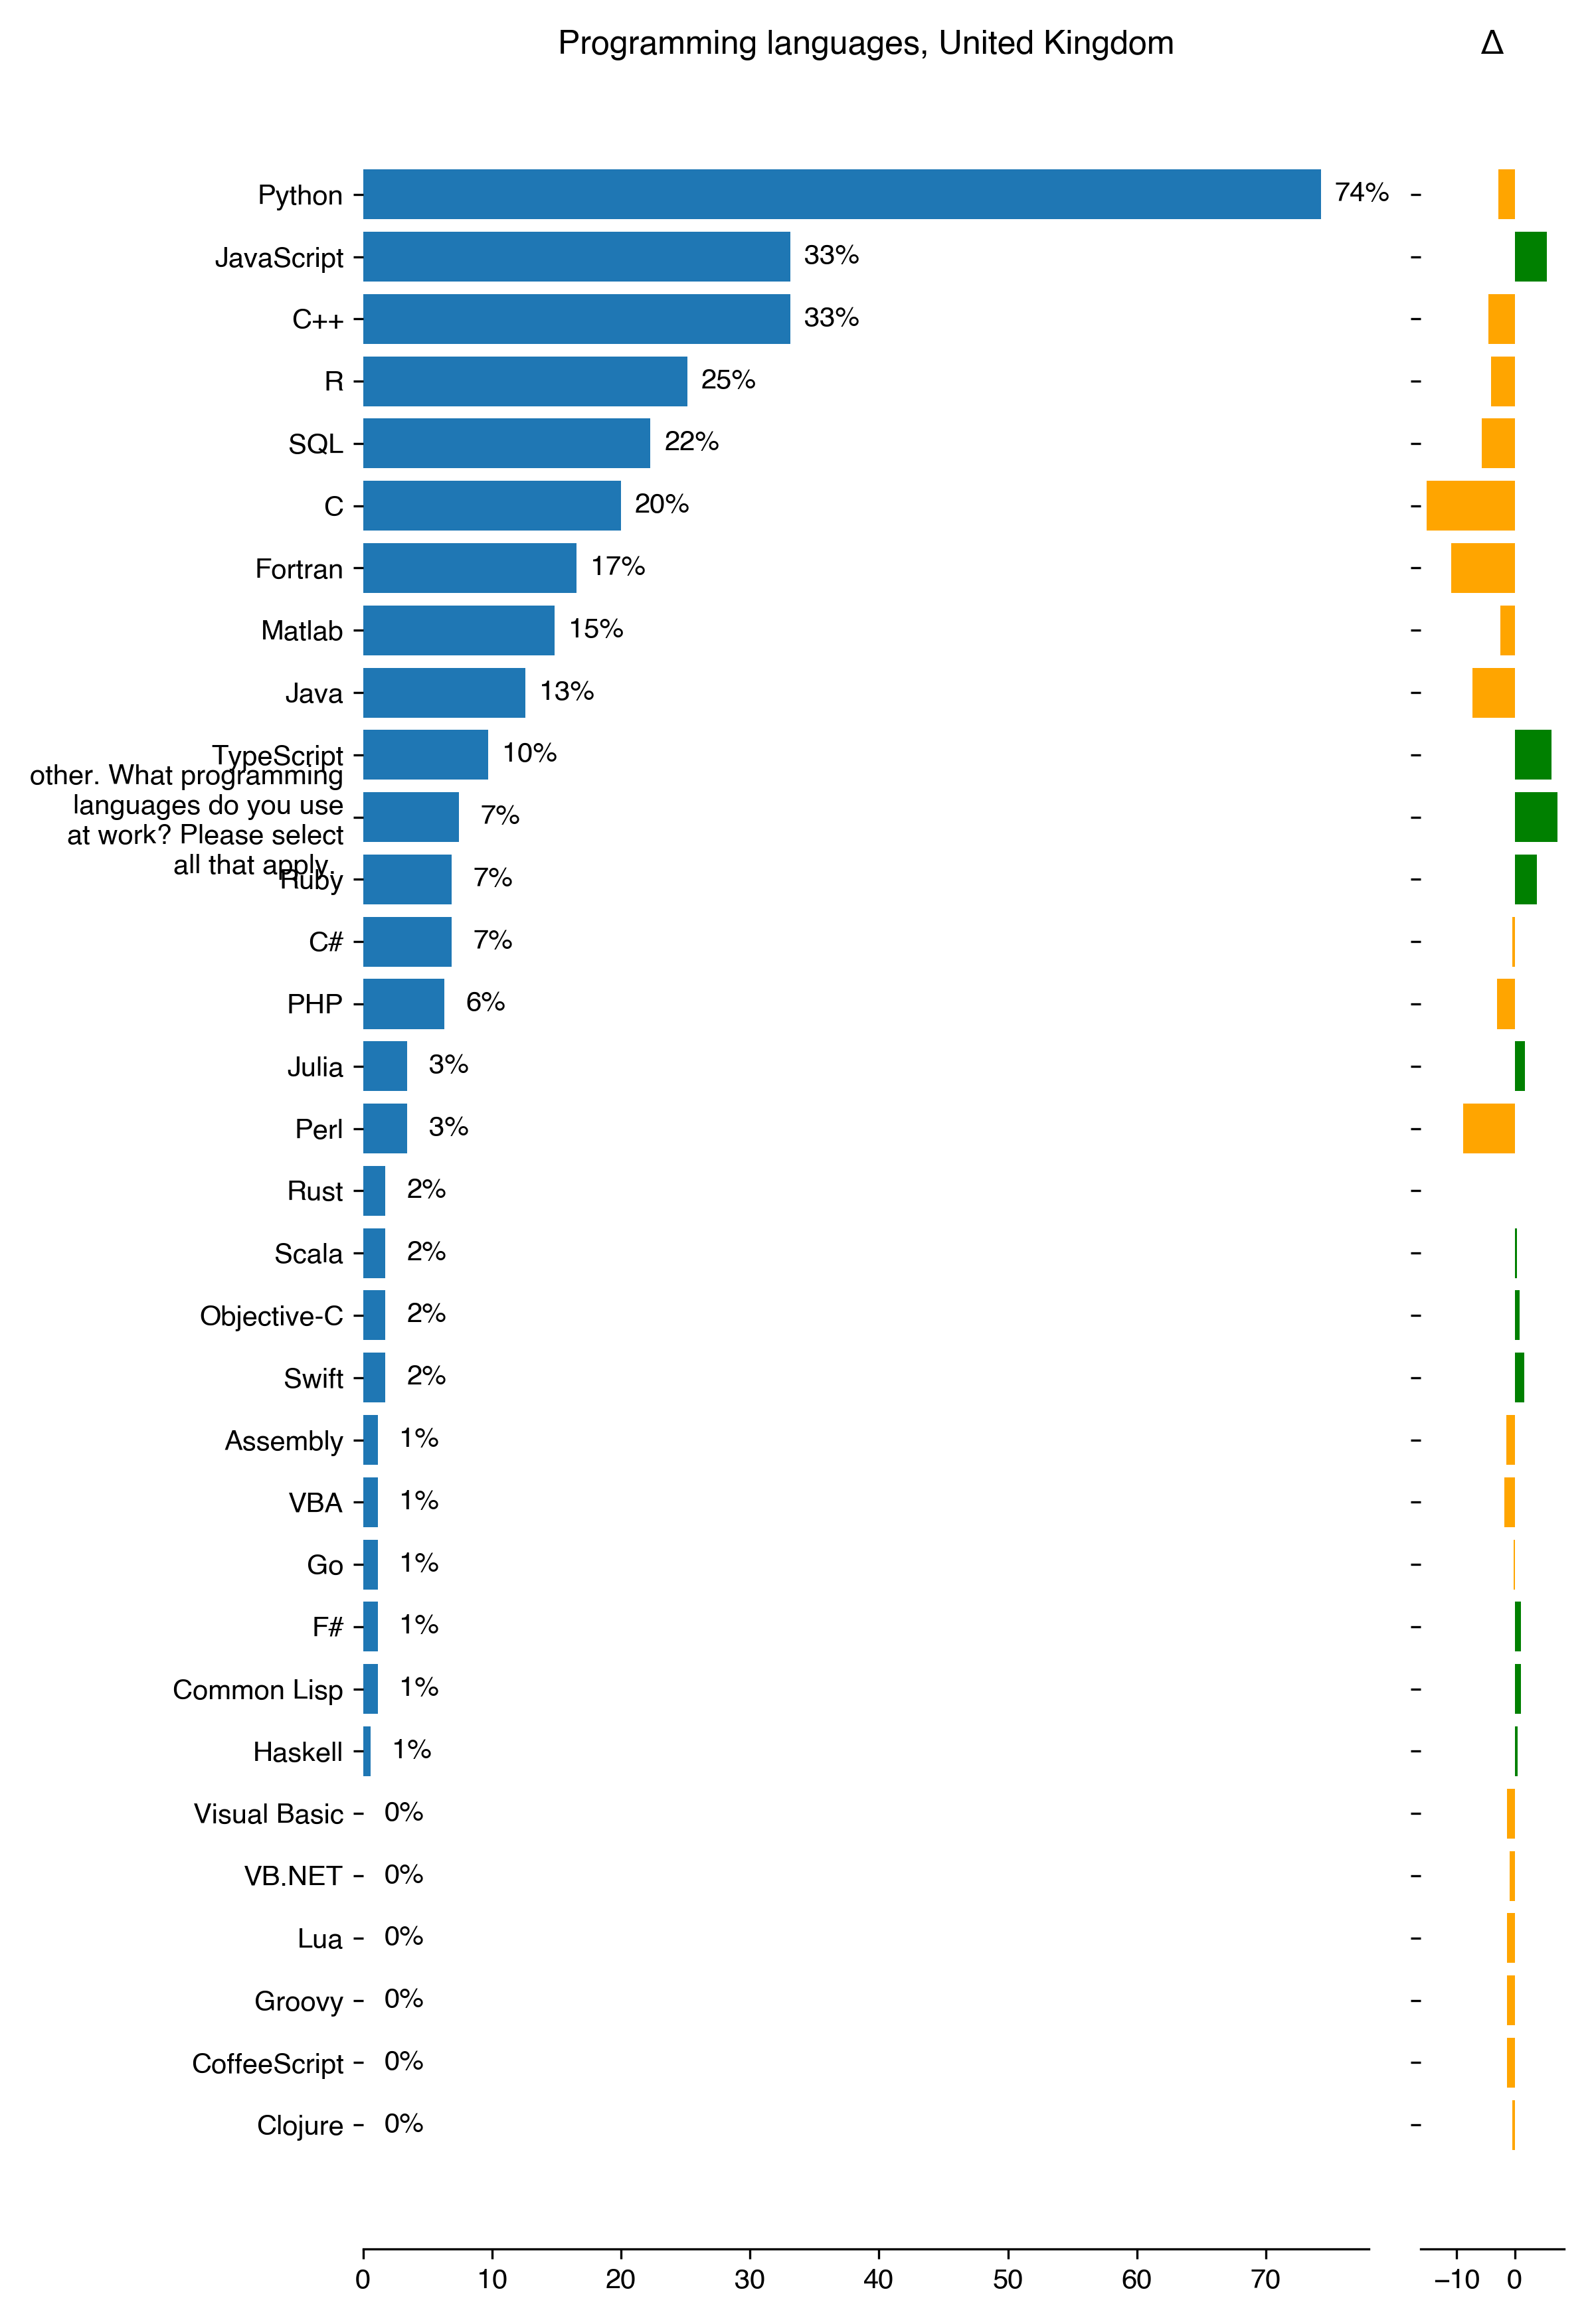
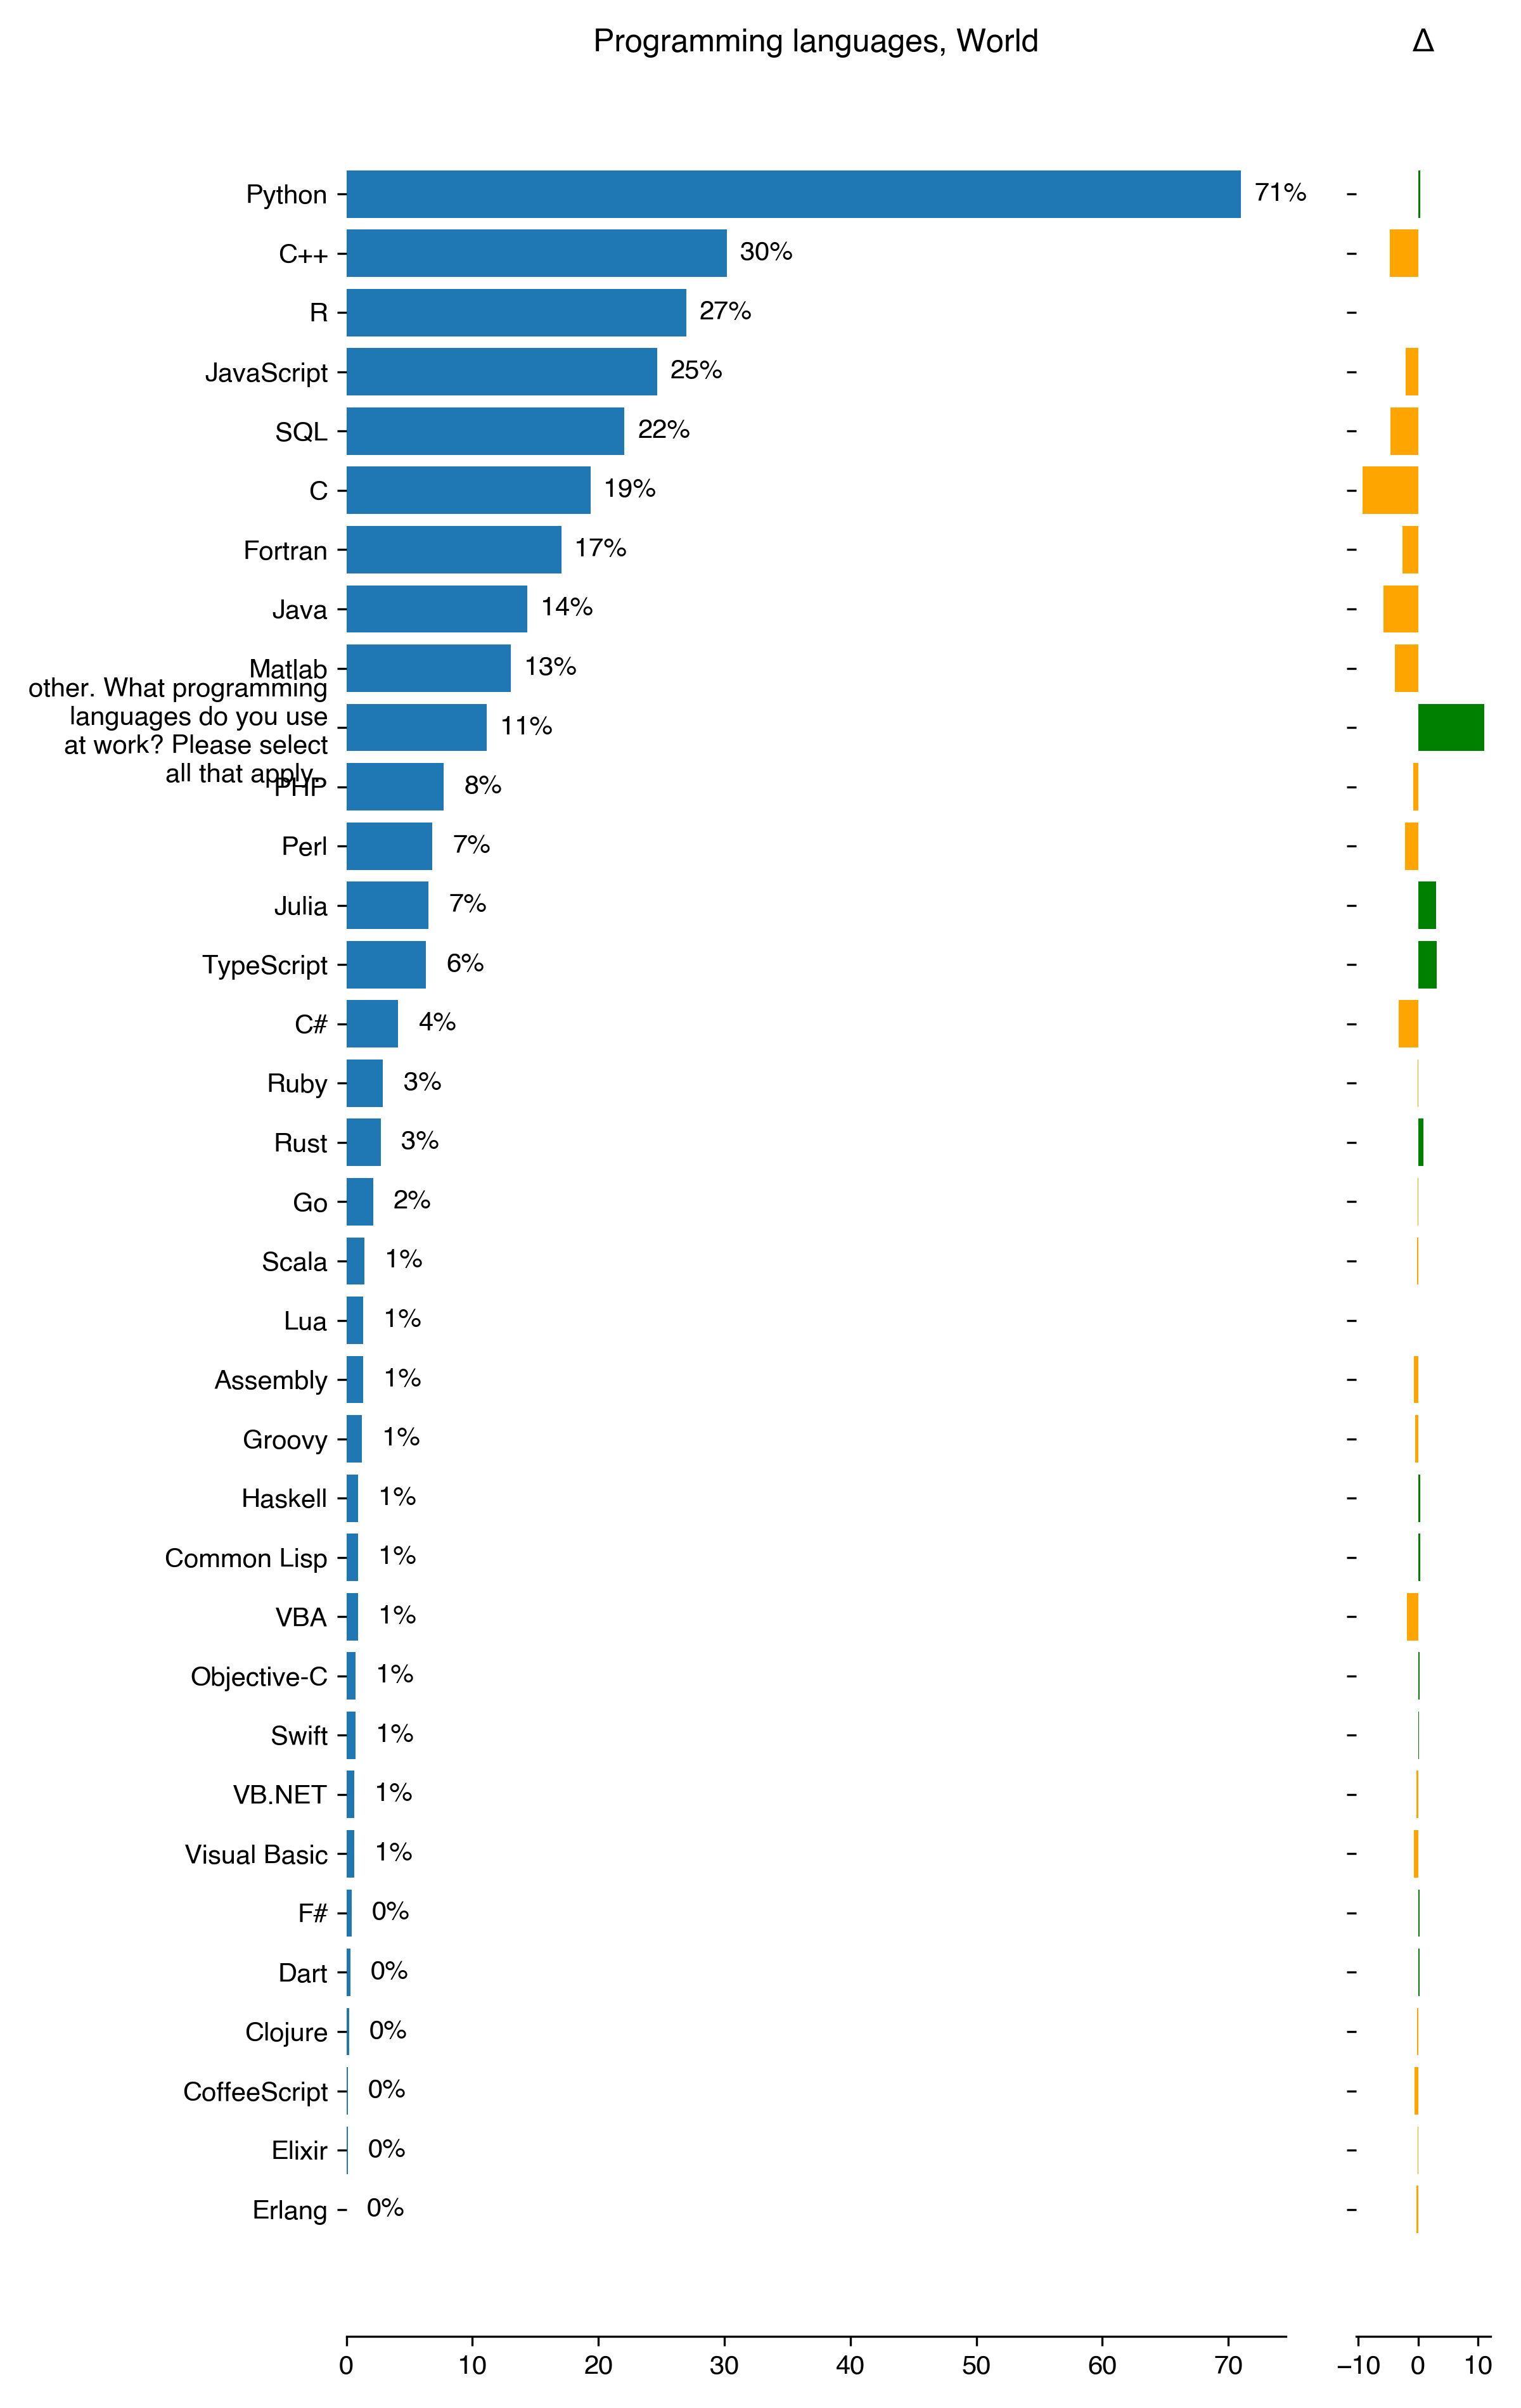
What programming languages do you use at work? Please select all that apply.
(multiple choice)
Programming languages for Australia
Count
Percentage
Percentage in 2018
Difference with previous year
Python
23
71.88
68.69
3.19
R
12
37.5
39.39
-1.89
SQL
8
25
34.34
-9.34
C++
7
21.88
32.32
-10.45
C
6
18.75
31.31
-12.56
JavaScript
6
18.75
26.26
-7.51
Fortran
6
18.75
22.22
-3.47
Julia
4
12.5
3.03
9.47
Perl
3
9.38
8.08
1.29
other. What programming languages do you use at work? Please select all that apply.
3
9.38
0
9.38
Java
3
9.38
20.2
-10.83
PHP
2
6.25
9.09
-2.84
Assembly
2
6.25
0
6.25
Rust
1
3.12
1.01
2.11
Matlab
1
3.12
12.12
-9
Groovy
1
3.12
2.02
1.1
Ruby
0
0
5.05
-5.05
TypeScript
0
0
1.01
-1.01
VB.NET
0
0
2.02
-2.02
Scala
0
0
1.01
-1.01
VBA
0
0
2.02
-2.02
Visual Basic
0
0
2.02
-2.02
Lua
0
0
2.02
-2.02
Haskell
0
0
1.01
-1.01
Go
0
0
5.05
-5.05
F#
0
0
1.01
-1.01
Clojure
0
0
1.01
-1.01
C#
0
0
12.12
-12.12
Download CSV
2022-08-22T11:27:28.485717
image/svg+xml
Matplotlib v3.5.2, https://matplotlib.org/
PNG SVG
Operating systems for Australia
Count
Percentage
Percentage in 2018
Difference with previous year
GNU/Linux
18
58.06
60
-1.94
macOS
7
22.58
nan
nan
Windows
5
16.13
17.65
-1.52
Other
1
3.23
2.35
0.87
Download CSV
2022-08-22T11:27:29.054358
image/svg+xml
Matplotlib v3.5.2, https://matplotlib.org/
PNG SVG
Programming languages for Canada
Count
Percentage
Percentage in 2018
Difference with previous year
Python
11
100
63.64
36.36
JavaScript
5
45.45
9.09
36.36
PHP
4
36.36
0
36.36
C++
4
36.36
45.45
-9.09
Julia
3
27.27
9.09
18.18
SQL
3
27.27
9.09
18.18
R
2
18.18
45.45
-27.27
Ruby
2
18.18
0
18.18
Fortran
2
18.18
18.18
0
C
2
18.18
27.27
-9.09
TypeScript
1
9.09
0
9.09
other. What programming languages do you use at work? Please select all that apply.
1
9.09
0
9.09
Assembly
1
9.09
0
9.09
Perl
0
0
9.09
-9.09
Haskell
0
0
9.09
-9.09
Download CSV
2022-08-22T11:27:29.911024
image/svg+xml
Matplotlib v3.5.2, https://matplotlib.org/
PNG SVG
Operating systems for Canada
Count
Percentage
Percentage in 2018
Difference with previous year
GNU/Linux
6
60
44.44
15.56
macOS
2
20
nan
nan
Windows
2
20
11.11
8.89
Download CSV
2022-08-22T11:27:30.418852
image/svg+xml
Matplotlib v3.5.2, https://matplotlib.org/
PNG SVG
Programming languages for Germany
Count
Percentage
Percentage in 2018
Difference with previous year
Python
176
68.22
63.36
4.85
C++
76
29.46
37.54
-8.08
R
65
25.19
20.72
4.47
JavaScript
53
20.54
22.82
-2.28
Java
50
19.38
22.22
-2.84
C
44
17.05
26.43
-9.37
SQL
43
16.67
19.82
-3.15
Matlab
41
15.89
21.92
-6.03
other. What programming languages do you use at work? Please select all that apply.
37
14.34
0
14.34
Fortran
35
13.57
17.42
-3.85
PHP
21
8.14
9.31
-1.17
Perl
21
8.14
4.8
3.33
Julia
16
6.2
4.2
2
TypeScript
15
5.81
4.2
1.61
C#
9
3.49
8.71
-5.22
Go
5
1.94
2.1
-0.16
Ruby
4
1.55
1.8
-0.25
Rust
4
1.55
2.4
-0.85
Groovy
4
1.55
1.5
0.05
Scala
3
1.16
1.5
-0.34
Assembly
2
0.78
2.4
-1.63
Haskell
2
0.78
0.9
-0.13
Lua
2
0.78
1.5
-0.73
Visual Basic
2
0.78
1.5
-0.73
F#
2
0.78
0
0.78
VBA
1
0.39
3.3
-2.92
Dart
1
0.39
0
0.39
CoffeeScript
1
0.39
0.3
0.09
Swift
1
0.39
0.6
-0.21
VB.NET
0
0
1.5
-1.5
Objective-C
0
0
0.3
-0.3
Common Lisp
0
0
0.9
-0.9
Download CSV
2022-08-22T11:27:31.930702
image/svg+xml
Matplotlib v3.5.2, https://matplotlib.org/
PNG SVG
Operating systems for Germany
Count
Percentage
Percentage in 2018
Difference with previous year
GNU/Linux
125
60.1
58.36
1.73
Windows
47
22.6
29.89
-7.3
macOS
32
15.38
nan
nan
Other
4
1.92
1.78
0.14
Download CSV
2022-08-22T11:27:32.527627
image/svg+xml
Matplotlib v3.5.2, https://matplotlib.org/
PNG SVG
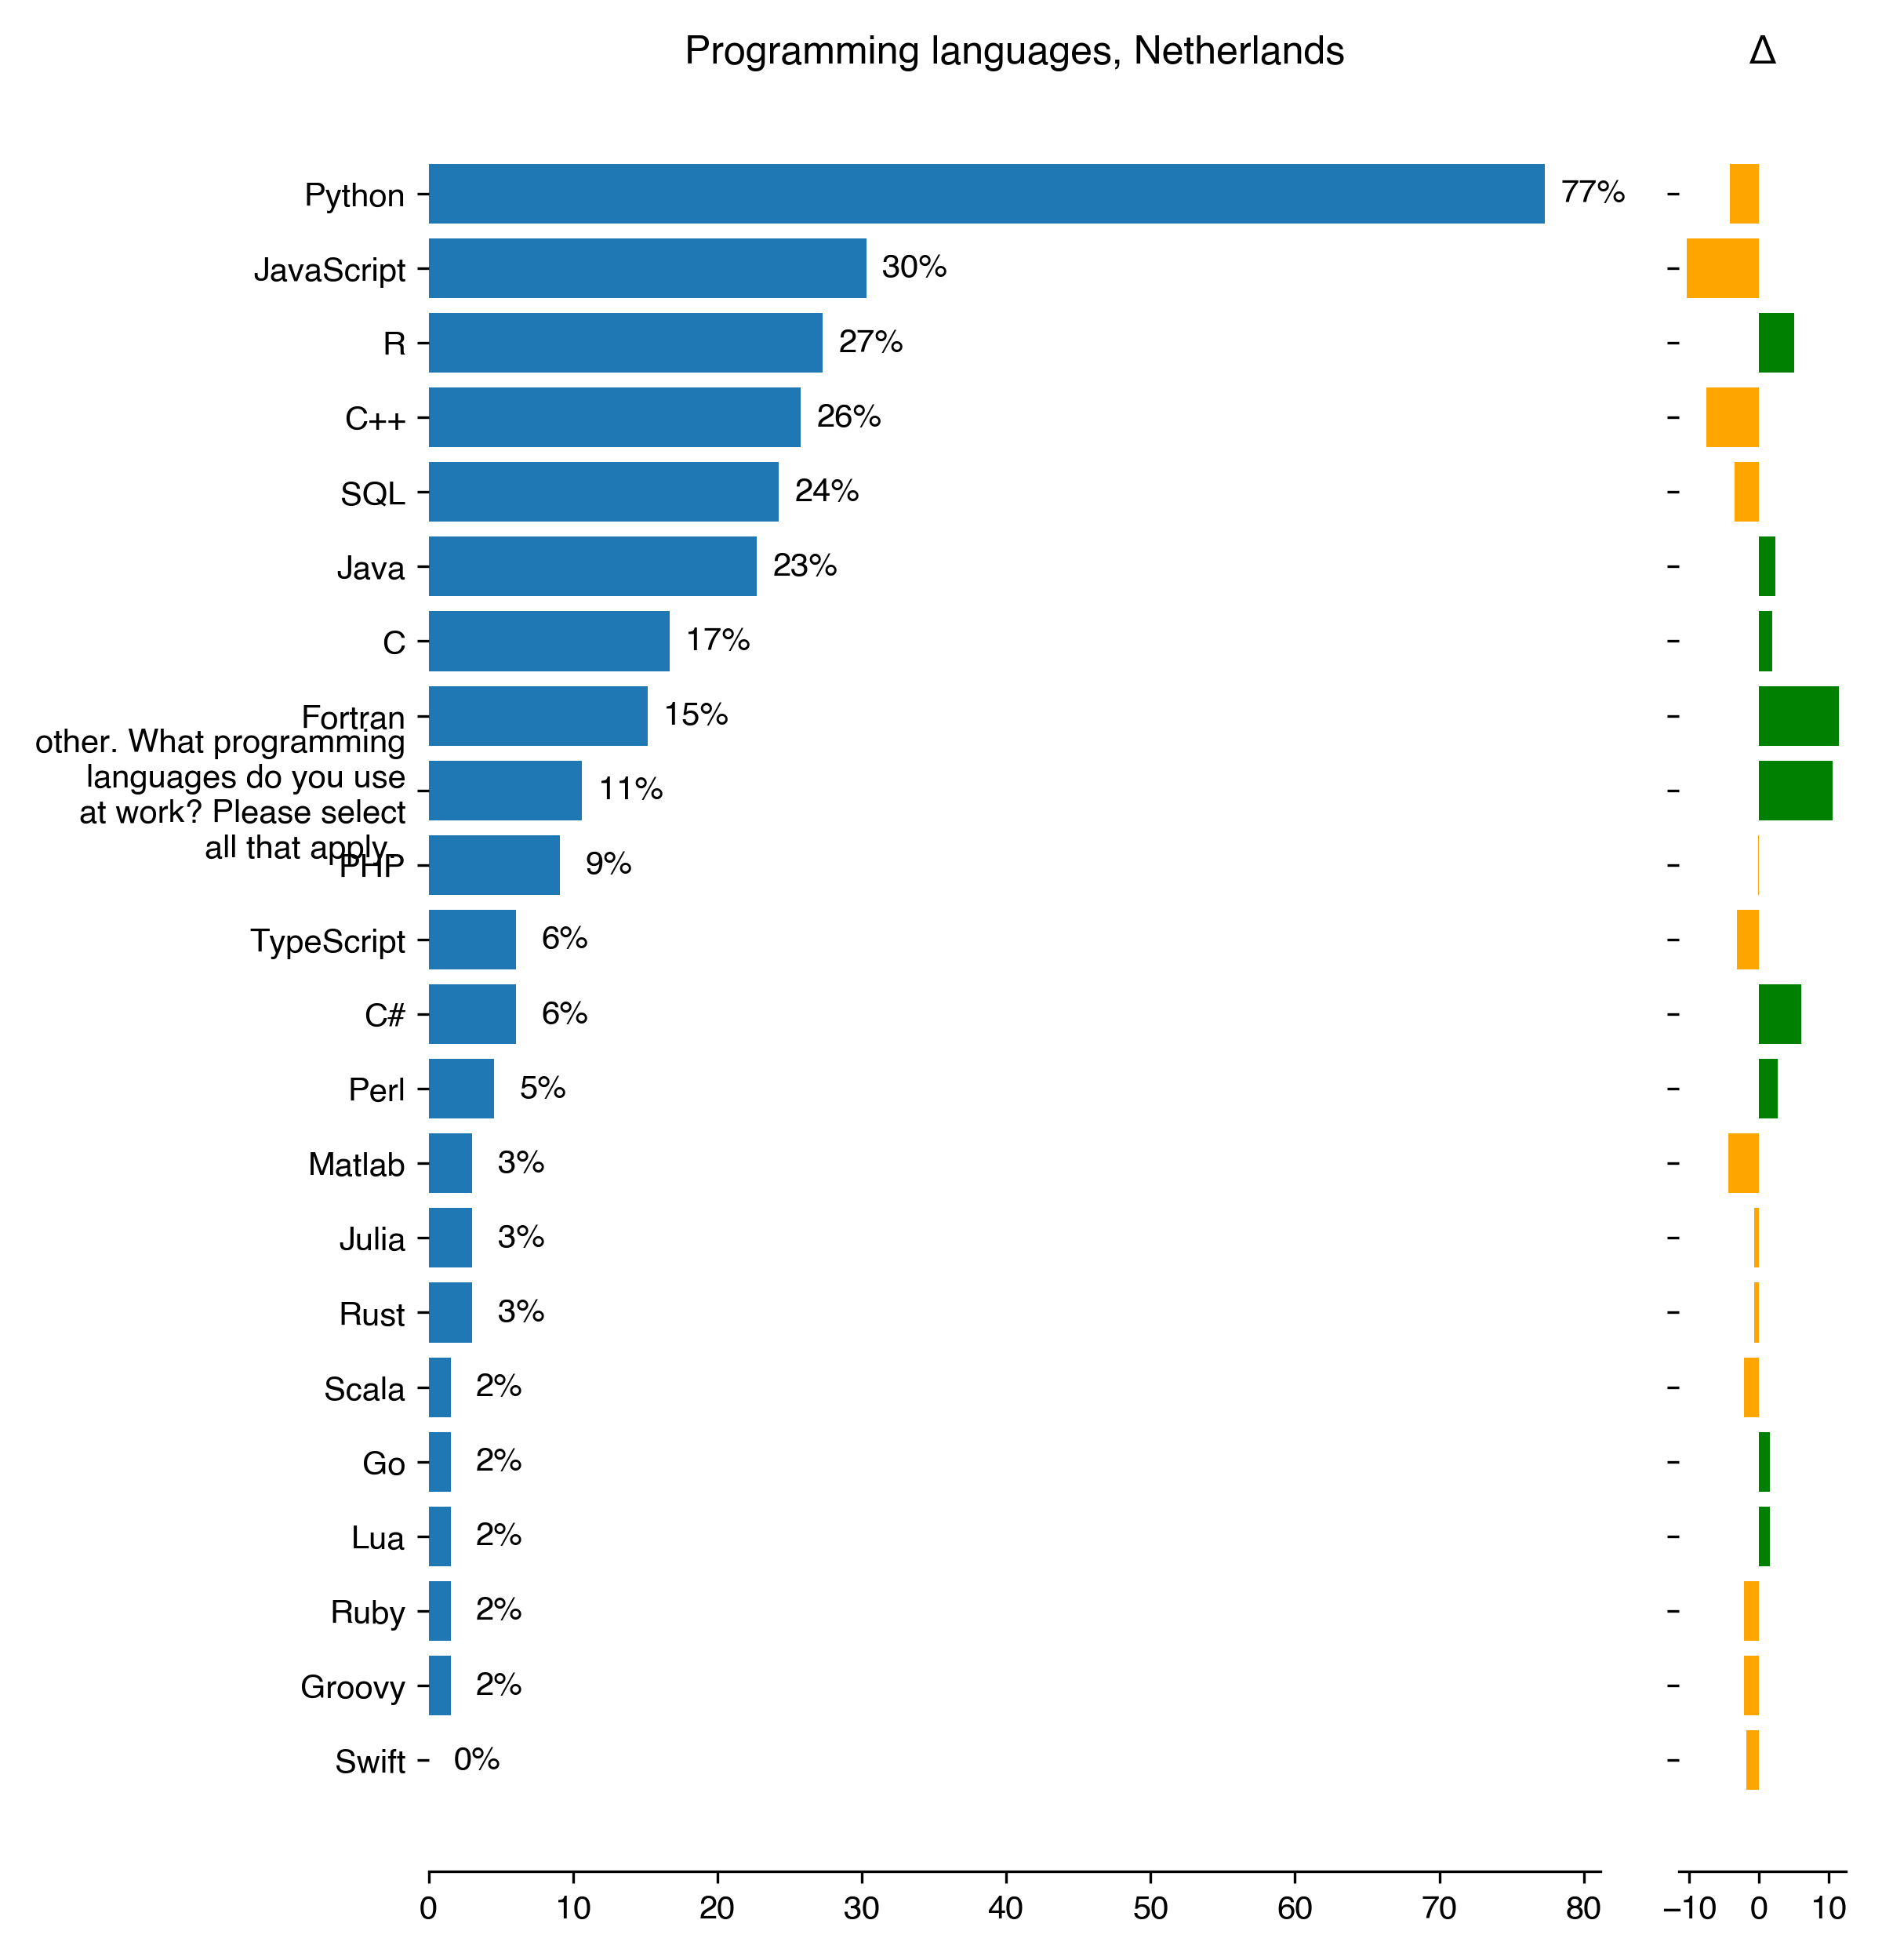
Programming languages for Netherlands
Count
Percentage
Percentage in 2018
Difference with previous year
Python
51
77.27
81.48
-4.21
JavaScript
20
30.3
40.74
-10.44
R
18
27.27
22.22
5.05
C++
17
25.76
33.33
-7.58
SQL
16
24.24
27.78
-3.54
Java
15
22.73
20.37
2.36
C
11
16.67
14.81
1.85
Fortran
10
15.15
3.7
11.45
other. What programming languages do you use at work? Please select all that apply.
7
10.61
0
10.61
PHP
6
9.09
9.26
-0.17
TypeScript
4
6.06
9.26
-3.2
C#
4
6.06
0
6.06
Perl
3
4.55
1.85
2.69
Matlab
2
3.03
7.41
-4.38
Julia
2
3.03
3.7
-0.67
Rust
2
3.03
3.7
-0.67
Scala
1
1.52
3.7
-2.19
Go
1
1.52
0
1.52
Lua
1
1.52
0
1.52
Ruby
1
1.52
3.7
-2.19
Groovy
1
1.52
3.7
-2.19
Swift
0
0
1.85
-1.85
Download CSV
2022-08-22T11:27:33.577016
image/svg+xml
Matplotlib v3.5.2, https://matplotlib.org/
PNG SVG
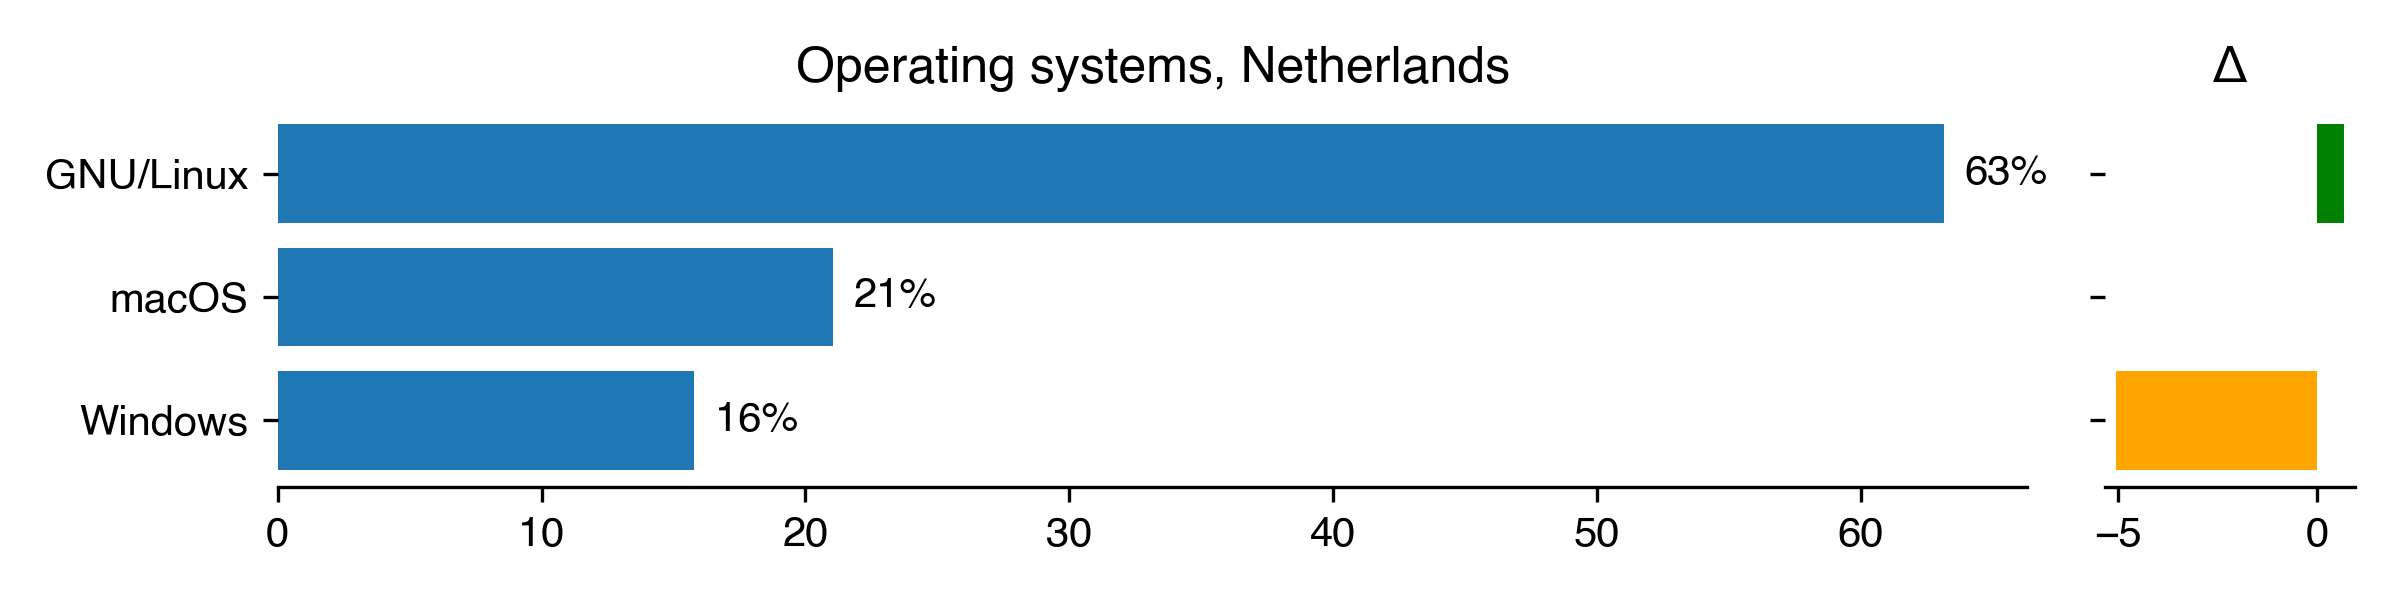
Operating systems for Netherlands
Count
Percentage
Percentage in 2018
Difference with previous year
GNU/Linux
36
63.16
62.5
0.66
macOS
12
21.05
nan
nan
Windows
9
15.79
20.83
-5.04
Download CSV
2022-08-22T11:27:34.086226
image/svg+xml
Matplotlib v3.5.2, https://matplotlib.org/
PNG SVG
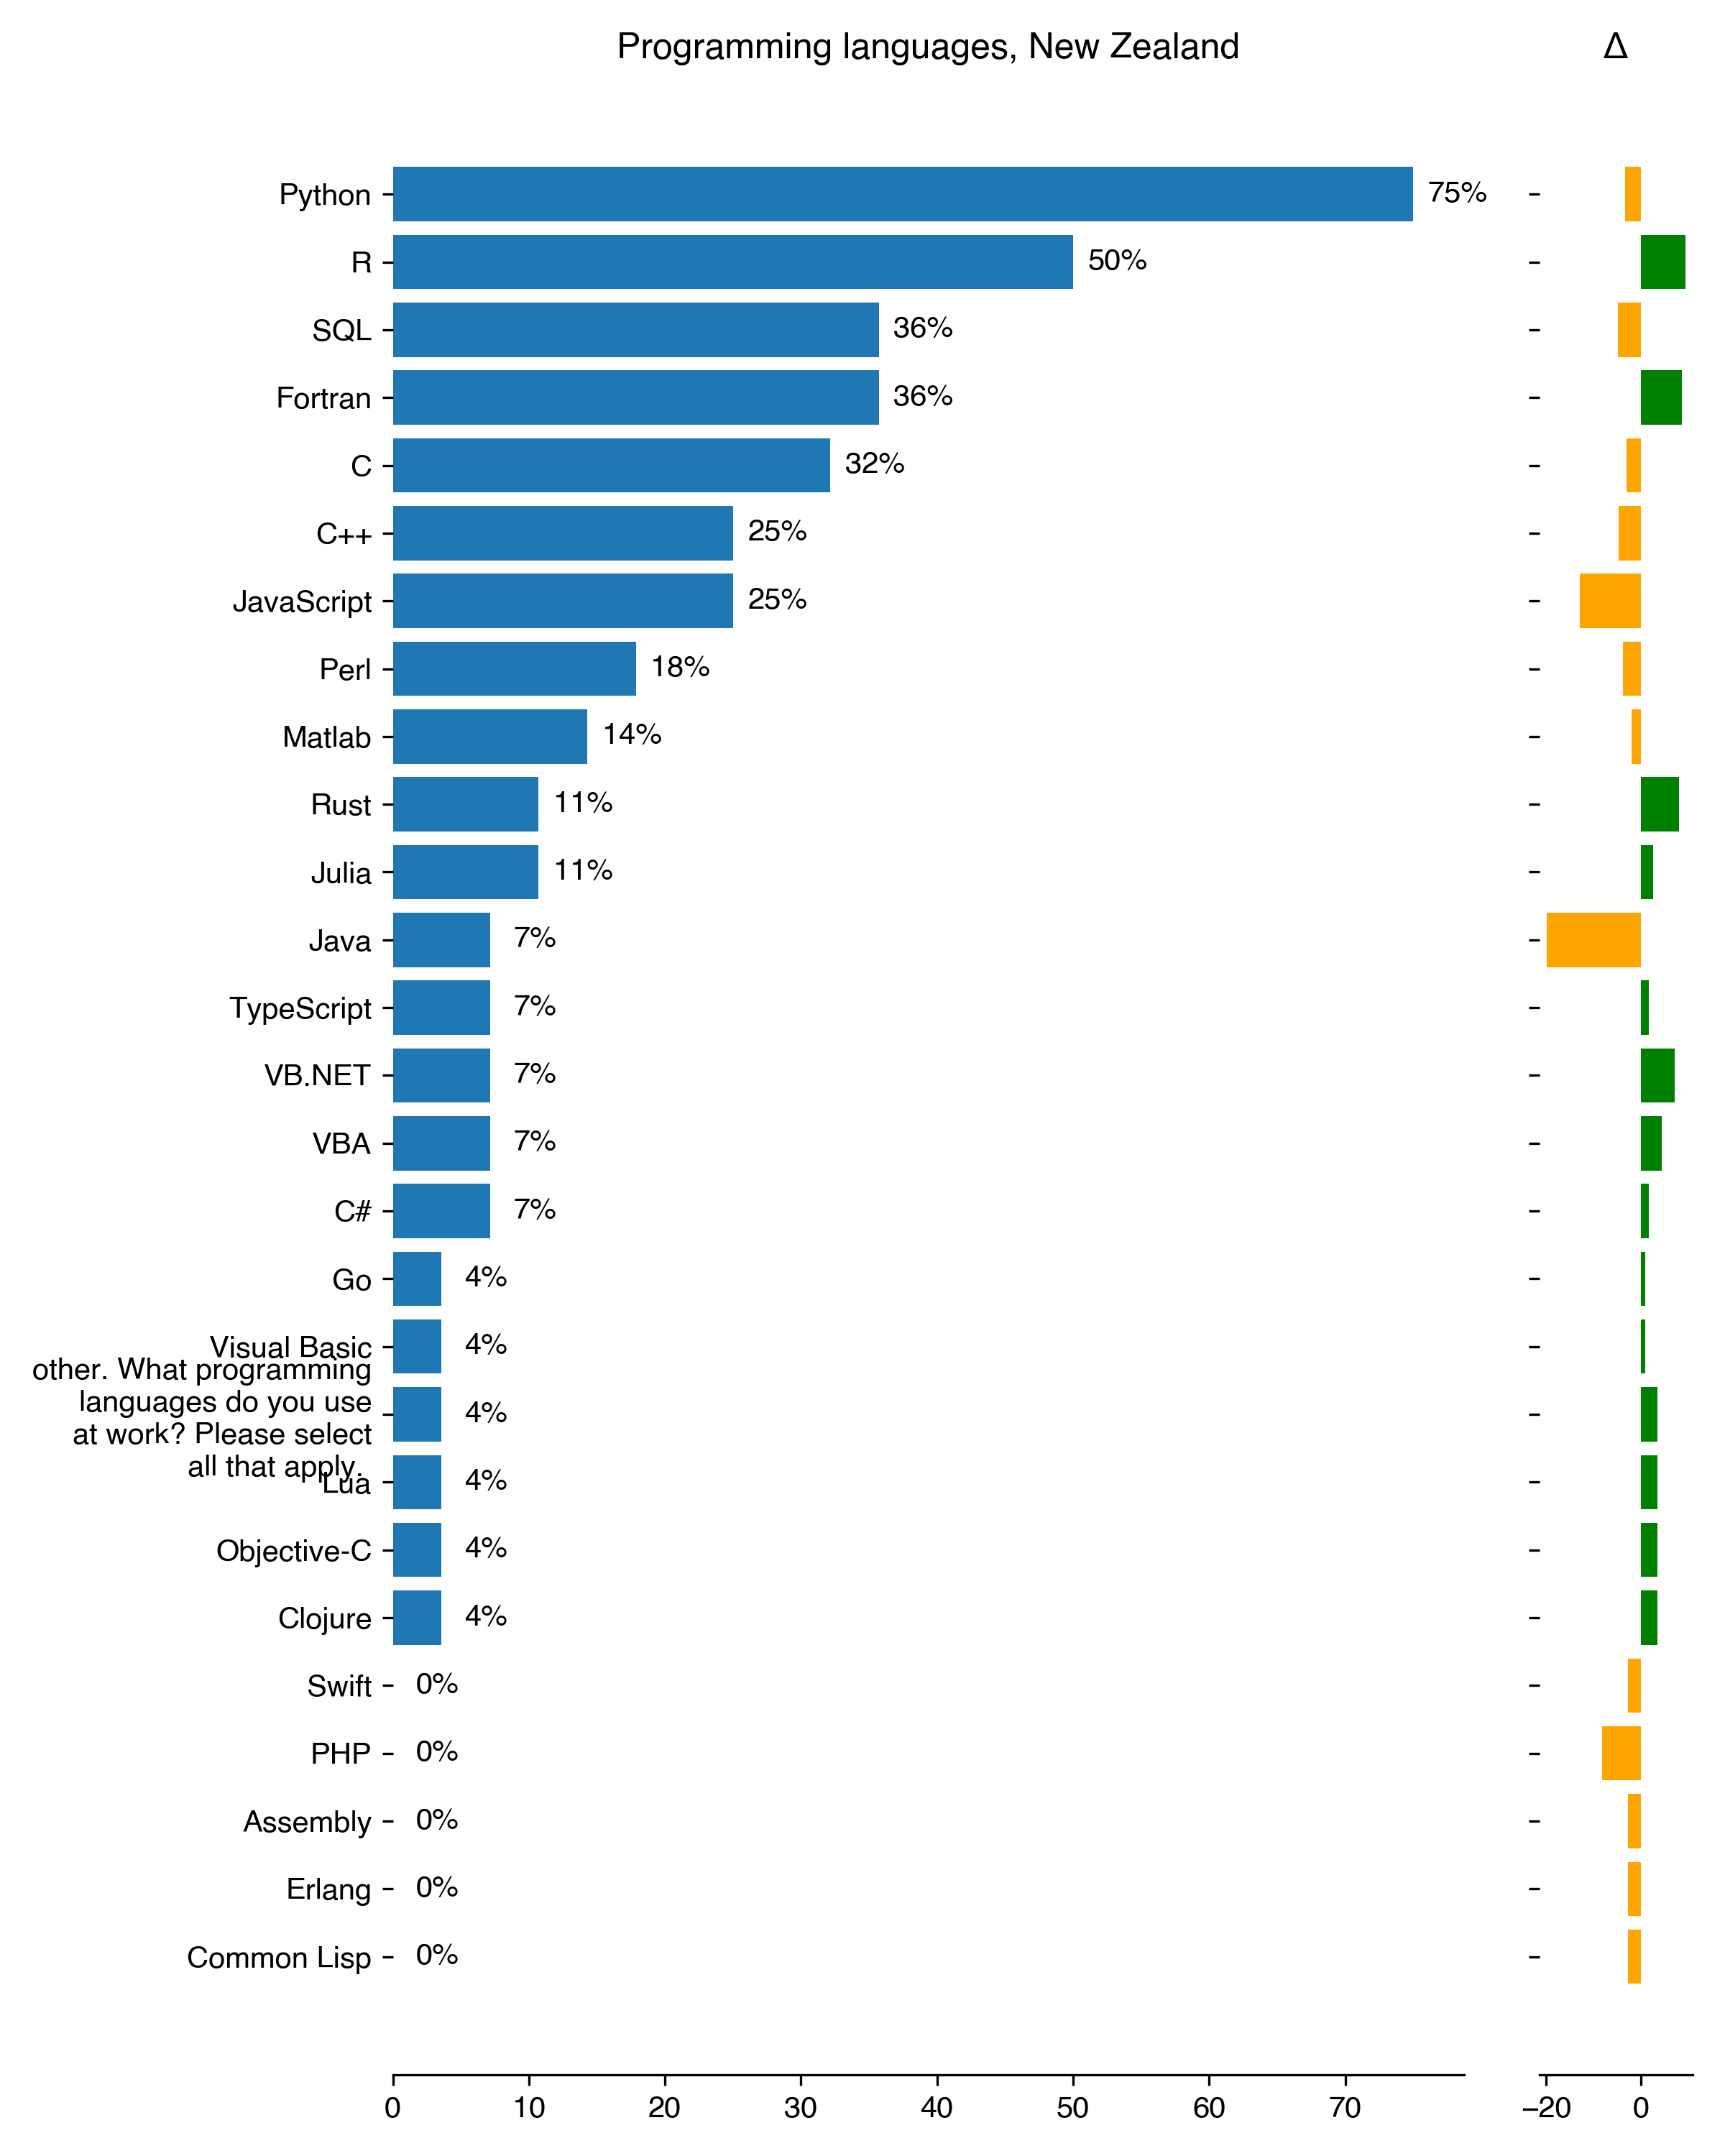
Programming languages for New Zealand
Count
Percentage
Percentage in 2018
Difference with previous year
Python
21
75
78.38
-3.38
R
14
50
40.54
9.46
SQL
10
35.71
40.54
-4.83
Fortran
10
35.71
27.03
8.69
C
9
32.14
35.14
-2.99
C++
7
25
29.73
-4.73
JavaScript
7
25
37.84
-12.84
Perl
5
17.86
21.62
-3.76
Matlab
4
14.29
16.22
-1.93
Rust
3
10.71
2.7
8.01
Julia
3
10.71
8.11
2.61
Java
2
7.14
27.03
-19.88
TypeScript
2
7.14
5.41
1.74
VB.NET
2
7.14
0
7.14
VBA
2
7.14
2.7
4.44
C#
2
7.14
5.41
1.74
Go
1
3.57
2.7
0.87
Visual Basic
1
3.57
2.7
0.87
other. What programming languages do you use at work? Please select all that apply.
1
3.57
0
3.57
Lua
1
3.57
0
3.57
Objective-C
1
3.57
0
3.57
Clojure
1
3.57
0
3.57
Swift
0
0
2.7
-2.7
PHP
0
0
8.11
-8.11
Assembly
0
0
2.7
-2.7
Erlang
0
0
2.7
-2.7
Common Lisp
0
0
2.7
-2.7
Download CSV
2022-08-22T11:27:35.261270
image/svg+xml
Matplotlib v3.5.2, https://matplotlib.org/
PNG SVG
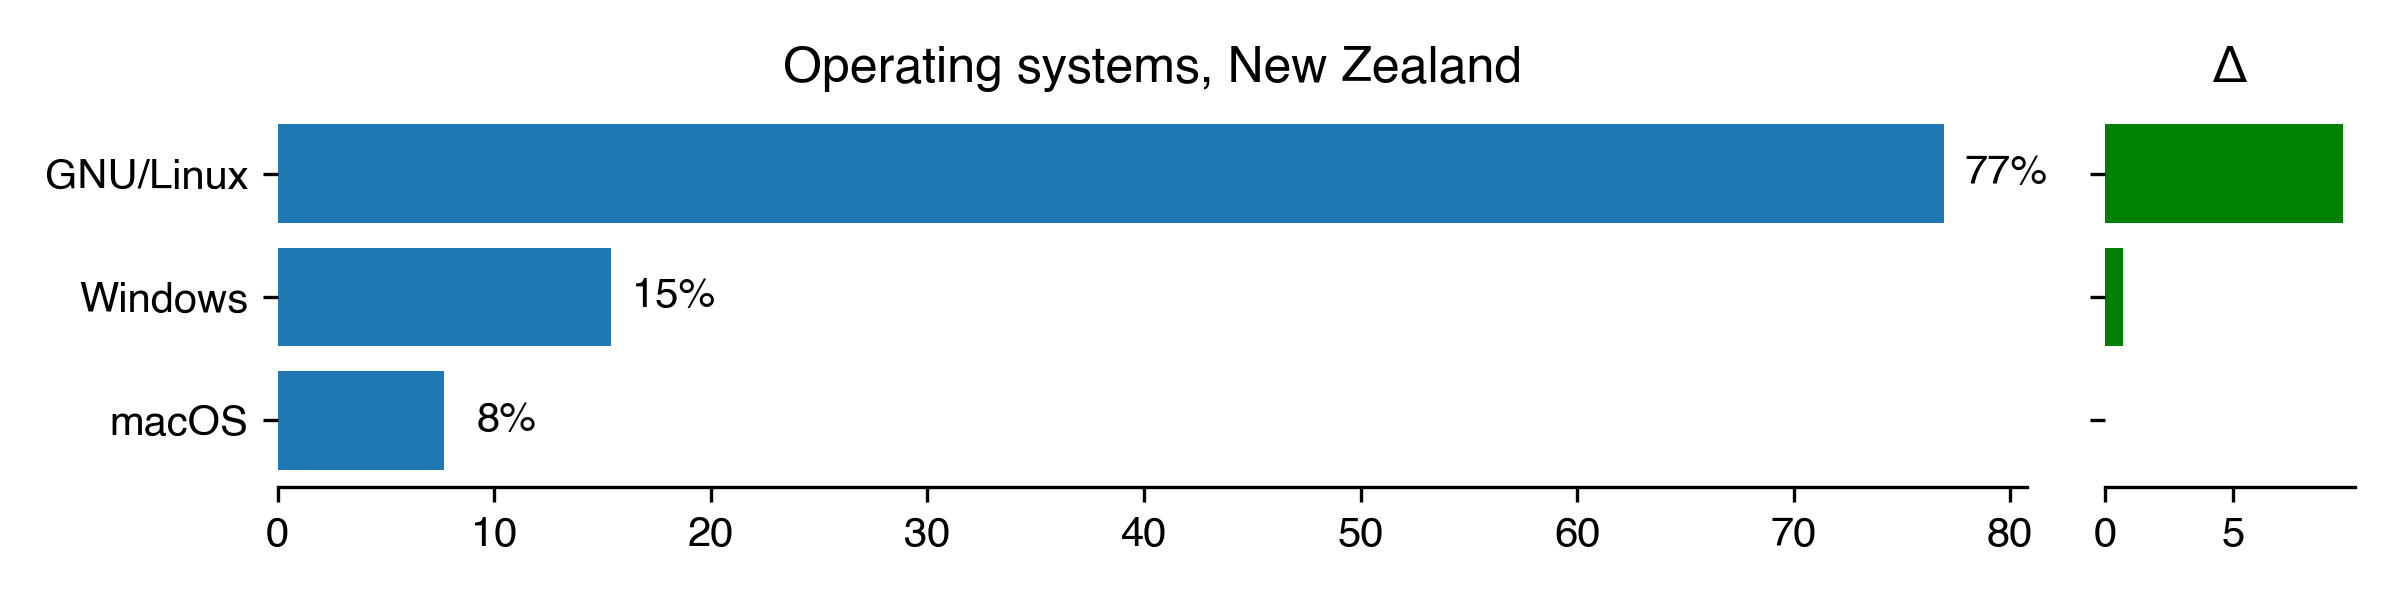
Operating systems for New Zealand
Count
Percentage
Percentage in 2018
Difference with previous year
GNU/Linux
20
76.92
67.65
9.28
Windows
4
15.38
14.71
0.68
macOS
2
7.69
nan
nan
Download CSV
2022-08-22T11:27:35.803061
image/svg+xml
Matplotlib v3.5.2, https://matplotlib.org/
PNG SVG
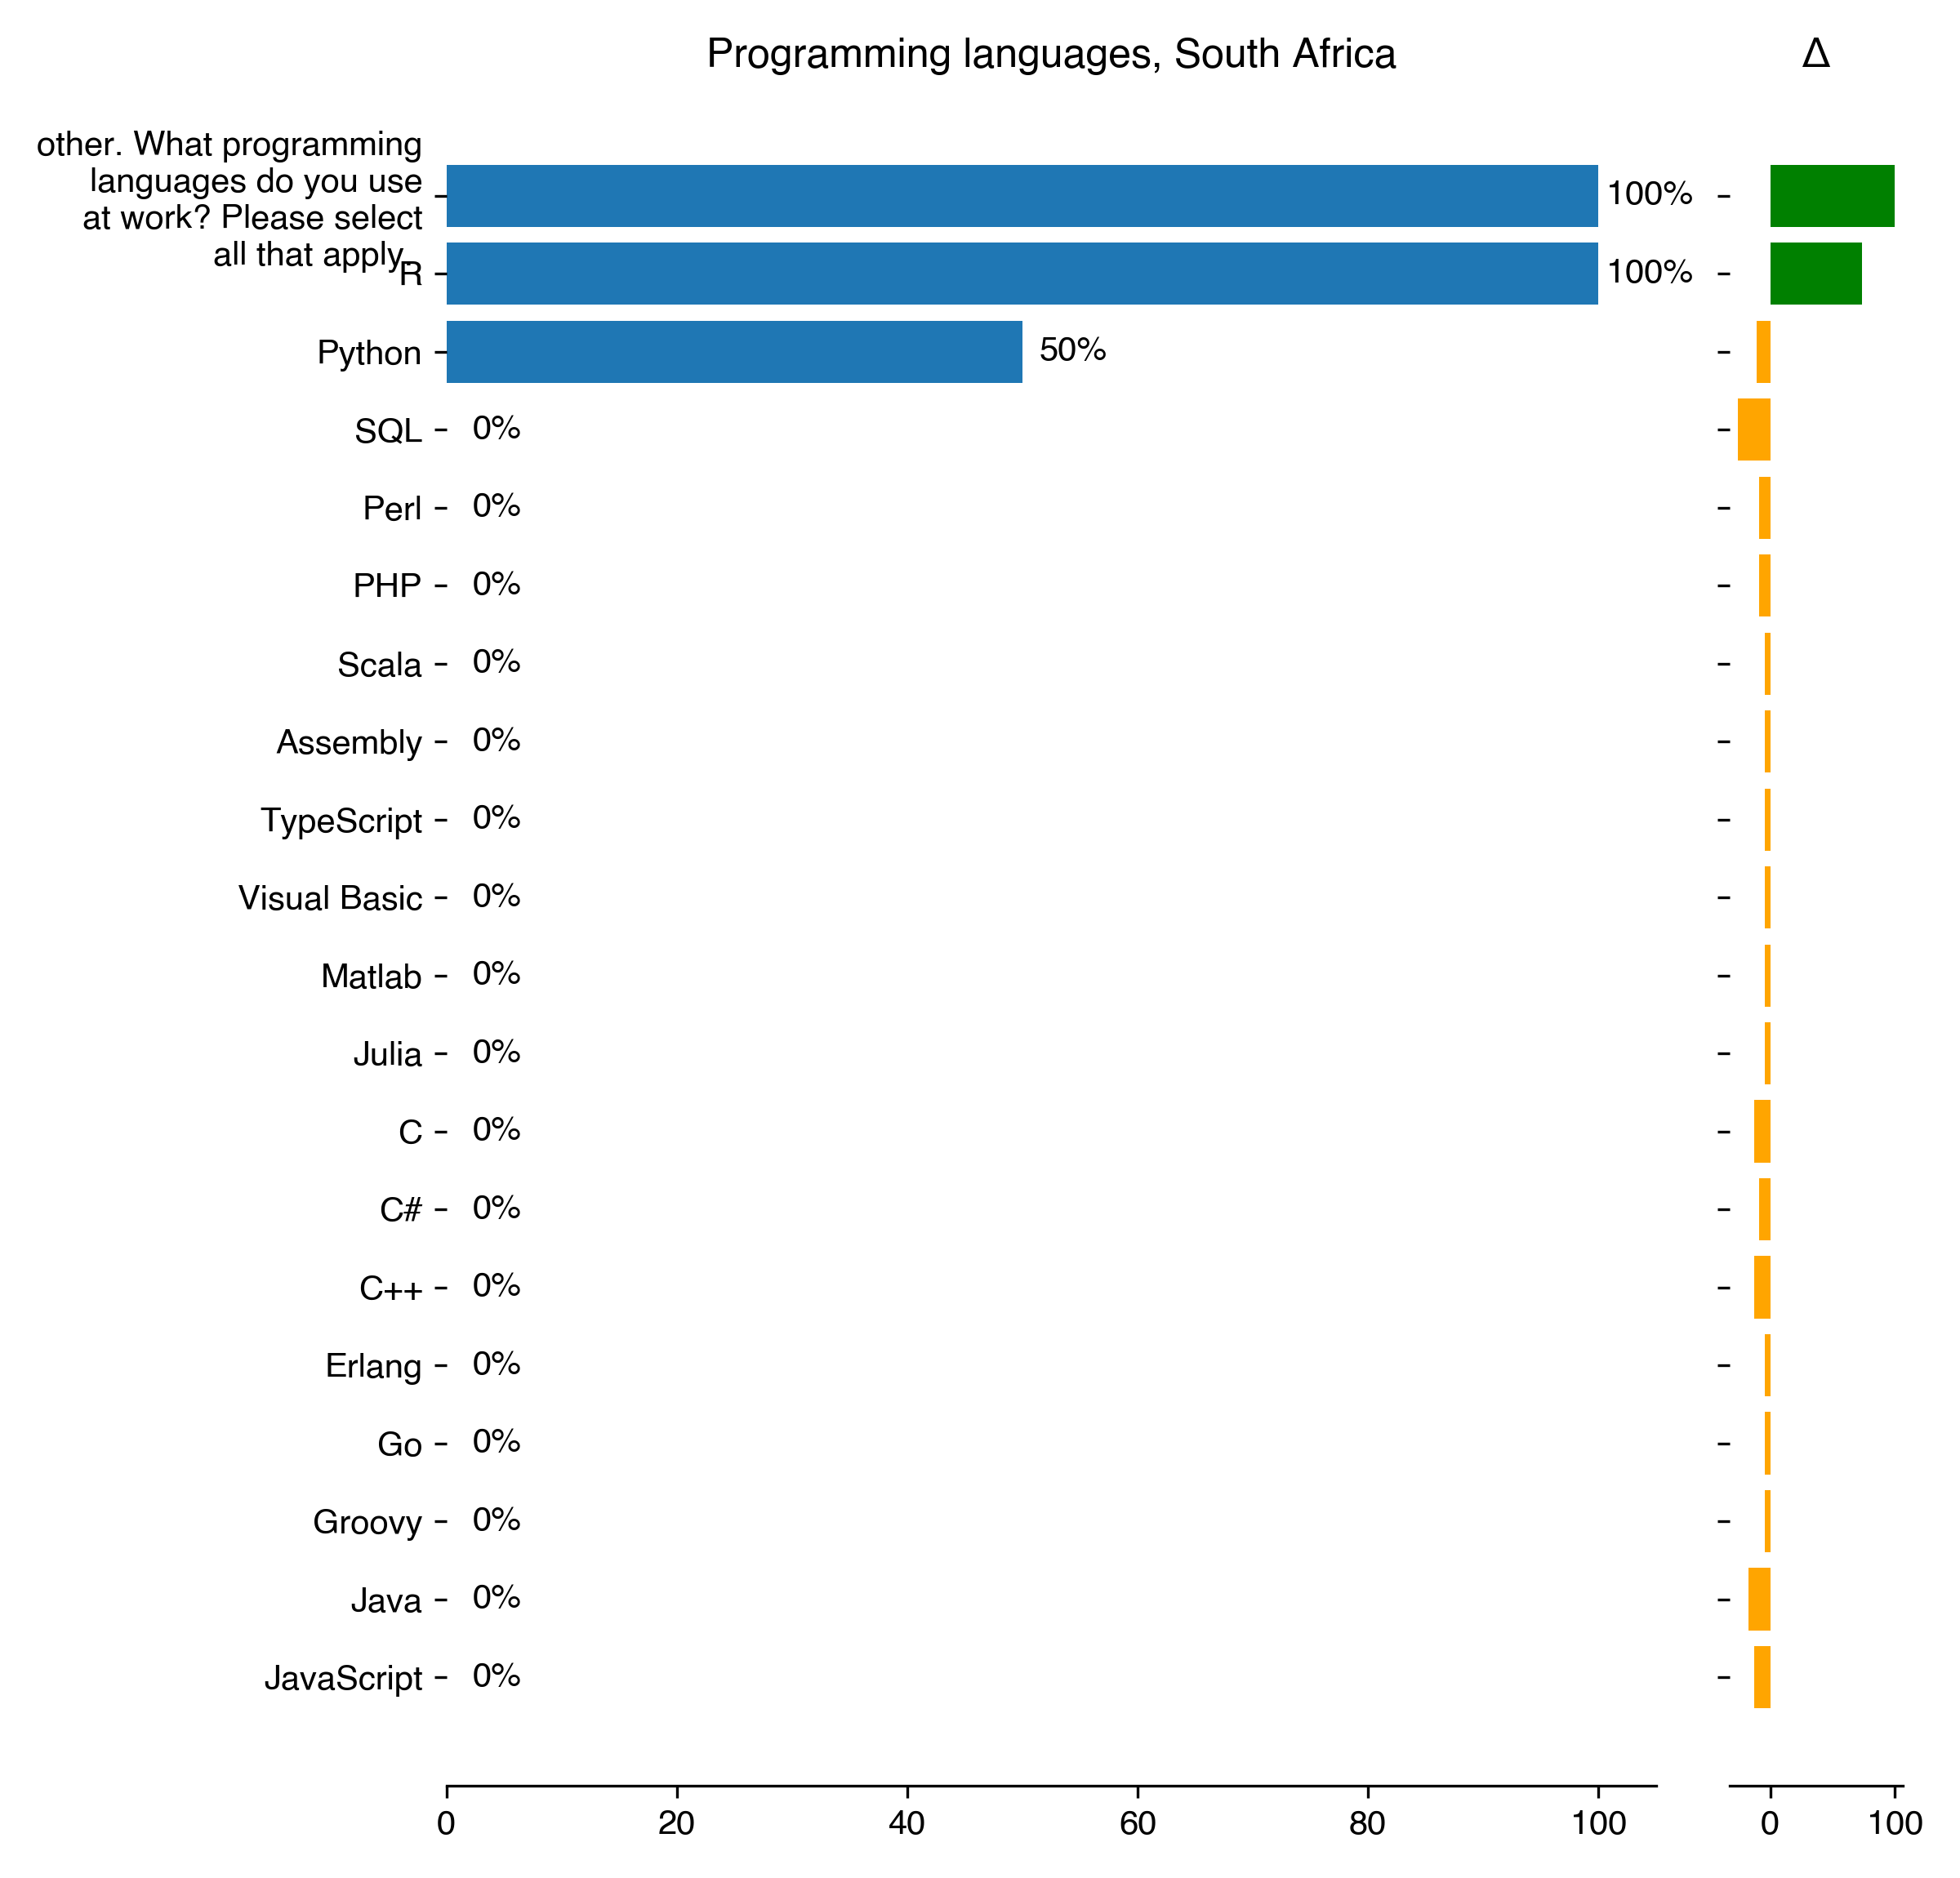
Programming languages for South Africa
Count
Percentage
Percentage in 2018
Difference with previous year
other. What programming languages do you use at work? Please select all that apply.
2
100
0
100
R
2
100
26.09
73.91
Python
1
50
60.87
-10.87
SQL
0
0
26.09
-26.09
Perl
0
0
8.7
-8.7
PHP
0
0
8.7
-8.7
Scala
0
0
4.35
-4.35
Assembly
0
0
4.35
-4.35
TypeScript
0
0
4.35
-4.35
Visual Basic
0
0
4.35
-4.35
Matlab
0
0
4.35
-4.35
Julia
0
0
4.35
-4.35
C
0
0
13.04
-13.04
C#
0
0
8.7
-8.7
C++
0
0
13.04
-13.04
Erlang
0
0
4.35
-4.35
Go
0
0
4.35
-4.35
Groovy
0
0
4.35
-4.35
Java
0
0
17.39
-17.39
JavaScript
0
0
13.04
-13.04
Download CSV
2022-08-22T11:27:36.750771
image/svg+xml
Matplotlib v3.5.2, https://matplotlib.org/
PNG SVG
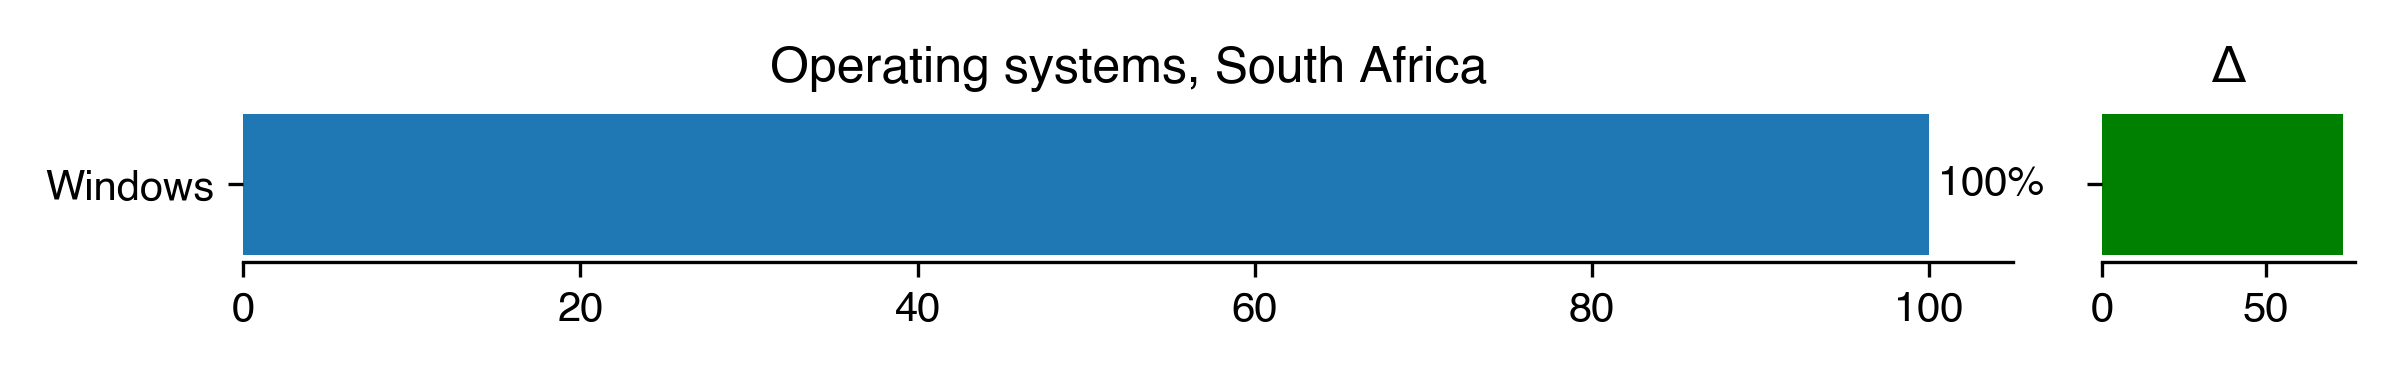
Operating systems for South Africa
Count
Percentage
Percentage in 2018
Difference with previous year
Windows
2
100
26.32
73.68
Download CSV
2022-08-22T11:27:37.137437
image/svg+xml
Matplotlib v3.5.2, https://matplotlib.org/
PNG SVG
Programming languages for United Kingdom
Count
Percentage
Percentage in 2018
Difference with previous year
Python
130
74.29
77.12
-2.83
JavaScript
58
33.14
27.54
5.6
C++
58
33.14
37.71
-4.57
R
44
25.14
29.24
-4.09
SQL
39
22.29
27.97
-5.68
C
35
20
35.17
-15.17
Fortran
29
16.57
27.54
-10.97
Matlab
26
14.86
17.37
-2.52
Java
22
12.57
19.92
-7.34
TypeScript
17
9.71
3.39
6.32
other. What programming languages do you use at work? Please select all that apply.
13
7.43
0
7.43
Ruby
12
6.86
2.97
3.89
C#
12
6.86
7.2
-0.35
PHP
11
6.29
9.32
-3.04
Julia
6
3.43
1.69
1.73
Perl
6
3.43
12.29
-8.86
Rust
3
1.71
1.69
0.02
Scala
3
1.71
1.27
0.44
Objective-C
3
1.71
0.85
0.87
Swift
3
1.71
0
1.71
Assembly
2
1.14
2.54
-1.4
VBA
2
1.14
2.97
-1.82
Go
2
1.14
1.27
-0.13
F#
2
1.14
0
1.14
Common Lisp
2
1.14
0
1.14
Haskell
1
0.57
0
0.57
Visual Basic
0
0
1.27
-1.27
VB.NET
0
0
0.85
-0.85
Lua
0
0
1.27
-1.27
Groovy
0
0
1.27
-1.27
CoffeeScript
0
0
1.27
-1.27
Clojure
0
0
0.42
-0.42
Download CSV
2022-08-22T11:27:38.609888
image/svg+xml
Matplotlib v3.5.2, https://matplotlib.org/
PNG SVG
Operating systems for United Kingdom
Count
Percentage
Percentage in 2018
Difference with previous year
GNU/Linux
83
58.04
61.46
-3.42
macOS
43
30.07
nan
nan
Windows
17
11.89
18.05
-6.16
Download CSV
2022-08-22T11:27:39.173537
image/svg+xml
Matplotlib v3.5.2, https://matplotlib.org/
PNG SVG
Programming languages for United States
Count
Percentage
Percentage in 2018
Difference with previous year
Python
128
80
78.23
1.77
C++
55
34.38
34.69
-0.32
R
49
30.63
23.13
7.5
SQL
48
30
31.97
-1.97
JavaScript
46
28.75
28.57
0.18
C
35
21.88
34.01
-12.14
Fortran
29
18.12
20.41
-2.28
Matlab
27
16.88
13.61
3.27
Java
27
16.88
21.09
-4.21
other. What programming languages do you use at work? Please select all that apply.
16
10
0
10
Perl
15
9.38
13.61
-4.23
TypeScript
13
8.12
0.68
7.44
Julia
13
8.12
2.72
5.4
PHP
12
7.5
6.8
0.7
Ruby
9
5.62
4.08
1.54
C#
6
3.75
6.12
-2.37
Go
6
3.75
1.36
2.39
Scala
5
3.12
2.04
1.08
Lua
4
2.5
1.36
1.14
Common Lisp
4
2.5
0.68
1.82
Assembly
3
1.88
2.72
-0.85
Groovy
3
1.88
2.72
-0.85
Objective-C
2
1.25
0.68
0.57
VB.NET
2
1.25
0
1.25
Haskell
2
1.25
0
1.25
Visual Basic
2
1.25
0.68
0.57
Rust
2
1.25
1.36
-0.11
VBA
2
1.25
2.72
-1.47
Dart
1
0.62
0
0.62
Swift
1
0.62
0.68
-0.06
Elixir
1
0.62
0.68
-0.06
CoffeeScript
0
0
1.36
-1.36
Clojure
0
0
1.36
-1.36
Download CSV
2022-08-22T11:27:40.605438
image/svg+xml
Matplotlib v3.5.2, https://matplotlib.org/
PNG SVG
Operating systems for United States
Count
Percentage
Percentage in 2018
Difference with previous year
GNU/Linux
74
56.06
63.16
-7.1
macOS
47
35.61
nan
nan
Windows
10
7.58
9.77
-2.2
Other
1
0.76
nan
nan
Download CSV
2022-08-22T11:27:41.225790
image/svg+xml
Matplotlib v3.5.2, https://matplotlib.org/
PNG SVG
Programming languages for World
Count
Percentage
Percentage in 2018
Difference with previous year
Python
708
71.01
70.65
0.36
C++
301
30.19
34.87
-4.68
R
269
26.98
26.93
0.05
JavaScript
246
24.67
26.73
-2.06
SQL
220
22.07
26.73
-4.67
C
193
19.36
28.64
-9.29
Fortran
170
17.05
19.6
-2.55
Java
143
14.34
20.1
-5.76
Matlab
130
13.04
16.88
-3.85
other. What programming languages do you use at work? Please select all that apply.
111
11.13
0
11.13
PHP
77
7.72
8.54
-0.82
Perl
68
6.82
9.05
-2.22
Julia
65
6.52
3.52
3
TypeScript
63
6.32
3.22
3.1
C#
41
4.11
7.34
-3.22
Ruby
29
2.91
2.91
-0.01
Rust
27
2.71
1.81
0.9
Go
21
2.11
2.11
-0
Scala
14
1.4
1.61
-0.2
Lua
13
1.3
1.21
0.1
Assembly
13
1.3
2.01
-0.71
Groovy
12
1.2
1.71
-0.5
Haskell
9
0.9
0.5
0.4
Common Lisp
9
0.9
0.5
0.4
VBA
9
0.9
2.71
-1.81
Objective-C
7
0.7
0.4
0.3
Swift
7
0.7
0.5
0.2
VB.NET
6
0.6
0.9
-0.3
Visual Basic
6
0.6
1.31
-0.7
F#
4
0.4
0.1
0.3
Dart
3
0.3
0
0.3
Clojure
2
0.2
0.4
-0.2
CoffeeScript
1
0.1
0.7
-0.6
Elixir
1
0.1
0.2
-0.1
Erlang
0
0
0.3
-0.3
Download CSV
2022-08-22T11:27:42.733649
image/svg+xml
Matplotlib v3.5.2, https://matplotlib.org/
PNG SVG
Operating systems for World
Count
Percentage
Percentage in 2018
Difference with previous year
GNU/Linux
509
63.15
61.55
1.6
macOS
169
20.97
nan
nan
Windows
120
14.89
20.52
-5.63
Other
8
0.99
1.06
-0.06
Download CSV
2022-08-22T11:27:43.347606
image/svg+xml
Matplotlib v3.5.2, https://matplotlib.org/
PNG SVG