United Kingdom
- Education and academic field
- Professional developer
- How time is spent
- Previous employment
- Collaboration and training
- Publications and citations
- Open source and DOI
- Good practices
- Tools and programming languages
- Job satisfaction
- Research software engineer
Education and academic field
This section contains the information about the type of education the participants have, as well as their highest degree obtained.
We asked the participants, in which field they are working. With that question, it is possible to see which current field employed the most of RSE/RSD. The questions was specific to each country and was multiple choice. Each participant could choose several fields. We then calculate the different proportion by dividing each field by the total of participants that have selected at least one option.
Questions in this section
- What is the highest level of education you have attained? (one choice list)
- In which discipline is your highest academic qualification? (one choice list)
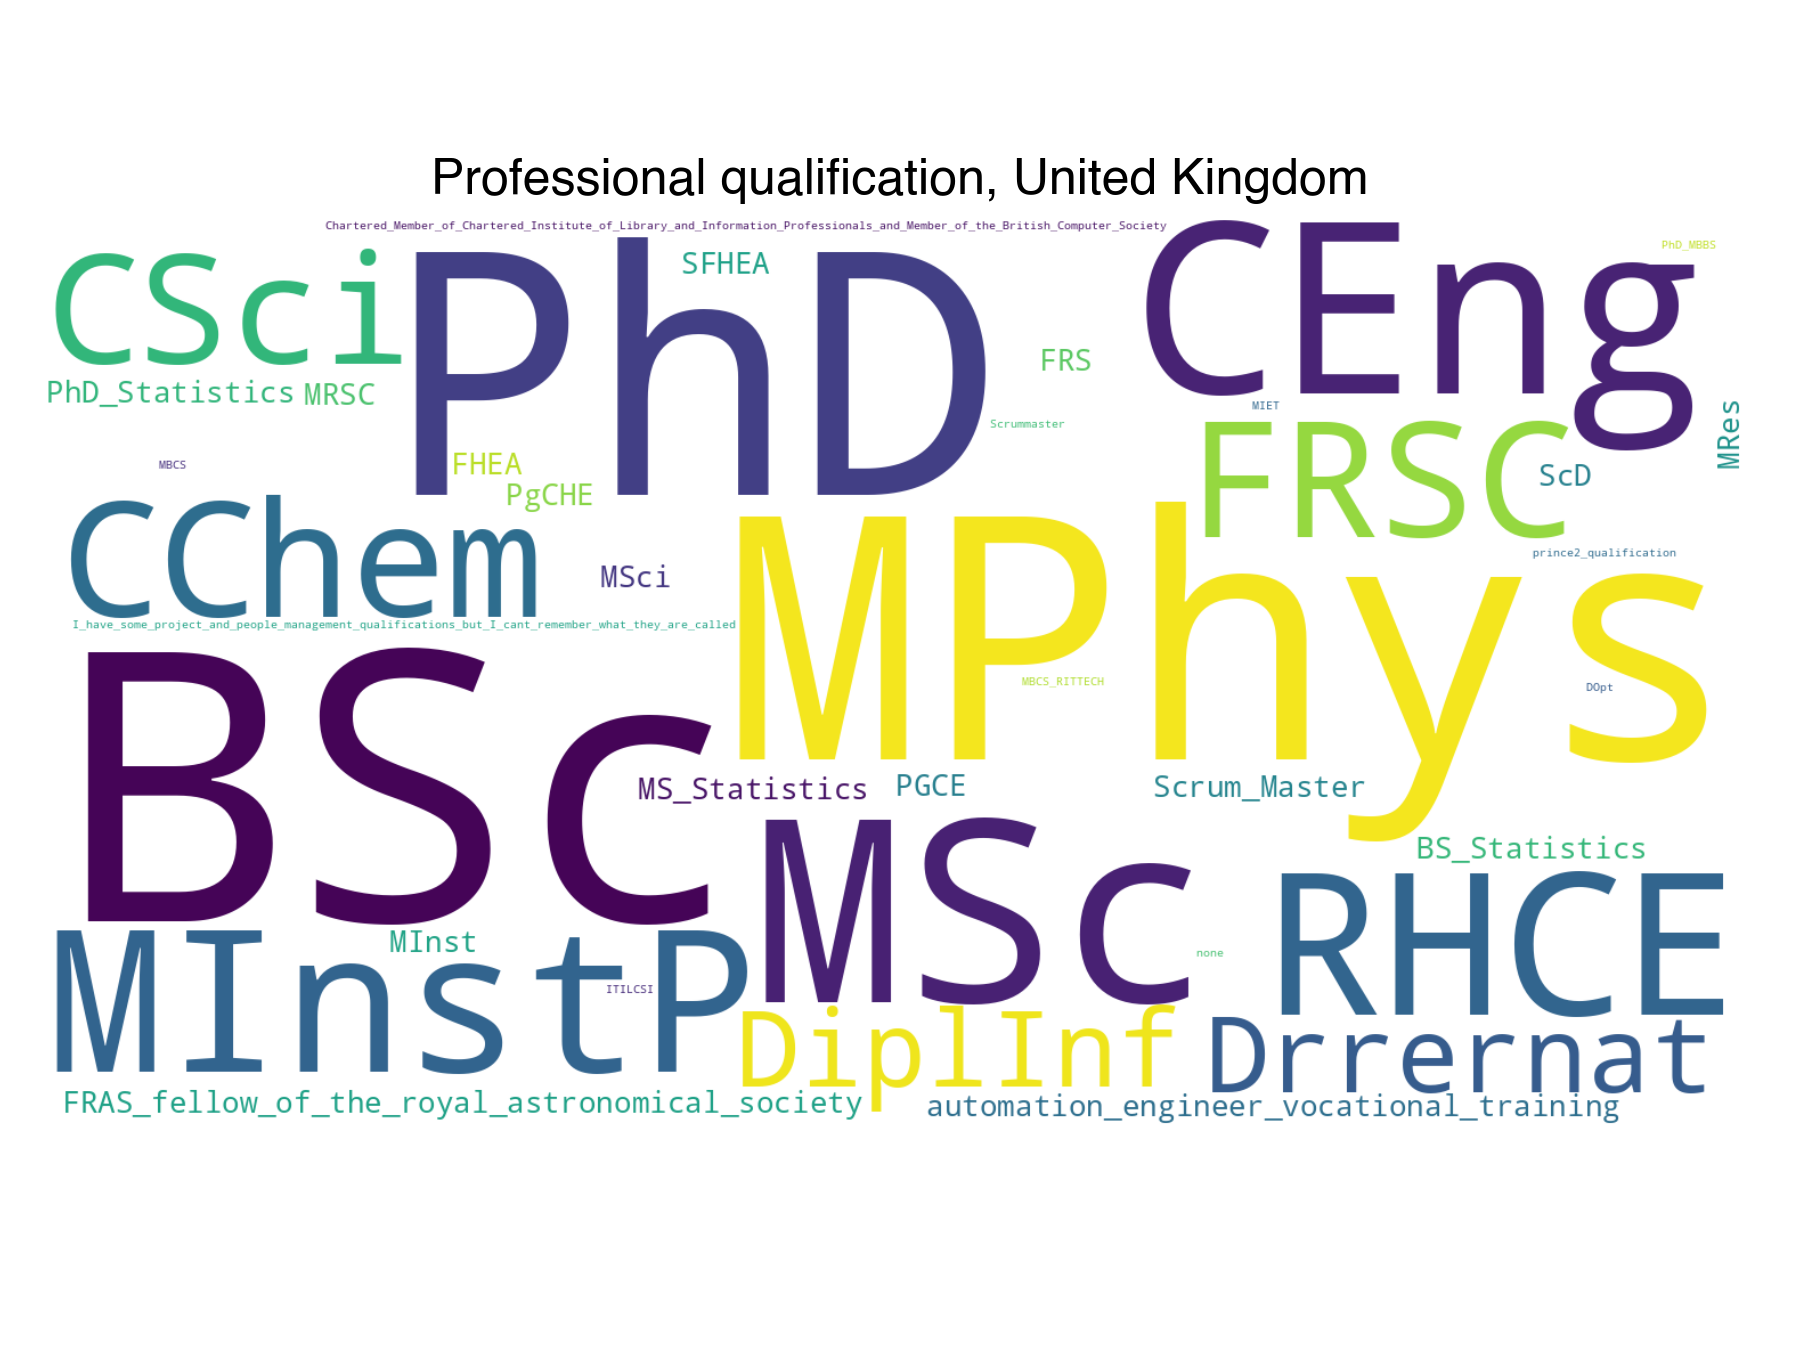
- List any professional qualifications you hold (free text)
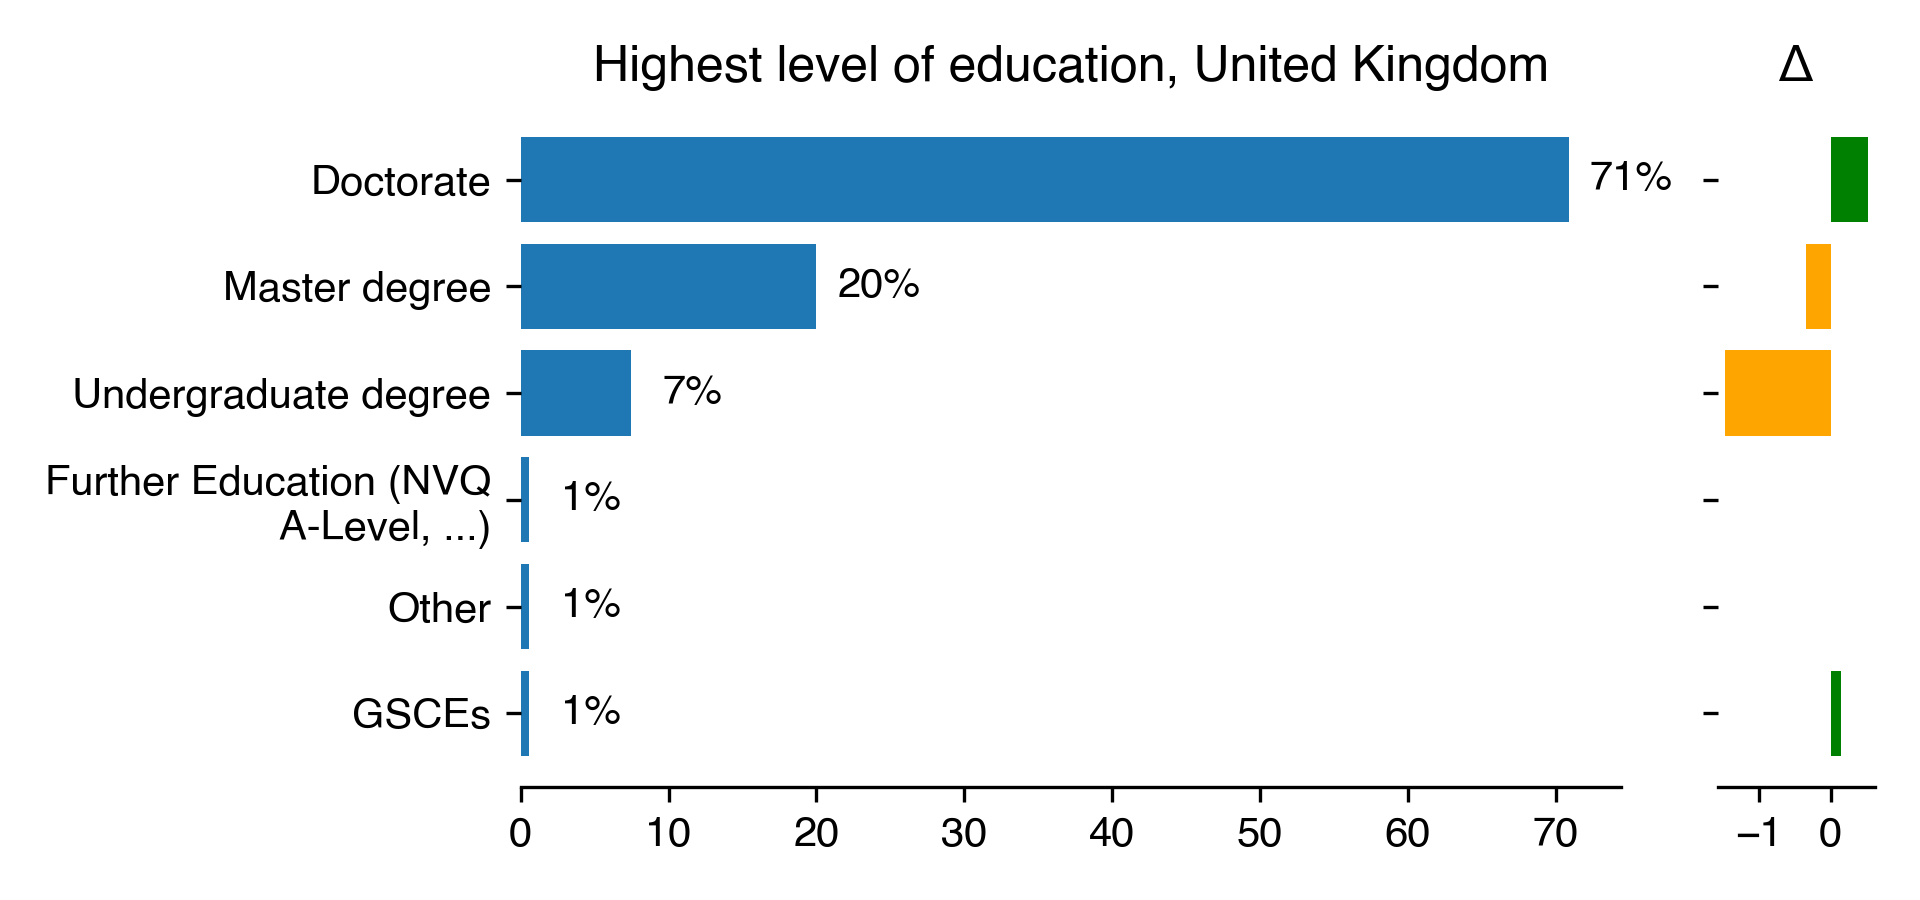
Levels of education
| Highest level of education for United Kingdom | Count | Percentage | Percentage in 2018 | Difference with previous year |
|---|---|---|---|---|
| Doctorate | 124 | 70.86 | 70.34 | 0.52 |
| Master degree | 35 | 20 | 20.34 | -0.34 |
| Undergraduate degree | 13 | 7.43 | 8.9 | -1.47 |
| Further Education (NVQ A-Level, …) | 1 | 0.57 | nan | nan |
| Other | 1 | 0.57 | nan | nan |
| GSCEs | 1 | 0.57 | 0.42 | 0.15 |
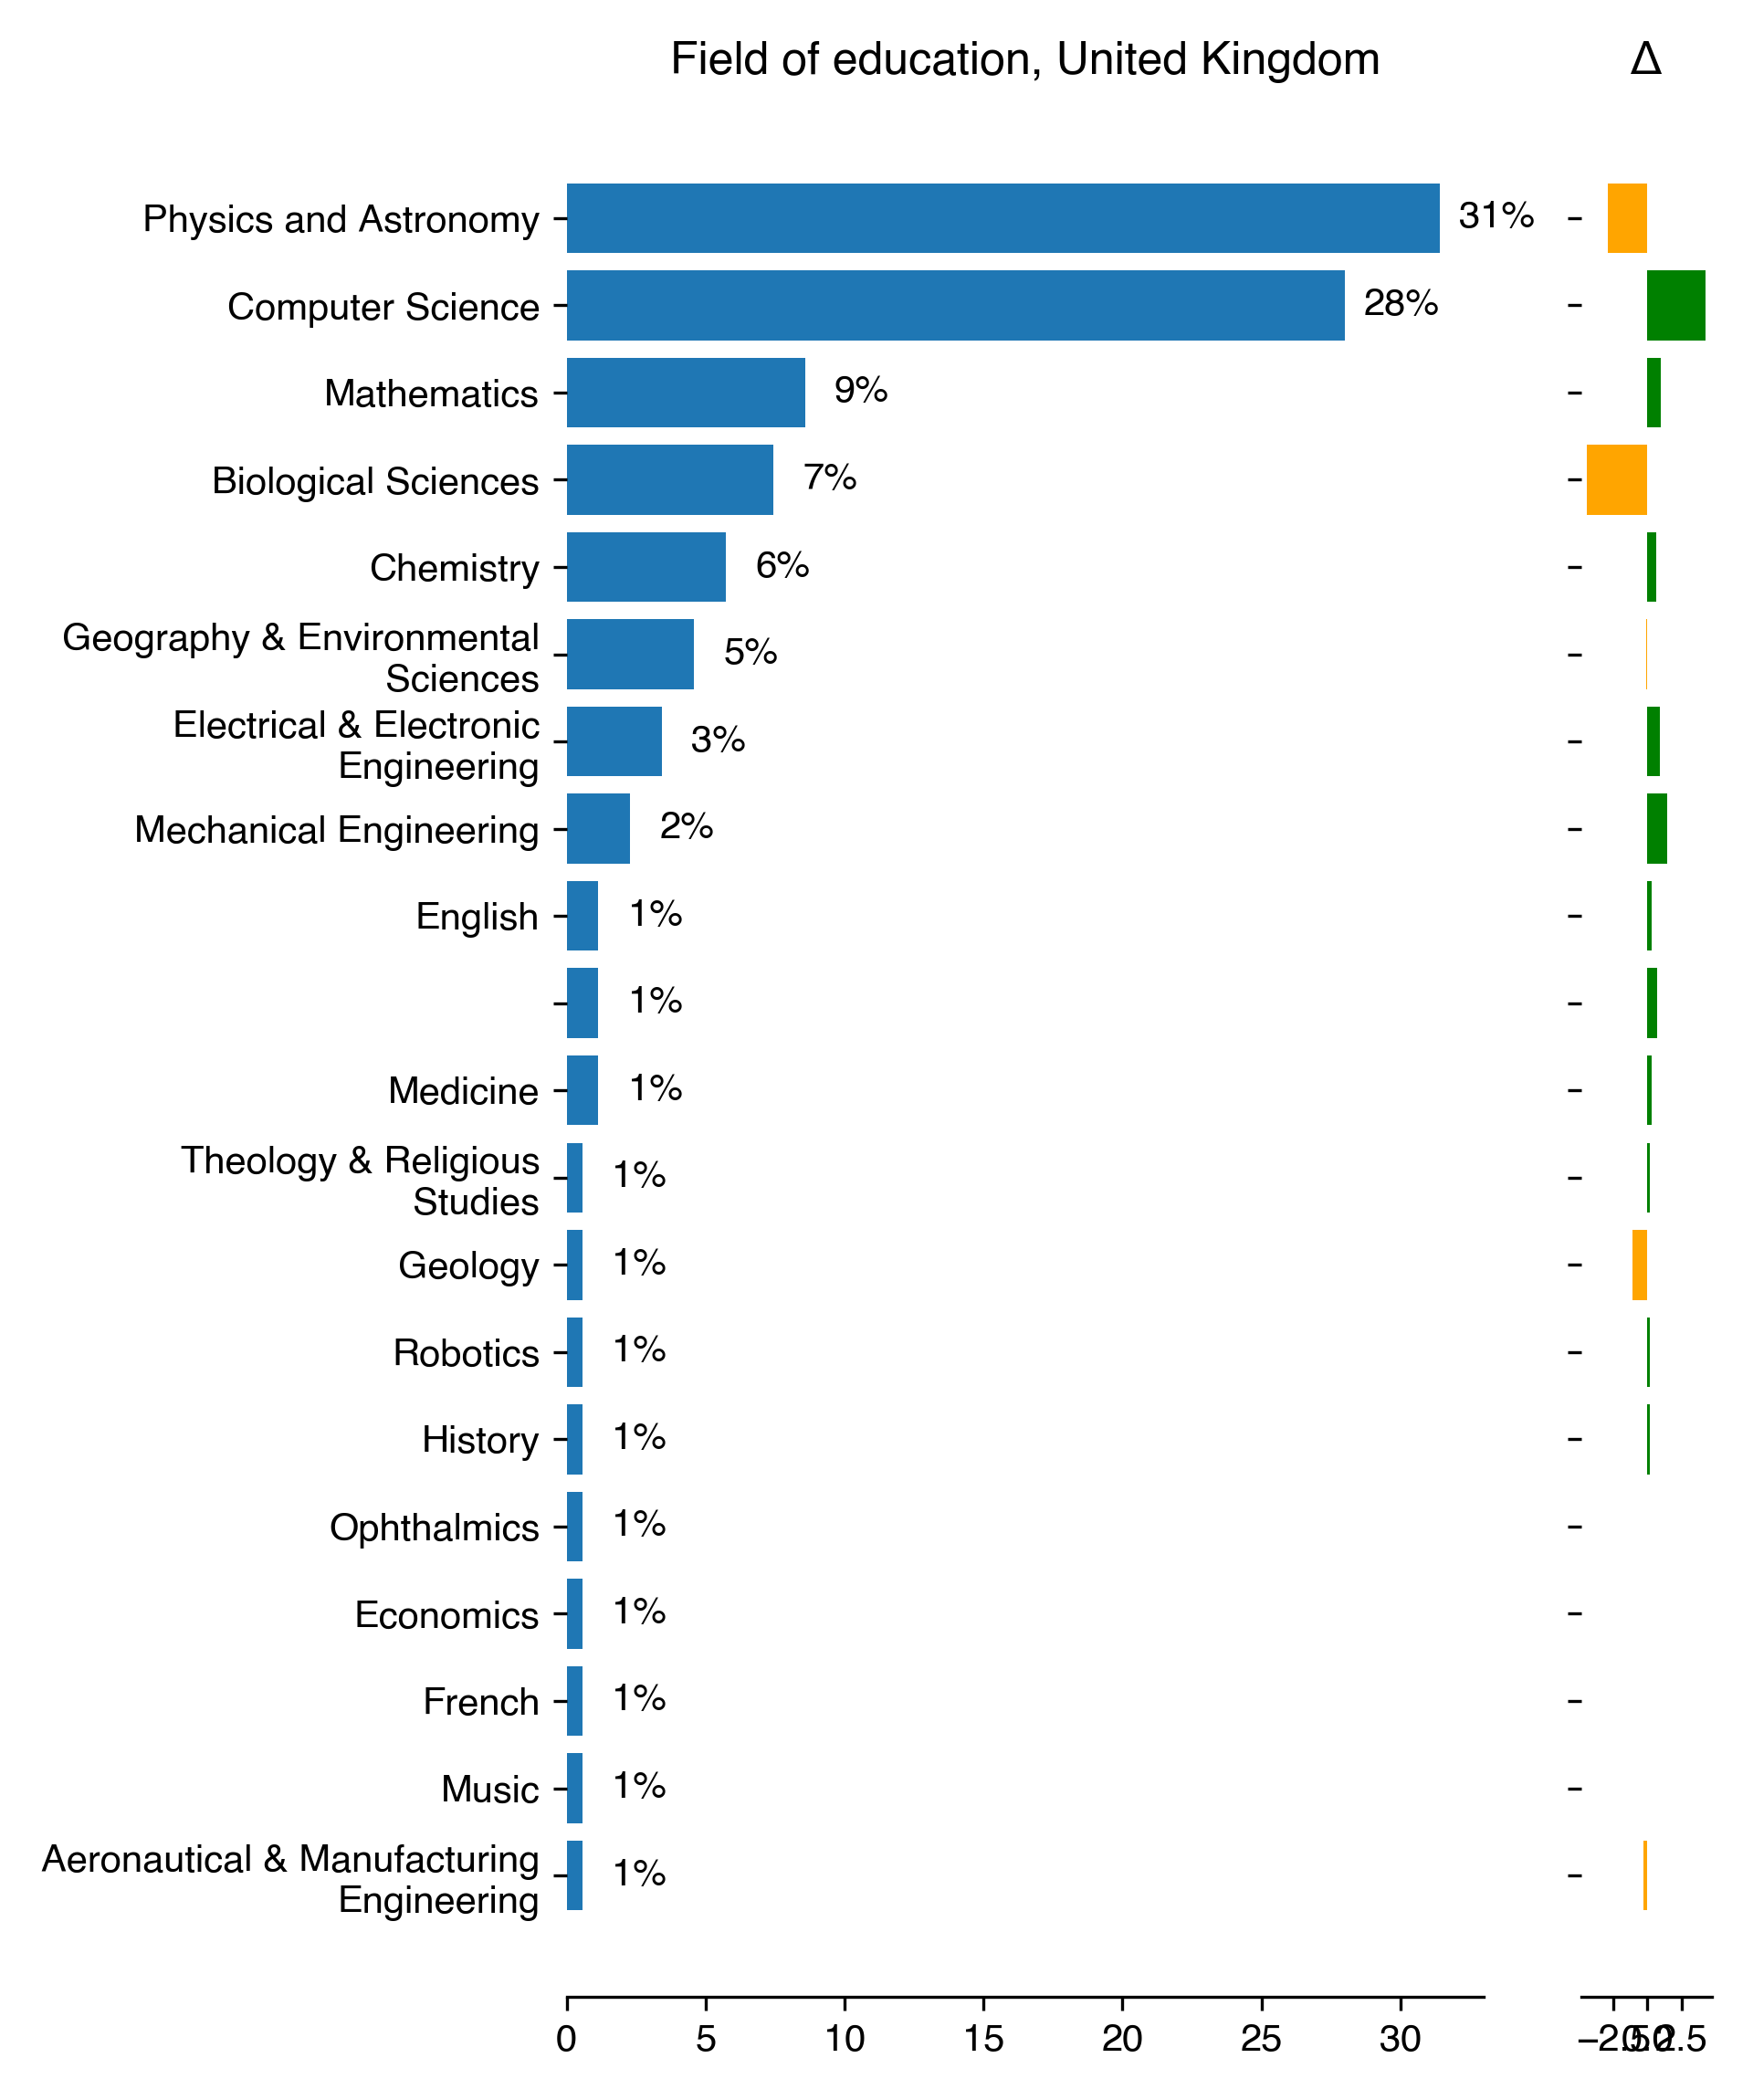
Academic field for education and professional development
Alongside of question about education level we also asked the participants in which field they finished their highest level of education. Here again the propositions were specific to each countries so the comparison is difficult despite lot of overlapping in the categories.
| Field of education for United Kingdom | Count | Percentage | Percentage in 2018 | Difference with previous year |
|---|---|---|---|---|
| Physics and Astronomy | 55 | 31.43 | 34.32 | -2.89 |
| Computer Science | 49 | 28 | 23.73 | 4.27 |
| Mathematics | 15 | 8.57 | 7.63 | 0.94 |
| Biological Sciences | 13 | 7.43 | 11.86 | -4.44 |
| Chemistry | 10 | 5.71 | 5.08 | 0.63 |
| Geography & Environmental Sciences | 8 | 4.57 | 4.66 | -0.09 |
| Electrical & Electronic Engineering | 6 | 3.43 | 2.54 | 0.89 |
| Mechanical Engineering | 4 | 2.29 | 0.85 | 1.44 |
| English | 2 | 1.14 | 0.85 | 0.3 |
| nan | 2 | 1.14 | 0.42 | 0.72 |
| Medicine | 2 | 1.14 | 0.85 | 0.3 |
| Theology & Religious Studies | 1 | 0.57 | 0.42 | 0.15 |
| Geology | 1 | 0.57 | 1.69 | -1.12 |
| Robotics | 1 | 0.57 | 0.42 | 0.15 |
| History | 1 | 0.57 | 0.42 | 0.15 |
| Ophthalmics | 1 | 0.57 | nan | nan |
| Economics | 1 | 0.57 | nan | nan |
| French | 1 | 0.57 | nan | nan |
| Music | 1 | 0.57 | nan | nan |
| Aeronautical & Manufacturing Engineering | 1 | 0.57 | 0.85 | -0.28 |
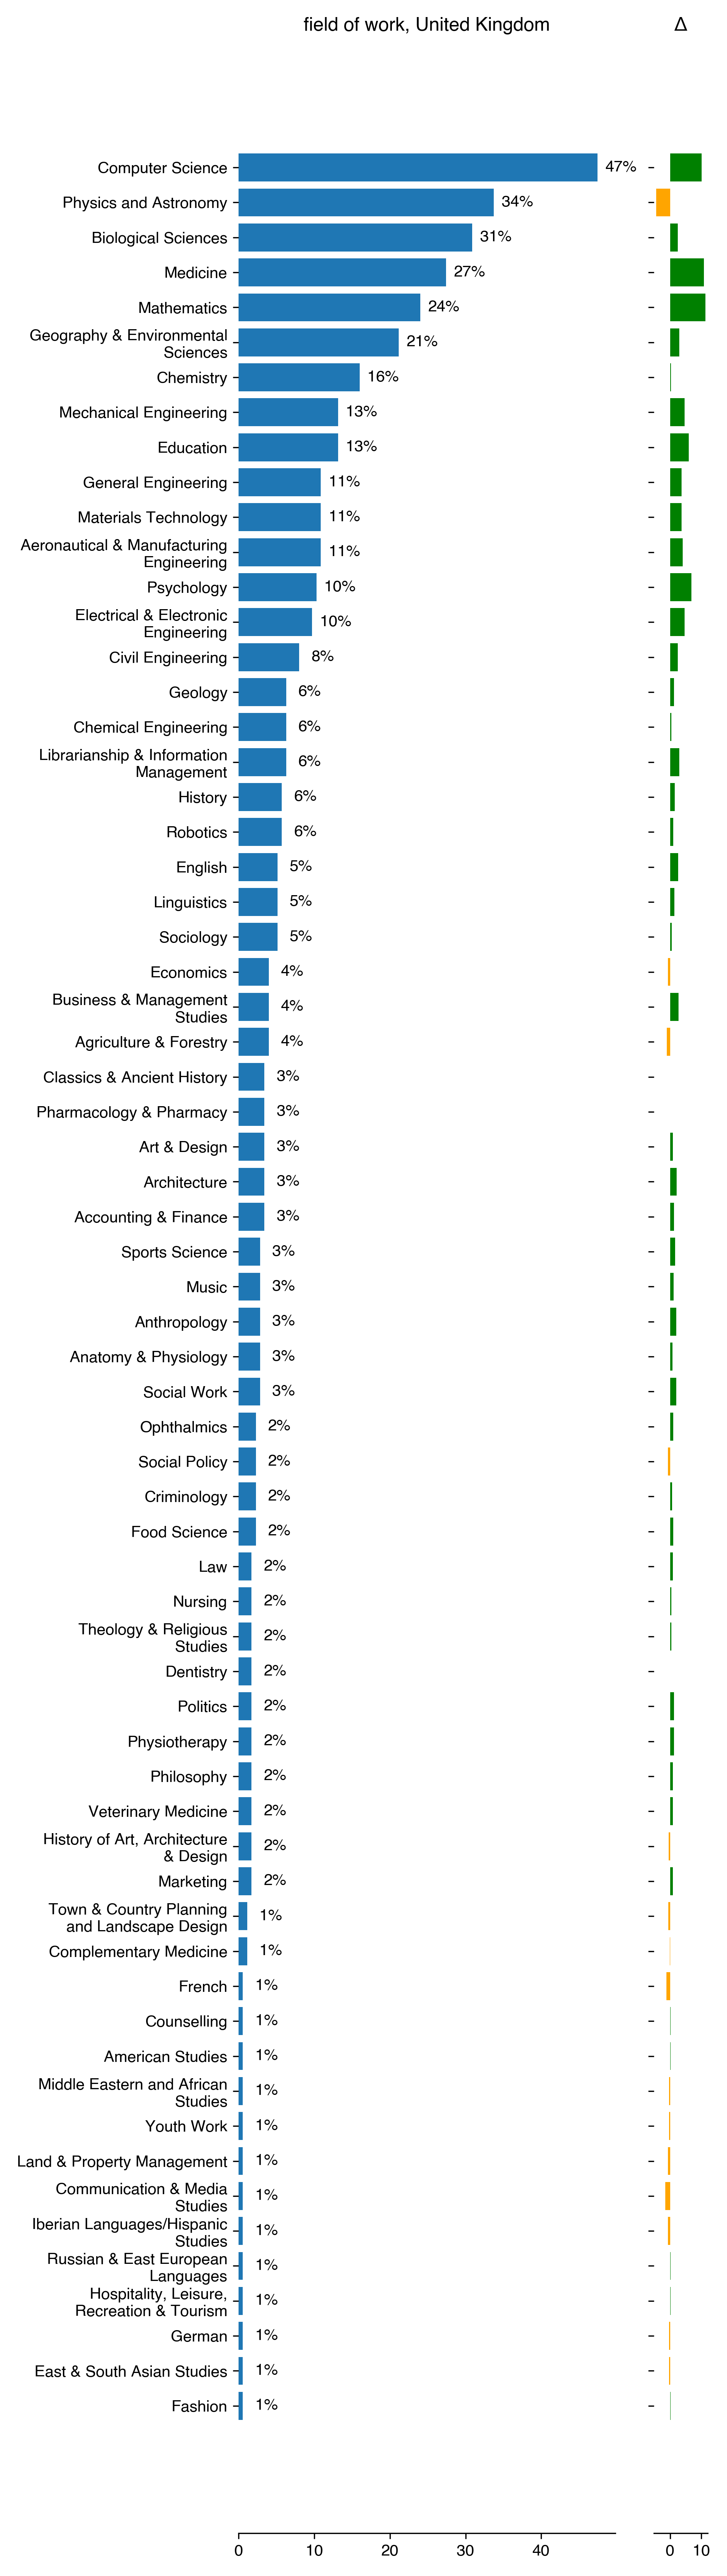
Academic field of work
| field of work for United Kingdom | Count | Percentage | Percentage in 2018 | Difference with previous year |
|---|---|---|---|---|
| Computer Science | 83 | 47.43 | 37.29 | 10.14 |
| Physics and Astronomy | 59 | 33.71 | 38.14 | -4.42 |
| Biological Sciences | 54 | 30.86 | 28.39 | 2.47 |
| Medicine | 48 | 27.43 | 16.53 | 10.9 |
| Mathematics | 42 | 24 | 12.71 | 11.29 |
| Geography & Environmental Sciences | 37 | 21.14 | 18.22 | 2.92 |
| Chemistry | 28 | 16 | 15.68 | 0.32 |
| Mechanical Engineering | 23 | 13.14 | 8.47 | 4.67 |
| Education | 23 | 13.14 | 7.2 | 5.94 |
| General Engineering | 19 | 10.86 | 7.2 | 3.65 |
| Materials Technology | 19 | 10.86 | 7.2 | 3.65 |
| Aeronautical & Manufacturing Engineering | 19 | 10.86 | 6.78 | 4.08 |
| Psychology | 18 | 10.29 | 3.39 | 6.9 |
| Electrical & Electronic Engineering | 17 | 9.71 | 5.08 | 4.63 |
| Civil Engineering | 14 | 8 | 5.51 | 2.49 |
| Geology | 11 | 6.29 | 5.08 | 1.2 |
| Chemical Engineering | 11 | 6.29 | 5.93 | 0.35 |
| Librarianship & Information Management | 11 | 6.29 | 3.39 | 2.9 |
| History | 10 | 5.71 | 4.24 | 1.48 |
| Robotics | 10 | 5.71 | 4.66 | 1.05 |
| English | 9 | 5.14 | 2.54 | 2.6 |
| Linguistics | 9 | 5.14 | 3.81 | 1.33 |
| Sociology | 9 | 5.14 | 4.66 | 0.48 |
| Economics | 7 | 4 | 4.66 | -0.66 |
| Business & Management Studies | 7 | 4 | 1.27 | 2.73 |
| Agriculture & Forestry | 7 | 4 | 5.08 | -1.08 |
| Classics & Ancient History | 6 | 3.43 | 3.39 | 0.04 |
| Pharmacology & Pharmacy | 6 | 3.43 | 3.39 | 0.04 |
| Art & Design | 6 | 3.43 | 2.54 | 0.89 |
| Architecture | 6 | 3.43 | 1.27 | 2.16 |
| Accounting & Finance | 6 | 3.43 | 2.12 | 1.31 |
| Sports Science | 5 | 2.86 | 1.27 | 1.59 |
| Music | 5 | 2.86 | 1.69 | 1.16 |
| Anthropology | 5 | 2.86 | 0.85 | 2.01 |
| Anatomy & Physiology | 5 | 2.86 | 2.12 | 0.74 |
| Social Work | 5 | 2.86 | 0.85 | 2.01 |
| Ophthalmics | 4 | 2.29 | 1.27 | 1.01 |
| Social Policy | 4 | 2.29 | 2.97 | -0.68 |
| Criminology | 4 | 2.29 | 1.69 | 0.59 |
| Food Science | 4 | 2.29 | 1.27 | 1.01 |
| Law | 3 | 1.71 | 0.85 | 0.87 |
| Nursing | 3 | 1.71 | 1.27 | 0.44 |
| Theology & Religious Studies | 3 | 1.71 | 1.27 | 0.44 |
| Dentistry | 3 | 1.71 | 1.69 | 0.02 |
| Politics | 3 | 1.71 | 0.42 | 1.29 |
| Physiotherapy | 3 | 1.71 | 0.42 | 1.29 |
| Philosophy | 3 | 1.71 | 0.85 | 0.87 |
| Veterinary Medicine | 3 | 1.71 | 0.85 | 0.87 |
| History of Art, Architecture & Design | 3 | 1.71 | 2.12 | -0.4 |
| Marketing | 3 | 1.71 | 0.85 | 0.87 |
| Town & Country Planning and Landscape Design | 2 | 1.14 | 1.69 | -0.55 |
| Complementary Medicine | 2 | 1.14 | 1.27 | -0.13 |
| French | 1 | 0.57 | 1.69 | -1.12 |
| Counselling | 1 | 0.57 | 0.42 | 0.15 |
| American Studies | 1 | 0.57 | 0.42 | 0.15 |
| Middle Eastern and African Studies | 1 | 0.57 | 0.85 | -0.28 |
| Youth Work | 1 | 0.57 | 0.85 | -0.28 |
| Land & Property Management | 1 | 0.57 | 1.27 | -0.7 |
| Communication & Media Studies | 1 | 0.57 | 2.12 | -1.55 |
| Iberian Languages/Hispanic Studies | 1 | 0.57 | 1.27 | -0.7 |
| Russian & East European Languages | 1 | 0.57 | 0.42 | 0.15 |
| Hospitality, Leisure, Recreation & Tourism | 1 | 0.57 | 0.42 | 0.15 |
| German | 1 | 0.57 | 0.85 | -0.28 |
| East & South Asian Studies | 1 | 0.57 | 0.85 | -0.28 |
| Fashion | 1 | 0.57 | 0.42 | 0.15 |
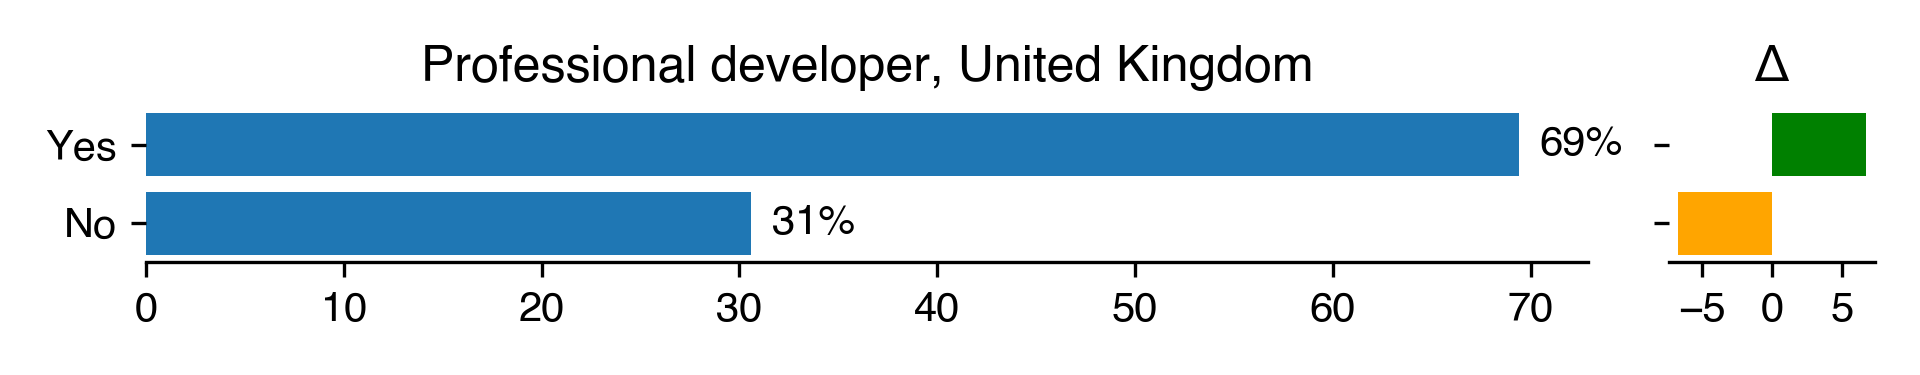
Professional developer
In this section we investigate the relationship between RSEs/RSDs and their own experience in software development Understandably, we expect them having several years of software development experience. However, as shown in previous years, it is not necessarily reflected upon their own feeling of being considered as professional.
Questions in this section:
- Do you consider yourself a professional software developer? (Yes/No)
- How many years of software development experience do you have? (integer)
How many professional developers?
| Professional developer for United Kingdom | Count | Percentage | Percentage in 2018 | Difference with previous year |
|---|---|---|---|---|
| Yes | 118 | 69.41 | 62.72 | 6.69 |
| No | 52 | 30.59 | 37.28 | -6.69 |
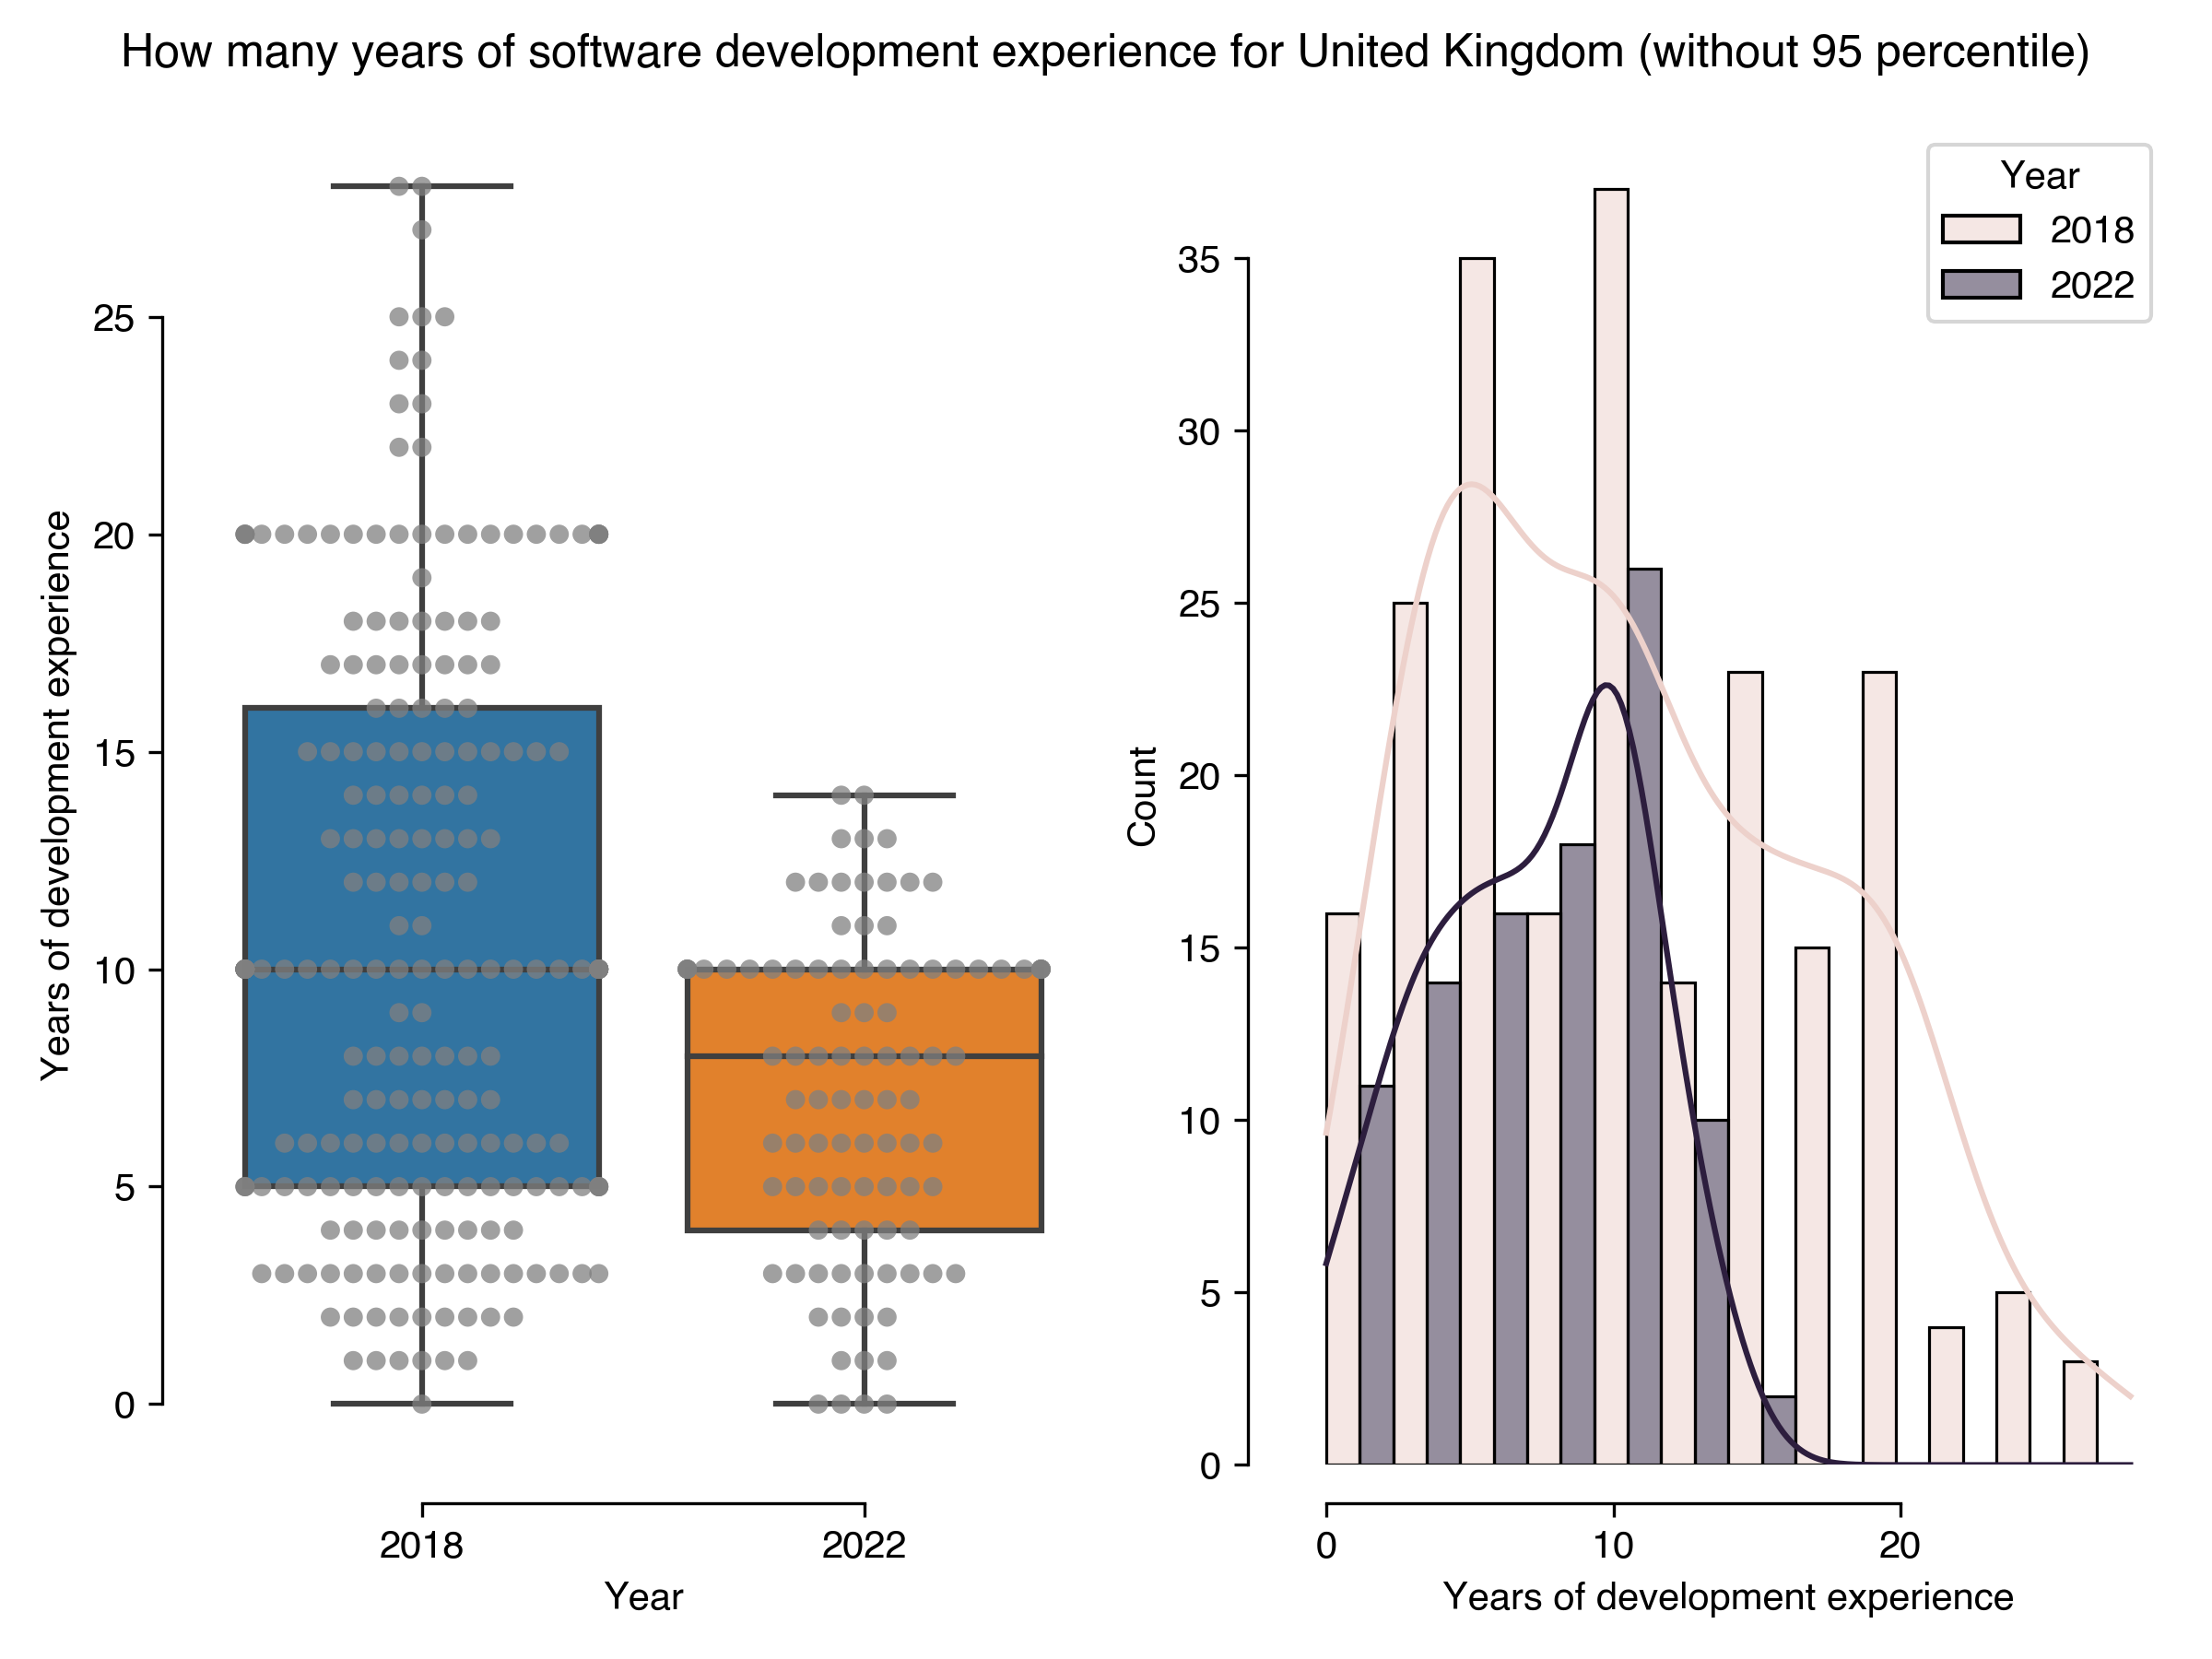
Years of software development experience
| How many years of software development experience for United Kingdom (without 95 percentile) | Results in 2022 | Results in 2018 |
|---|---|---|
| count | 97 | 216 |
| mean | 7.23 | 10.78 |
| std | 3.66 | 6.62 |
| min | 0 | 0 |
| 25% | 4 | 5 |
| 50% | 8 | 10 |
| 75% | 10 | 16 |
| max | 14 | 28 |
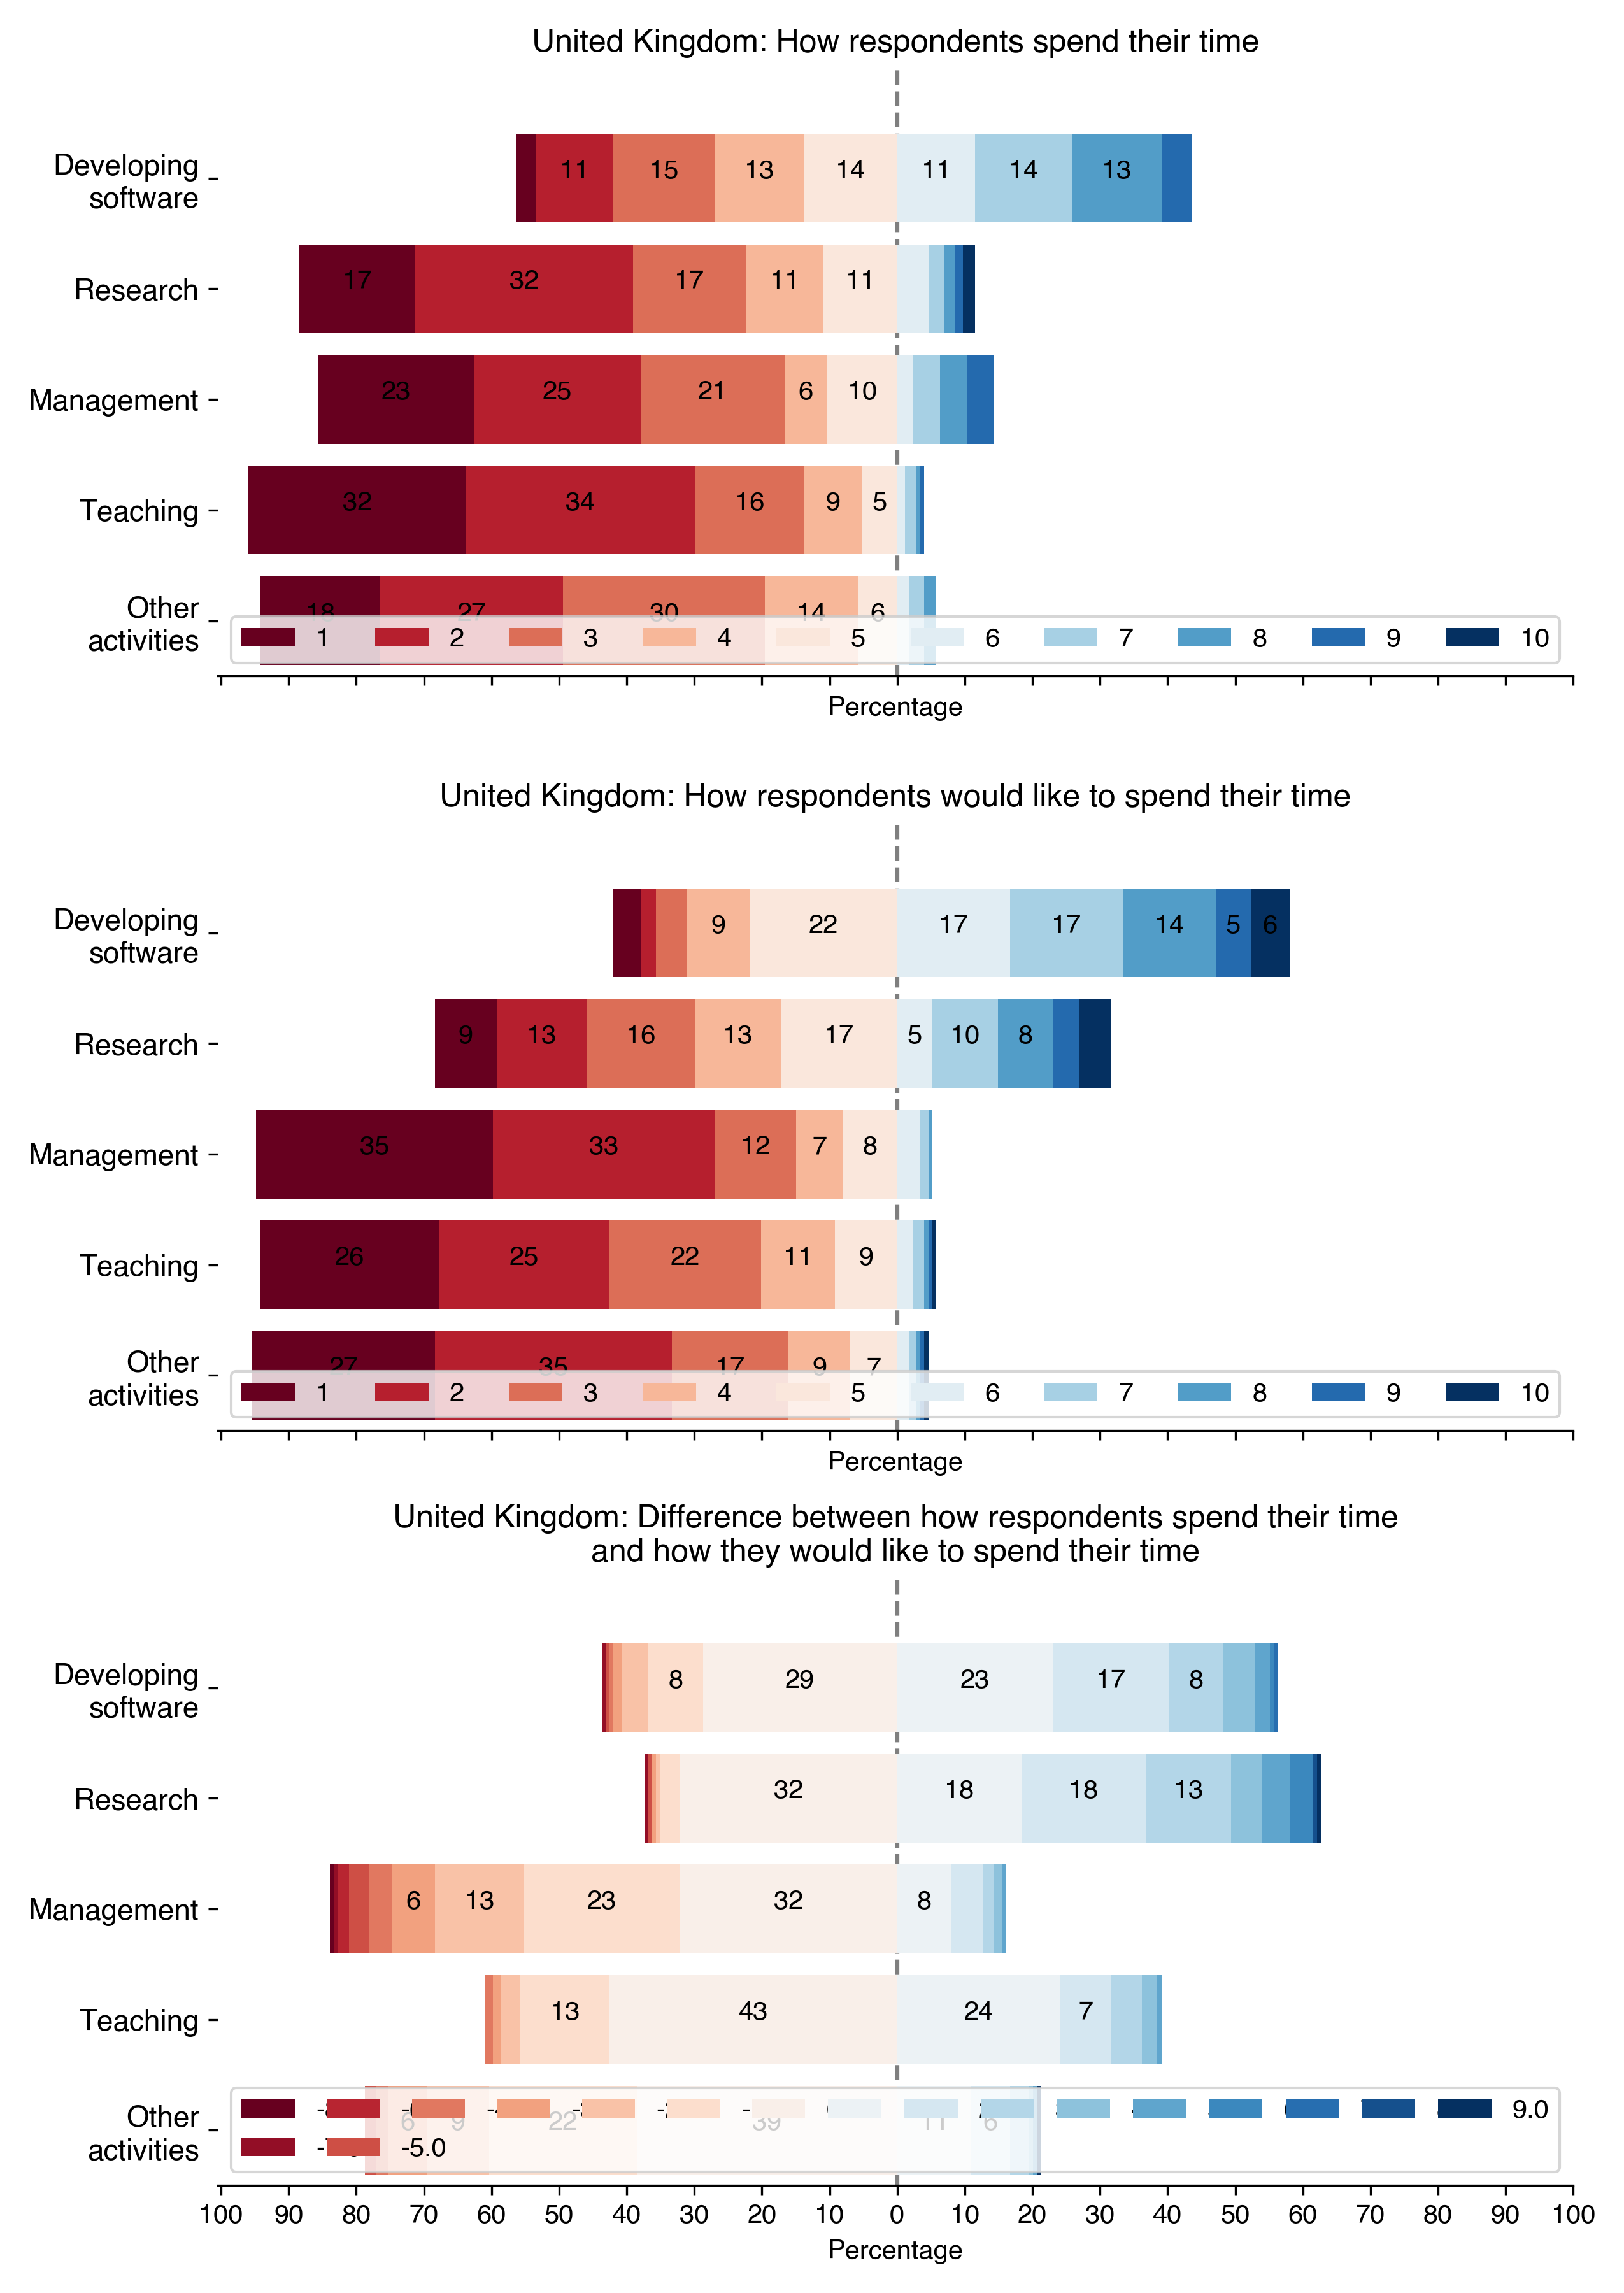
How time is spent
RSE/RSE are supposed to be an hybrid role, compared to pure software developer. They bring a knowledge from their field but also are developing software. To capture this different tasks they may do during their work, we asked them how they spend their time but also how they wish to spend their time to investigate any difference between what they do and what they want to do.
How to read the plots
Respondents were asked how much time is spent in a particular activity using a Likert scale from from 1 (None at all) to 10 (All my time).
The same questions asked them how much time they wanted to spend on these activities. With that it was possible to see if discrepancies exist between what they actually do and what they want to do.
To read the results, when the bars shift to the right (in blue), it means they reported positive values (from 6 to 10); when the bars are on the left (in red), it means they reported more negative values (relative to the scale). Each bar has a number that represents the percentage of participants that selected that value. The total bar represents 100%.
To calculate the difference between what they want and what they do, we subtract the answers to the the time that they wished to have spent from the the answer to actual time spent. It is therefore possible to understand the results as:
- The result is zero: The time spent matches, they do as much as they want.
- The result is negative: They wish to spend less time to do that activity
- The result is positive: They wish to spend more time to do that activity
Questions in this section
All questions were asked on a 1 to 10 Likert scale.
- On average, how much of your time is spent developing software?
- On average, how much of your time is spent on research?
- On average, how much of your time is spent on management?
- On average, how much of your time is spent on teaching?
- On average, how much of your time is spent on other activities?
Previous employment
Several questions were about the participants’ previous job. The idea is to collect insights of their career path and understand what their motivations are to be an RSE.
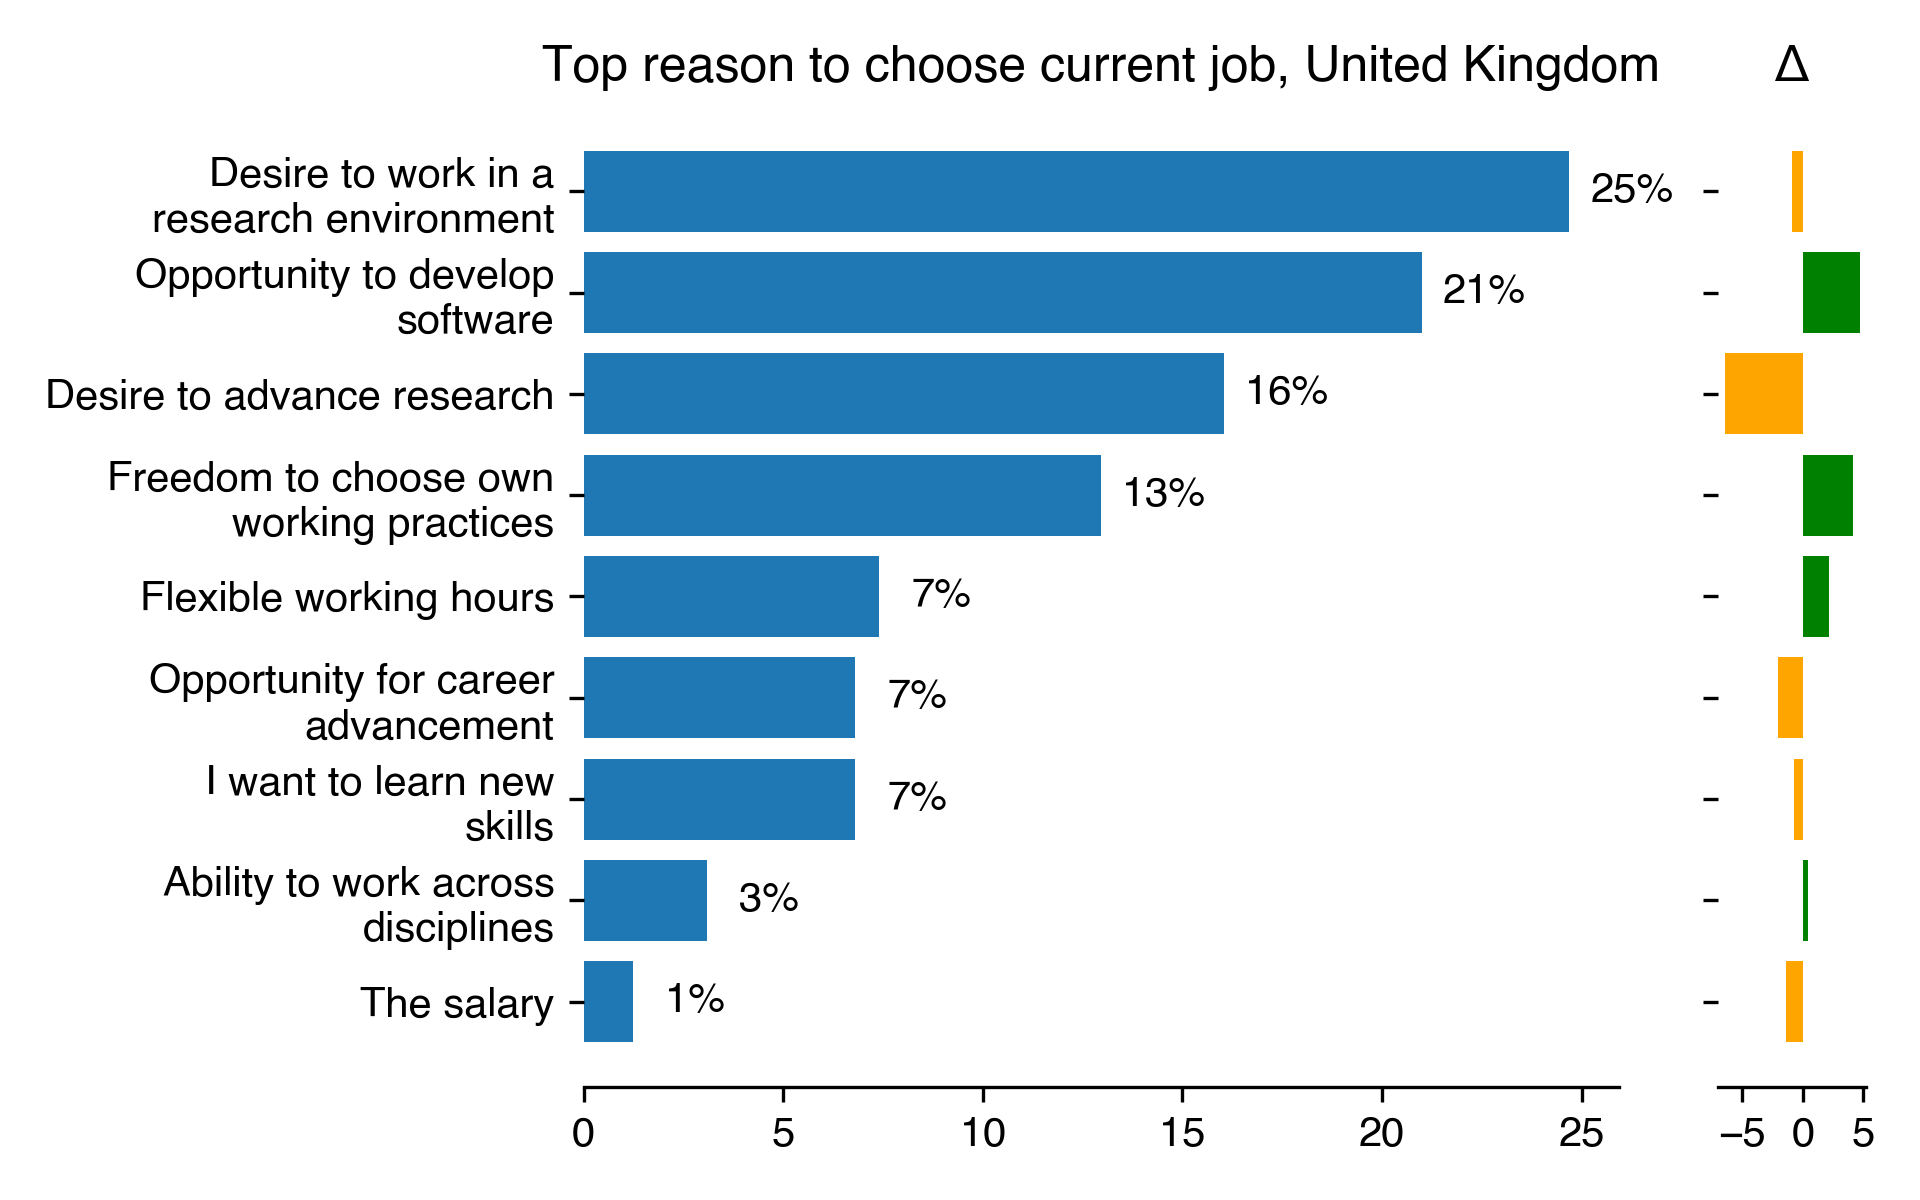
We also asked the participants to rank the reasons why they chose their actual position among 8 different ones:
- Desire to work in a research environment
- Freedom to choose own working practices
- Desire to advance research
- I want to learn new skills
- Opportunity to develop software
- Flexible working hours
- Ability to work across disciplines
- Opportunity for career advancement
- The salary
Questions in this section
- Where was your previous job based? (single choice)
- Rank the following factors dependent on how strongly they influenced your decision to accept your current position (ranking)
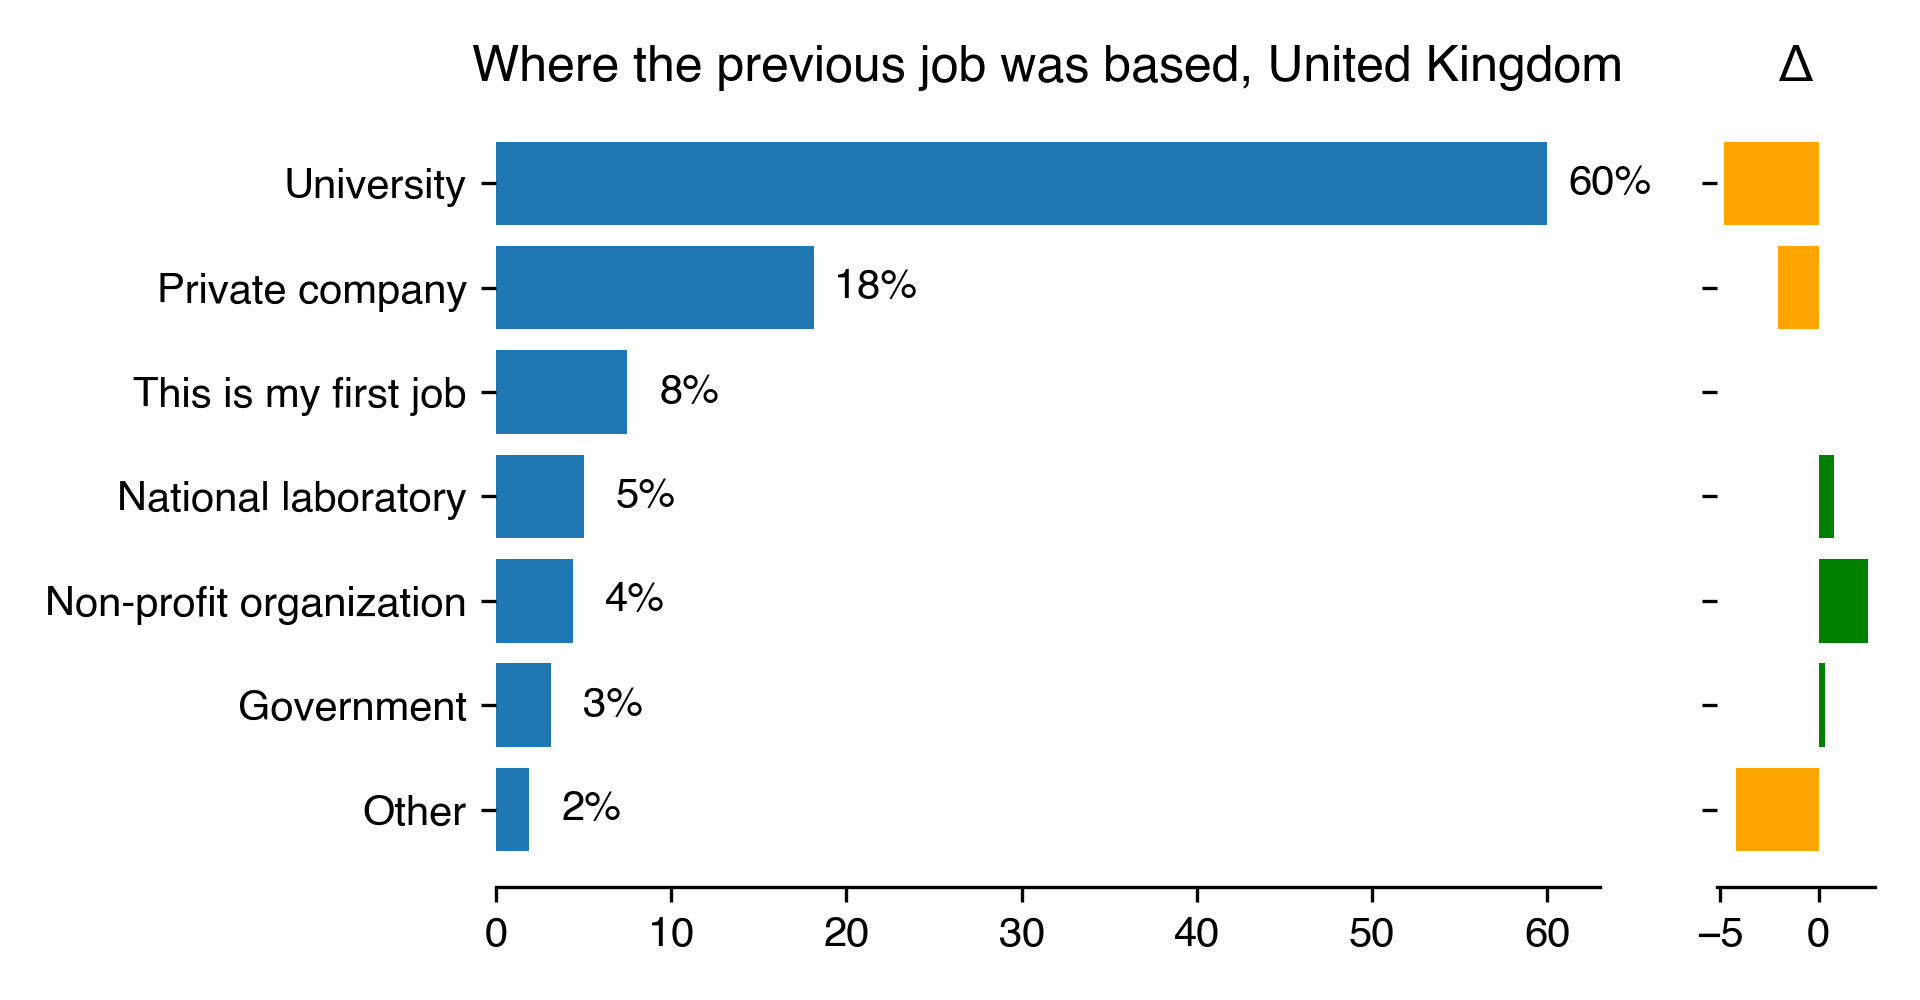
Where the previous job was based
| Where the previous job was based for United Kingdom | Count | Percentage | Percentage in 2018 | Difference with previous year |
|---|---|---|---|---|
| University | 96 | 60 | 64.79 | -4.79 |
| Private company | 29 | 18.12 | 20.19 | -2.06 |
| This is my first job | 12 | 7.5 | nan | nan |
| National laboratory | 8 | 5 | 4.23 | 0.77 |
| Non-profit organization | 7 | 4.38 | 1.88 | 2.5 |
| Government | 5 | 3.12 | 2.82 | 0.31 |
| Other | 3 | 1.88 | 6.1 | -4.23 |
What were the reasons to choose the current job
| Top reason to choose current job for United Kingdom | Count | Percentage | Percentage in 2018 | Difference with previous year |
|---|---|---|---|---|
| Desire to work in a research environment | 40 | 24.69 | 25.55 | -0.86 |
| Opportunity to develop software | 34 | 20.99 | 16.3 | 4.69 |
| Desire to advance research | 26 | 16.05 | 22.47 | -6.42 |
| Freedom to choose own working practices | 21 | 12.96 | 8.81 | 4.15 |
| Flexible working hours | 12 | 7.41 | 5.29 | 2.12 |
| Opportunity for career advancement | 11 | 6.79 | 8.81 | -2.02 |
| I want to learn new skills | 11 | 6.79 | 7.49 | -0.7 |
| Ability to work across disciplines | 5 | 3.09 | 2.64 | 0.44 |
| The salary | 2 | 1.23 | 2.64 | -1.41 |
Collaboration and training
Questions in this section:
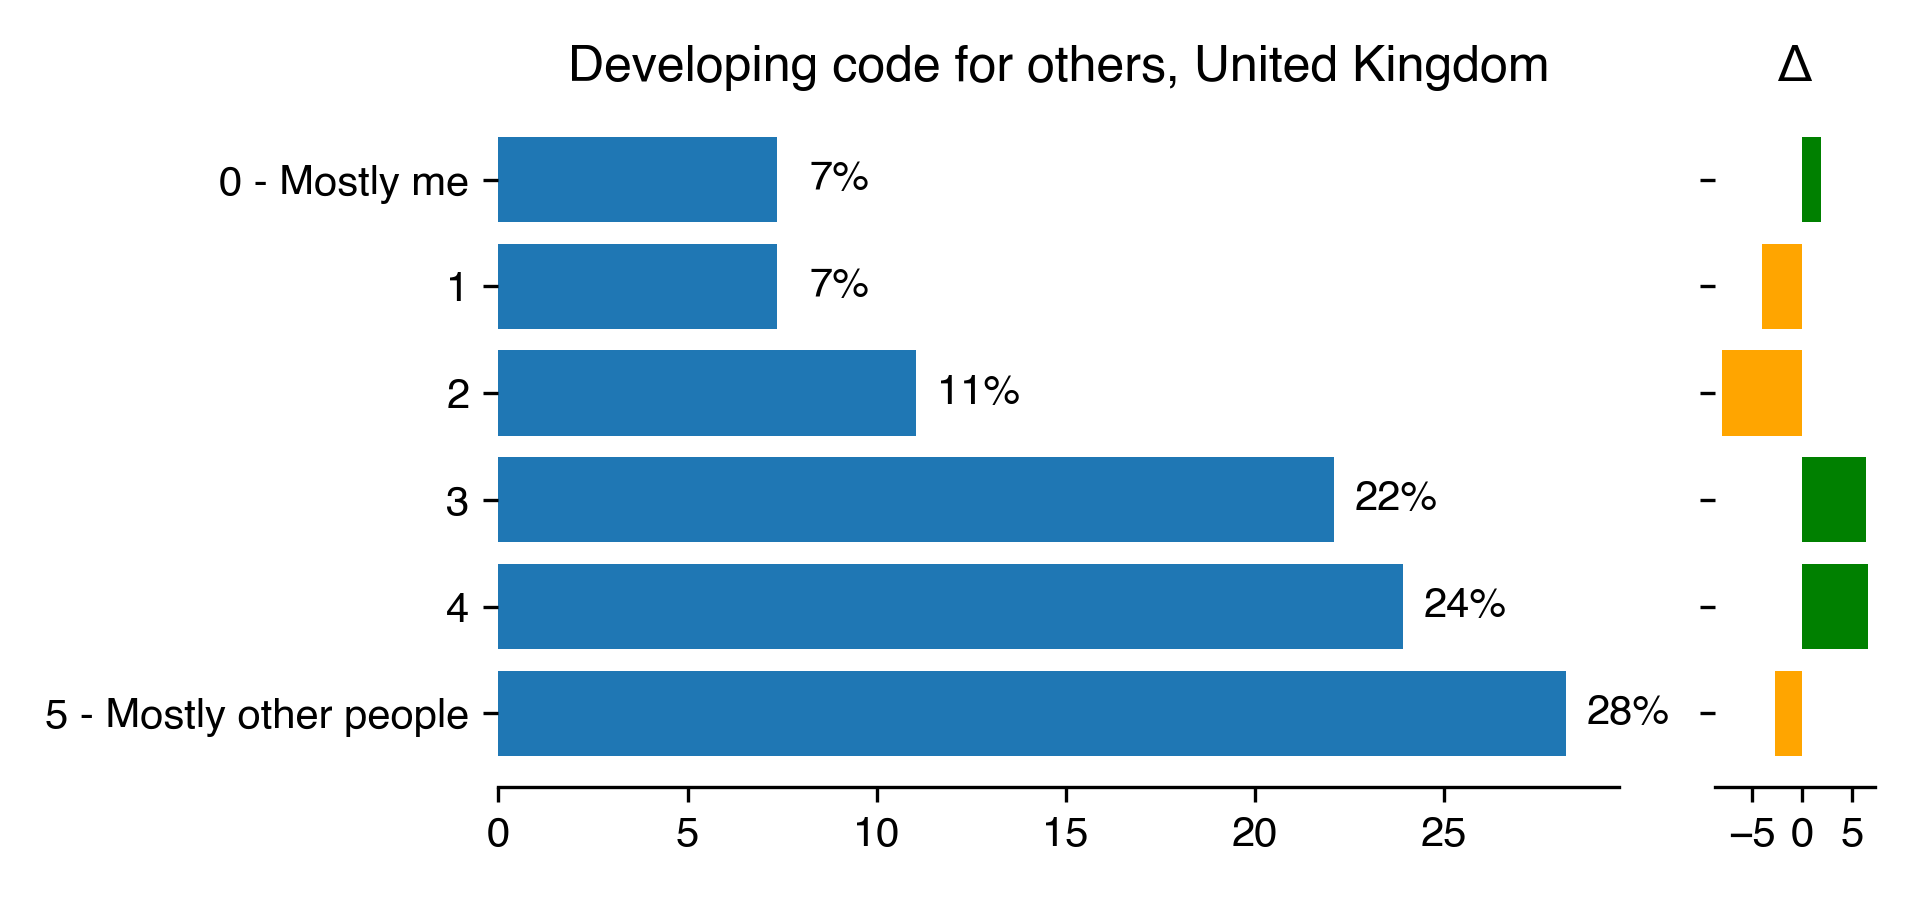
- Who uses the code that you write? (one choice)
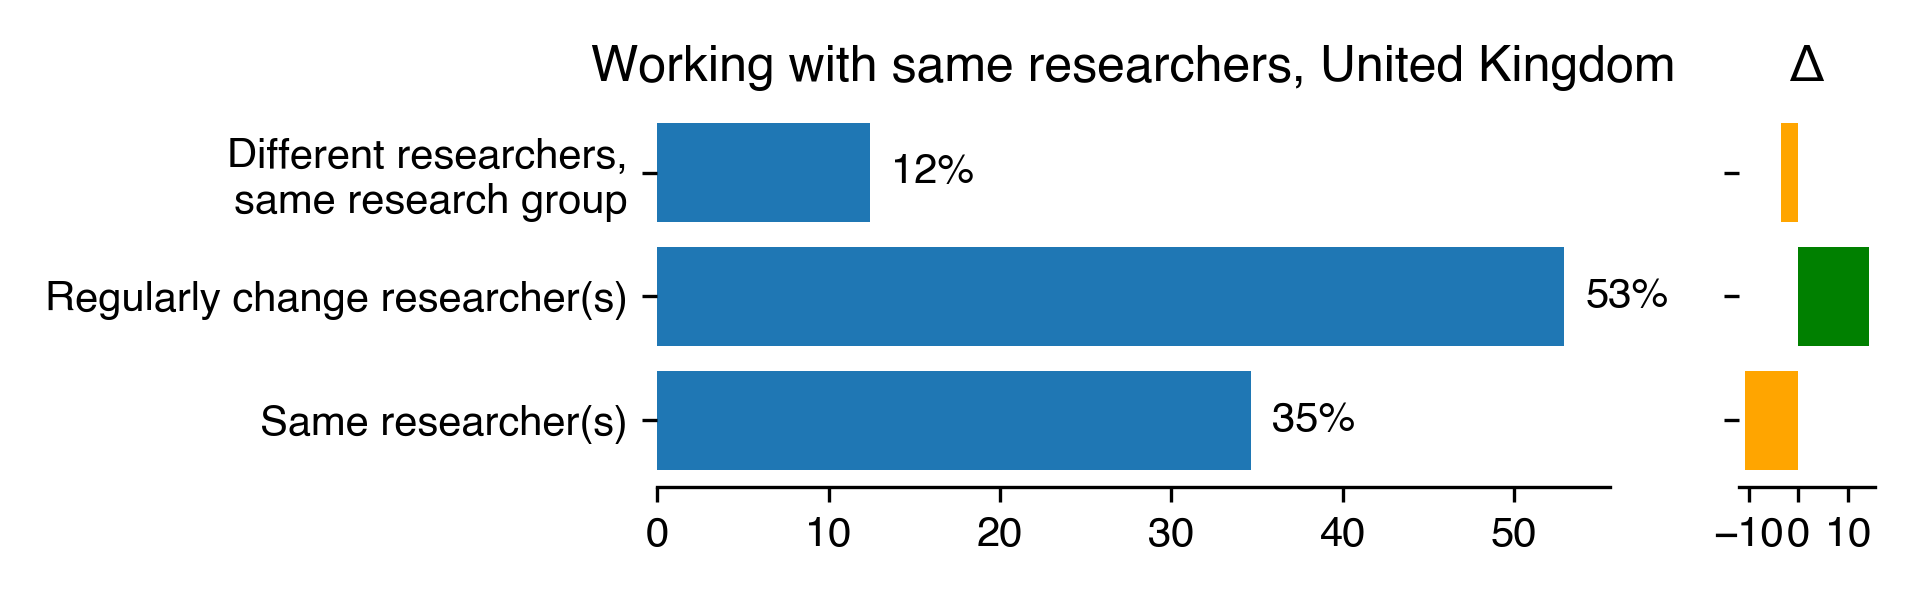
- Do you always work with the same researchers, or do you regularly change the researchers you work with? (one choice)
- Are you part of a dedicated research software group within your institution? (yes-no)
- How many software projects are you currently involved in? (numeric)
- How many people who develop software typically work on your projects? (numeric)
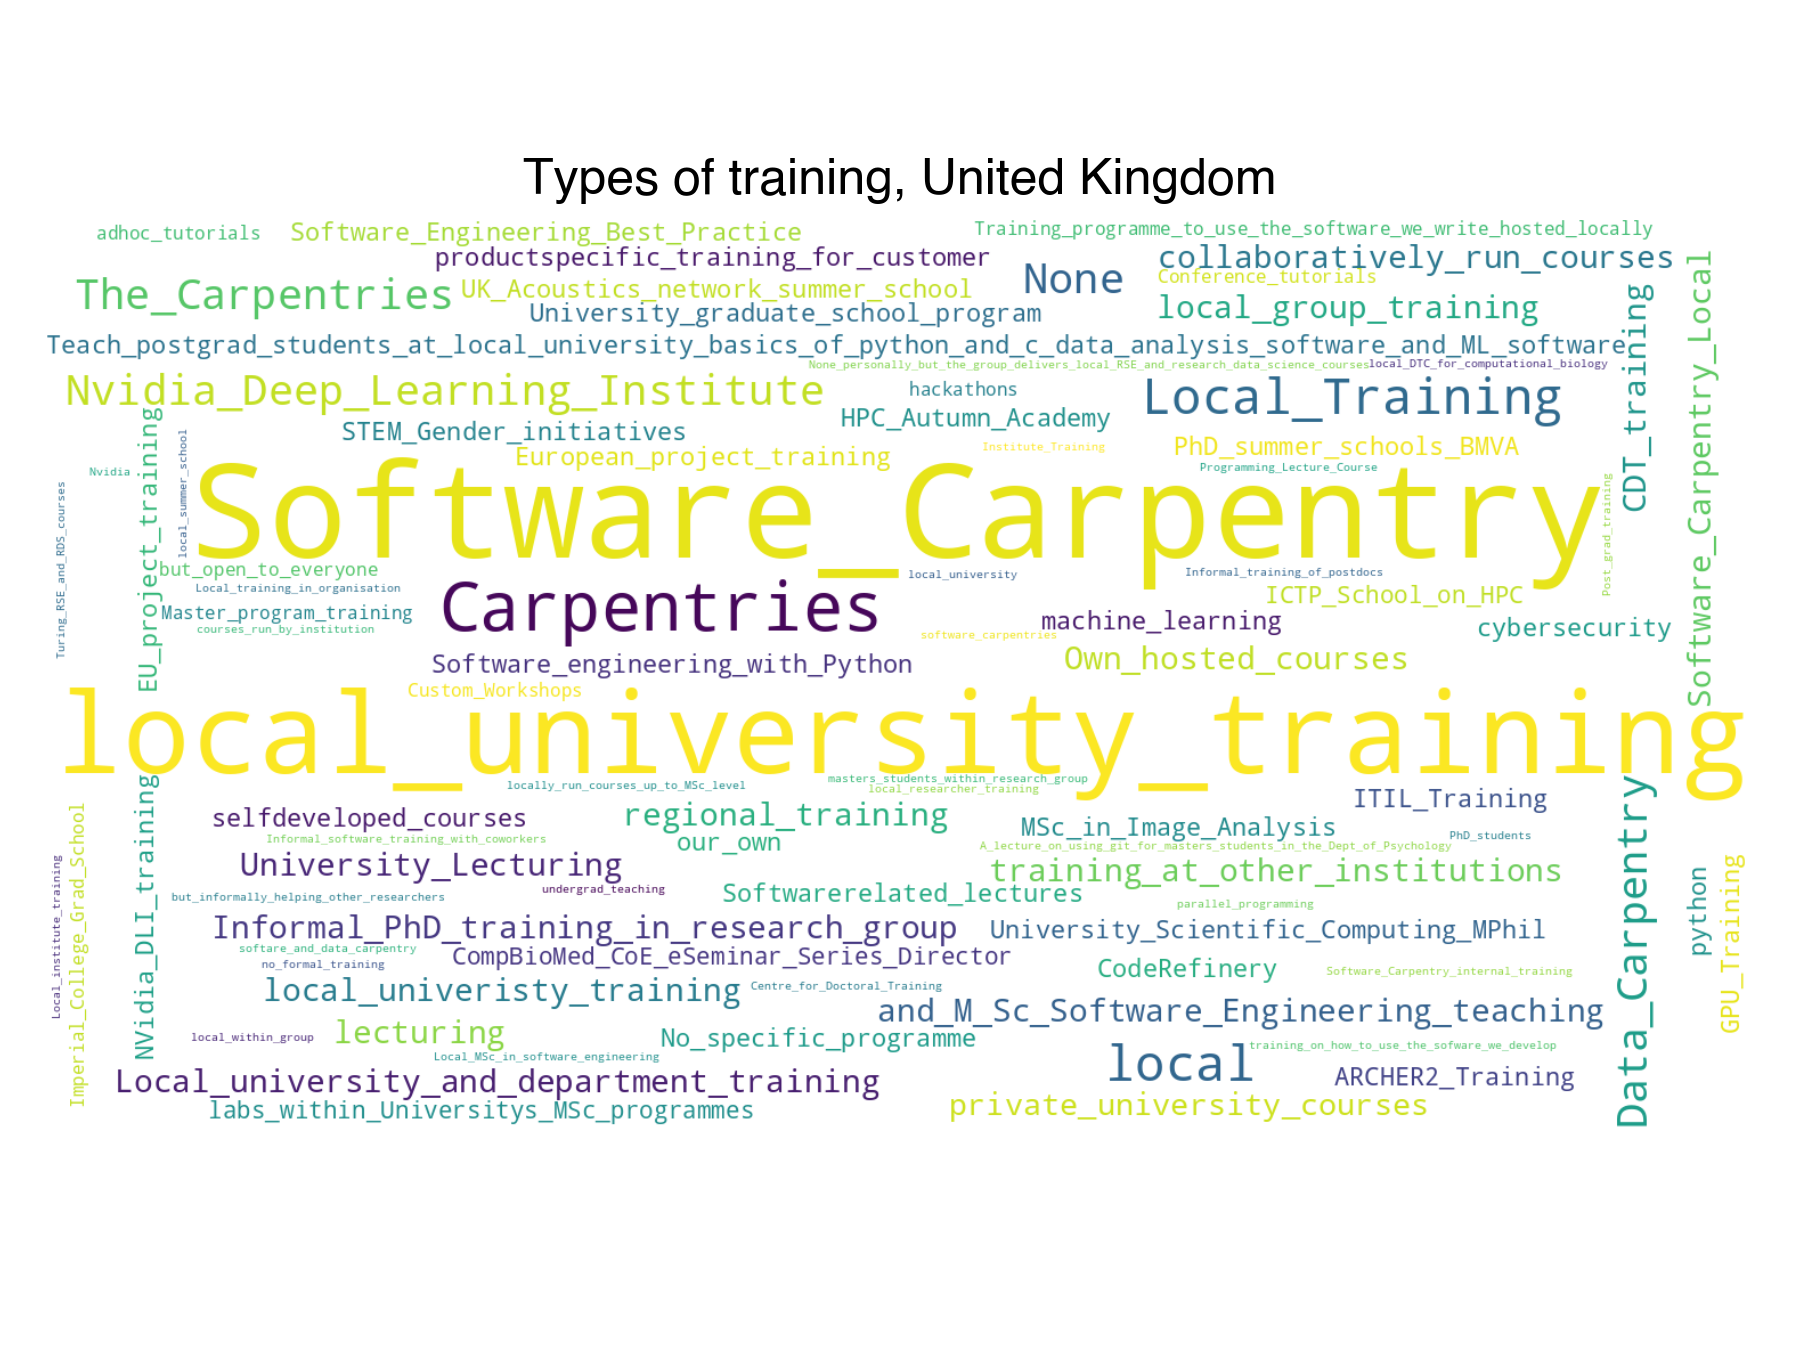
- On average, how many times a year do you take part in providing training? (numeric)
- What training programs are you involved with? (free text)
Developing code for others
| Developing code for others for United Kingdom | Count | Percentage | Percentage in 2018 | Difference with previous year |
|---|---|---|---|---|
| 0 - Mostly me | 12 | 7.36 | 5.51 | 1.85 |
| 1 | 12 | 7.36 | 11.44 | -4.08 |
| 2 | 18 | 11.04 | 19.07 | -8.02 |
| 3 | 36 | 22.09 | 15.68 | 6.41 |
| 4 | 39 | 23.93 | 17.37 | 6.55 |
| 5 - Mostly other people | 46 | 28.22 | 30.93 | -2.71 |
Working with same researchers
| Working with same researchers for United Kingdom | Count | Percentage | Percentage in 2018 | Difference with previous year |
|---|---|---|---|---|
| Different researchers, same research group | 19 | 12.42 | 15.89 | -3.47 |
| Regularly change researcher(s) | 81 | 52.94 | 38.79 | 14.16 |
| Same researcher(s) | 53 | 34.64 | 45.33 | -10.69 |
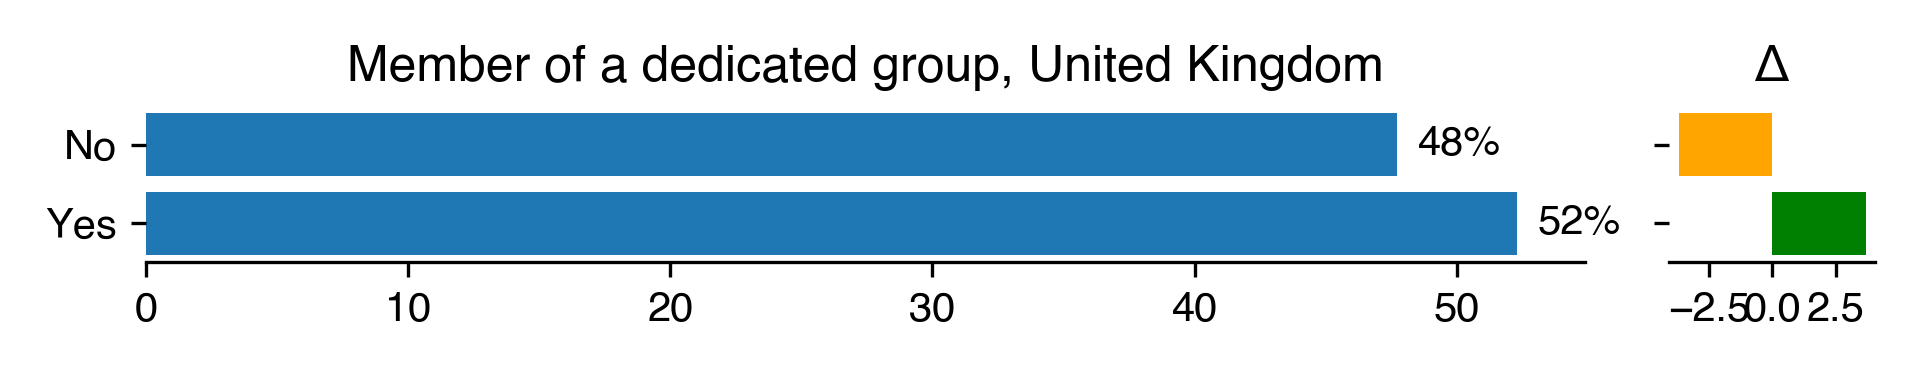
Part of dedicated group
| Member of a dedicated group for United Kingdom | Count | Percentage | Percentage in 2018 | Difference with previous year |
|---|---|---|---|---|
| No | 73 | 47.71 | 51.4 | -3.69 |
| Yes | 80 | 52.29 | 48.6 | 3.69 |
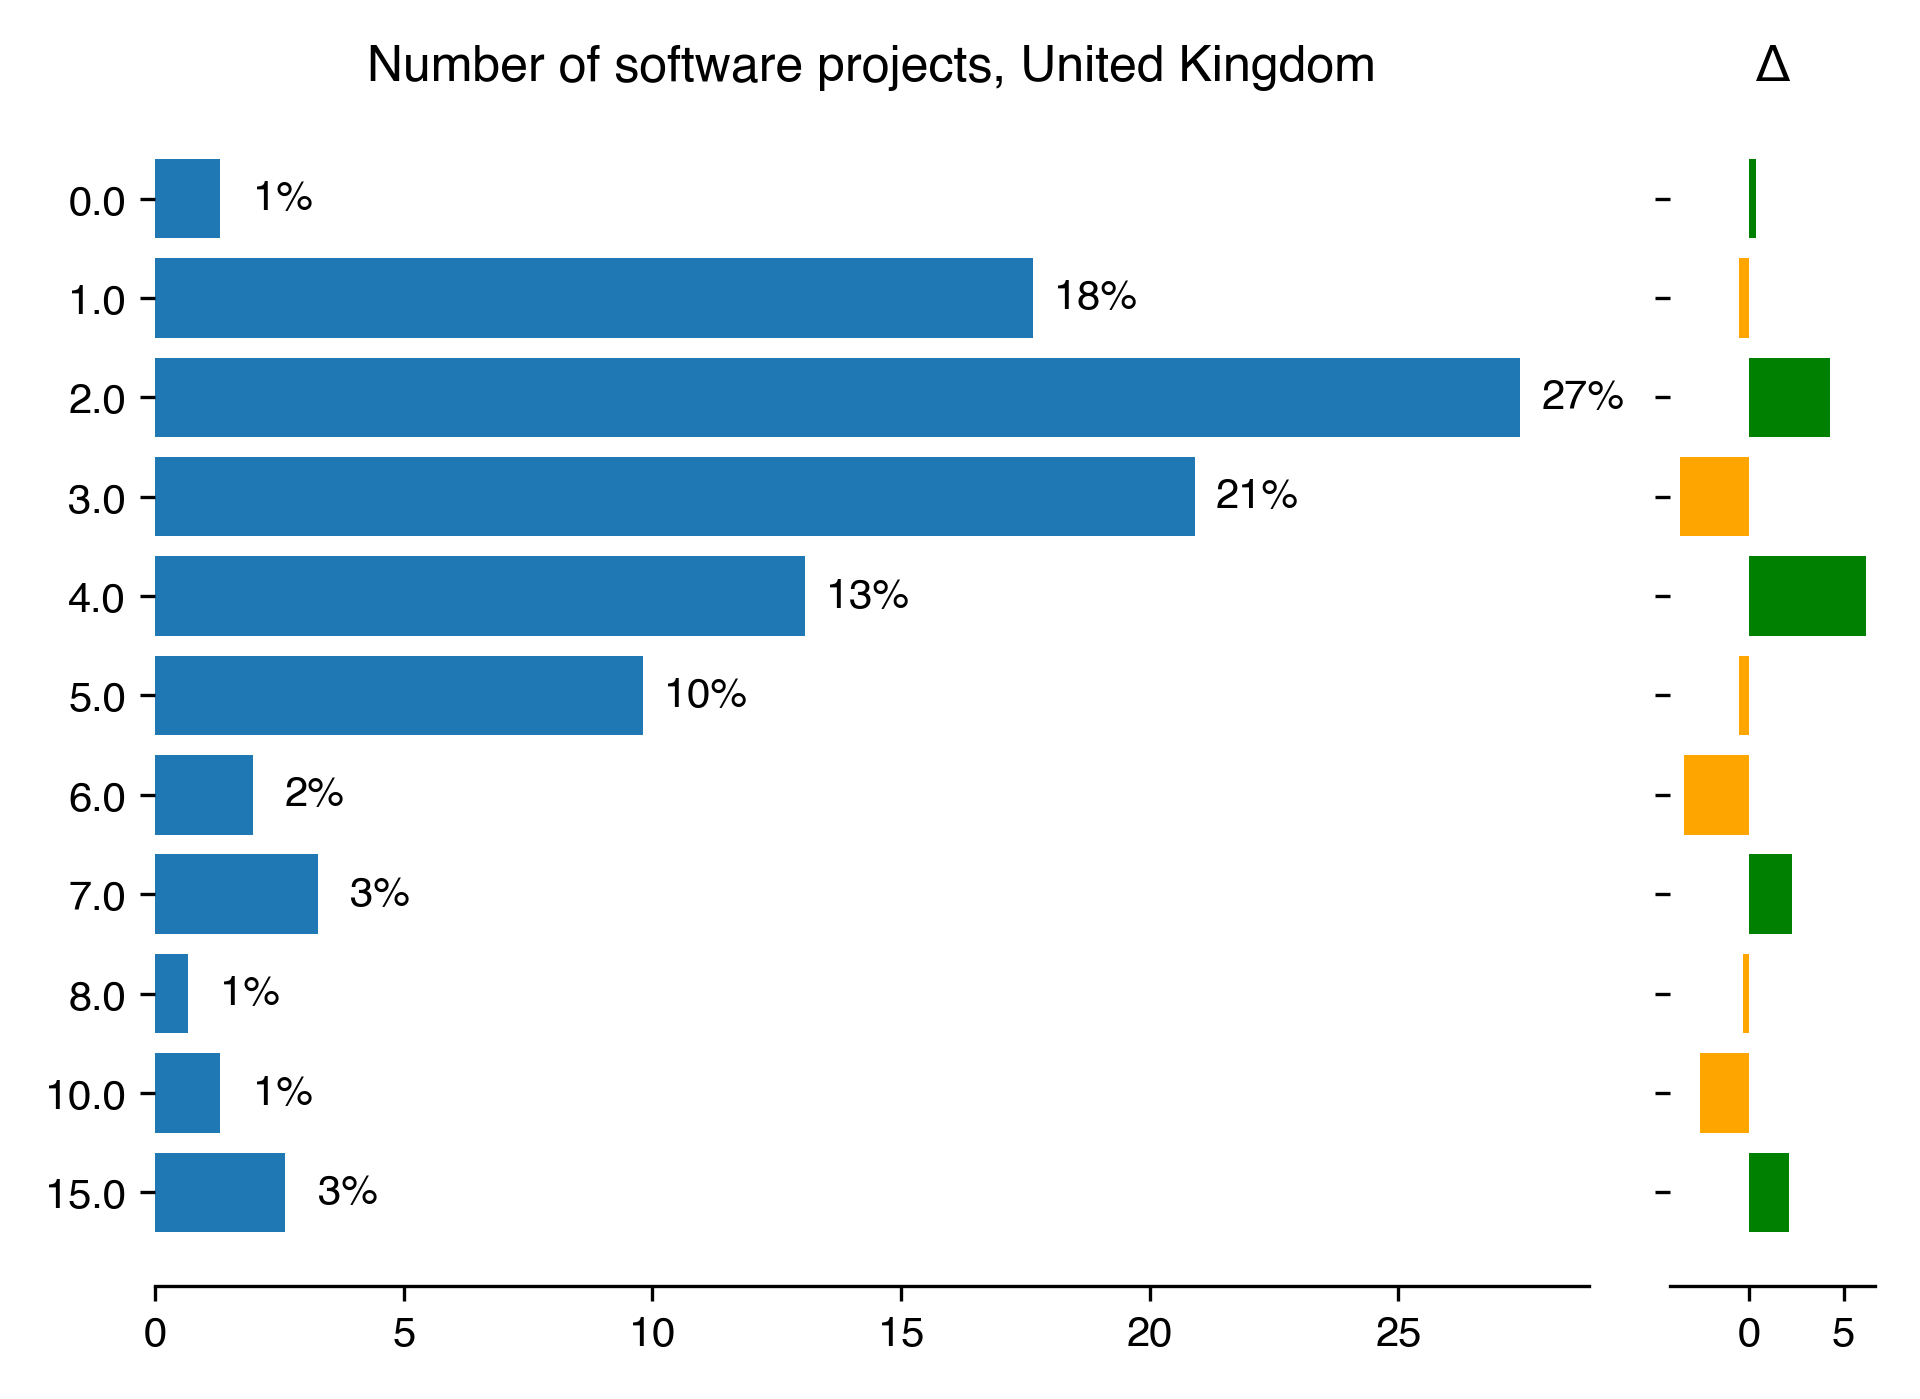
Number of projects
| Number of software projects for United Kingdom | Count | Percentage | Percentage in 2018 | Difference with previous year |
|---|---|---|---|---|
| 0 | 2 | 1.31 | 0.99 | 0.32 |
| 1 | 27 | 17.65 | 18.23 | -0.58 |
| 2 | 42 | 27.45 | 23.15 | 4.3 |
| 3 | 32 | 20.92 | 24.63 | -3.72 |
| 4 | 20 | 13.07 | 6.9 | 6.18 |
| 5 | 15 | 9.8 | 10.34 | -0.54 |
| 6 | 3 | 1.96 | 5.42 | -3.46 |
| 7 | 5 | 3.27 | 0.99 | 2.28 |
| 8 | 1 | 0.65 | 0.99 | -0.33 |
| 10 | 2 | 1.31 | 3.94 | -2.63 |
| 15 | 4 | 2.61 | 0.49 | 2.12 |
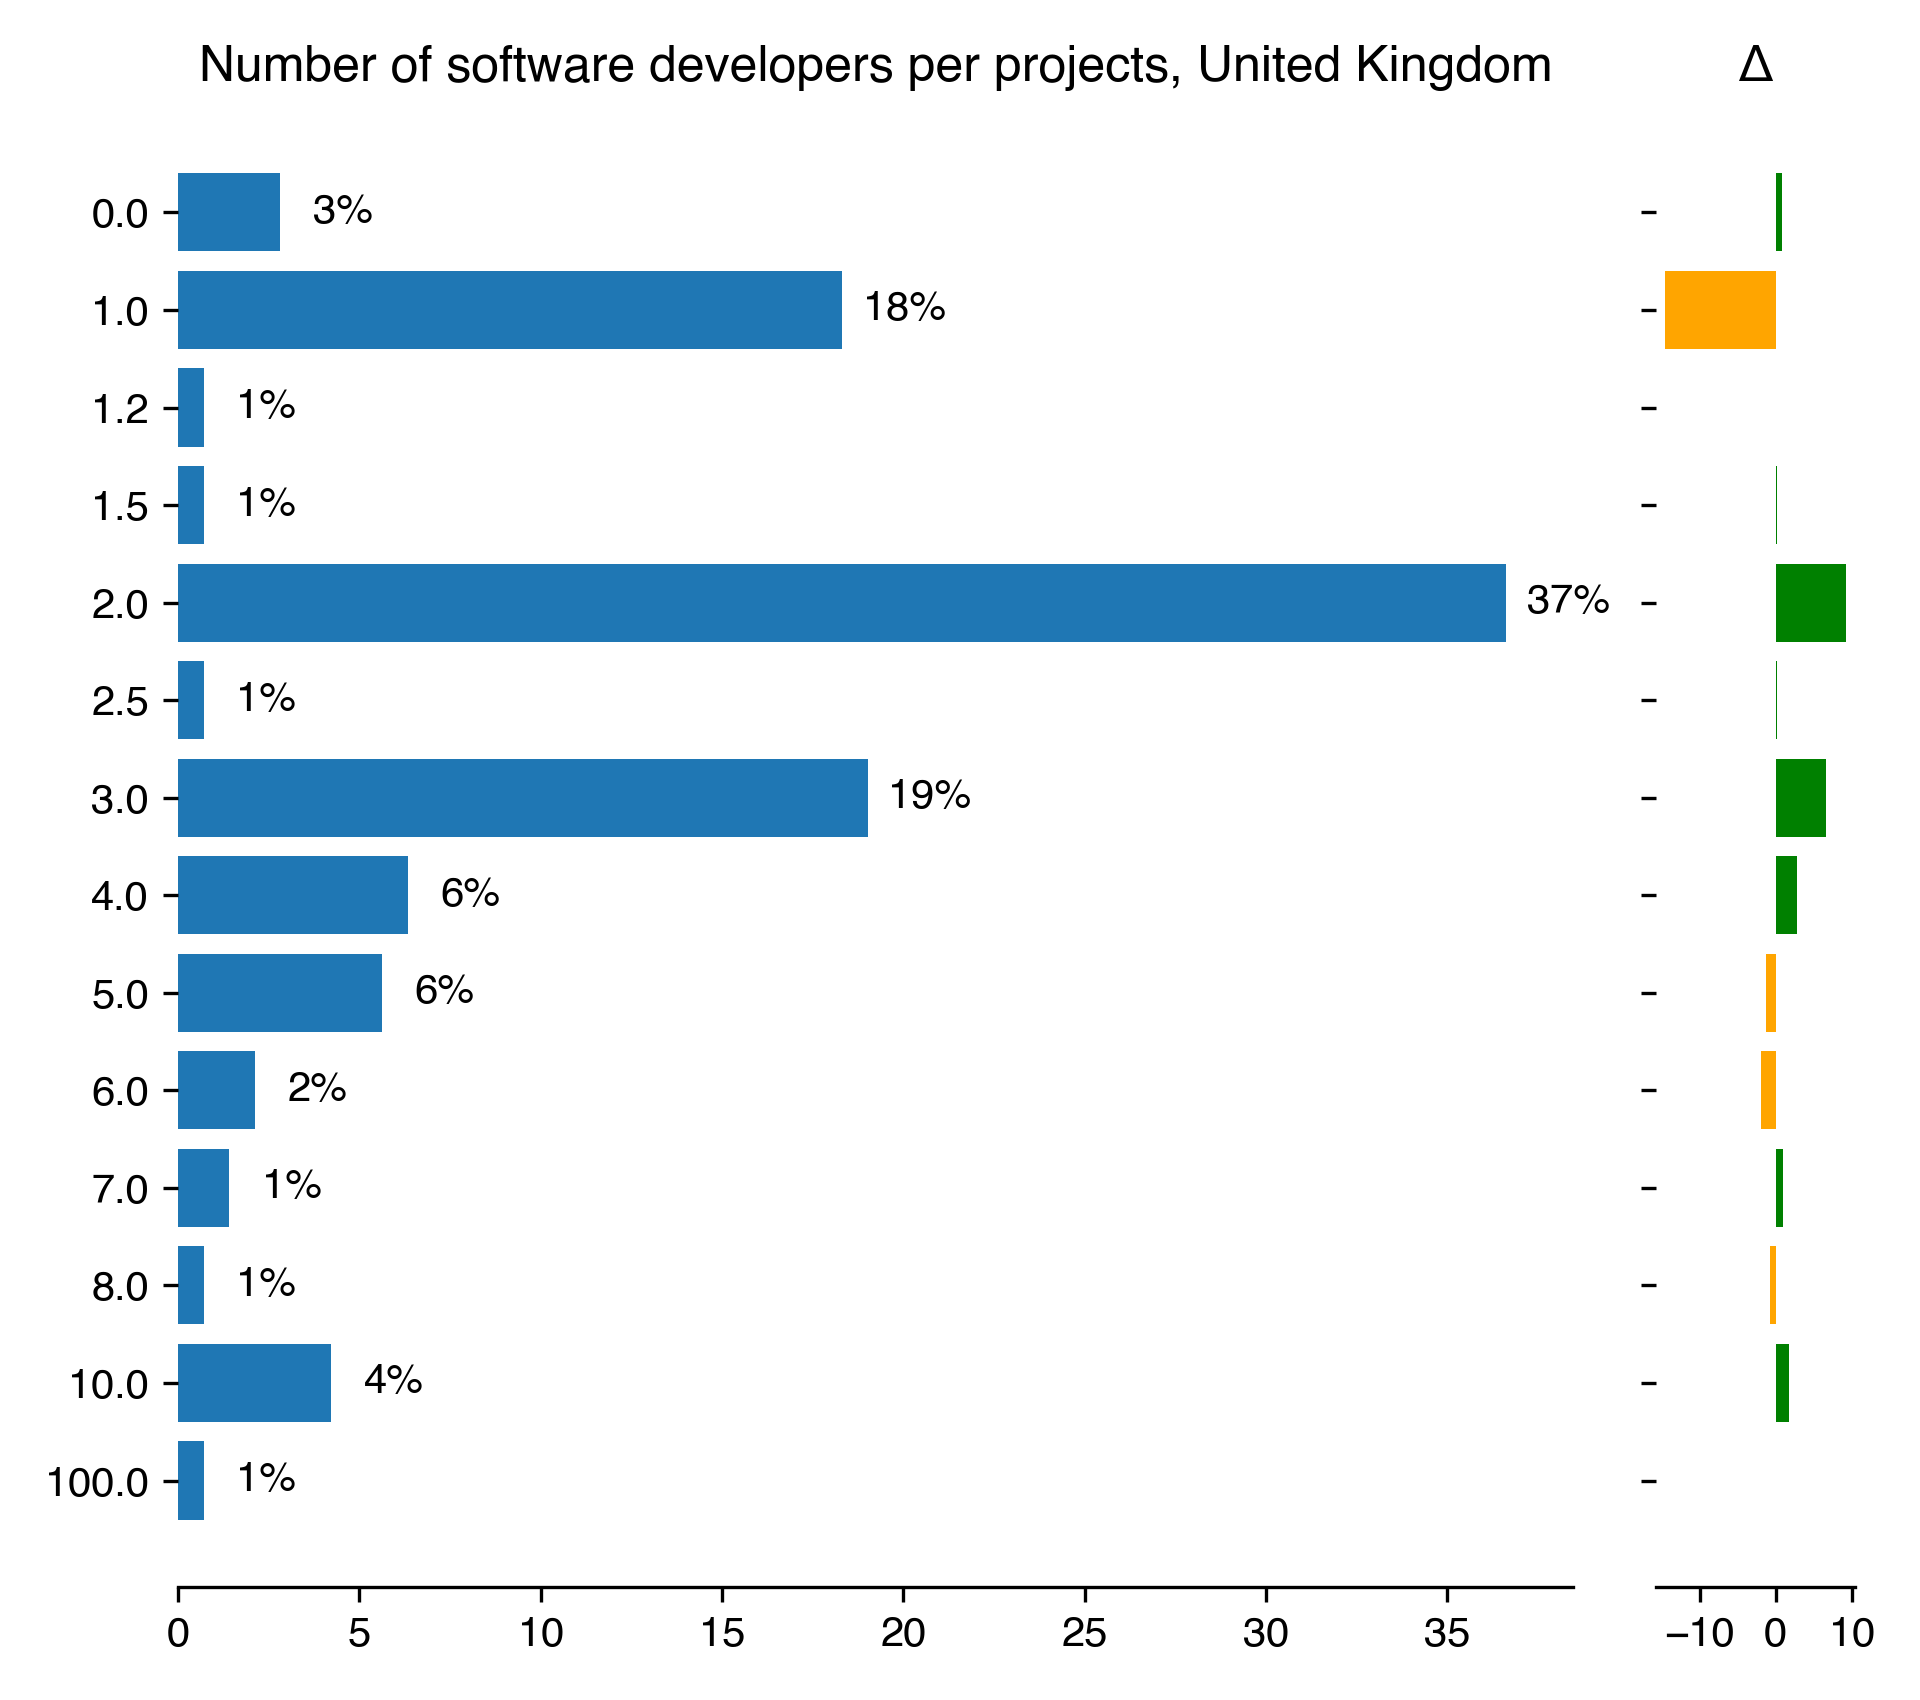
| Number of software developers per projects for United Kingdom | Count | Percentage | Percentage in 2018 | Difference with previous year |
|---|---|---|---|---|
| 0 | 4 | 2.82 | 1.99 | 0.83 |
| 1 | 26 | 18.31 | 32.84 | -14.53 |
| 1.2 | 1 | 0.7 | nan | nan |
| 1.5 | 1 | 0.7 | 0.5 | 0.21 |
| 2 | 52 | 36.62 | 27.36 | 9.26 |
| 2.5 | 1 | 0.7 | 0.5 | 0.21 |
| 3 | 27 | 19.01 | 12.44 | 6.58 |
| 4 | 9 | 6.34 | 3.48 | 2.86 |
| 5 | 8 | 5.63 | 6.97 | -1.33 |
| 6 | 3 | 2.11 | 3.98 | -1.87 |
| 7 | 2 | 1.41 | 0.5 | 0.91 |
| 8 | 1 | 0.7 | 1.49 | -0.79 |
| 10 | 6 | 4.23 | 2.49 | 1.74 |
| 100 | 1 | 0.7 | nan | nan |
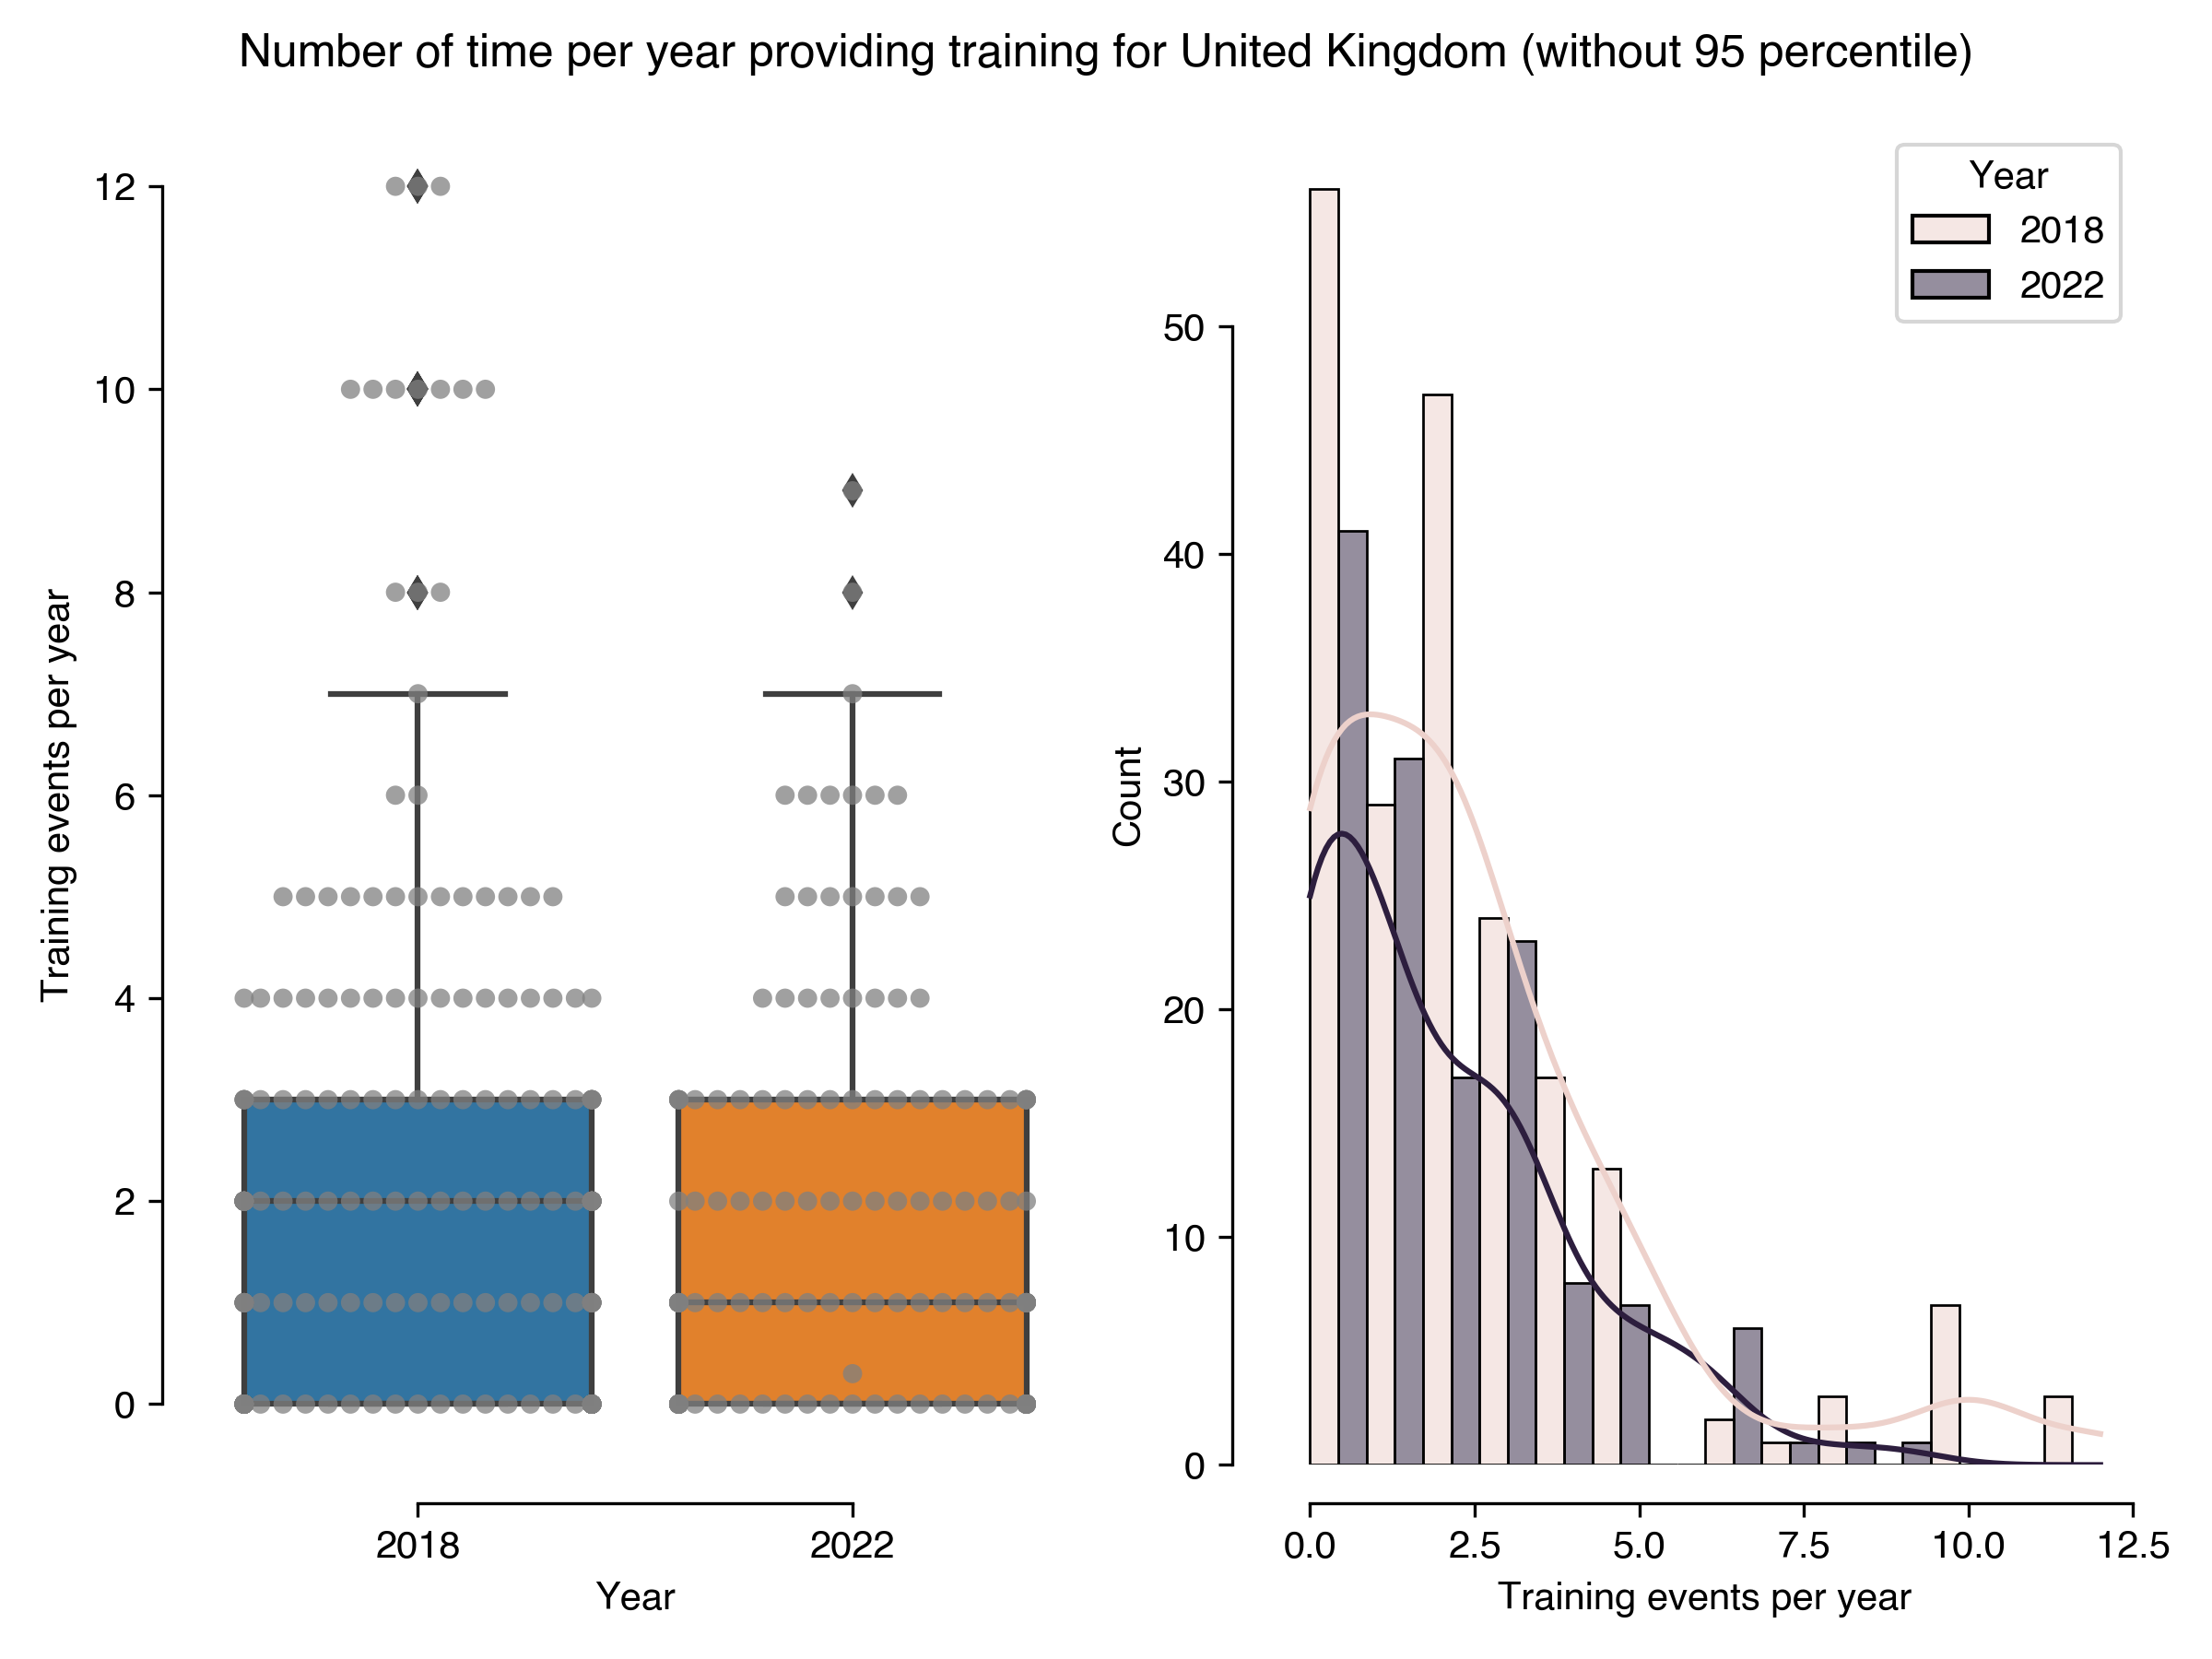
Training
| Number of time per year providing training for United Kingdom (without 95 percentile) | Results in 2022 | Results in 2018 |
|---|---|---|
| count | 136 | 202 |
| mean | 1.92 | 2.36 |
| std | 1.96 | 2.59 |
| min | 0 | 0 |
| 25% | 0 | 0 |
| 50% | 1 | 2 |
| 75% | 3 | 3 |
| max | 9 | 12 |
Publications and citations
RSEs is an hybrid role between a researcher and a software developer. We investigated both of these aspects concerning publication and dissemination of their work, one on the traditional aspect of it (publications and conference).
One essential aspect of career in academia is the publications and the conferences to gain recognition. However, the role of RSE being less about writing articles than creating the infrastructure and the software for the article to exist, there is some fear that they will fail to have recognition through the papers and conferences.
Questions in the section:
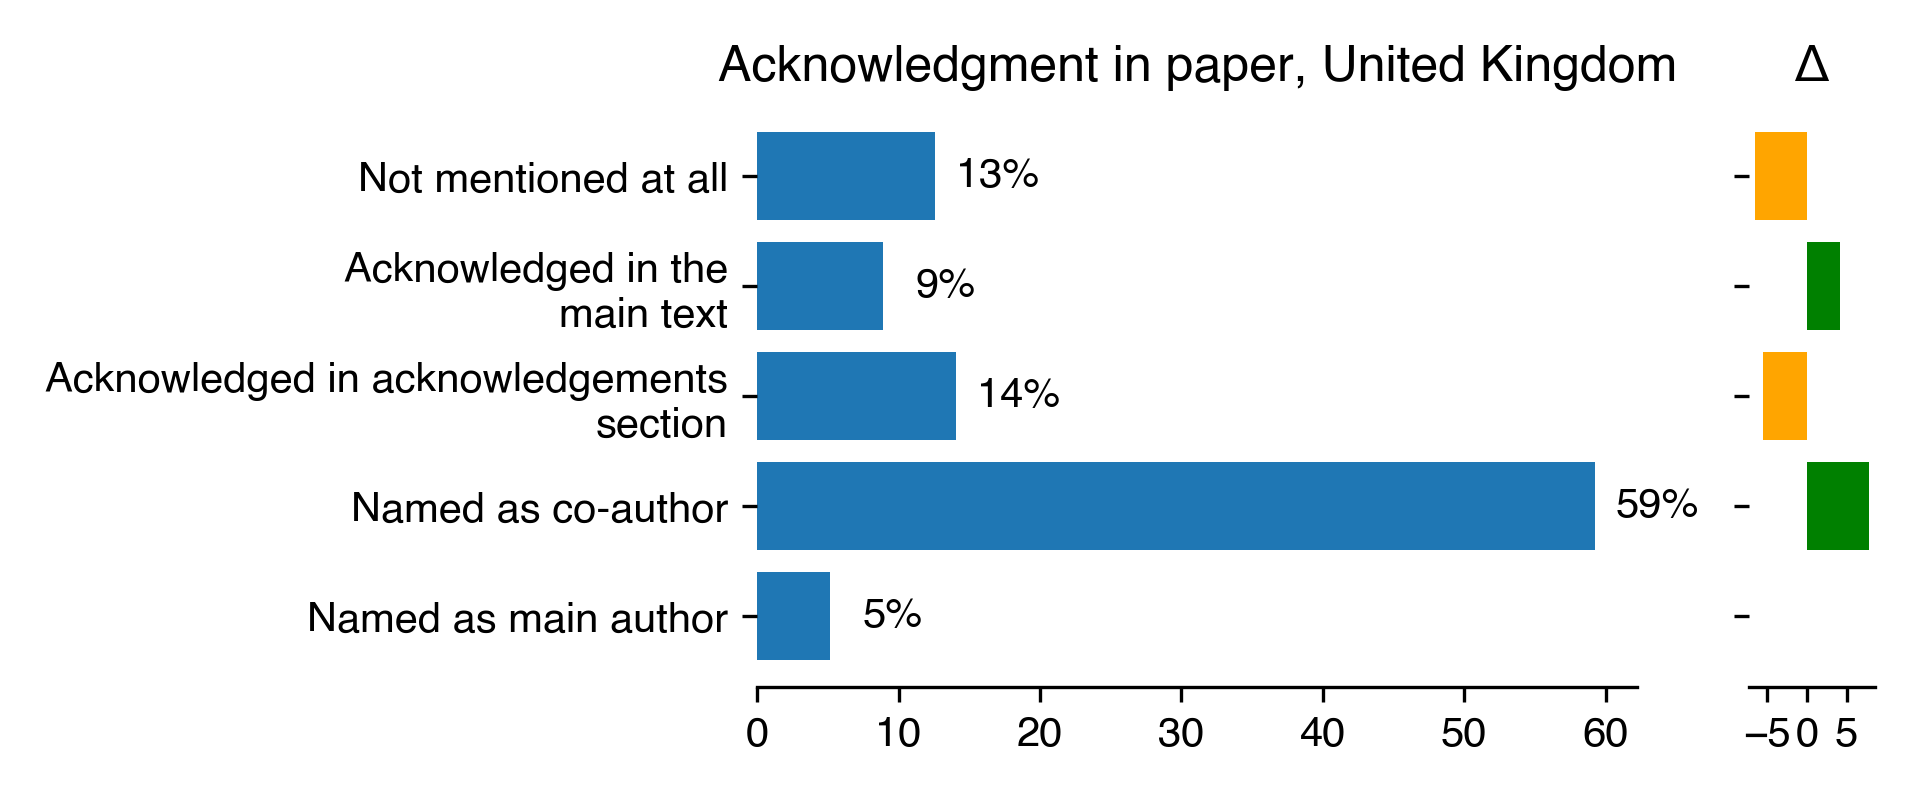
- In general, when your software contributes to a paper, are you acknowledged in that paper? (one choice)
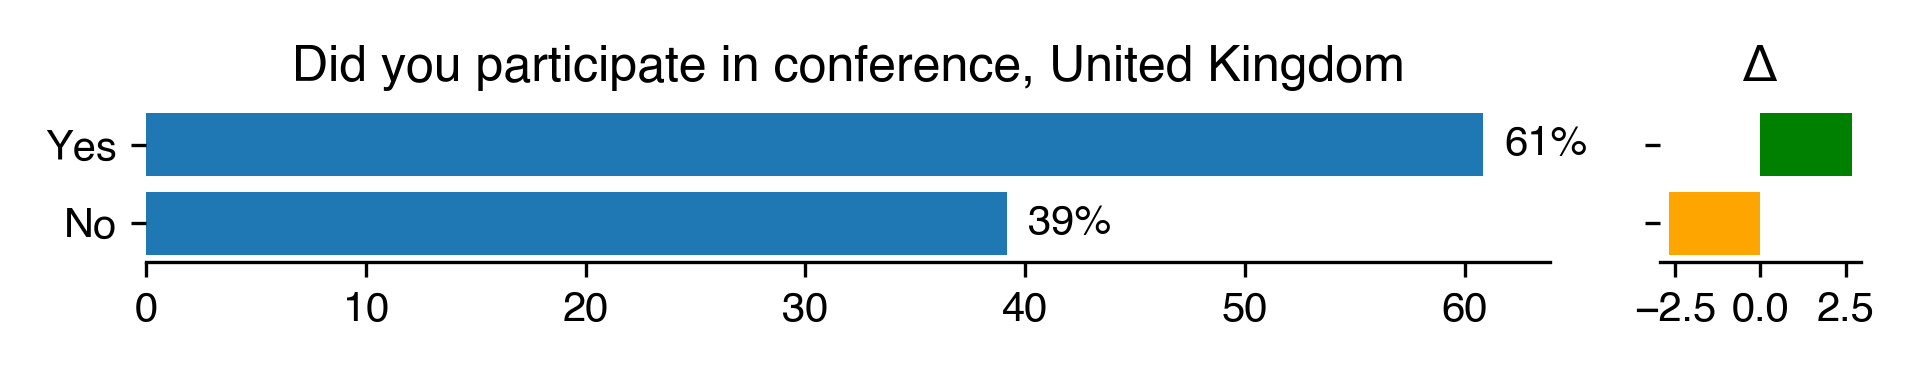
- Have you presented your software work at a conference or workshop? (yes-no)
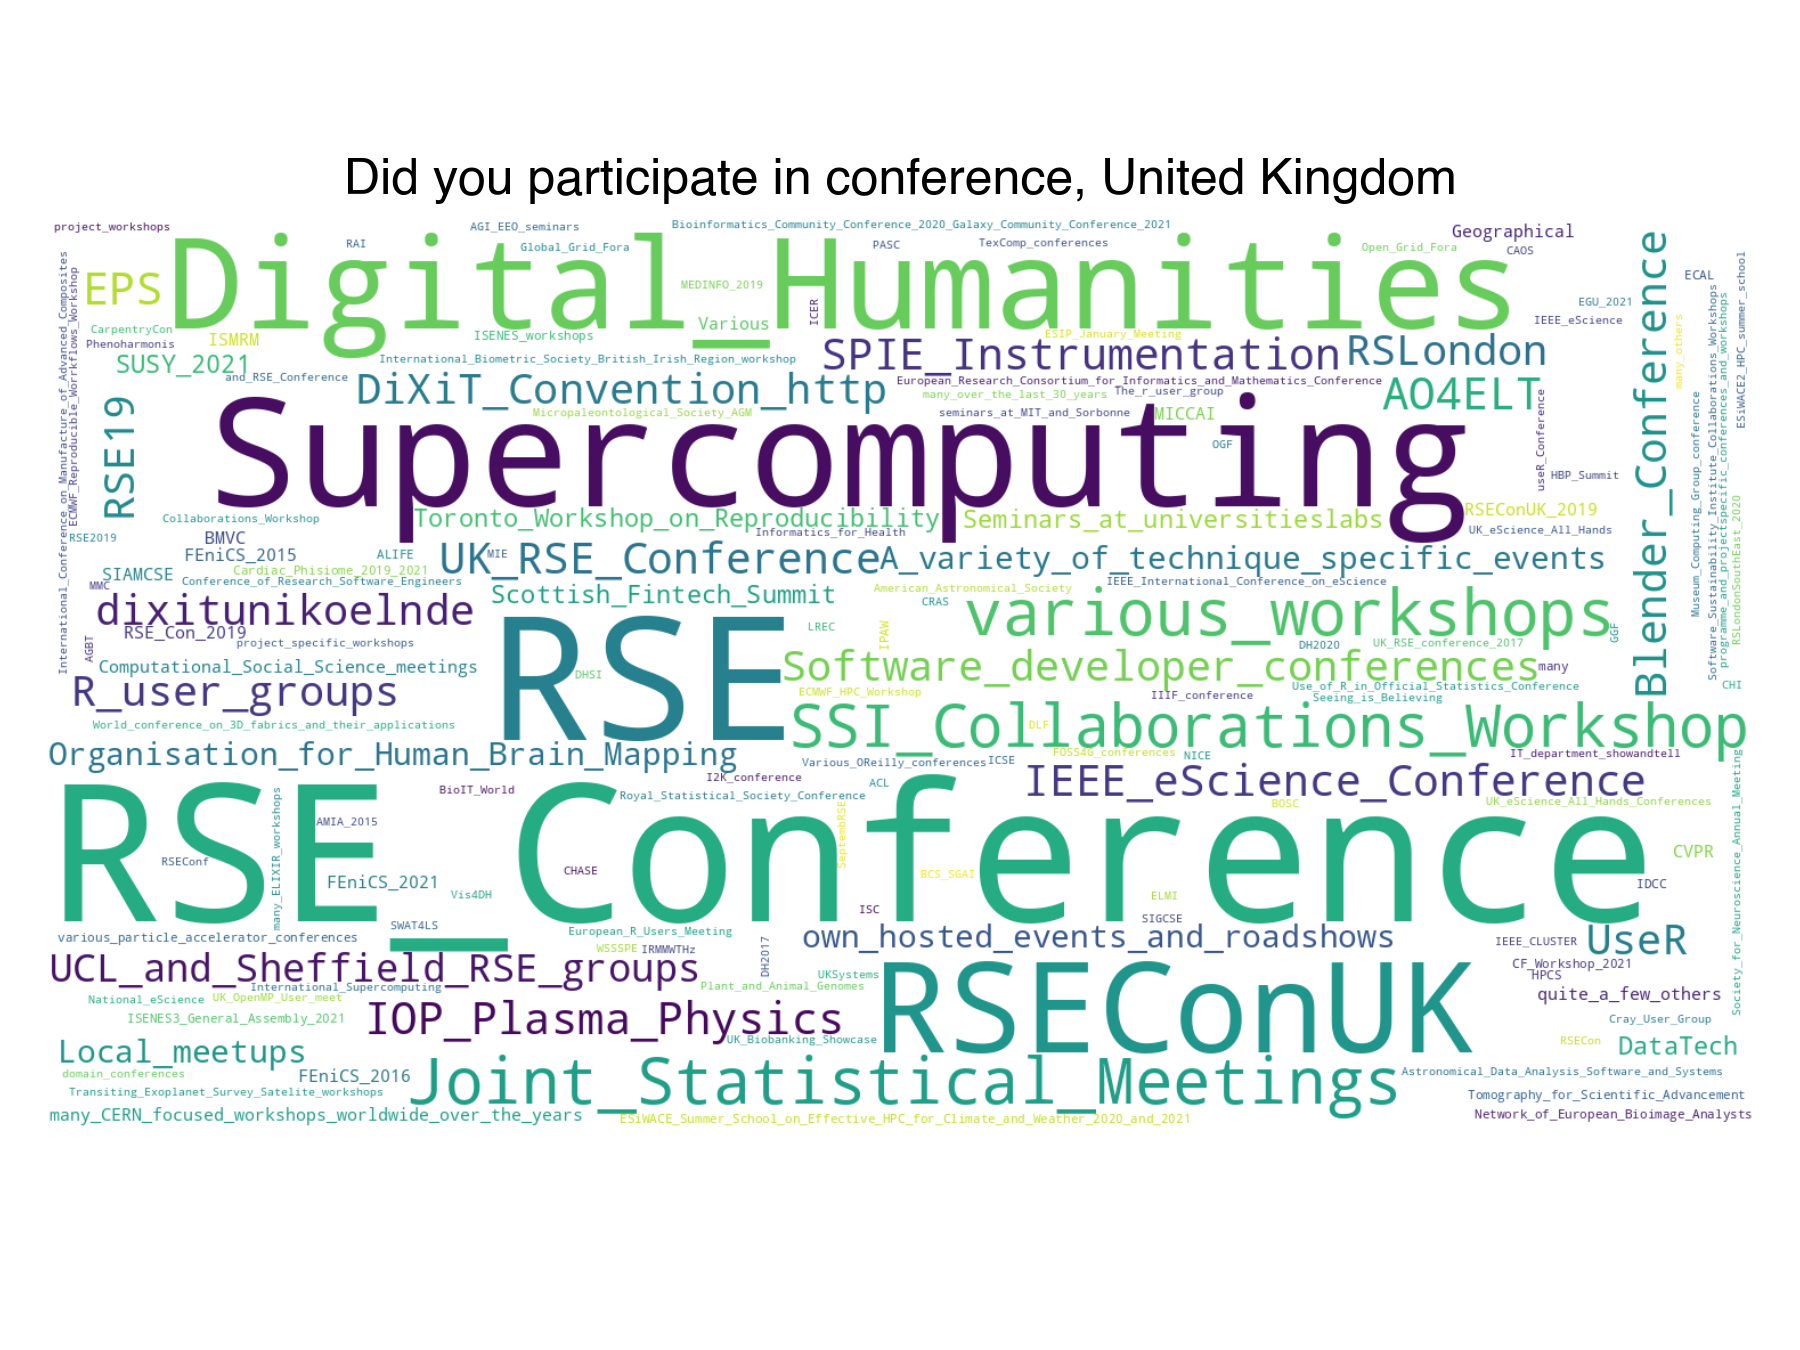
- At which conference(s)/workshop(s) have you presented your software work? (free text)
Acknowledgment in paper
| Acknowledgment in paper for United Kingdom | Count | Percentage | Percentage in 2018 | Difference with previous year |
|---|---|---|---|---|
| Not mentioned at all | 17 | 12.59 | 19.16 | -6.57 |
| Acknowledged in the main text | 12 | 8.89 | 4.67 | 4.22 |
| Acknowledged in acknowledgements section | 19 | 14.07 | 19.63 | -5.55 |
| Named as co-author | 80 | 59.26 | 51.4 | 7.86 |
| Named as main author | 7 | 5.19 | 5.14 | 0.04 |
Participation in conferences
| Did you participate in conference for United Kingdom | Count | Percentage | Percentage in 2018 | Difference with previous year |
|---|---|---|---|---|
| Yes | 87 | 60.84 | 58.17 | 2.67 |
| No | 56 | 39.16 | 41.83 | -2.67 |
Conference name
Open source and DOI
RSEs is an hybrid role between a researcher and a software developer. We investigated both of these aspects concerning publication and dissemination of their work, one on the traditional aspect of it (publications and conference) and, as developed here, on the more software aspect (open source and DOI).
We asked the participants if they have ever released their work under open source licence but also questions about the referencing system. We asked them how often they reference software, and if they use DOI for it, and which tools for it.
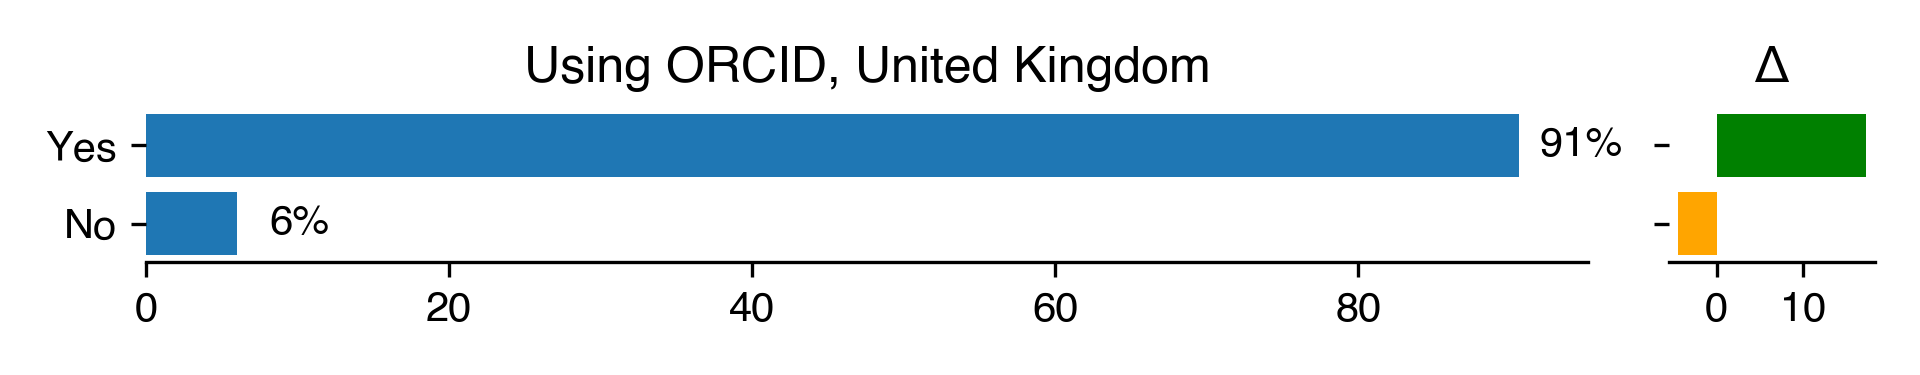
We also asked them if they have an ORCID ID, a system that gives a unique reference ID for the researcher.
Questions in this section:
- How often do you use an open-source licence for your software? (likert scale)
- How often do you reference software directly or the papers describing the software? (likert scale)
- How often do you associate your software with a Digital Object Identifier (DOI)? (likert scale)
- Which tools do you use to mint a DOI (e.g. local library, Zenodo)? (free text)
- Do you have an ORCID ID? (yes-no)
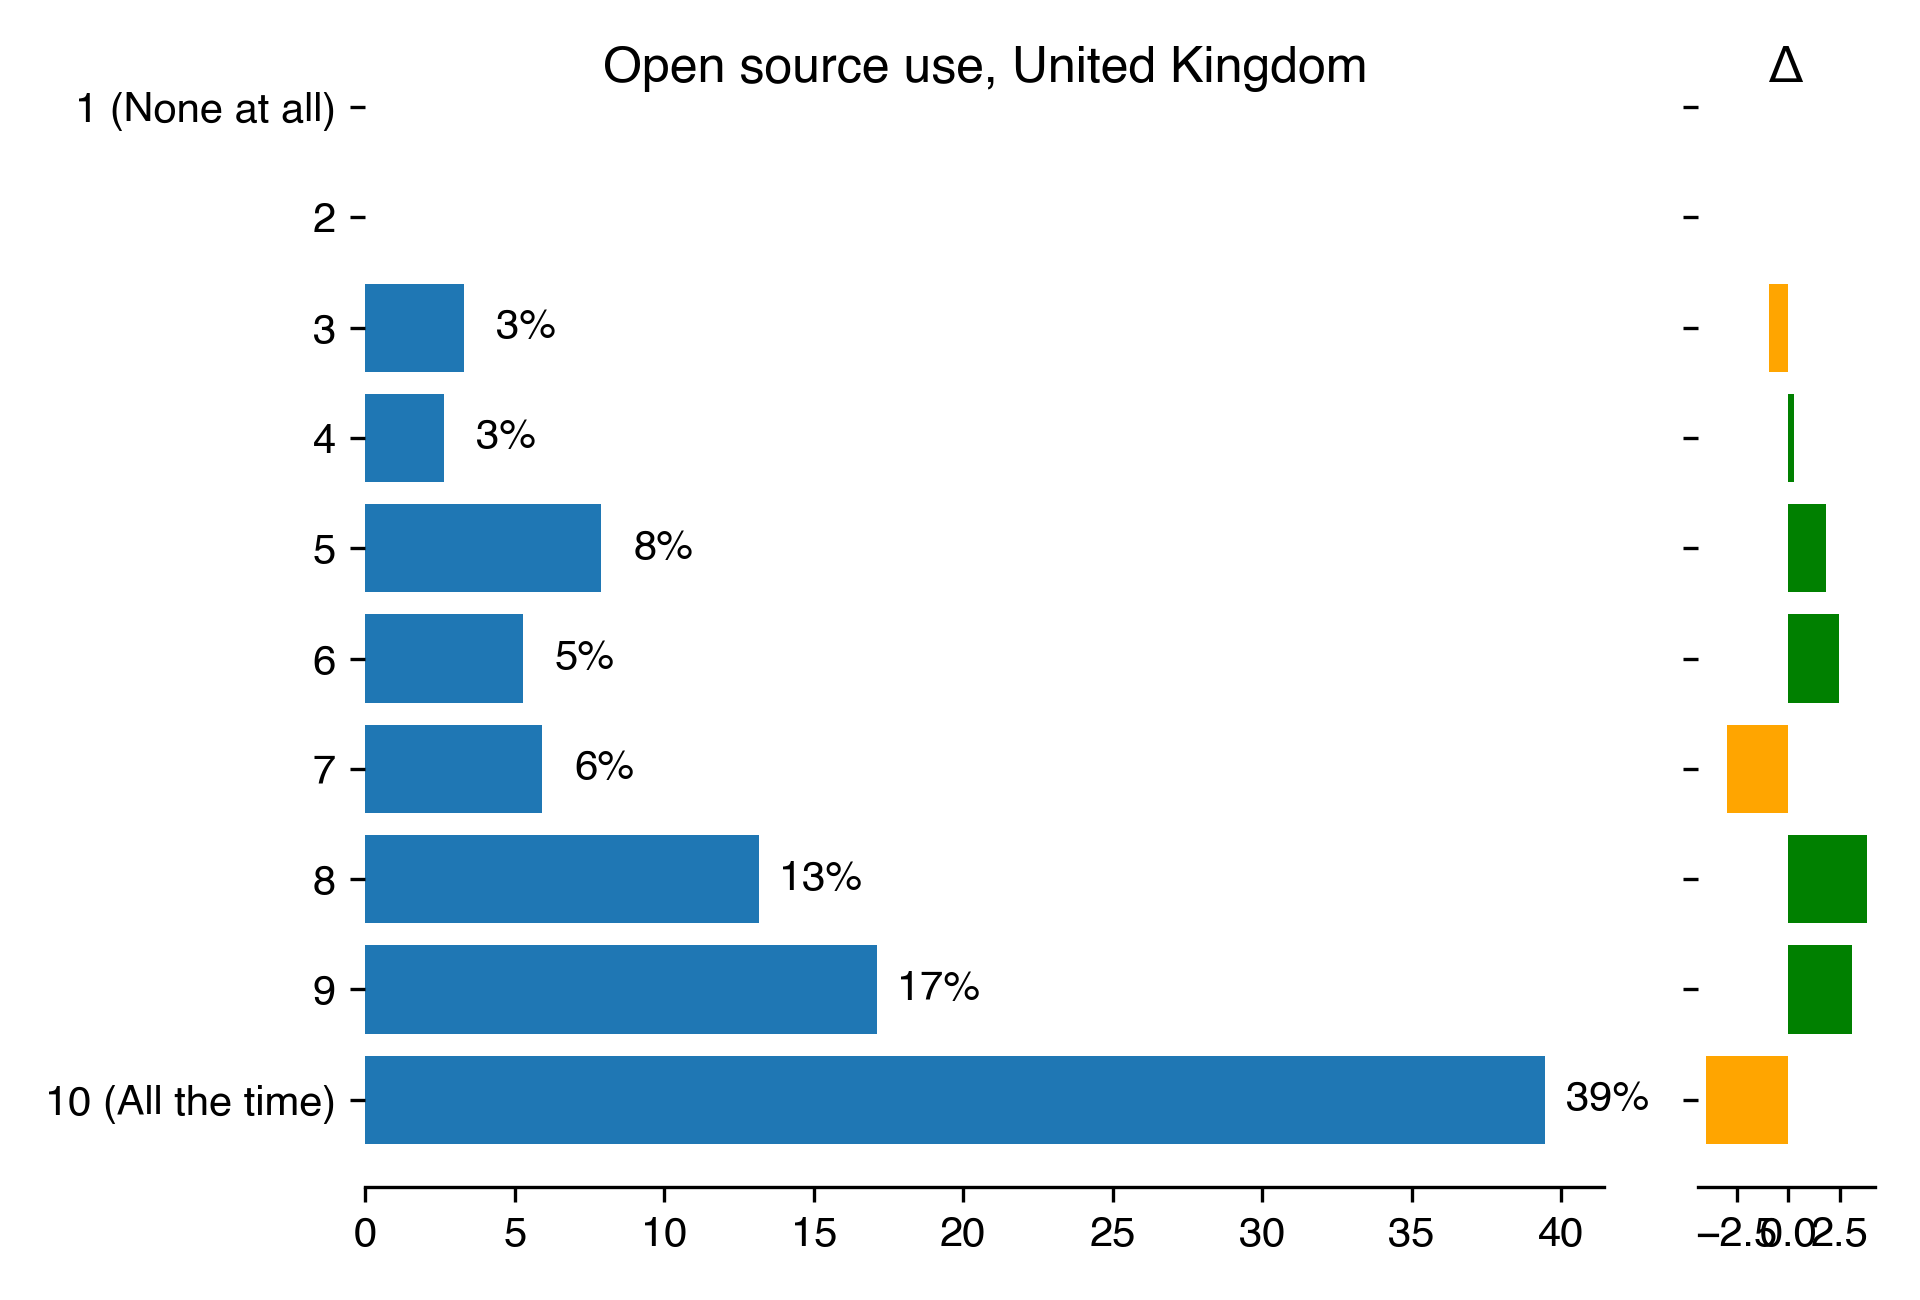
Open source use
| Open source use for United Kingdom | Count | Percentage | Percentage in 2018 | Difference with previous year |
|---|---|---|---|---|
| 1 (None at all) | nan | nan | nan | nan |
| 2 | nan | nan | nan | nan |
| 3 | 5 | 3.29 | 4.21 | -0.92 |
| 4 | 4 | 2.63 | 2.34 | 0.3 |
| 5 | 12 | 7.89 | 6.07 | 1.82 |
| 6 | 8 | 5.26 | 2.8 | 2.46 |
| 7 | 9 | 5.92 | 8.88 | -2.96 |
| 8 | 20 | 13.16 | 9.35 | 3.81 |
| 9 | 26 | 17.11 | 14.02 | 3.09 |
| 10 (All the time) | 60 | 39.47 | 43.46 | -3.98 |
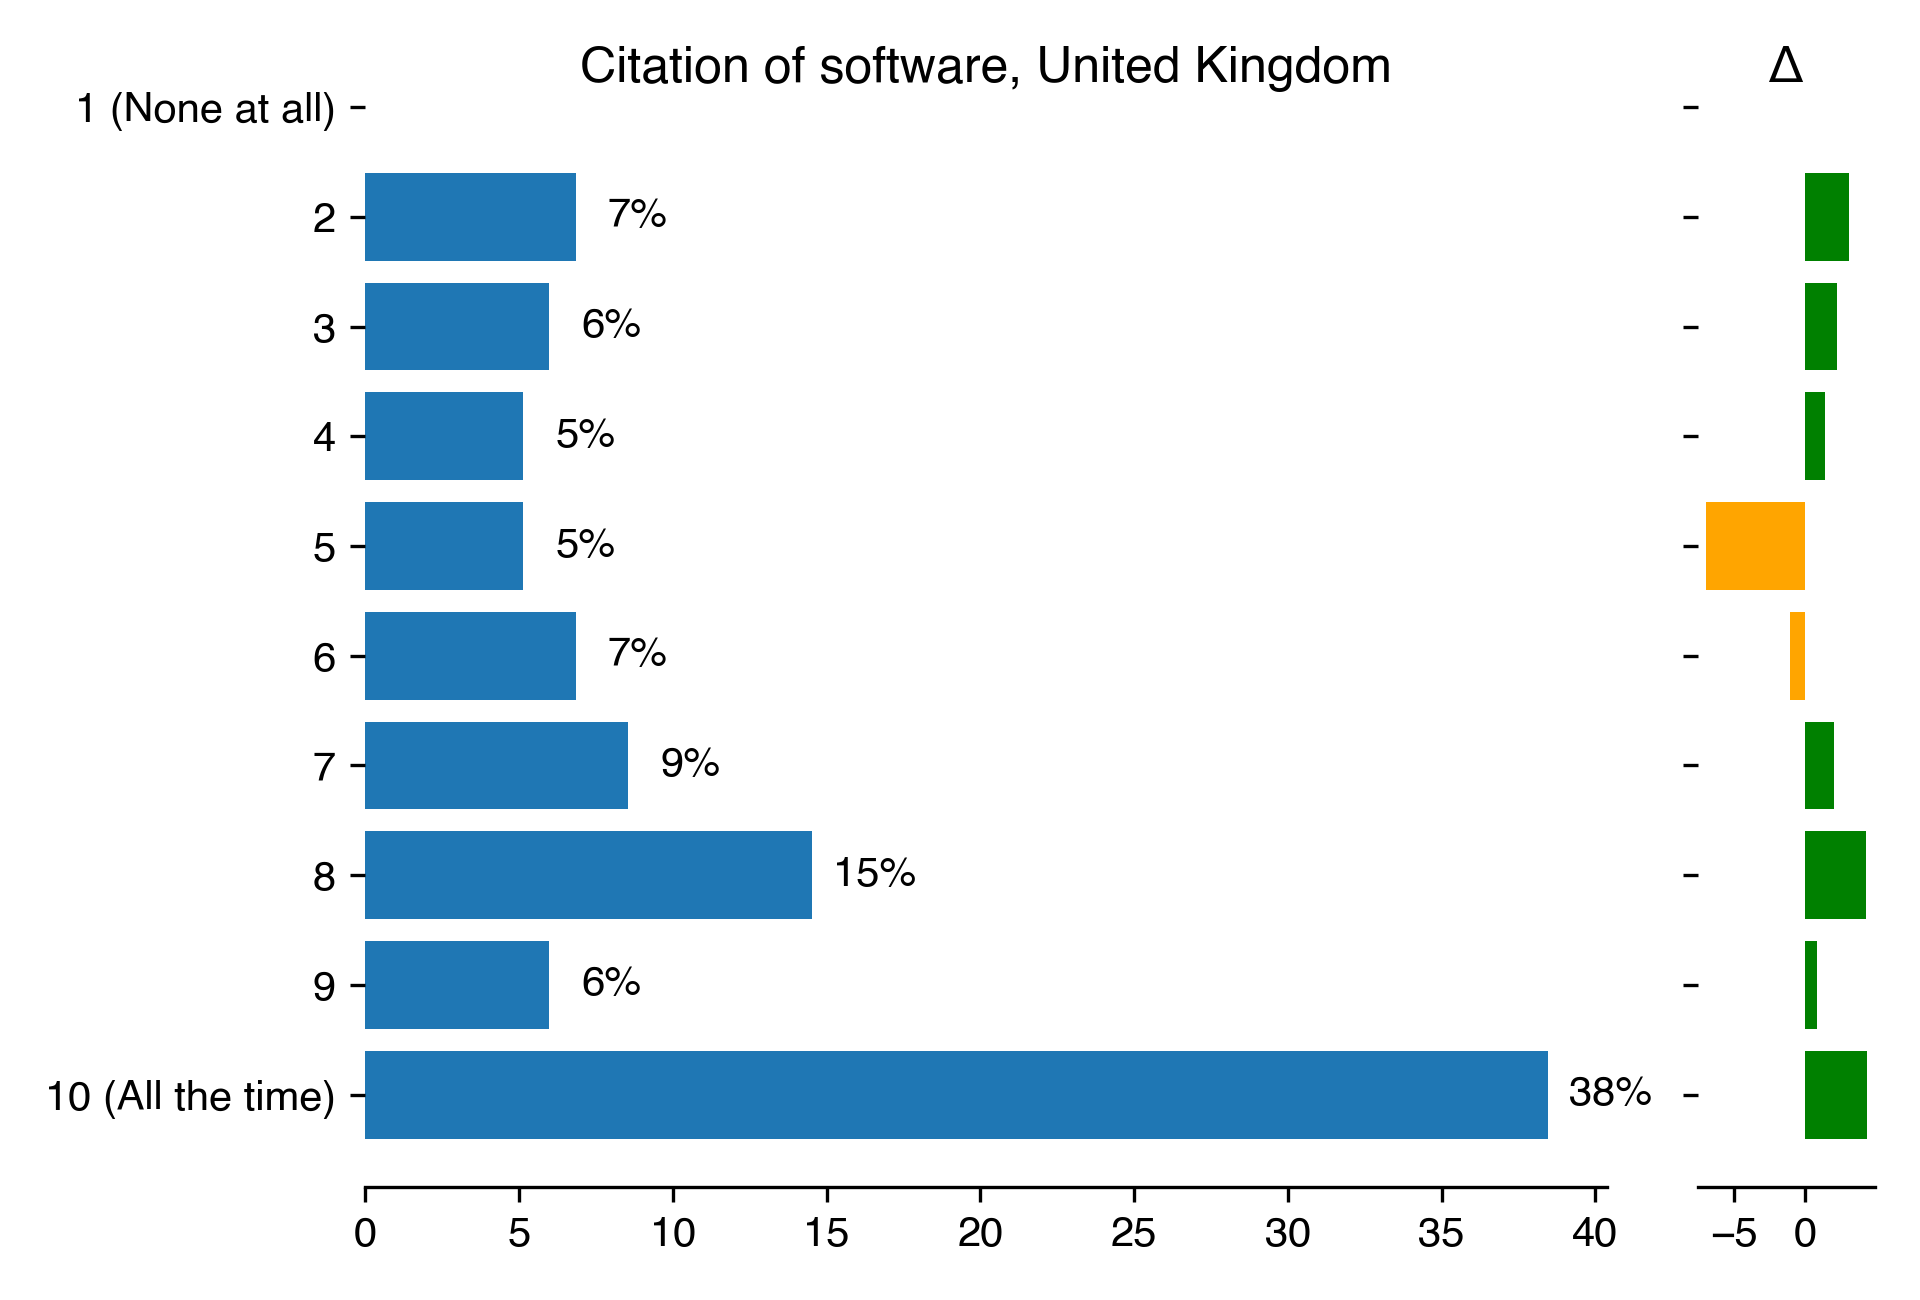
Referencing software
| Citation of software for United Kingdom | Count | Percentage | Percentage in 2018 | Difference with previous year |
|---|---|---|---|---|
| 1 (None at all) | nan | nan | nan | nan |
| 2 | 8 | 6.84 | 3.74 | 3.1 |
| 3 | 7 | 5.98 | 3.74 | 2.24 |
| 4 | 6 | 5.13 | 3.74 | 1.39 |
| 5 | 6 | 5.13 | 12.15 | -7.02 |
| 6 | 8 | 6.84 | 7.94 | -1.11 |
| 7 | 10 | 8.55 | 6.54 | 2 |
| 8 | 17 | 14.53 | 10.28 | 4.25 |
| 9 | 7 | 5.98 | 5.14 | 0.84 |
| 10 (All the time) | 45 | 38.46 | 34.11 | 4.35 |
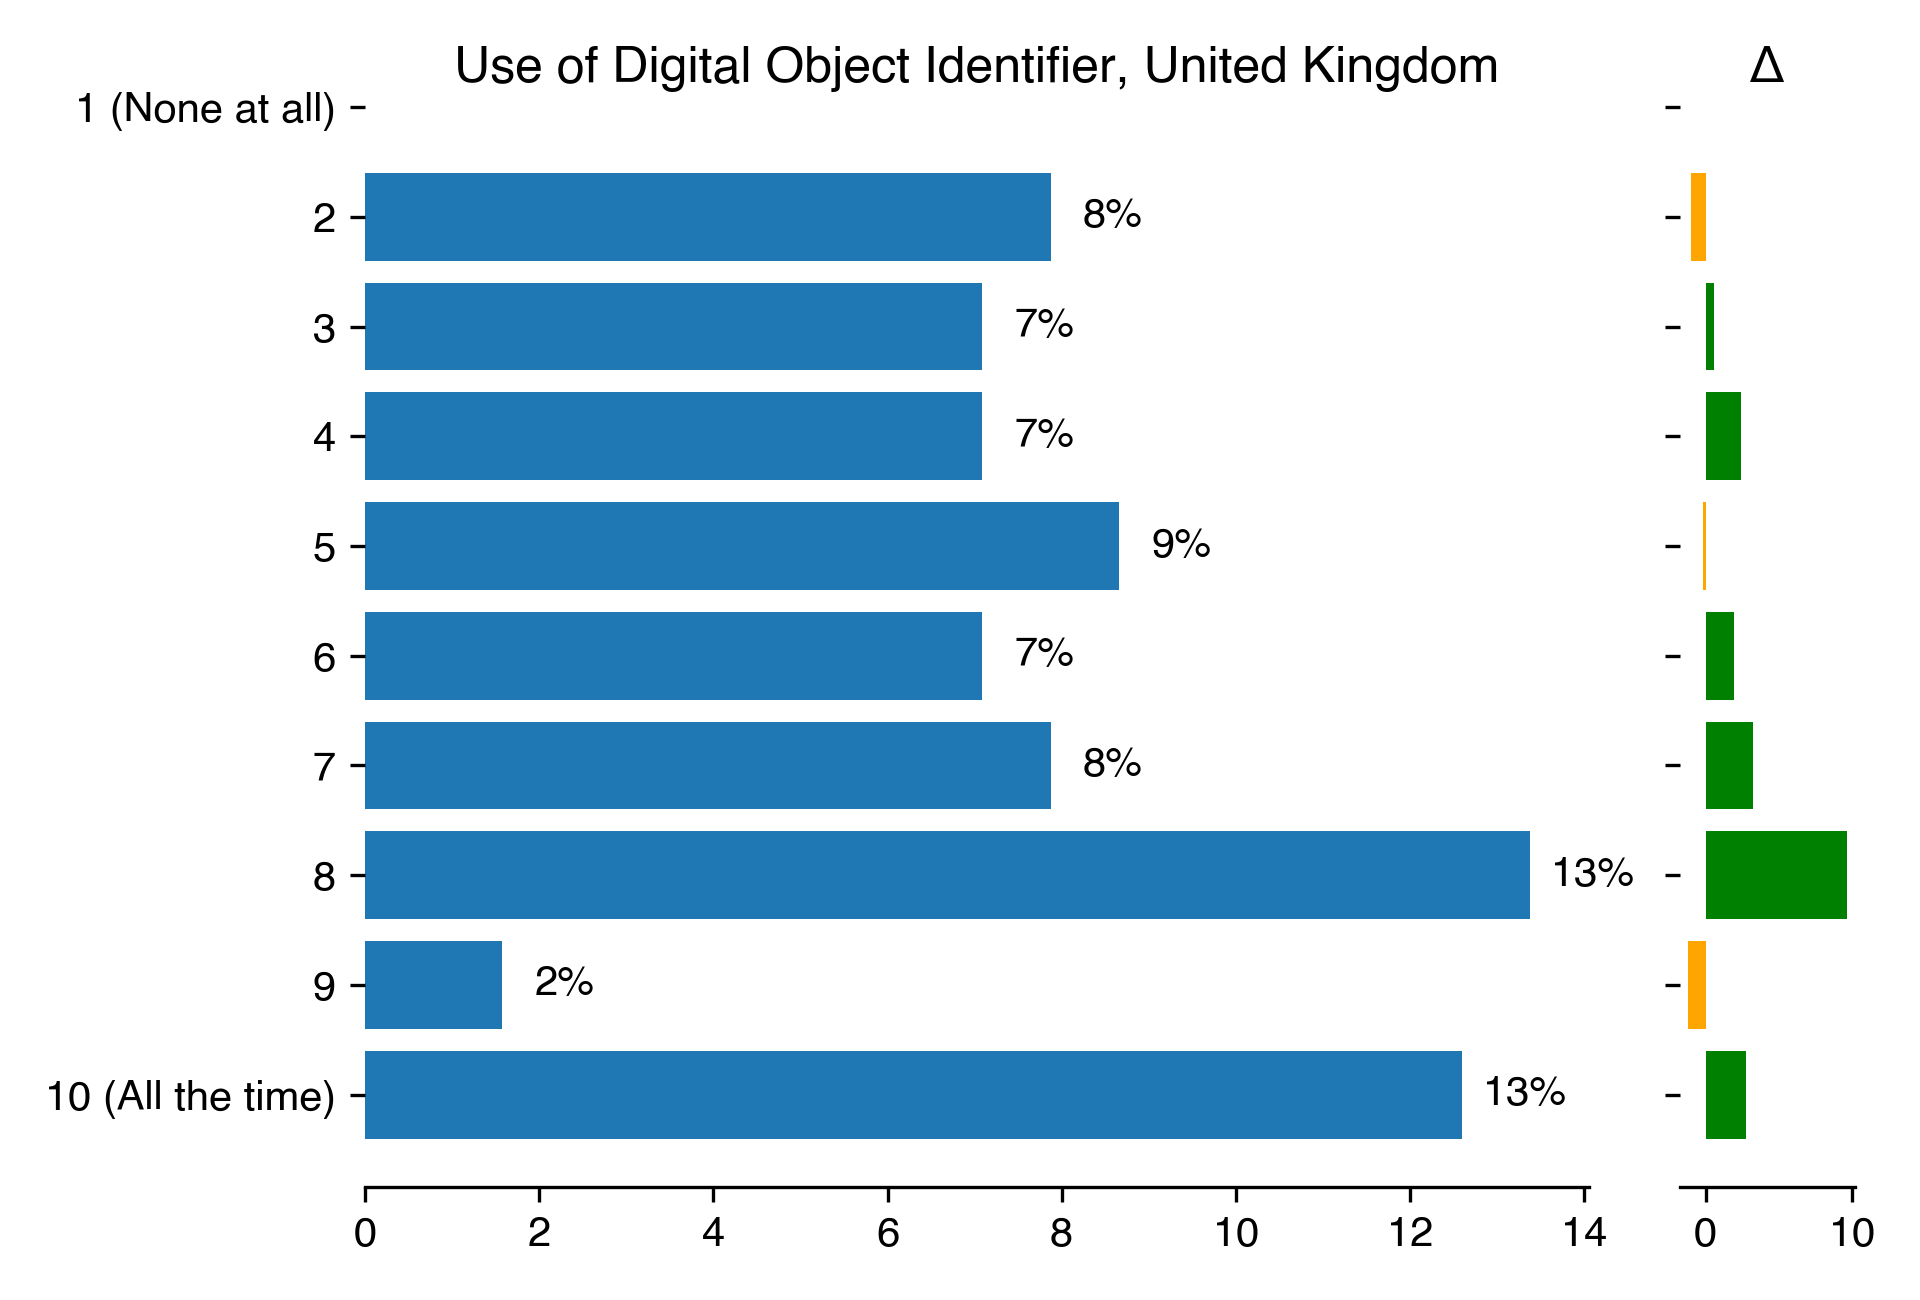
Use of Digital Object Identifier (DOI)
| Use of Digital Object Identifier for United Kingdom | Count | Percentage | Percentage in 2018 | Difference with previous year |
|---|---|---|---|---|
| 1 (None at all) | nan | nan | nan | nan |
| 2 | 10 | 7.87 | 8.88 | -1 |
| 3 | 9 | 7.09 | 6.54 | 0.54 |
| 4 | 9 | 7.09 | 4.67 | 2.41 |
| 5 | 11 | 8.66 | 8.88 | -0.22 |
| 6 | 9 | 7.09 | 5.14 | 1.95 |
| 7 | 10 | 7.87 | 4.67 | 3.2 |
| 8 | 17 | 13.39 | 3.74 | 9.65 |
| 9 | 2 | 1.57 | 2.8 | -1.23 |
| 10 (All the time) | 16 | 12.6 | 9.81 | 2.79 |
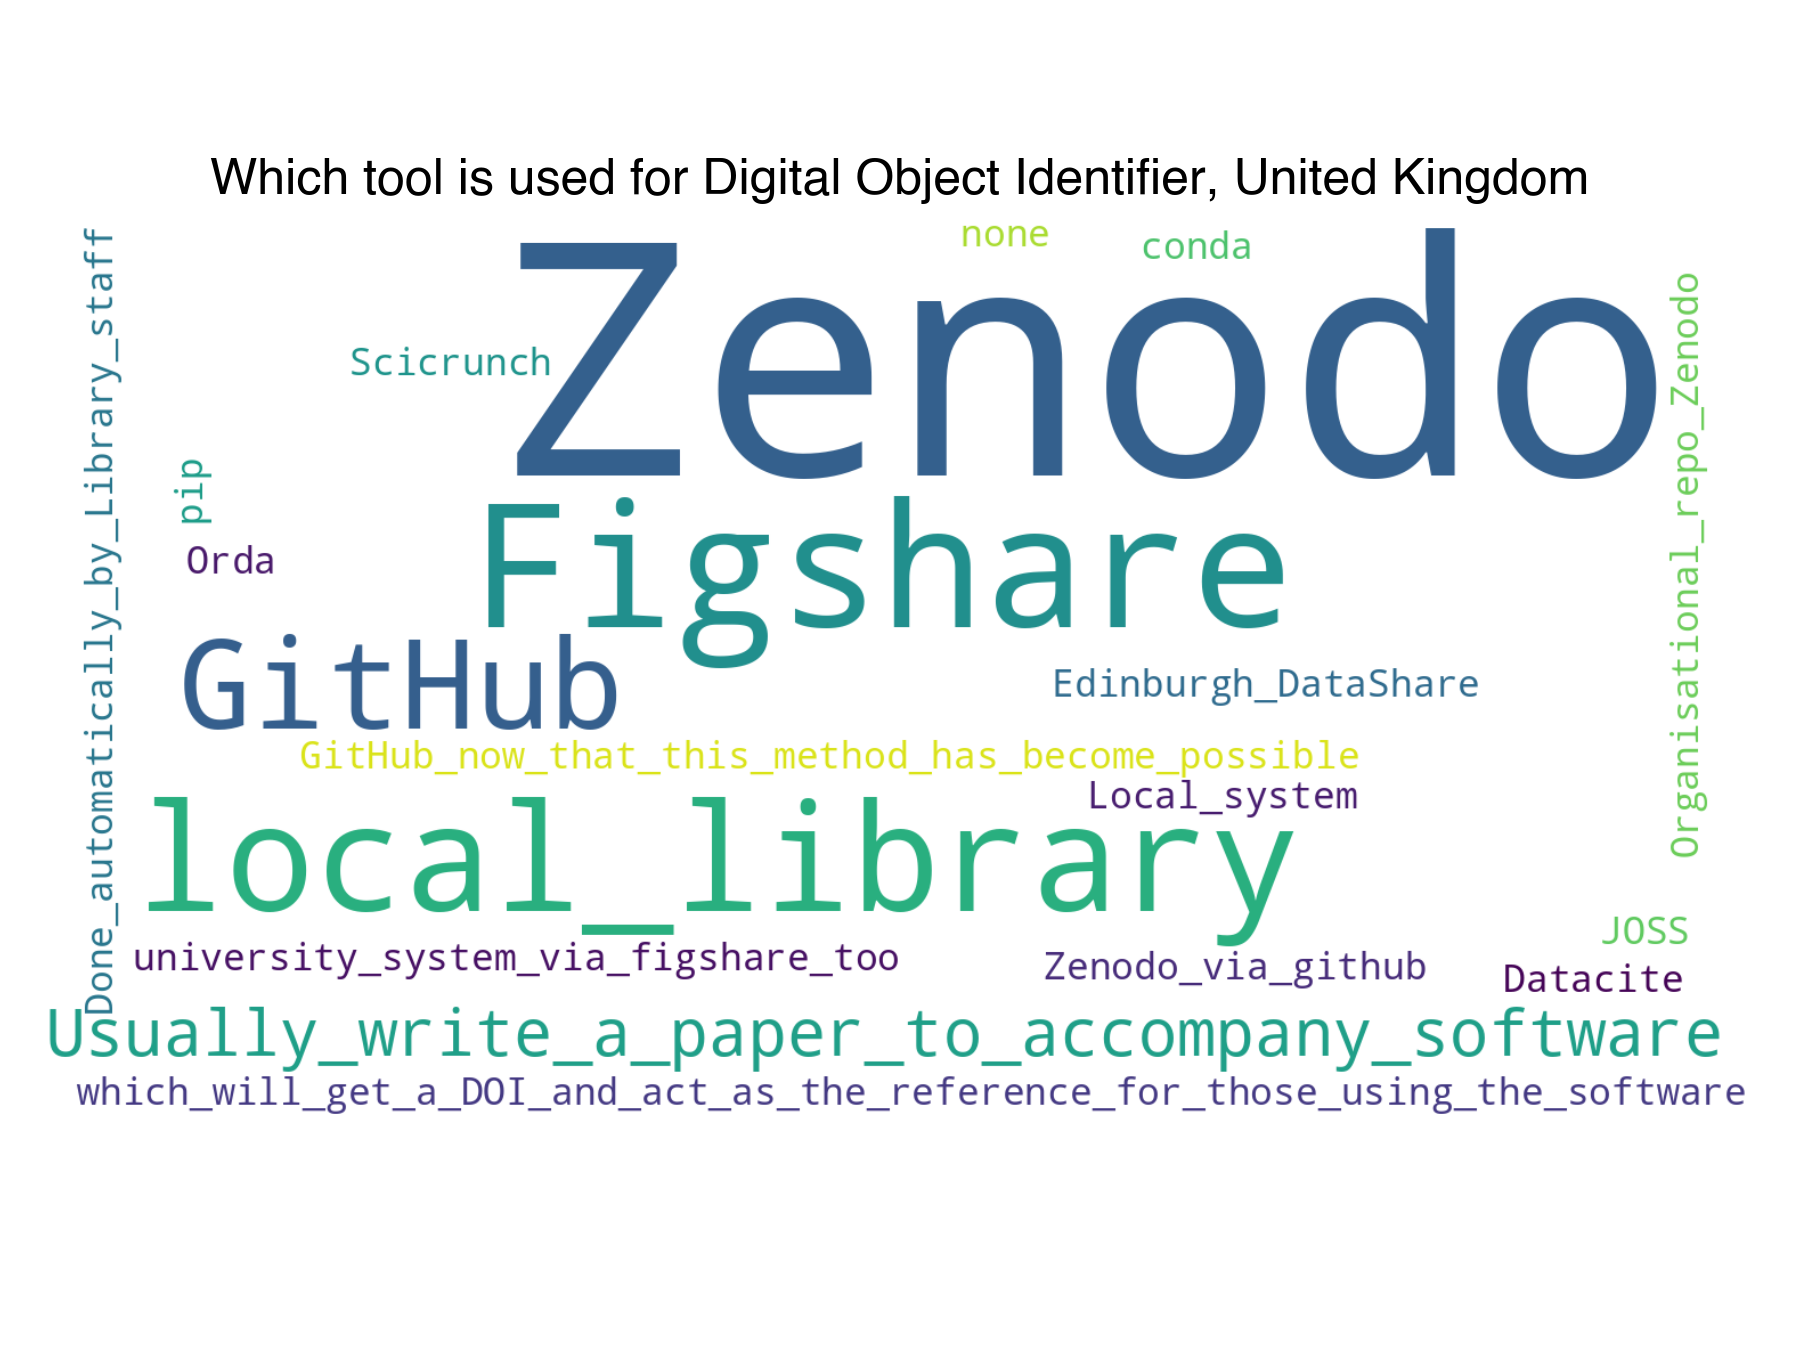
Tools used for DOI
ORCID
| Using ORCID for United Kingdom | Count | Percentage | Percentage in 2018 | Difference with previous year |
|---|---|---|---|---|
| Yes | 135 | 90.6 | 73.33 | 17.27 |
| No | 9 | 6.04 | 10.48 | -4.44 |
Good practices
This section comprises sections that focus on the technical and development aspects of the RSEs’ work. They aim to understand good practices in developing software.
We chose two broad measures to provide an insight into sustainability: the bus factor and technical hand over planning.
-
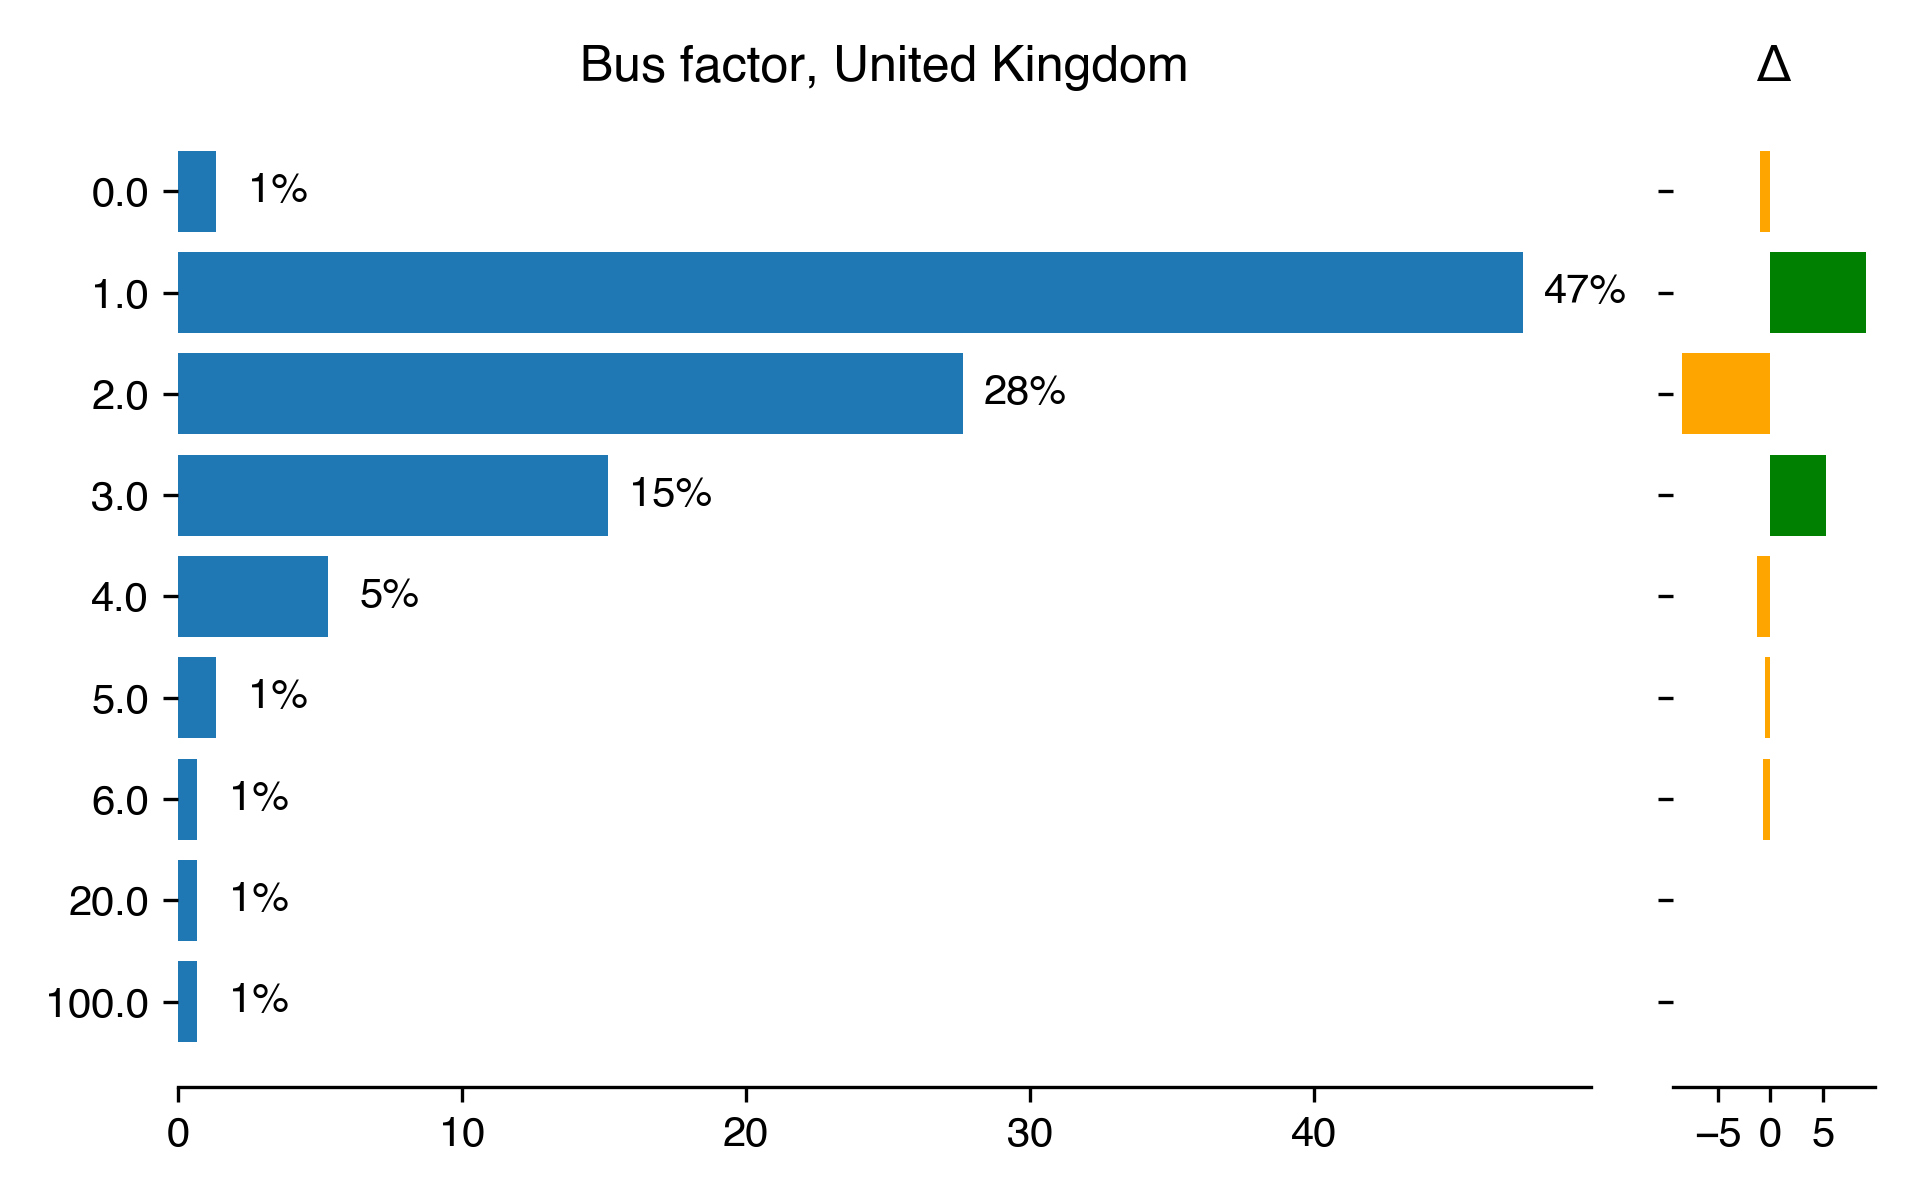
The bus factor is a measure of the number of developers who understand a specific software project and could, with only a cursory review of the project, maintain or extend the code. A project with a bus factor of 1 is completely reliant on only one developer. If this developer finds new employment, becomes ill or is hit by the titular bus, then the project will fail. A high bus factor provides some confidence that the project can be sustained even if a developer leaves.
-
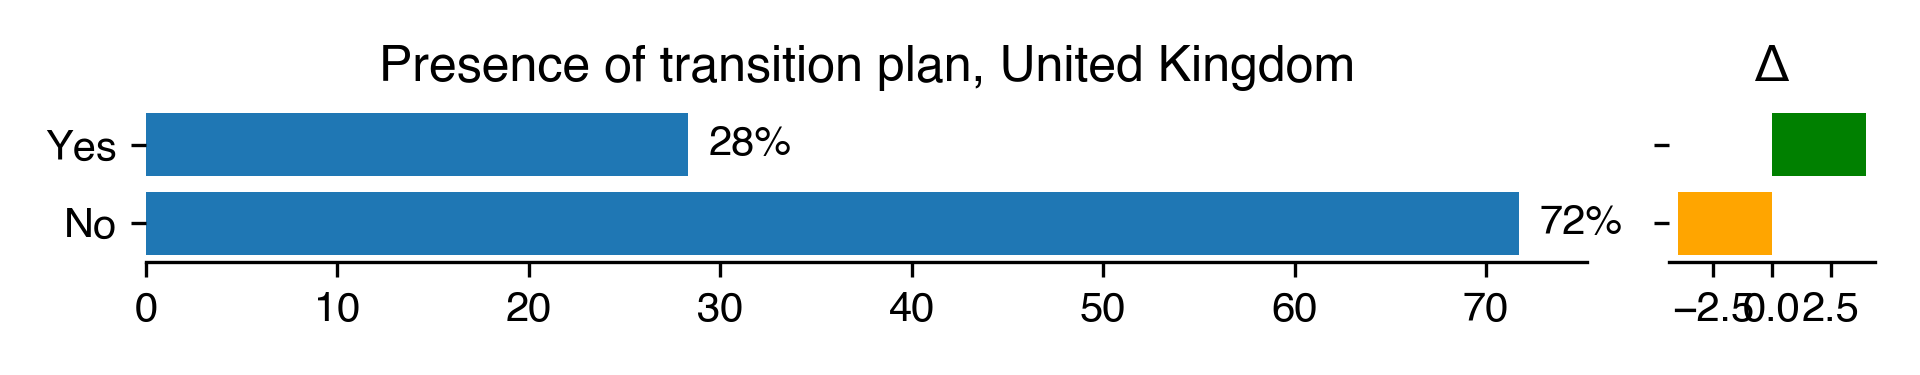
A technical hand over plan is used to introduce a new developer to a software project. These plans cover basic information, such as the license and location of the software, a repository, a description of the software architecture, a summary of development plans and any other information that a new developer would need to understand the software. A project that has written (and maintained) a technical hand over plan can withstand the departure of a developer, even a key developer, significantly better than one without such a plan.
Developing software requires a set of good practices to ensure the quality of the subsequent analysis as well as the robustness of the developed software, to name a few of important aspects. We wanted to see if the implementation of some simple but essential good practices were a reality beside the bus factor and technical hand over planning.
When developing software, version control and testing can be seen as tool to enhance the quality of the developed software, especially considering the importance of code review and sharing in public funded places such as academia.
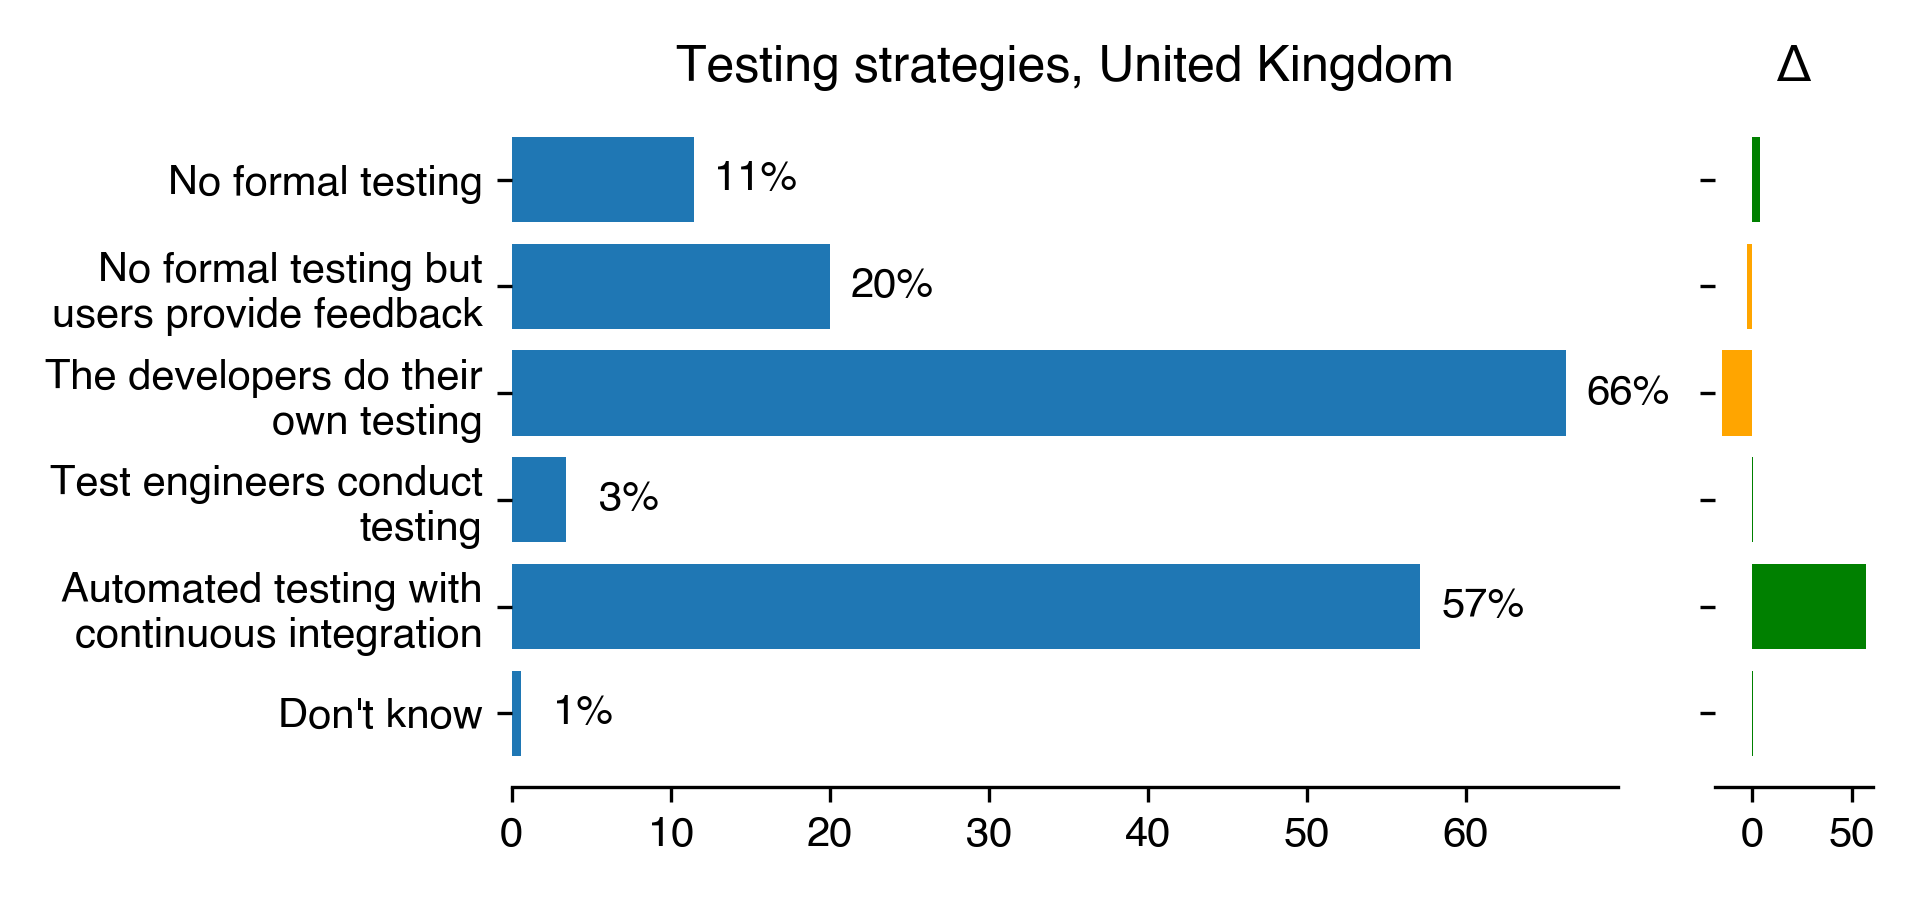
For testing, we asked the participants to choose any of the following testing methods:
- Automated testing with continuous integration
- Test engineers conduct testing
- Developers conduct own testing
- No formal testing but users provide feedback
- No formal testing
Test engineers conducting testing is the most robust testing method but may not be possible in smaller projects while no formal testing should not occur in any ideal scenario, regardless of the size of the project.
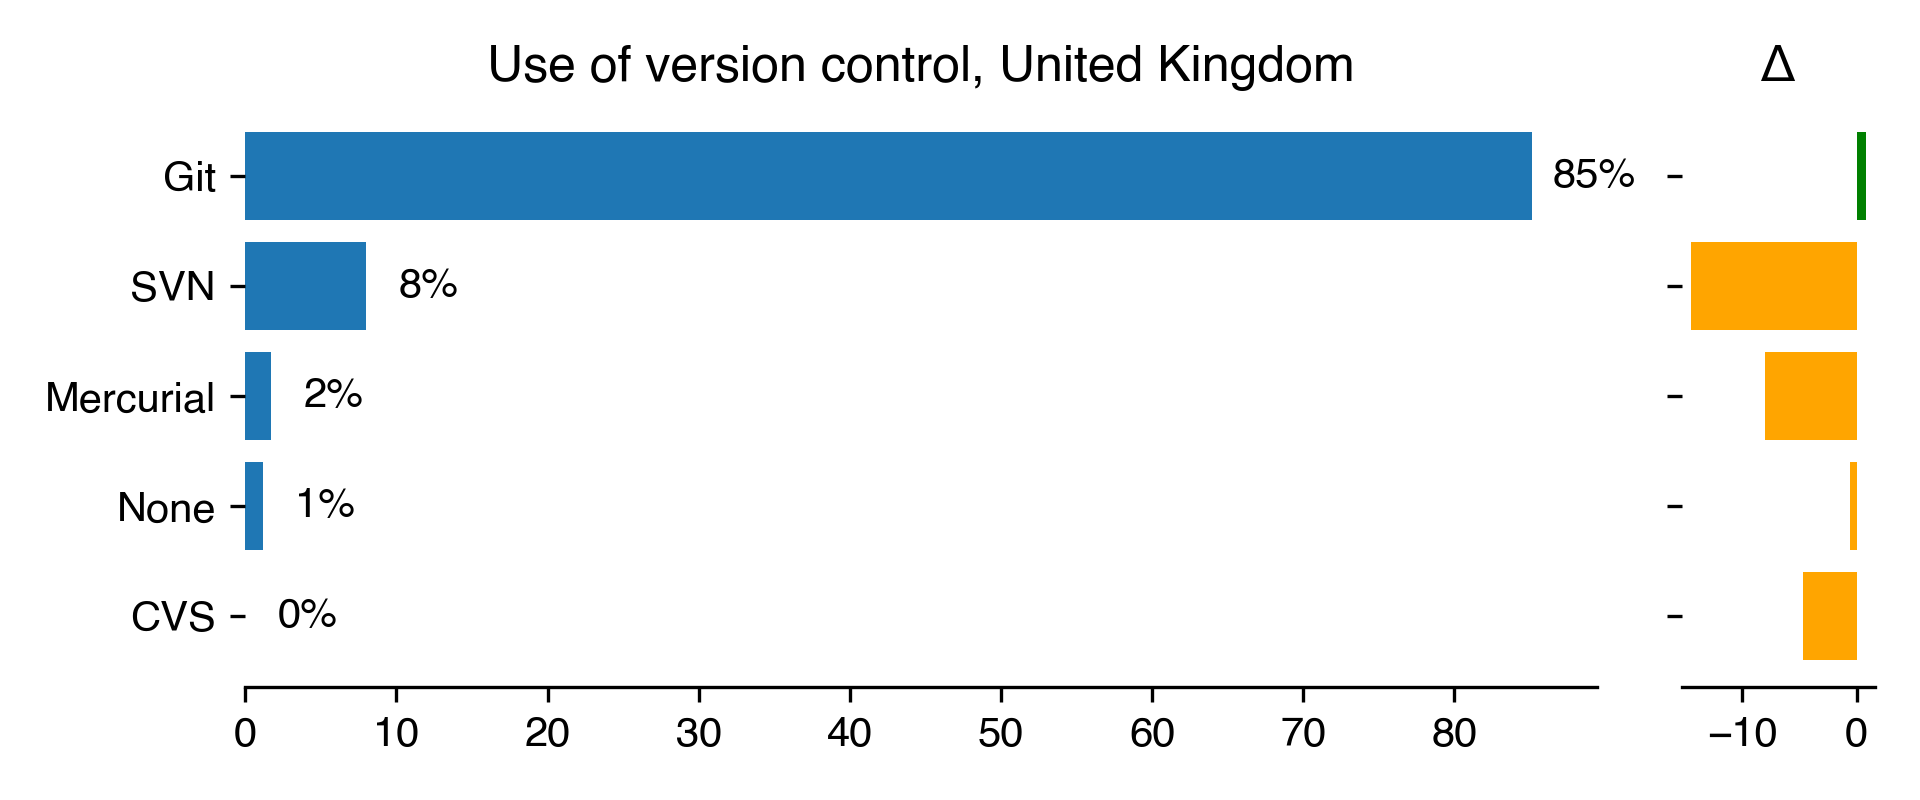
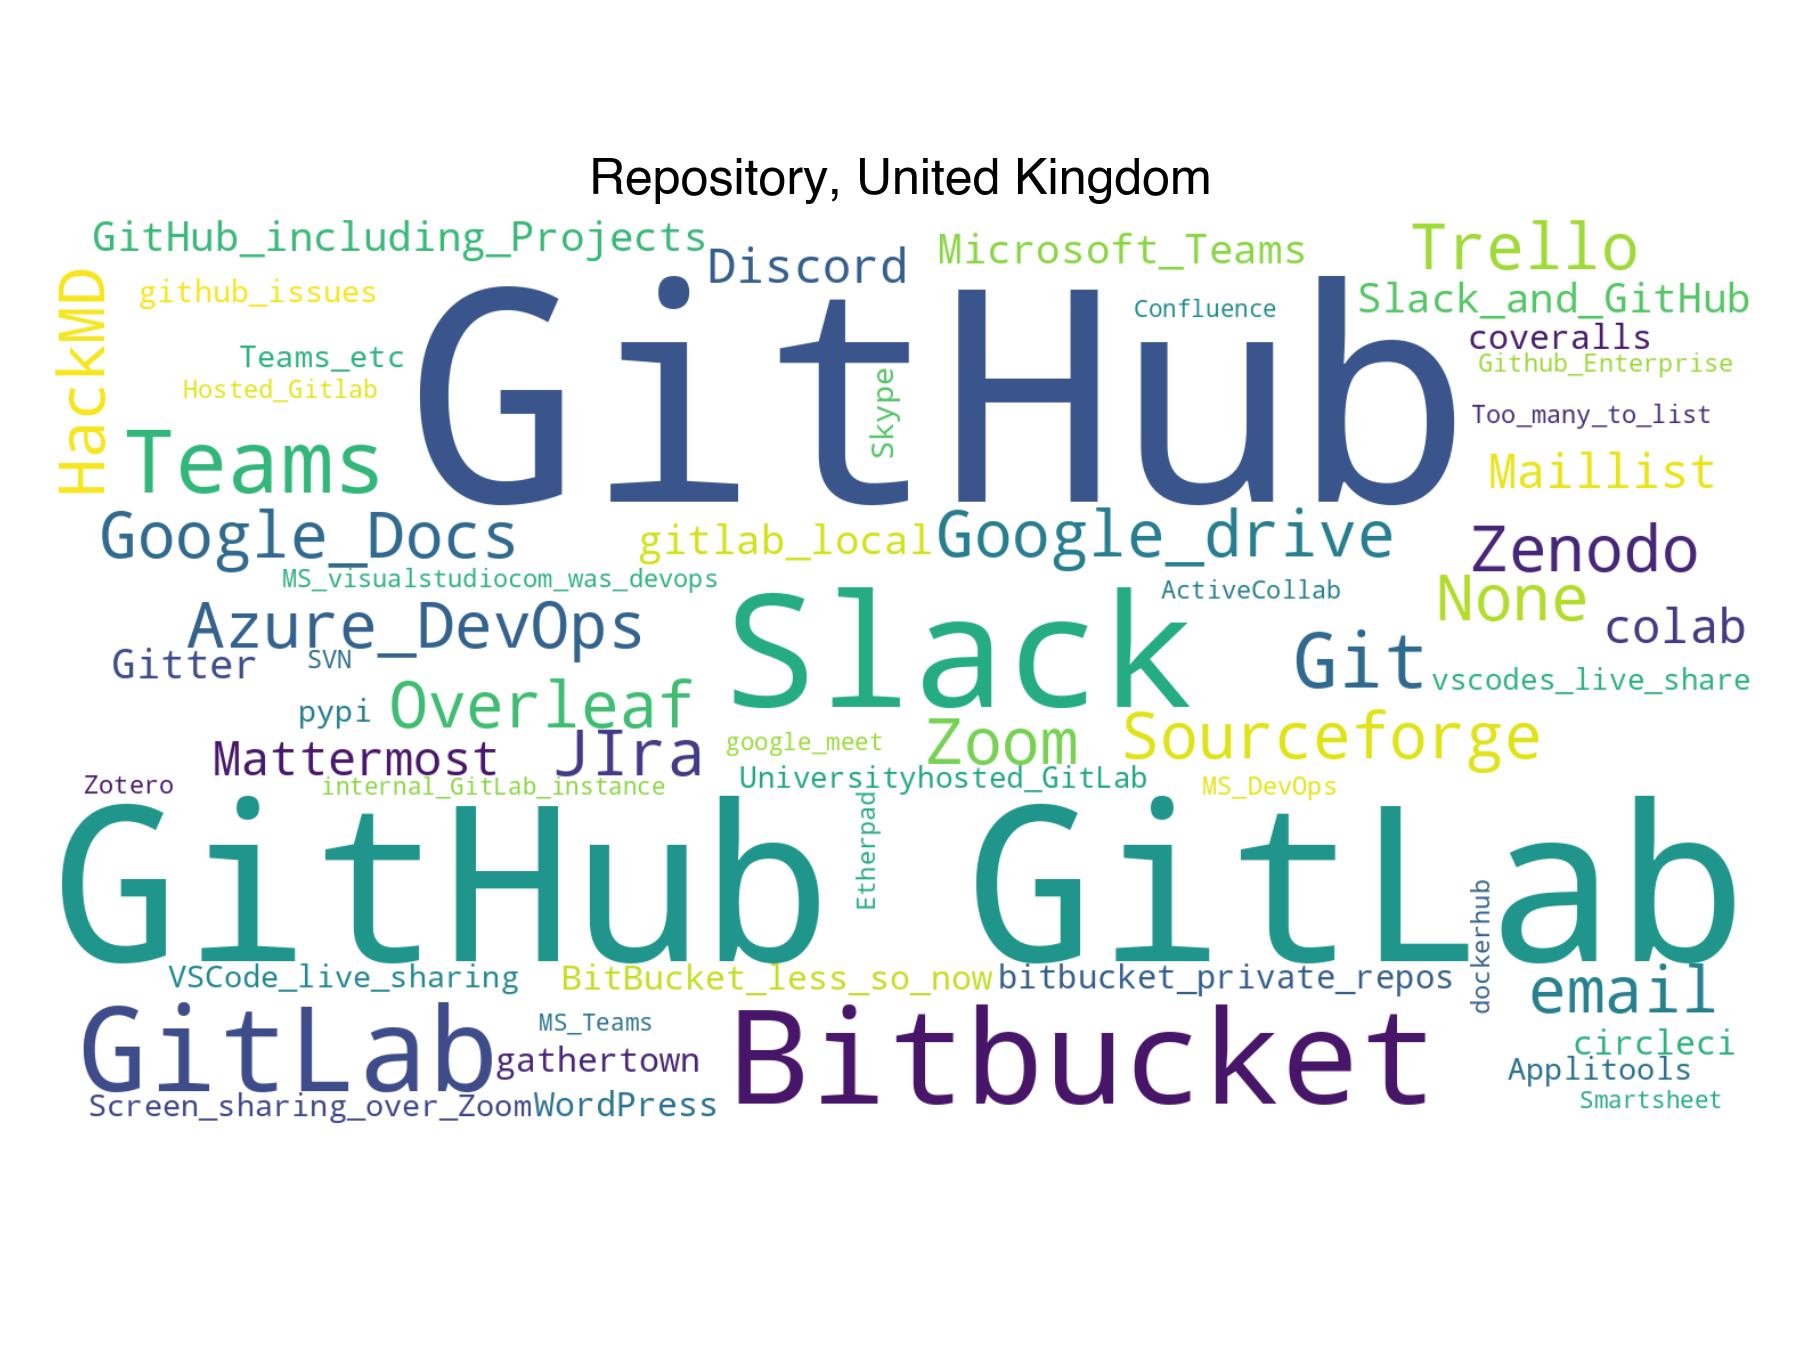
We also asked the participants if they use any version control tools through a list of choice. And finally we asked them which repository they are currently using for their most important project.
Bus factor
| Bus factor for United Kingdom | Count | Percentage | Percentage in 2018 | Difference with previous year |
|---|---|---|---|---|
| 0 | 2 | 1.32 | 2.34 | -1.02 |
| 1 | 72 | 47.37 | 38.32 | 9.05 |
| 2 | 42 | 27.63 | 35.98 | -8.35 |
| 3 | 23 | 15.13 | 9.81 | 5.32 |
| 4 | 8 | 5.26 | 6.54 | -1.28 |
| 5 | 2 | 1.32 | 1.87 | -0.55 |
| 6 | 1 | 0.66 | 1.4 | -0.74 |
| 20 | 1 | 0.66 | nan | nan |
| 100 | 1 | 0.66 | nan | nan |
Presence of transition plan
| Presence of transition plan for United Kingdom | Count | Percentage | Percentage in 2018 | Difference with previous year |
|---|---|---|---|---|
| Yes | 43 | 28.29 | 24.3 | 3.99 |
| No | 109 | 71.71 | 75.7 | -3.99 |
Use of version control
| Use of version control for United Kingdom | Count | Percentage | Percentage in 2018 | Difference with previous year |
|---|---|---|---|---|
| Git | 149 | 85.14 | 84.32 | 0.82 |
| SVN | 14 | 8 | 22.46 | -14.46 |
| Mercurial | 3 | 1.71 | 9.75 | -8.03 |
| None | 2 | 1.14 | 1.69 | -0.55 |
| CVS | 0 | 0 | 4.66 | -4.66 |
Testing strategies
| Testing strategies for United Kingdom | Count | Percentage | Percentage in 2018 | Difference with previous year |
|---|---|---|---|---|
| No formal testing | 20 | 11.43 | 7.63 | 3.8 |
| No formal testing but users provide feedback | 35 | 20 | 22.46 | -2.46 |
| The developers do their own testing | 116 | 66.29 | 81.36 | -15.07 |
| Test engineers conduct testing | 6 | 3.43 | 2.97 | 0.46 |
| Automated testing with continuous integration | 100 | 57.14 | 0 | 57.14 |
| Don’t know | 1 | 0.57 | 0 | 0.57 |
Repository
Tools and programming languages
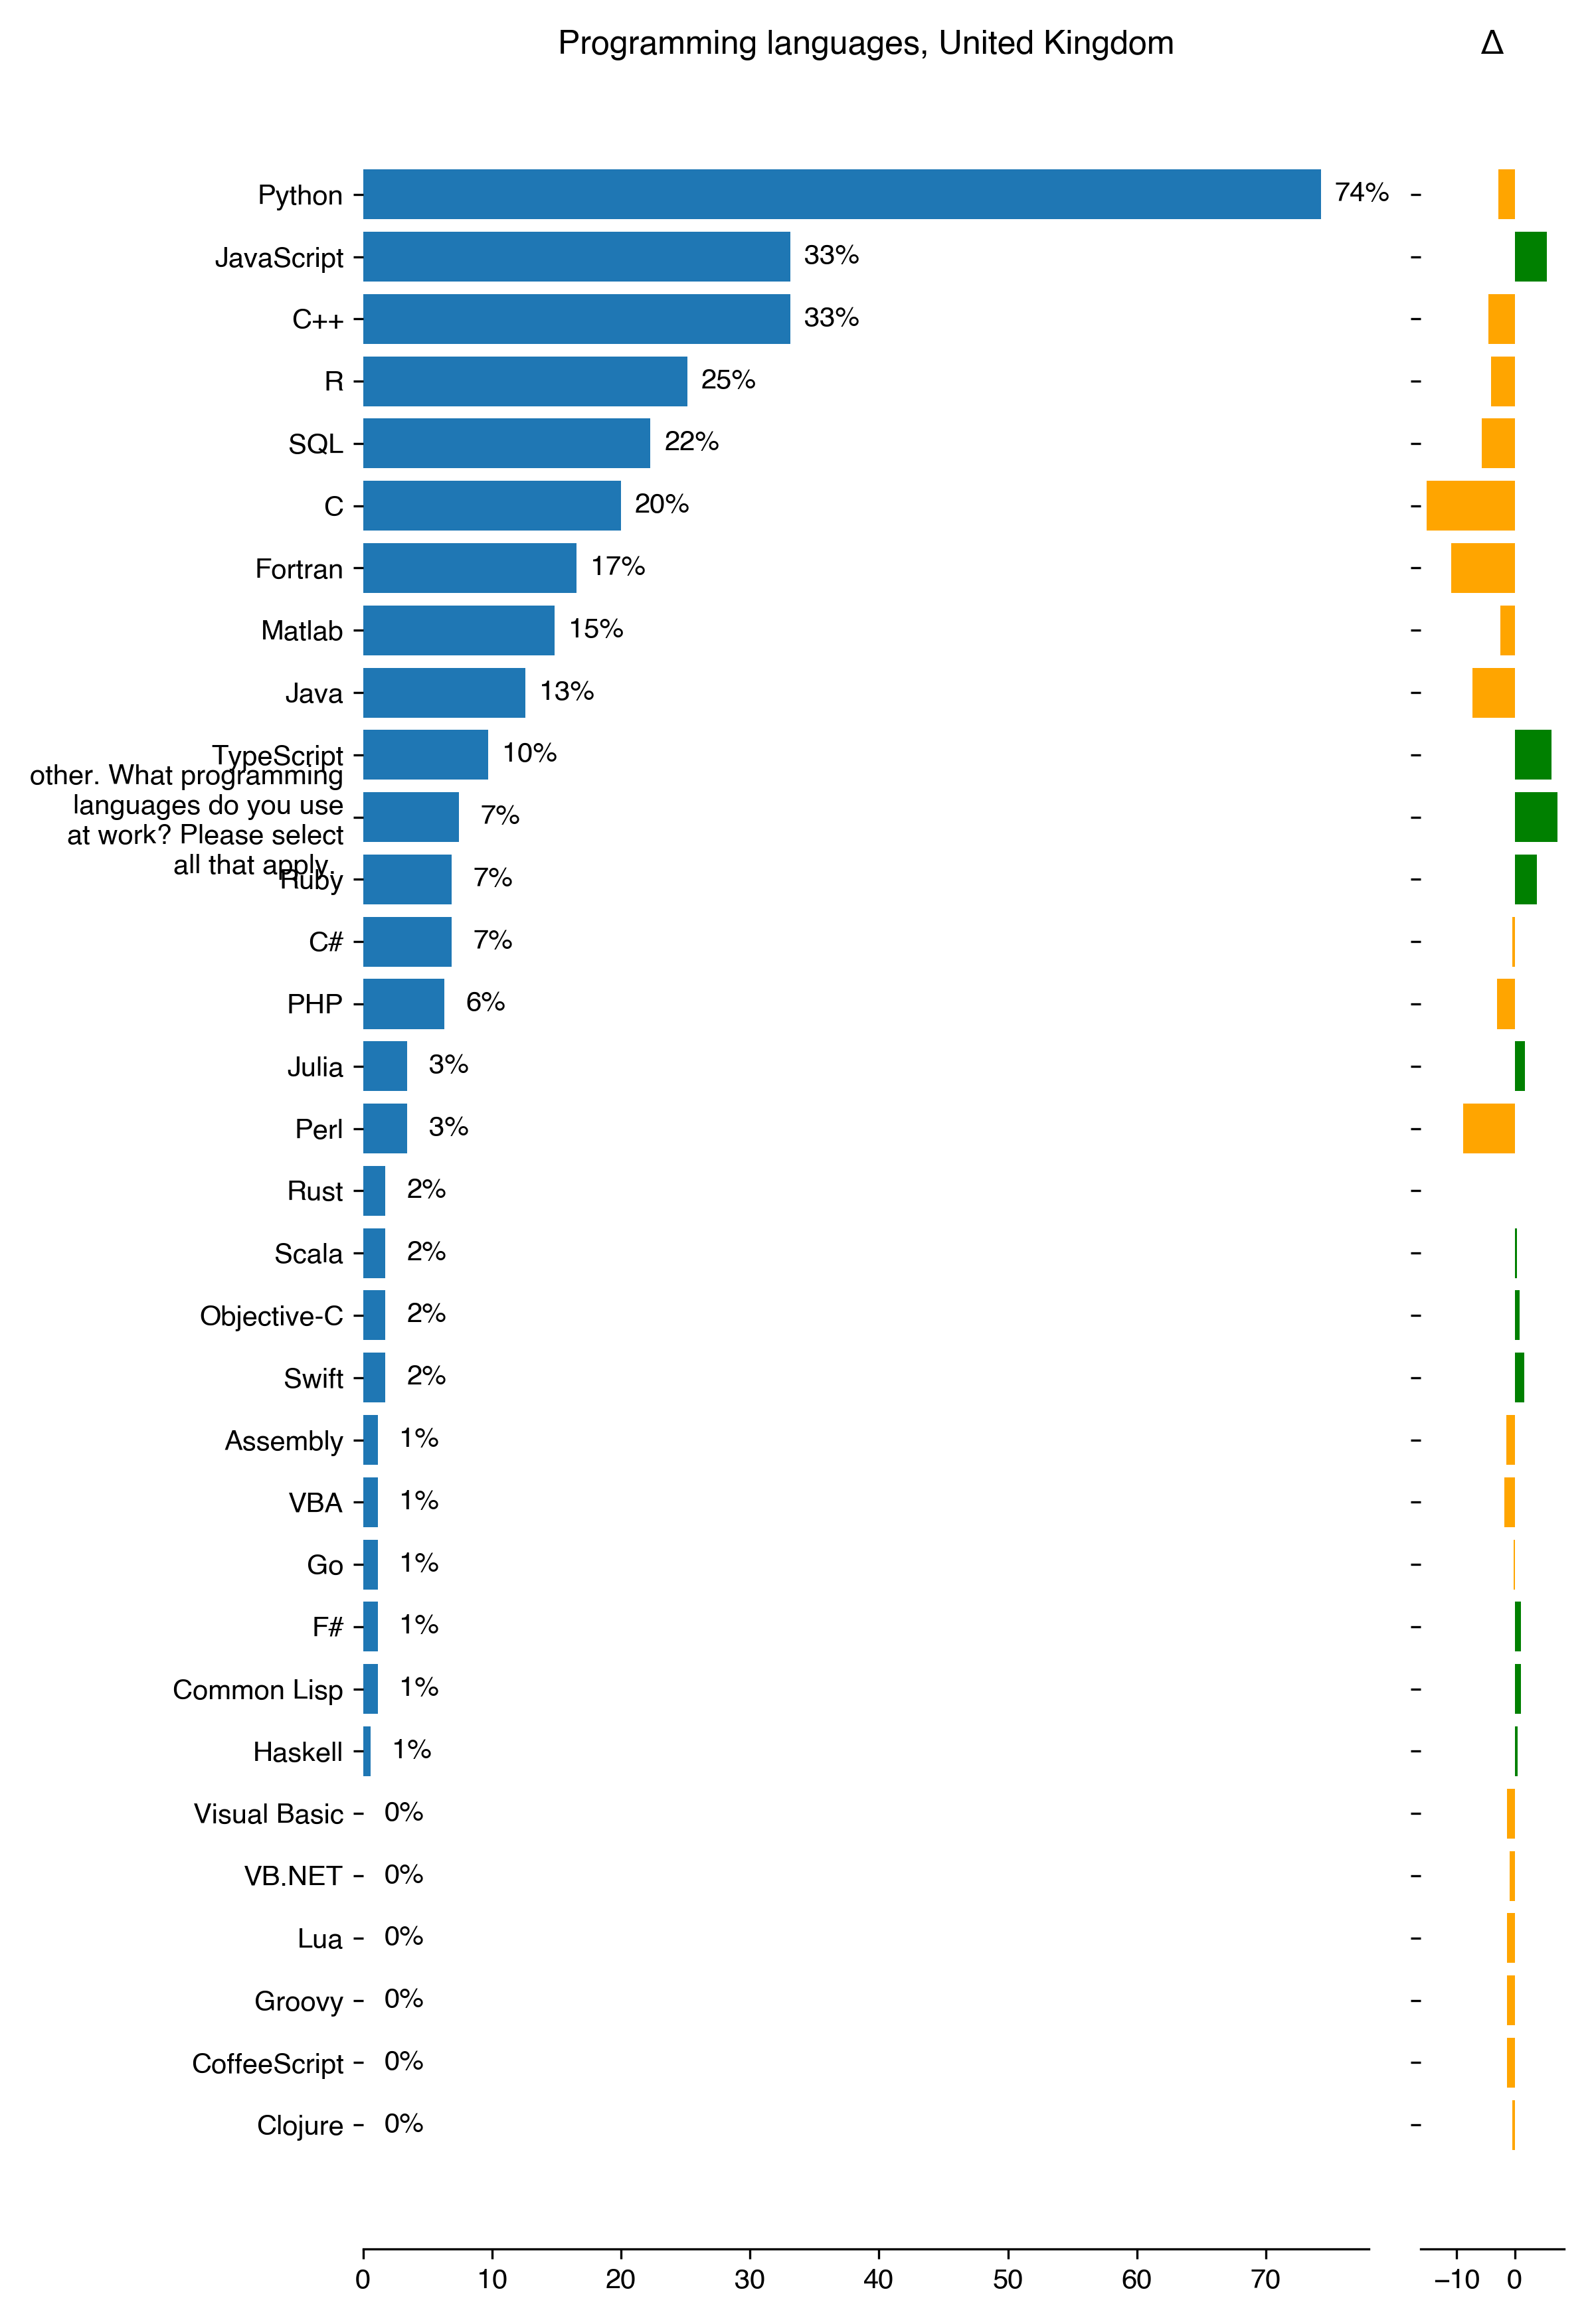
On technical details we wanted to know which of the programming languages are mostly used by the RSEs. We give them a multi-choice list inspired by the results published by Stackoverflow.
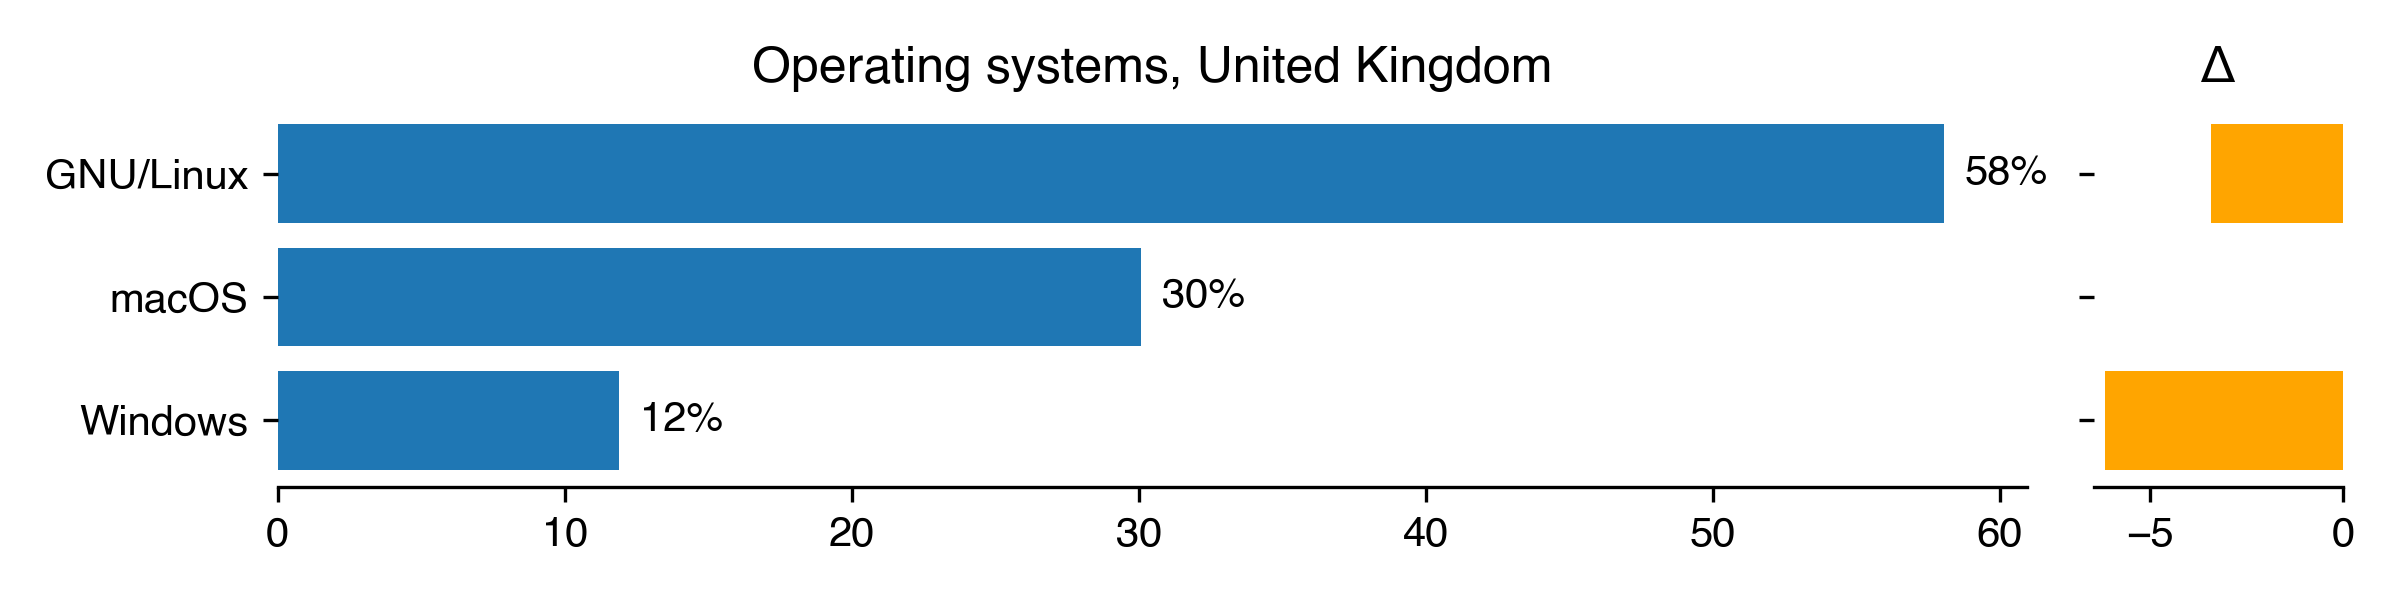
We also wanted to know which operating system they use for work.
Questions in this section:
- Which operating system do you primarily use for development? (one choice)
- What programming languages do you use at work? Please select all that apply. (multiple choice)
Programming languages
| Programming languages for United Kingdom | Count | Percentage | Percentage in 2018 | Difference with previous year |
|---|---|---|---|---|
| Python | 130 | 74.29 | 77.12 | -2.83 |
| JavaScript | 58 | 33.14 | 27.54 | 5.6 |
| C++ | 58 | 33.14 | 37.71 | -4.57 |
| R | 44 | 25.14 | 29.24 | -4.09 |
| SQL | 39 | 22.29 | 27.97 | -5.68 |
| C | 35 | 20 | 35.17 | -15.17 |
| Fortran | 29 | 16.57 | 27.54 | -10.97 |
| Matlab | 26 | 14.86 | 17.37 | -2.52 |
| Java | 22 | 12.57 | 19.92 | -7.34 |
| TypeScript | 17 | 9.71 | 3.39 | 6.32 |
| other. What programming languages do you use at work? Please select all that apply. | 13 | 7.43 | 0 | 7.43 |
| Ruby | 12 | 6.86 | 2.97 | 3.89 |
| C# | 12 | 6.86 | 7.2 | -0.35 |
| PHP | 11 | 6.29 | 9.32 | -3.04 |
| Julia | 6 | 3.43 | 1.69 | 1.73 |
| Perl | 6 | 3.43 | 12.29 | -8.86 |
| Rust | 3 | 1.71 | 1.69 | 0.02 |
| Scala | 3 | 1.71 | 1.27 | 0.44 |
| Objective-C | 3 | 1.71 | 0.85 | 0.87 |
| Swift | 3 | 1.71 | 0 | 1.71 |
| Assembly | 2 | 1.14 | 2.54 | -1.4 |
| VBA | 2 | 1.14 | 2.97 | -1.82 |
| Go | 2 | 1.14 | 1.27 | -0.13 |
| F# | 2 | 1.14 | 0 | 1.14 |
| Common Lisp | 2 | 1.14 | 0 | 1.14 |
| Haskell | 1 | 0.57 | 0 | 0.57 |
| Visual Basic | 0 | 0 | 1.27 | -1.27 |
| VB.NET | 0 | 0 | 0.85 | -0.85 |
| Lua | 0 | 0 | 1.27 | -1.27 |
| Groovy | 0 | 0 | 1.27 | -1.27 |
| CoffeeScript | 0 | 0 | 1.27 | -1.27 |
| Clojure | 0 | 0 | 0.42 | -0.42 |
Operating systems
| Operating systems for United Kingdom | Count | Percentage | Percentage in 2018 | Difference with previous year |
|---|---|---|---|---|
| GNU/Linux | 83 | 58.04 | 61.46 | -3.42 |
| macOS | 43 | 30.07 | nan | nan |
| Windows | 17 | 11.89 | 18.05 | -6.16 |
Job satisfaction
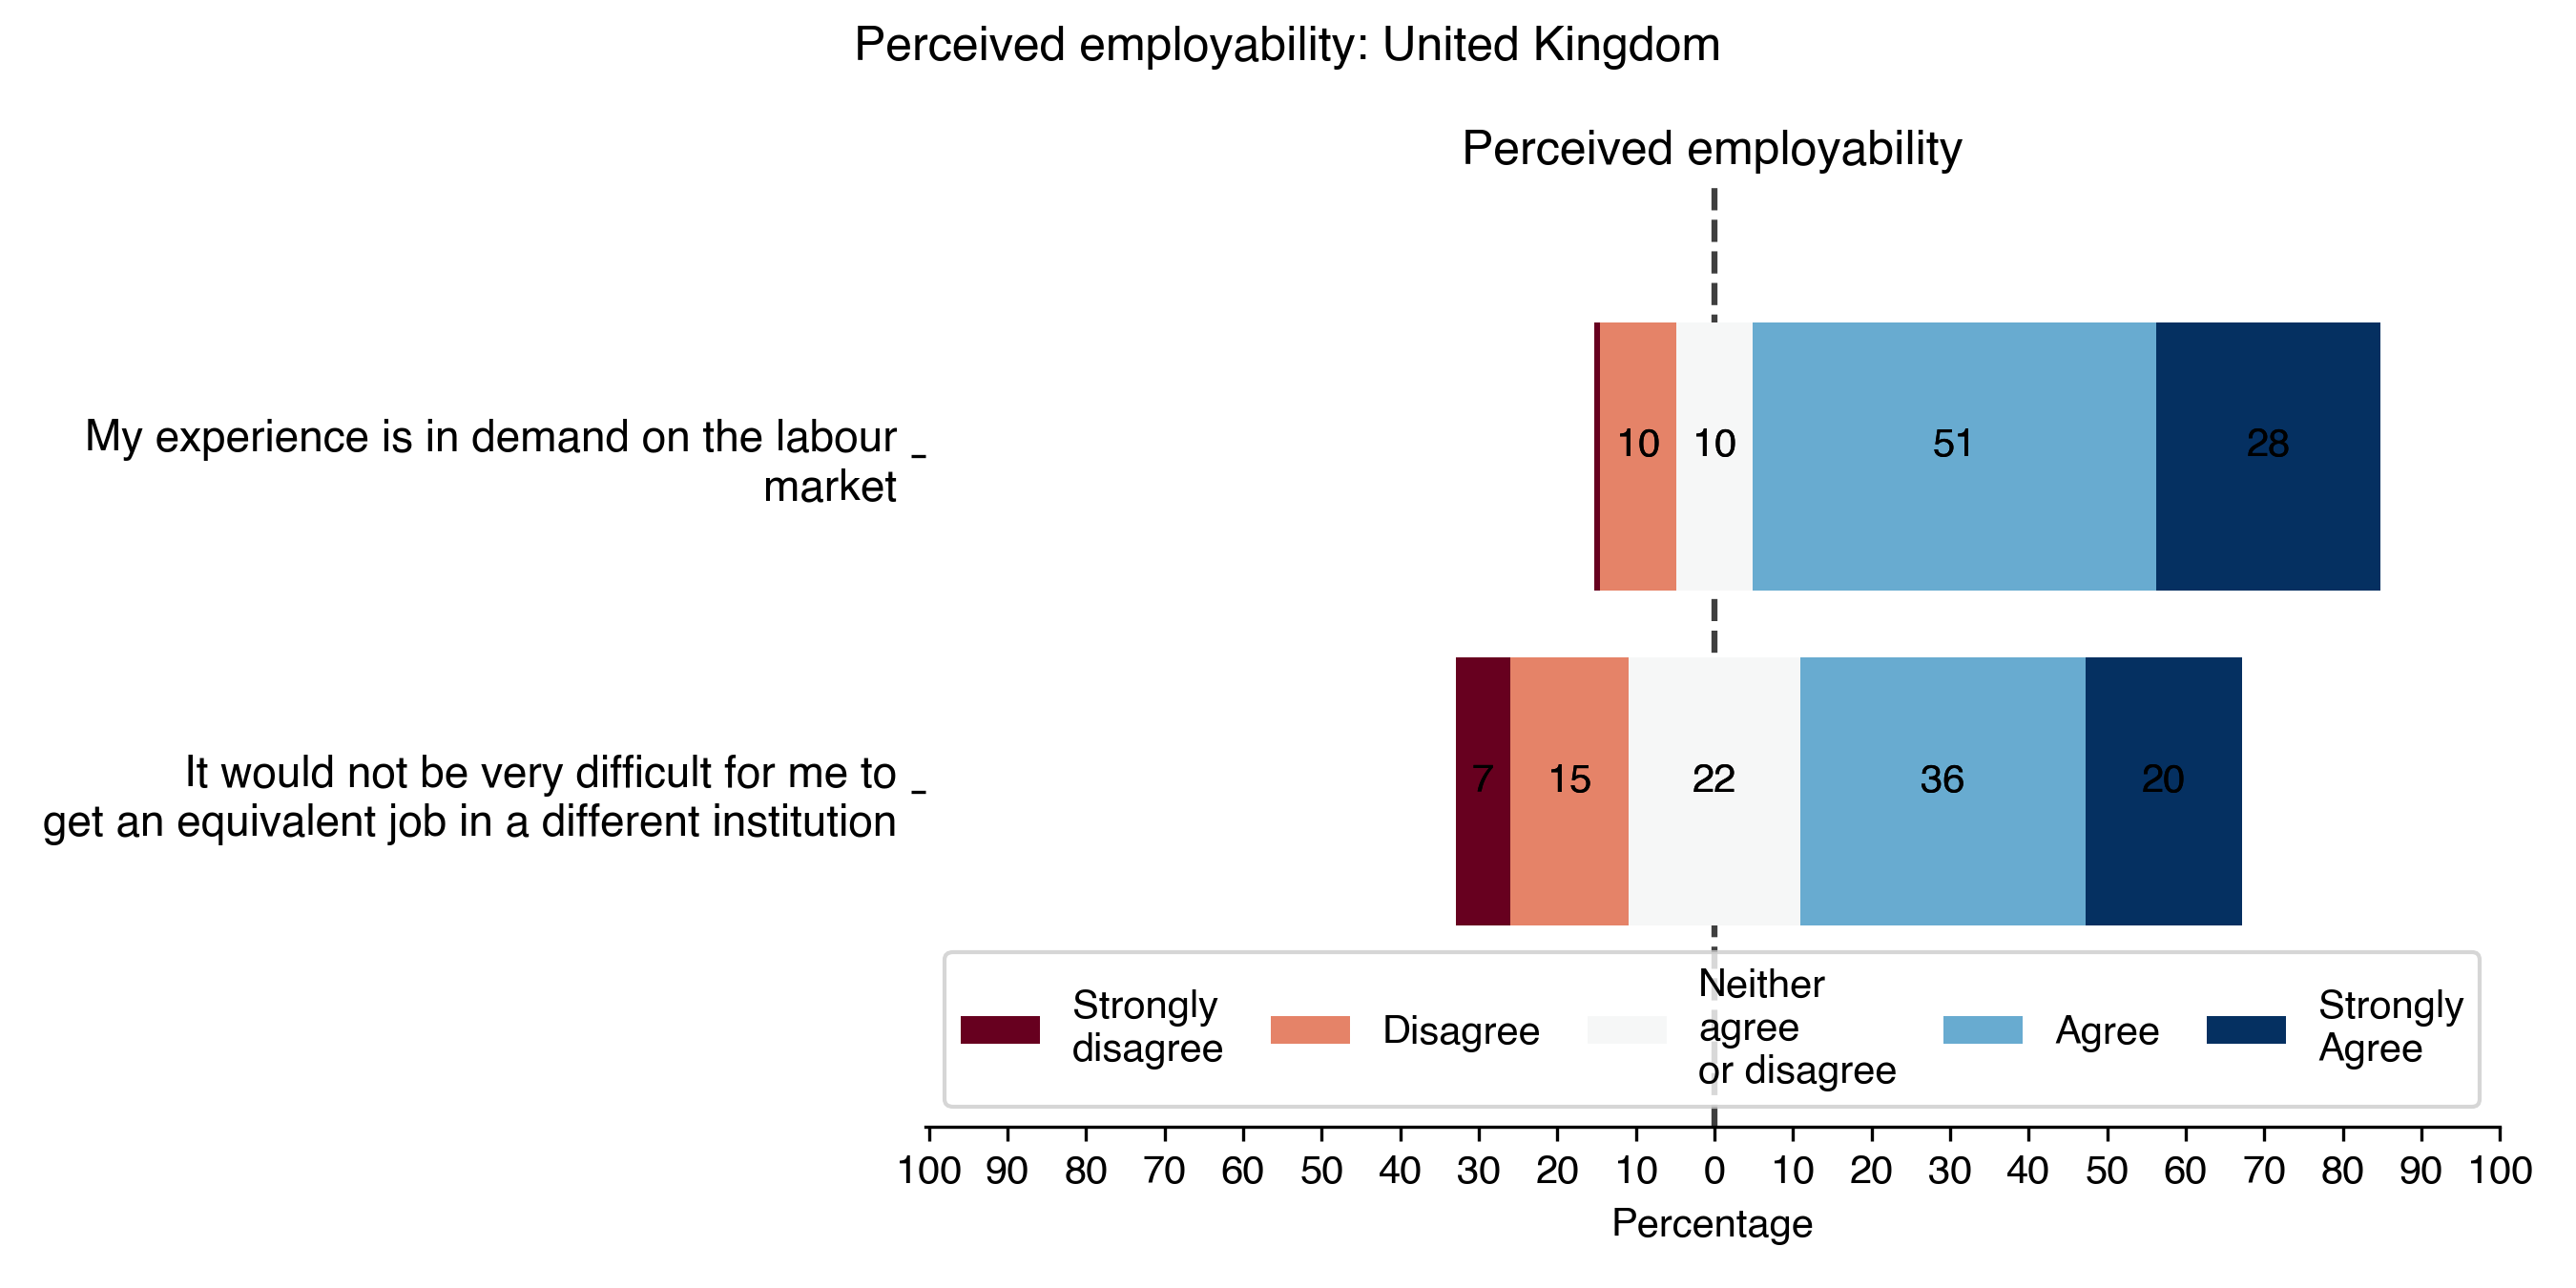
Job satisfaction is an essential pulse to take about a community’s health. It helps to track the evolution and the current state of the RSEs within their role and to catch any sign of structural or organisational dysfunction that are translated into well-being. There are a lot of different metrics to measure the quality of a job on a personal and psychological level [1]. Several models exist to understand the link between different factors of job satisfaction and turnover intention [2]–[6]. Turnover intention is an important measure that is highly associated with the risk of employees leaving the organisation [3]. Job satisfaction is important in retaining RSEs. Perceived employability provides information on how workers values their own skills in regard of the market. To measure the different attitudes toward the RSE role, we used scales that have been created in [5], [6], [7], [8]. These are Likert scale [7], which are 5 point ordinal scales graduated from Strongly disagree to Strongly agree. Each scale is composed of several so called items (i.e. questions) that each measure one attitude.
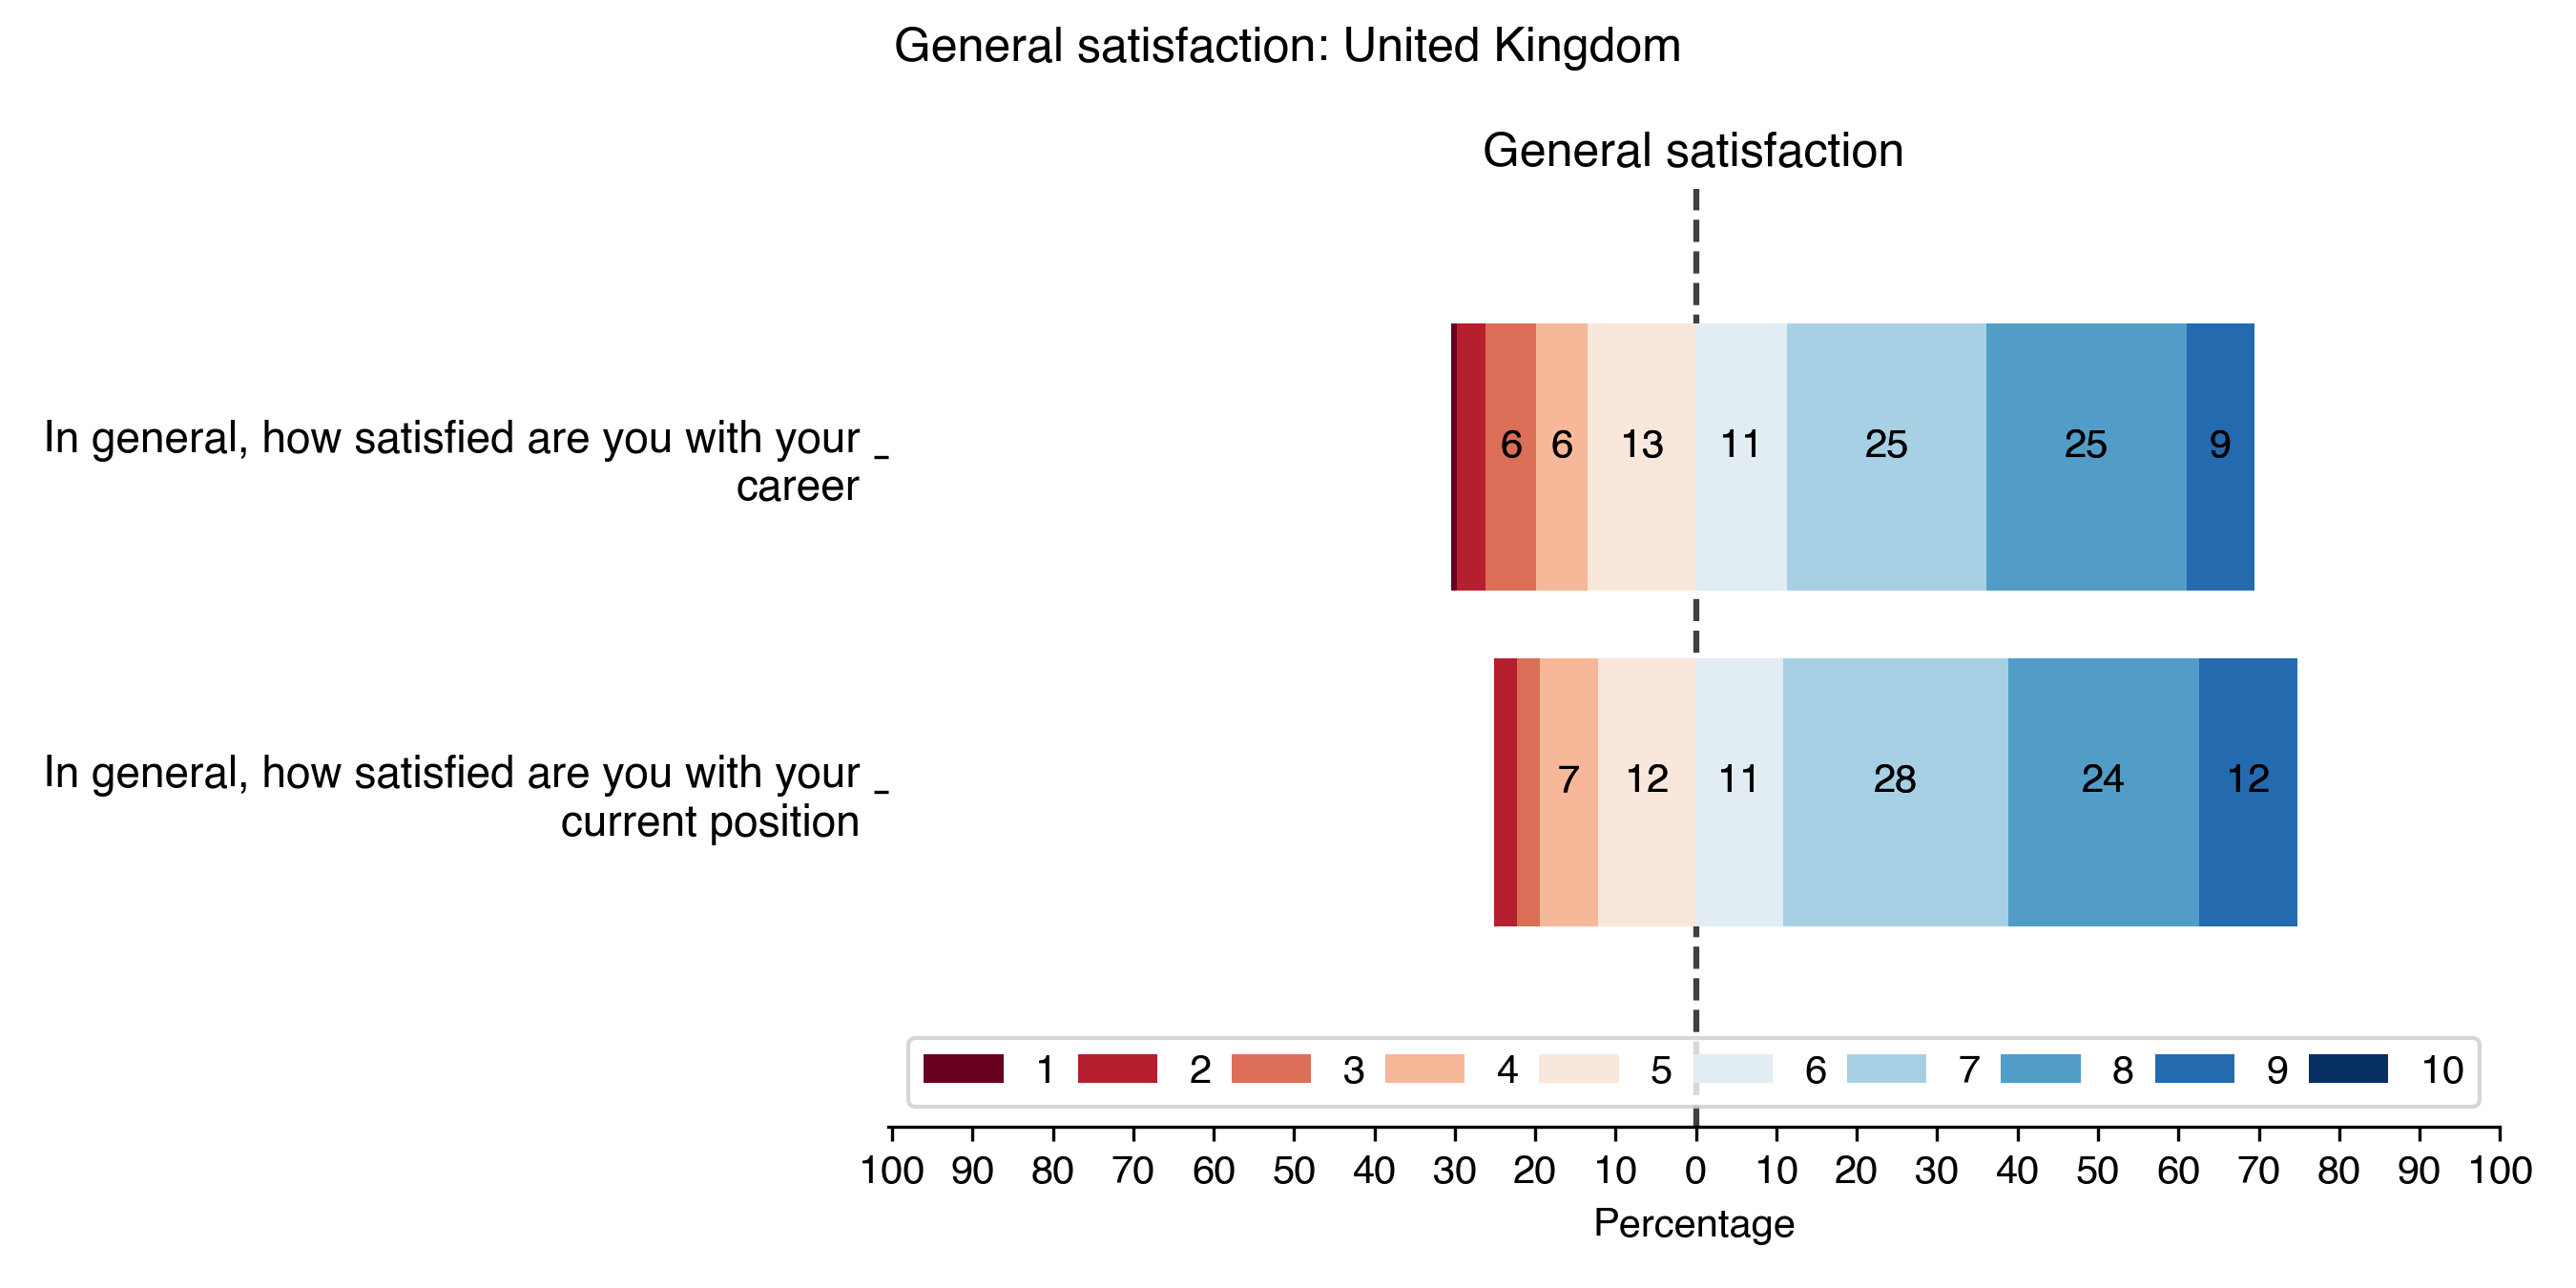
Beside these specific concepts we asked more general question about their satisfaction in their current position and their satisfaction with their career in general with a range of answers from 0 (not at all satisfied) to 10 (completely satisfied).
The specific questions about their job satisfaction reflect, in general, the same opinion as the two more generic questions. However, the granularity helps to identify a couple of issues that would not appears with generic questions:
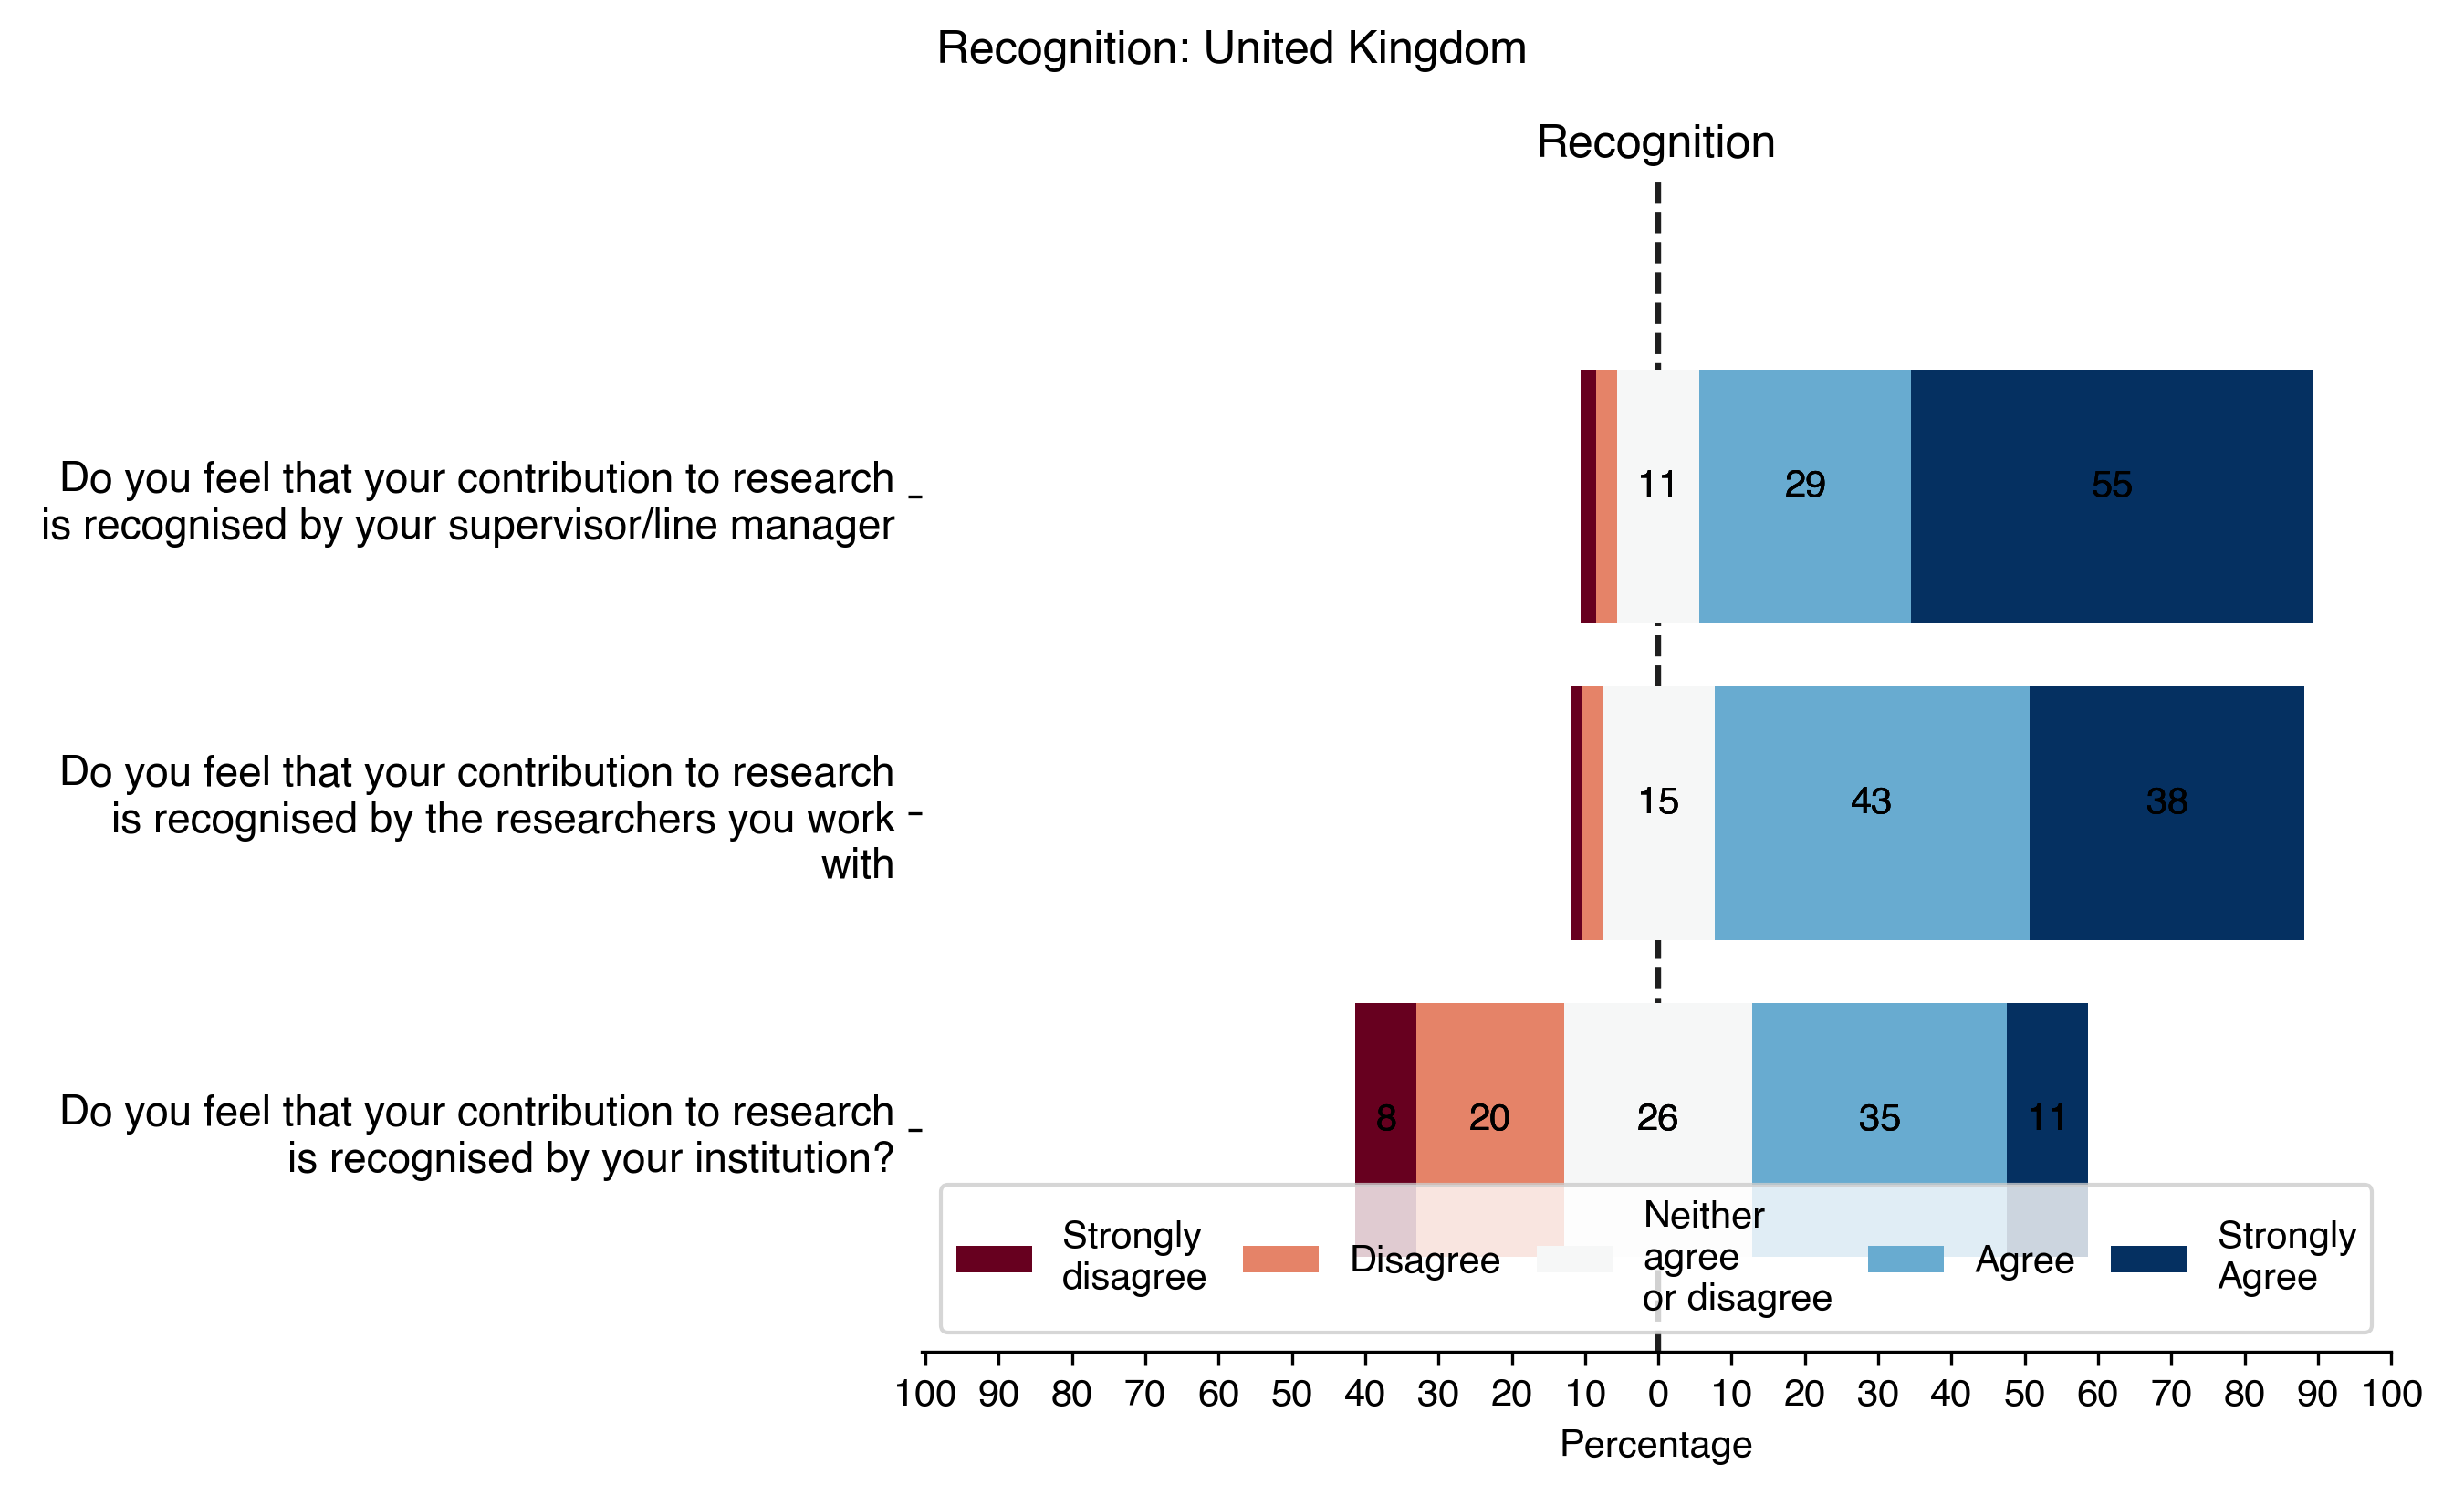
- Recognition: These questions ask if the RSEs feel that they receive enough information about their work and their performance.
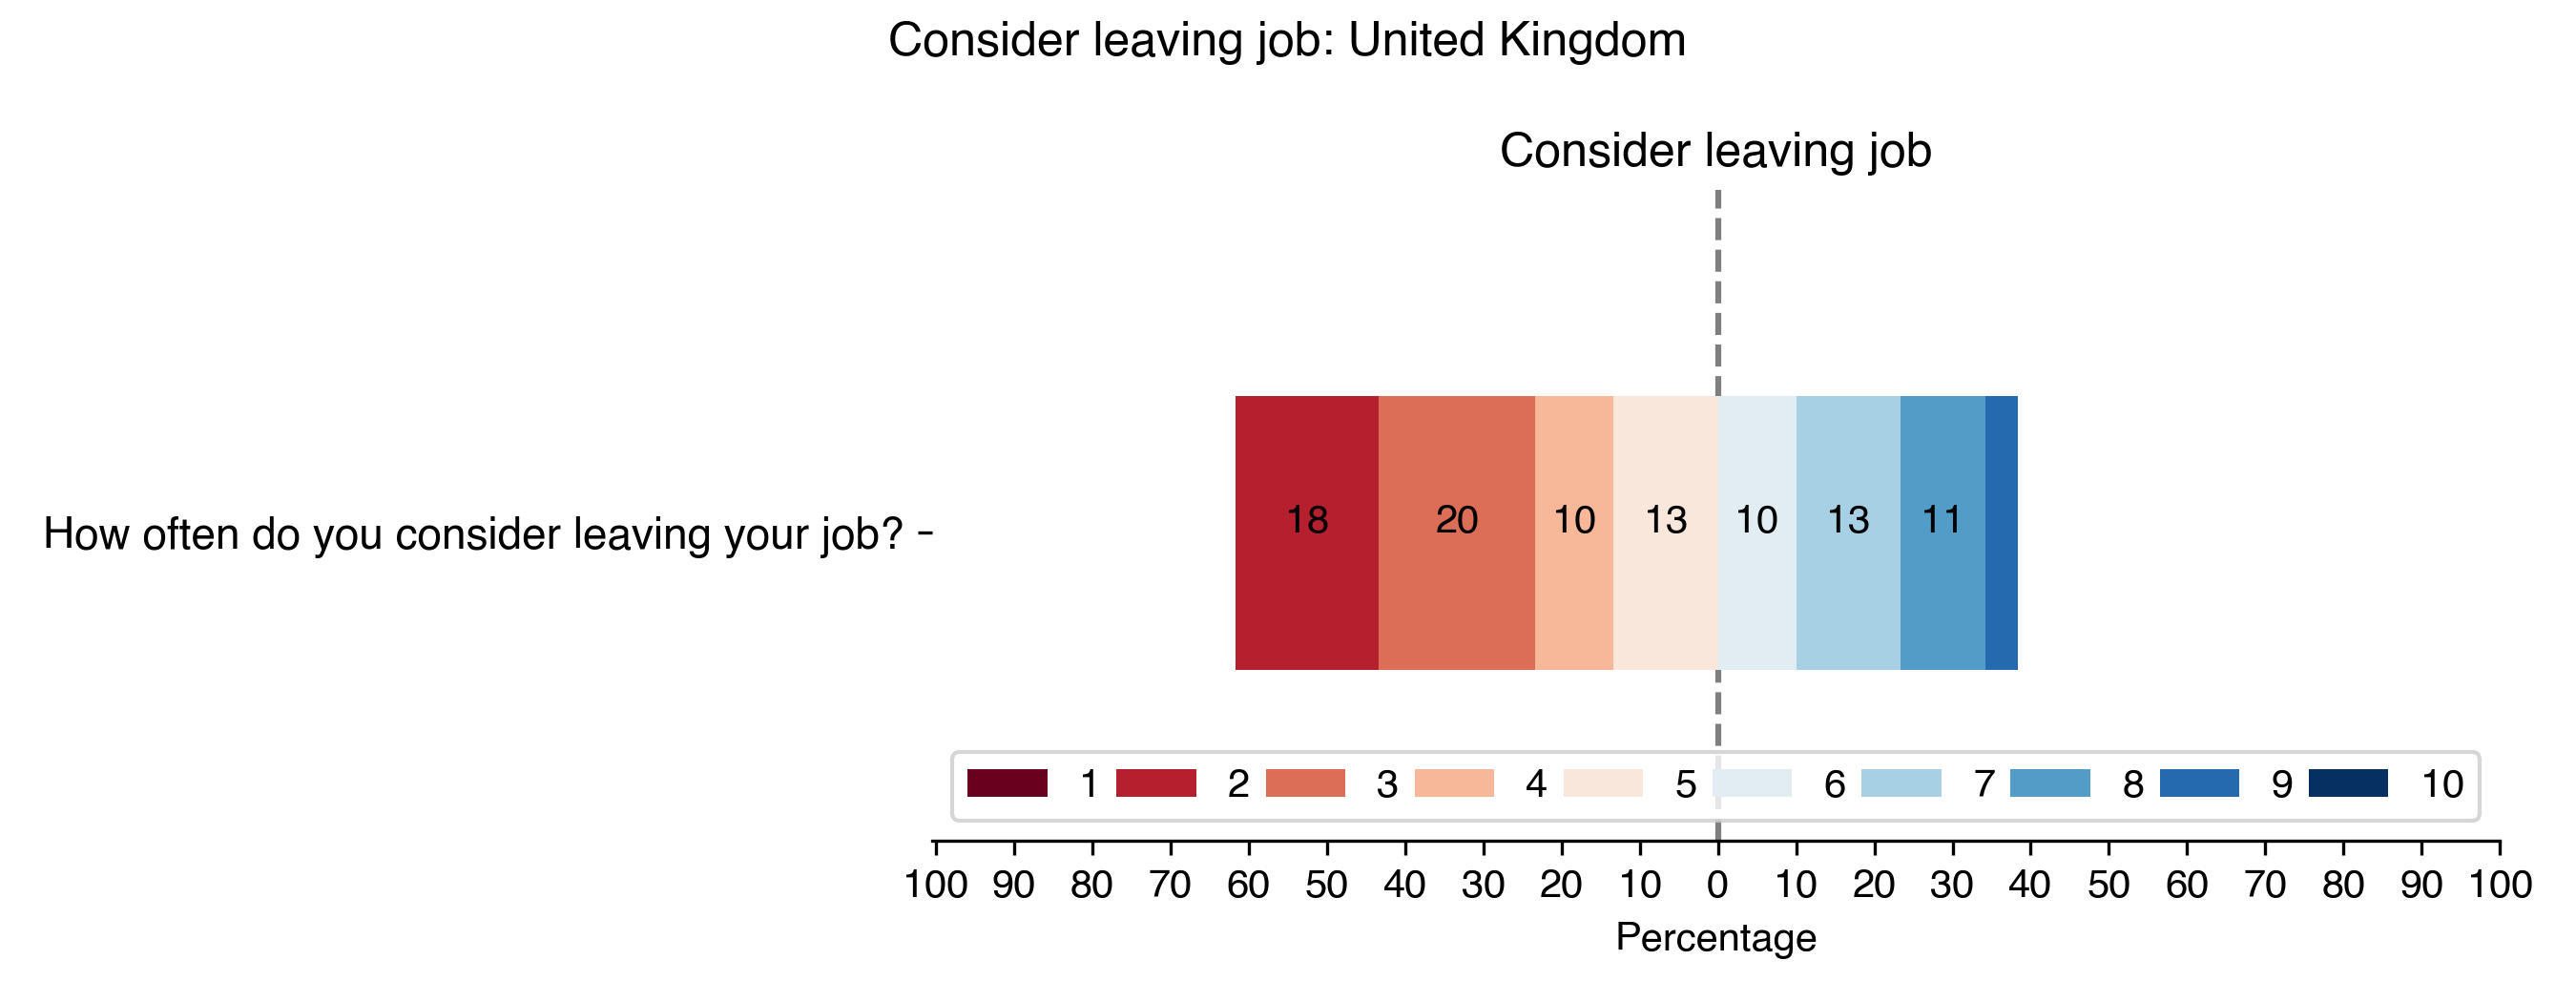
- The turnover intention: These questions aim to measure the desire to quit their current position.
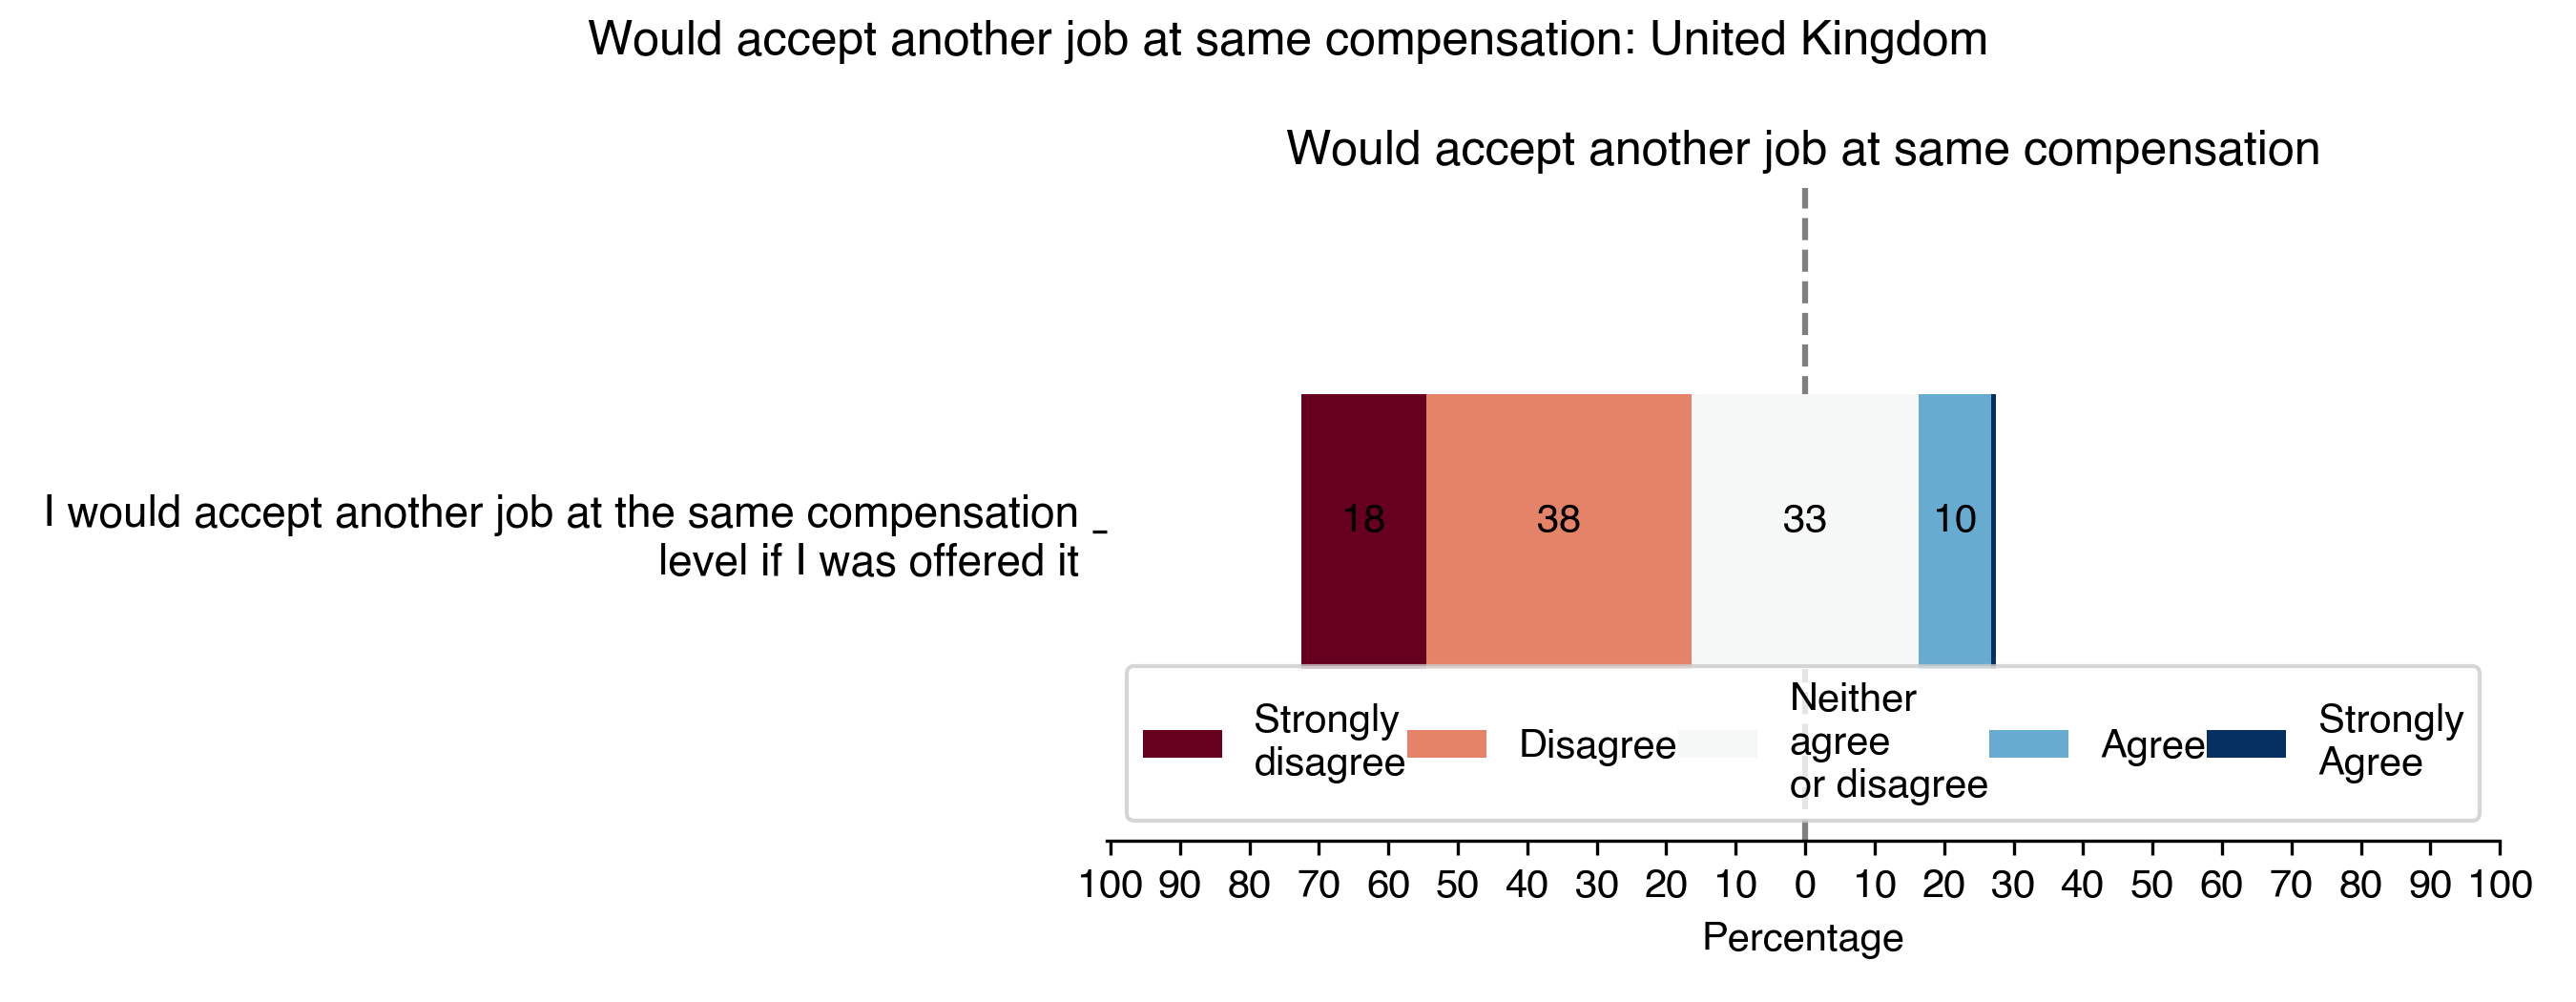
- The perceived employability: This concept is linked to the previous one. People may not have the intention to leave their jobs, not because they like it, but because they fear they are not employable.
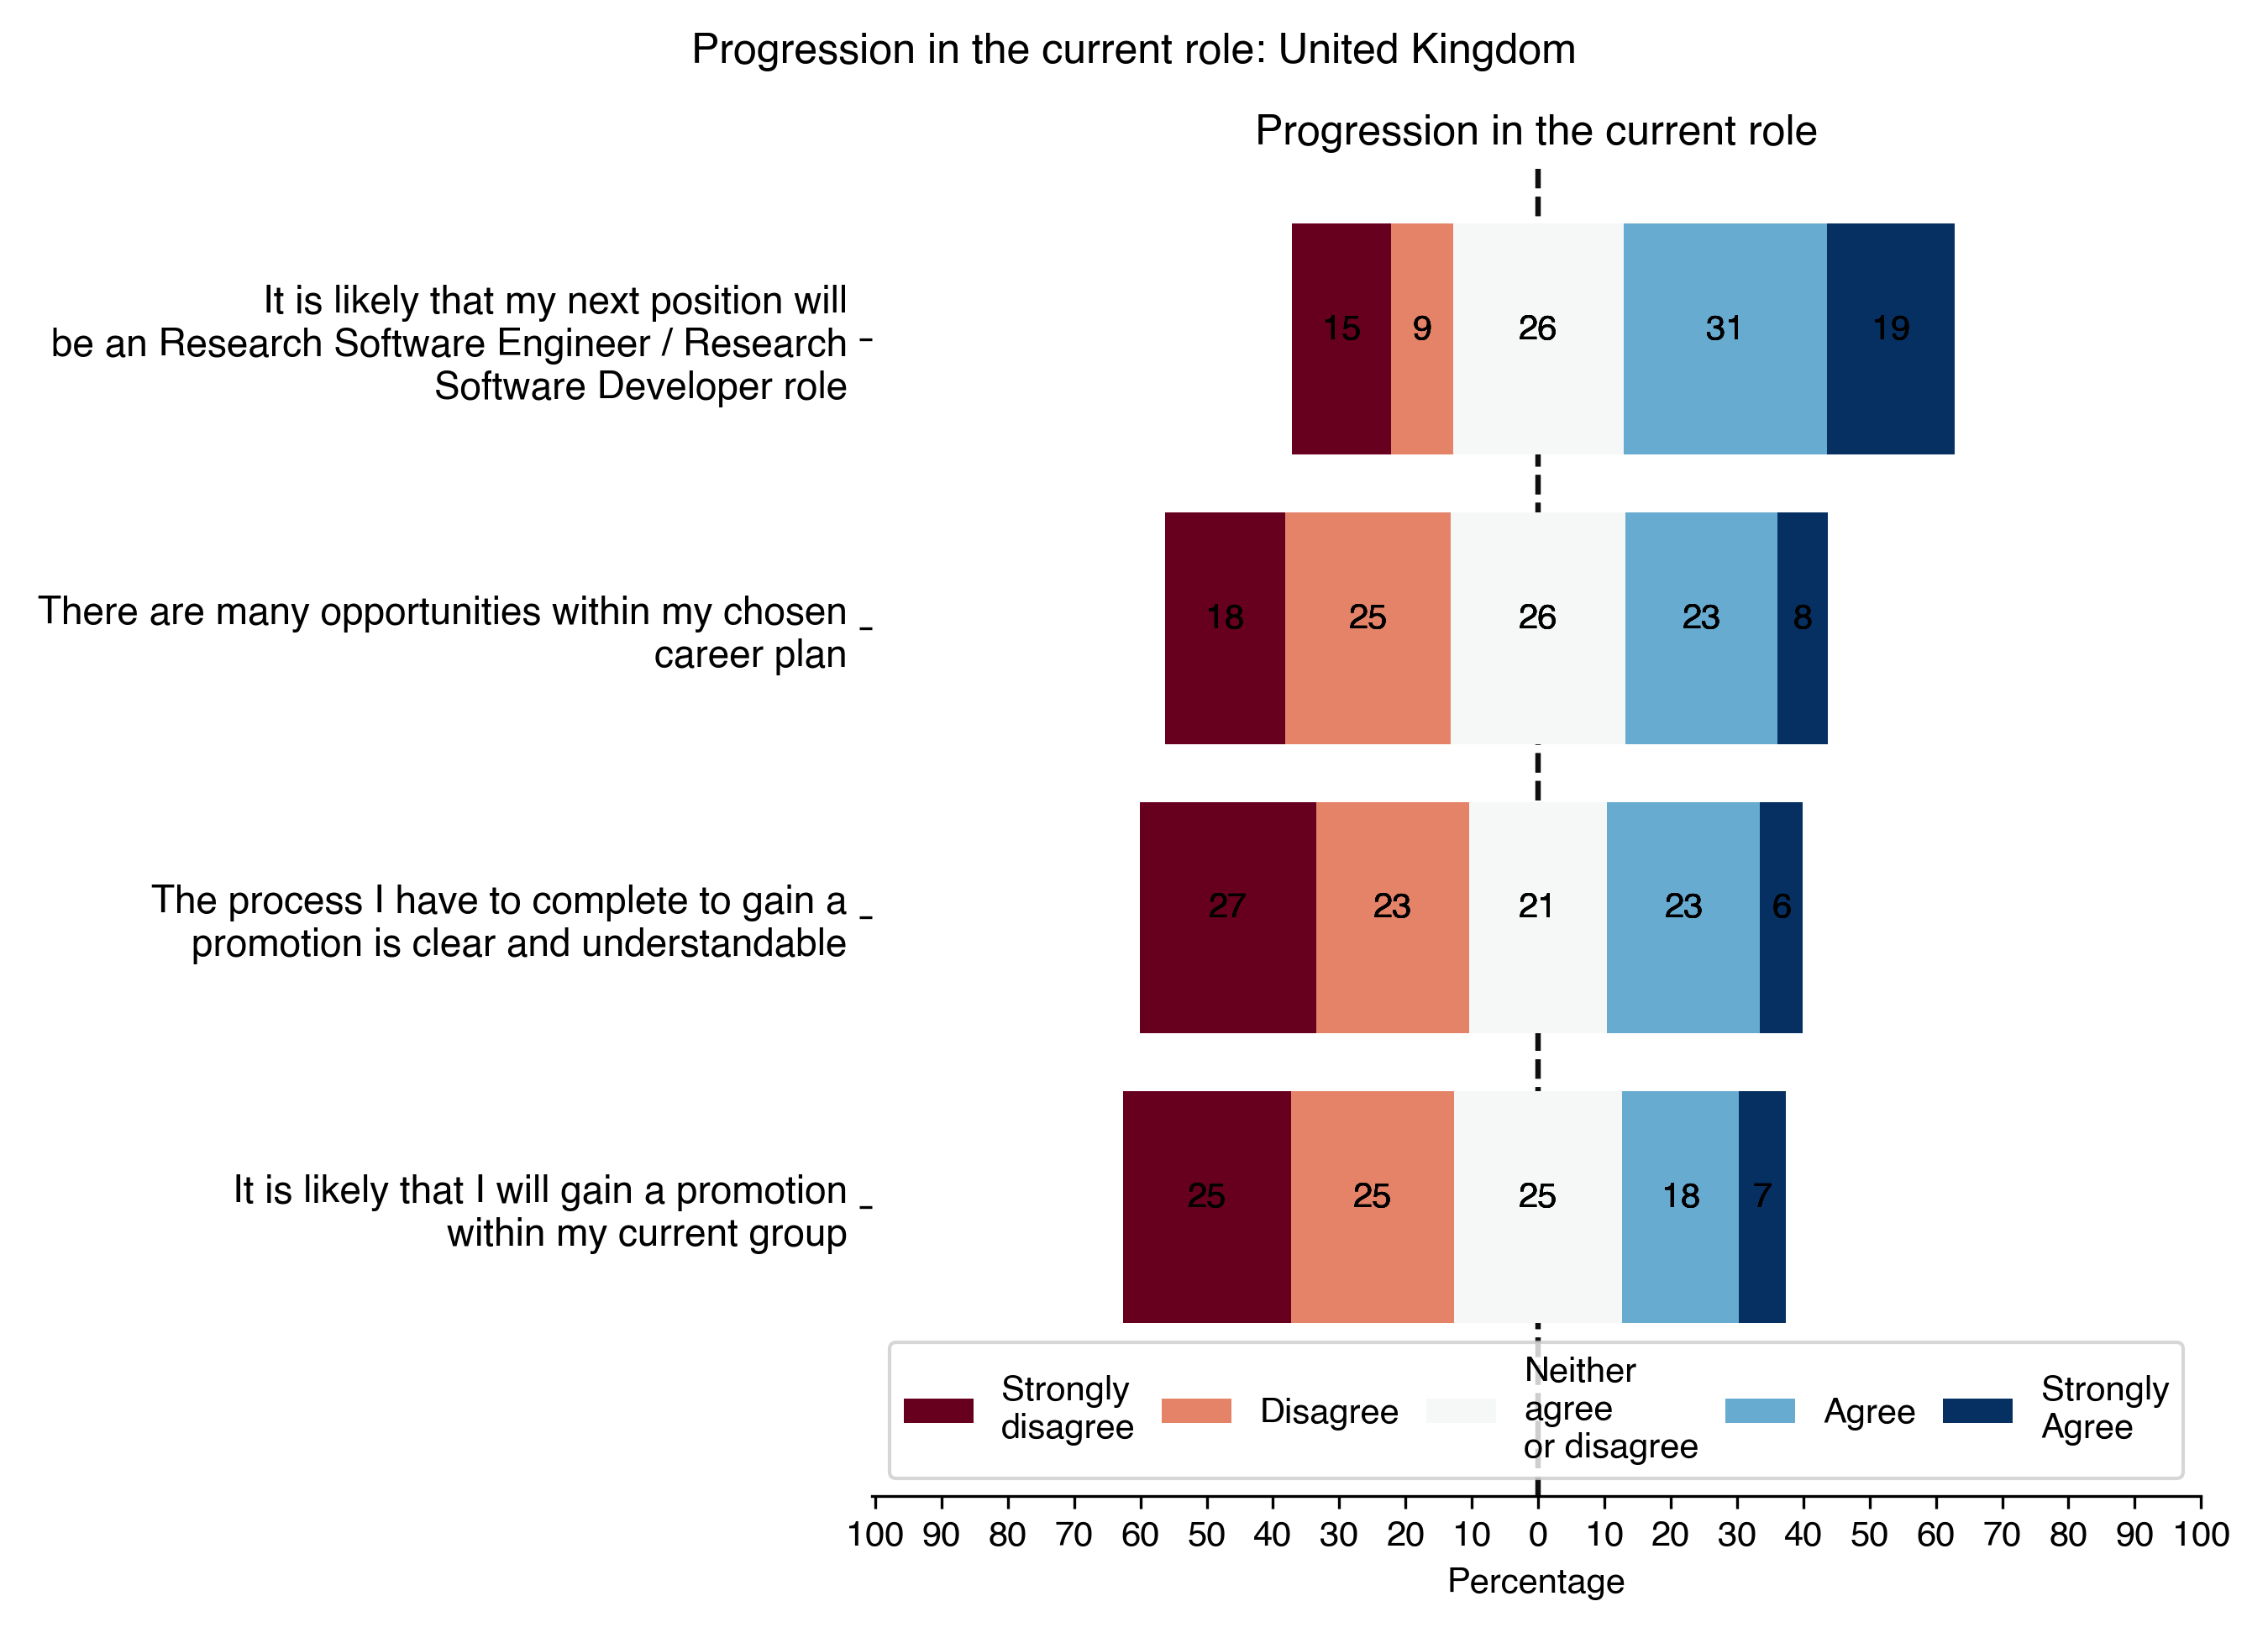
- The possibility of progression: This question aims to study the possibility of evolution for the RSEs, if information is available and if they see a possibility of evolution within their current career. This is the only questions that clearly received negative answers.
Questions in this section:
All questions were asked in a Likert scale.
- In general, how satisfied are you with your current position?
- In general, how satisfied are you with your career?
- Do you feel that your contribution to research is recognised by your supervisor/line manager?
- Do you feel that your contribution to research is recognised by the researchers you work with?
- Do you feel that your contribution to research is recognised by your institution?
- How often do you consider leaving your job?
- I would accept another job at the same compensation level if I was offered it
- It would not be very difficult for me to get an equivalent job in a different institution
- My experience is in demand on the labour market
- It is likely that I will gain a promotion within my current group
- The process I have to complete to gain a promotion is clear and understandable
- There are many opportunities within my chosen career plan
- It is likely that my next position will be an Research Software Engineer / Research
/References/
- B. Aziri, “Job satisfaction: A literature review,” vol. 3, no. 4, pp. 77–86.
- N. De Cuyper, S. Mauno, U. Kinnunen, and A. Mkikangas, “The role of job resources in the relation between perceived employability and turnover intention: A prospective two-sample study,” vol. 78, no. 2, pp. 253–263.
- A. B. Bakker and E. Demerouti, “The job demands-resources model: State of the art,” vol. 22, no. 3, pp. 309–328.
- G. H. L. Cheng and D. K. S. Chan, “Who Suffers More from Job Insecurity? A Meta-Analytic Review.” vol. 57, no. 2, p. 272.
- E. R. Thompson and F. T. Phua, “A brief index of affective job satisfaction,” vol. 37, no. 3, pp. 275–307.
- L. Greenhalgh and Z. Rosenblatt, “Job insecurity: Toward conceptual clarity,” pp. 438–448.
- R. Likert, “A technique for the measurement of attitudes.” vol. 22, no. 140, p. 55.
General satisfaction
Recognition
Turn-over intention
Perceived employability
Progression in the current role
Research software engineer
In this section we wanted to know if the participants are member or not of local organisations and if they are interested to participate to conference specific for RSE.
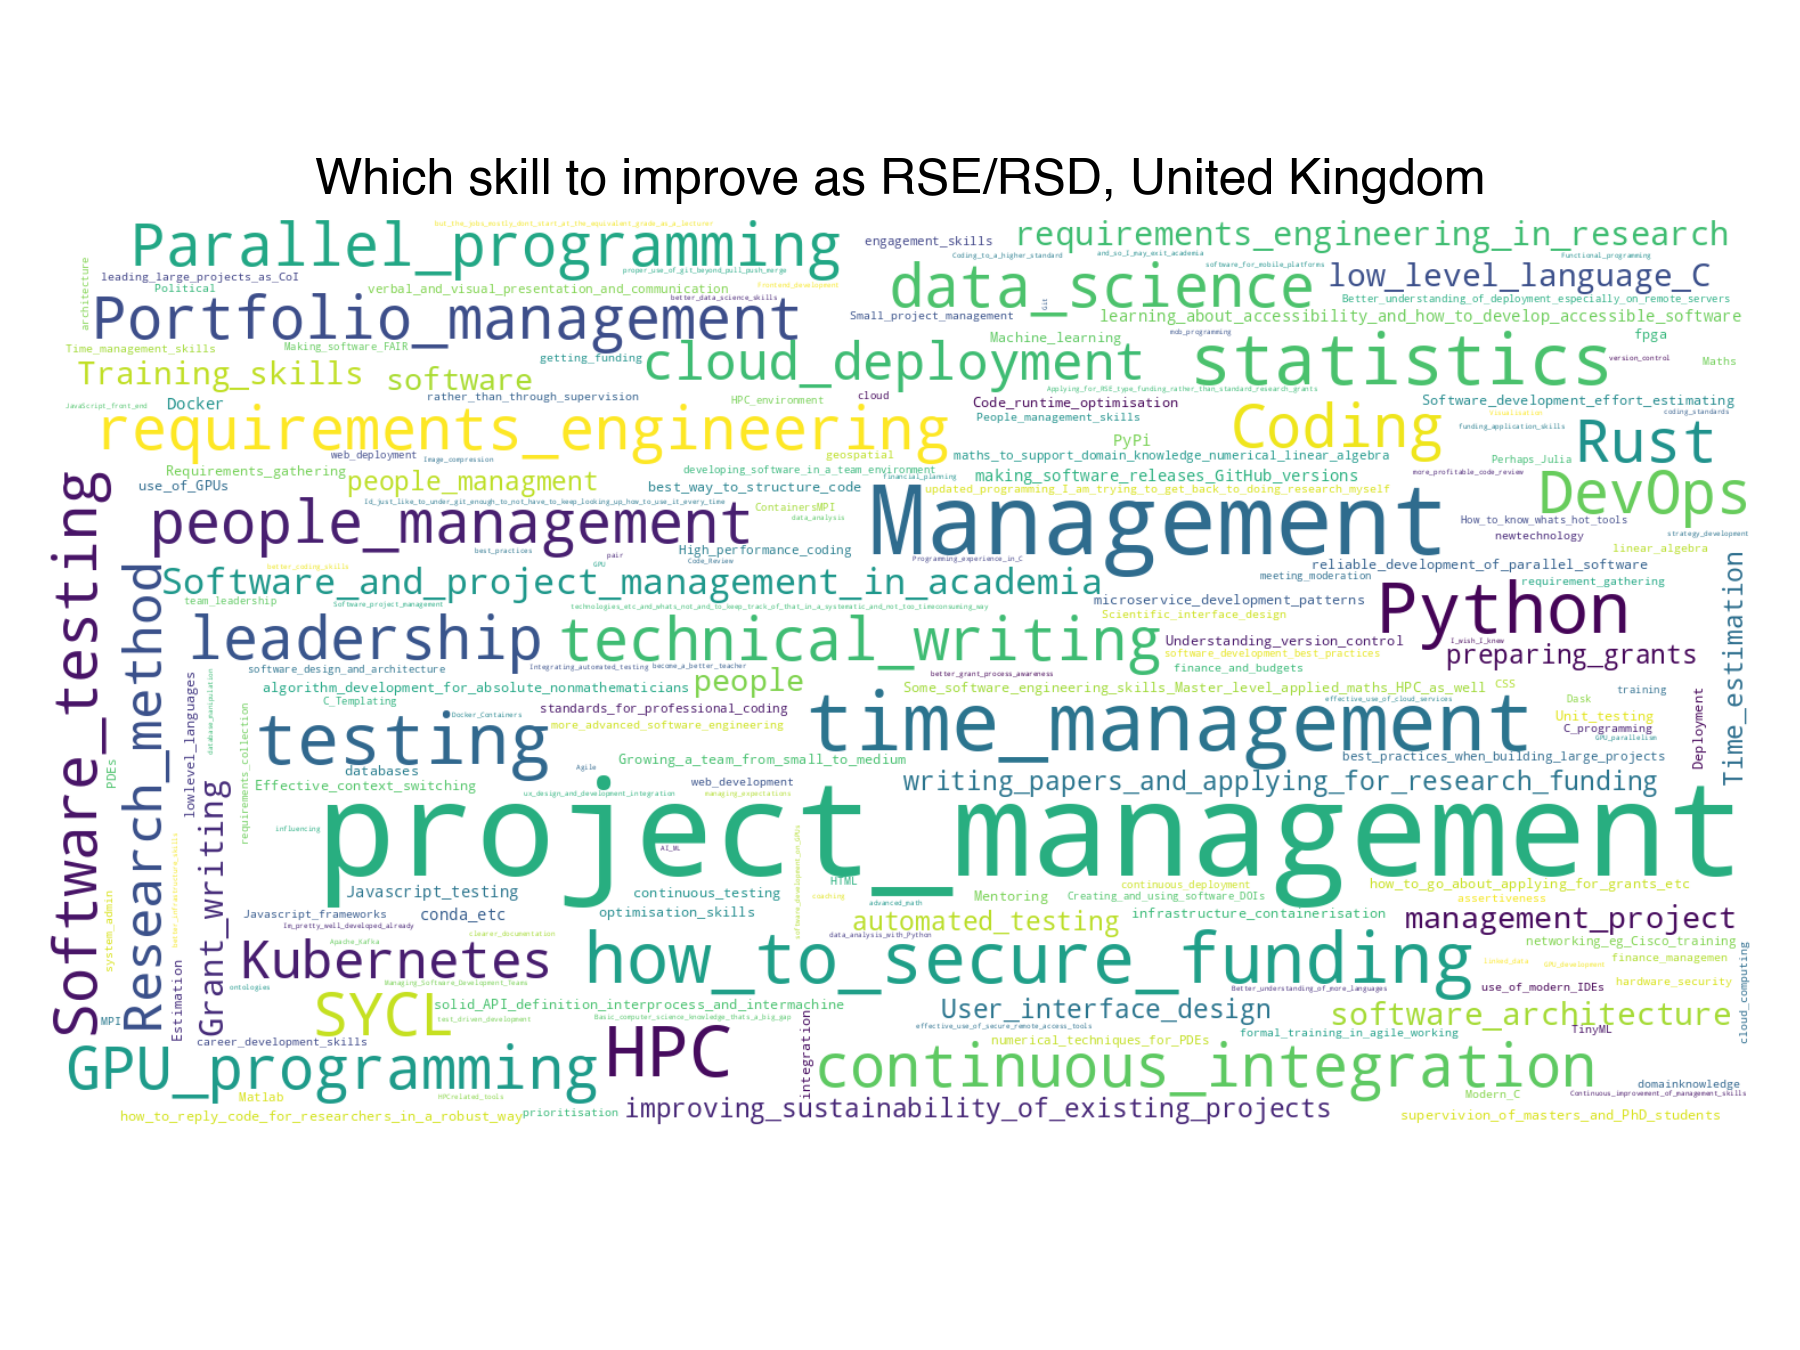
We also asked them to tell them which skills is important as RSE and which they and to acquire for their current role.
Questions in this section
- Are you a member of an association of Research Software Developers (e.g. AUS-RSE, CANARIE, DE-RSE, NZ_RSE, UK RSE, …)? (yes-no)
- Would you be interested in joining such an organisation? (yes-no)
- What is important for such an organisation? (multiple choice)
- Would you like to attend a conference about software development in academia? (yes-no)
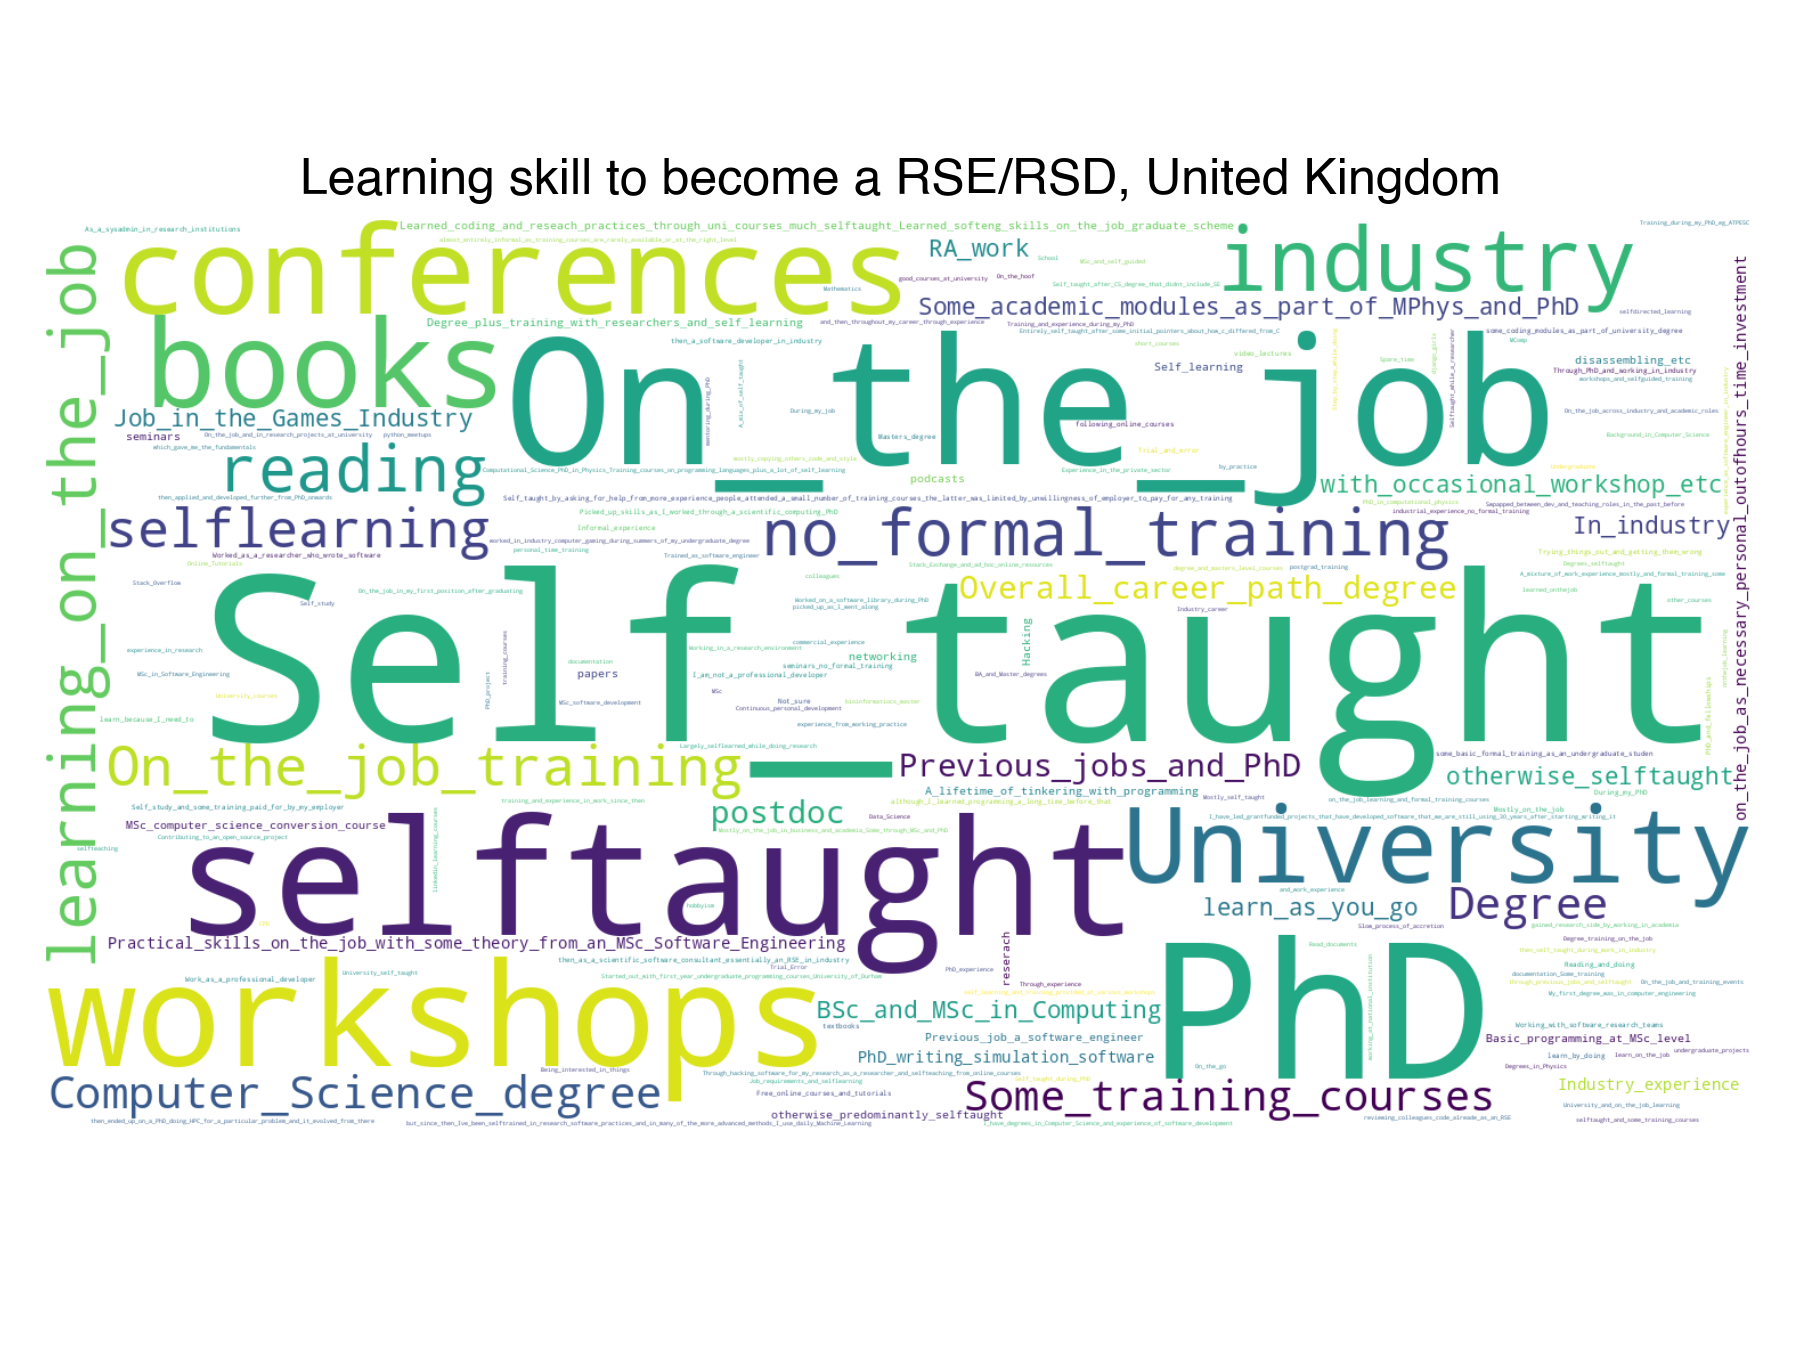
- How did you learn the skills you need to become an Research Software Engineer / Research Software Developer? (free text)
- What three skills would you like to acquire or improve to help your work as a Research Software Engineer/ Research Software Developer? The skills can be technical and non-technical (free text)
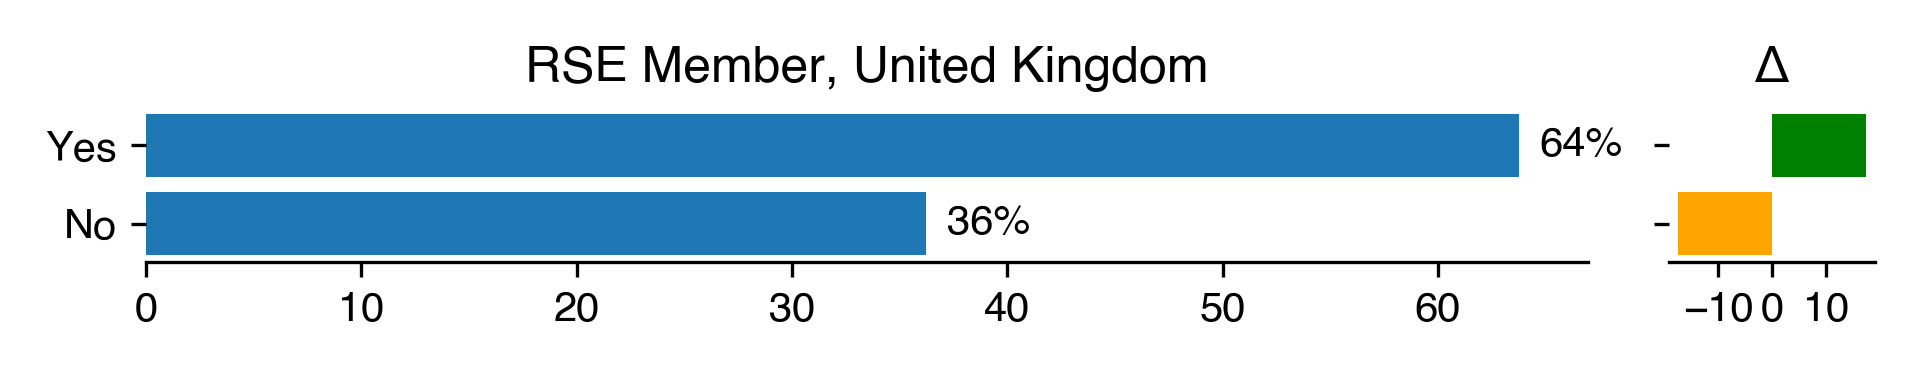
RSE member
| RSE Member for United Kingdom | Count | Percentage | Percentage in 2018 | Difference with previous year |
|---|---|---|---|---|
| Yes | 88 | 63.77 | 46.34 | 17.43 |
| No | 50 | 36.23 | 53.66 | -17.43 |
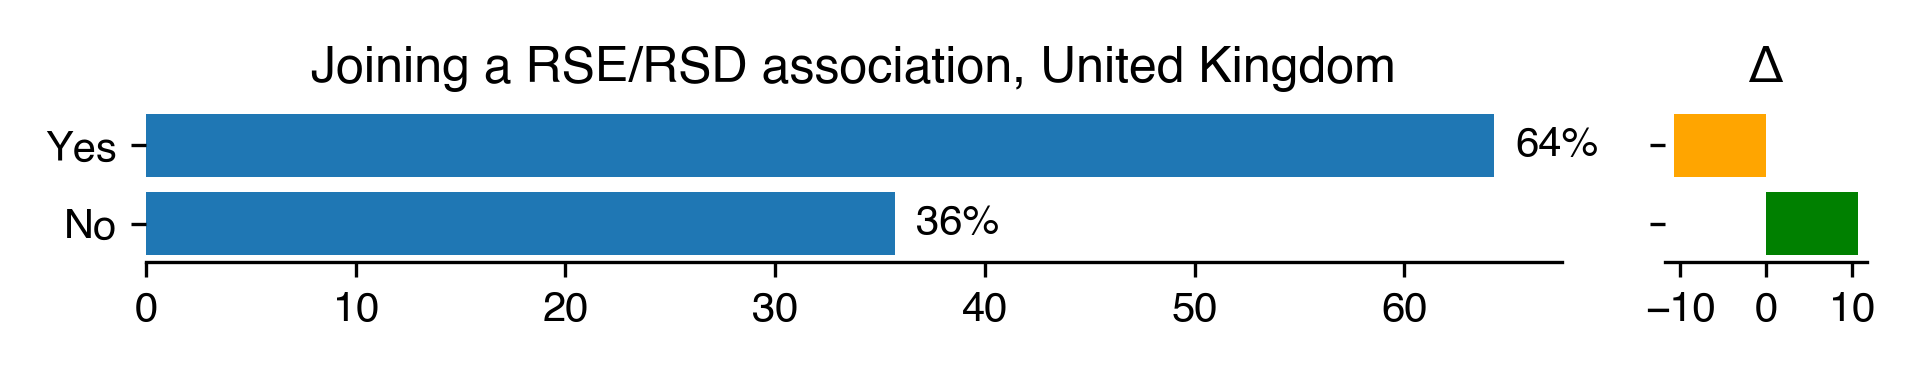
Joining a RSE/RSD association
| Joining a RSE/RSD association for United Kingdom | Count | Percentage | Percentage in 2018 | Difference with previous year |
|---|---|---|---|---|
| Yes | 27 | 64.29 | 75 | -10.71 |
| No | 15 | 35.71 | 25 | 10.71 |
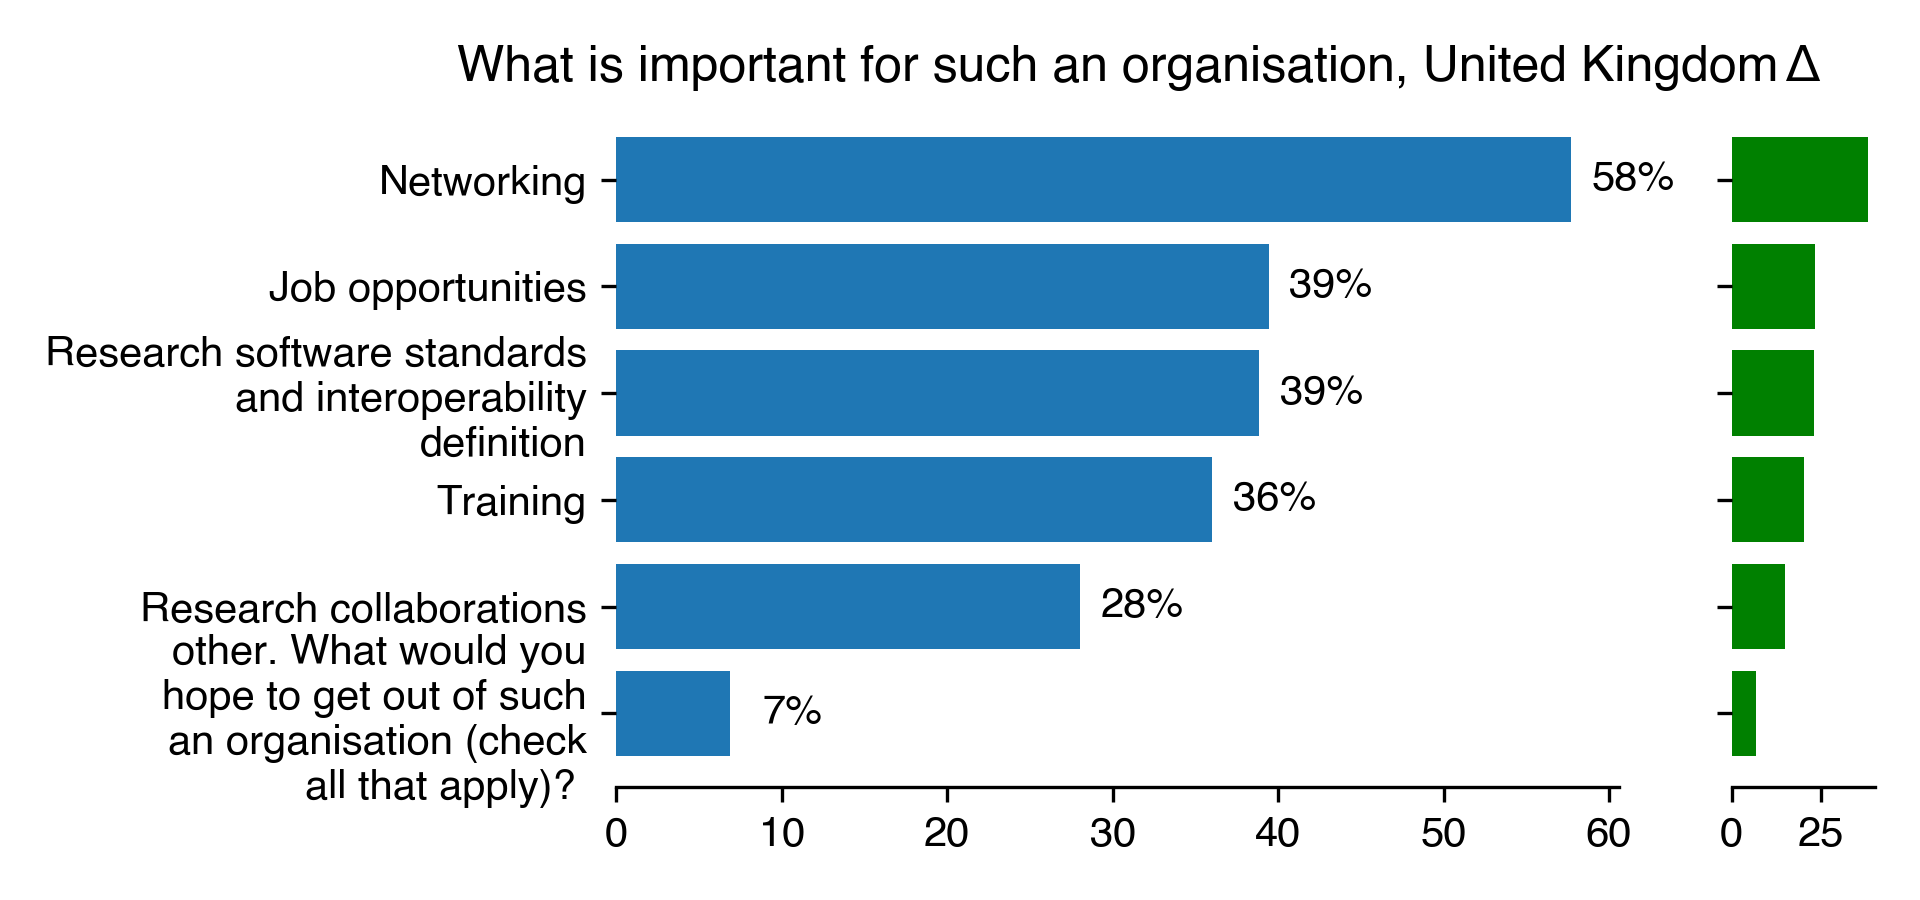
What is important for such an organisation
| What is important for such an organisation for United Kingdom | Count | Percentage | Percentage in 2018 | Difference with previous year |
|---|---|---|---|---|
| Networking | 101 | 57.71 | 19.49 | 38.22 |
| Job opportunities | 69 | 39.43 | 16.1 | 23.33 |
| Research software standards and interoperability definition | 68 | 38.86 | 15.68 | 23.18 |
| Training | 63 | 36 | 15.68 | 20.32 |
| Research collaborations | 49 | 28 | 13.14 | 14.86 |
| other. What would you hope to get out of such an organisation (check all that apply)? | 12 | 6.86 | 0 | 6.86 |
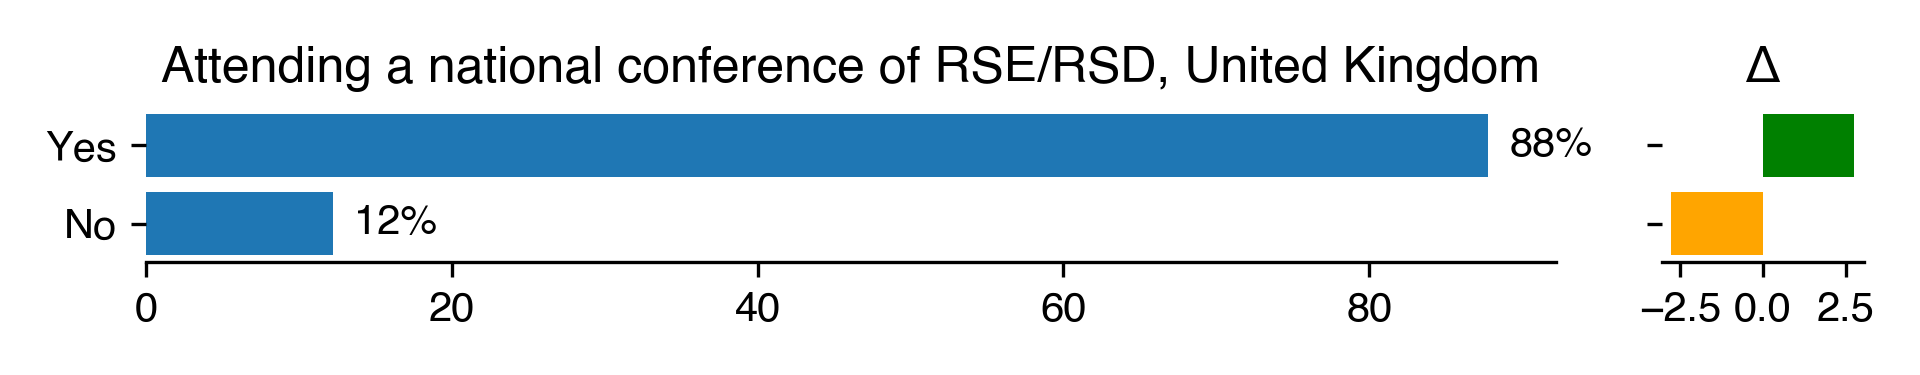
Attending a national conference of RSE/RSD
| Attending a national conference of RSE/RSD for United Kingdom | Count | Percentage | Percentage in 2018 | Difference with previous year |
|---|---|---|---|---|
| Yes | 115 | 87.79 | 85.03 | 2.76 |
| No | 16 | 12.21 | 14.97 | -2.76 |
Learning skills for RSE/RSD
Which skills to improve