Questions in this section Australia Canada Germany Netherlands New Zealand South Africa United Kingdom United States World
Several questions were about the participants’ previous job. The idea is to
collect insights of their career path and understand what their motivations are
to be an RSE.
We also asked the participants to rank the reasons why they chose their actual
position among 8 different ones:
Desire to work in a research environment
Freedom to choose own working practices
Desire to advance research
I want to learn new skills
Opportunity to develop software
Flexible working hours
Ability to work across disciplines
Opportunity for career advancement
The salary
Where was your previous job based? (single choice)
Rank the following factors dependent on how strongly they influenced your decision to accept your current position (for clarity, displayed as a single bar chart of participants’ top ranking answer)
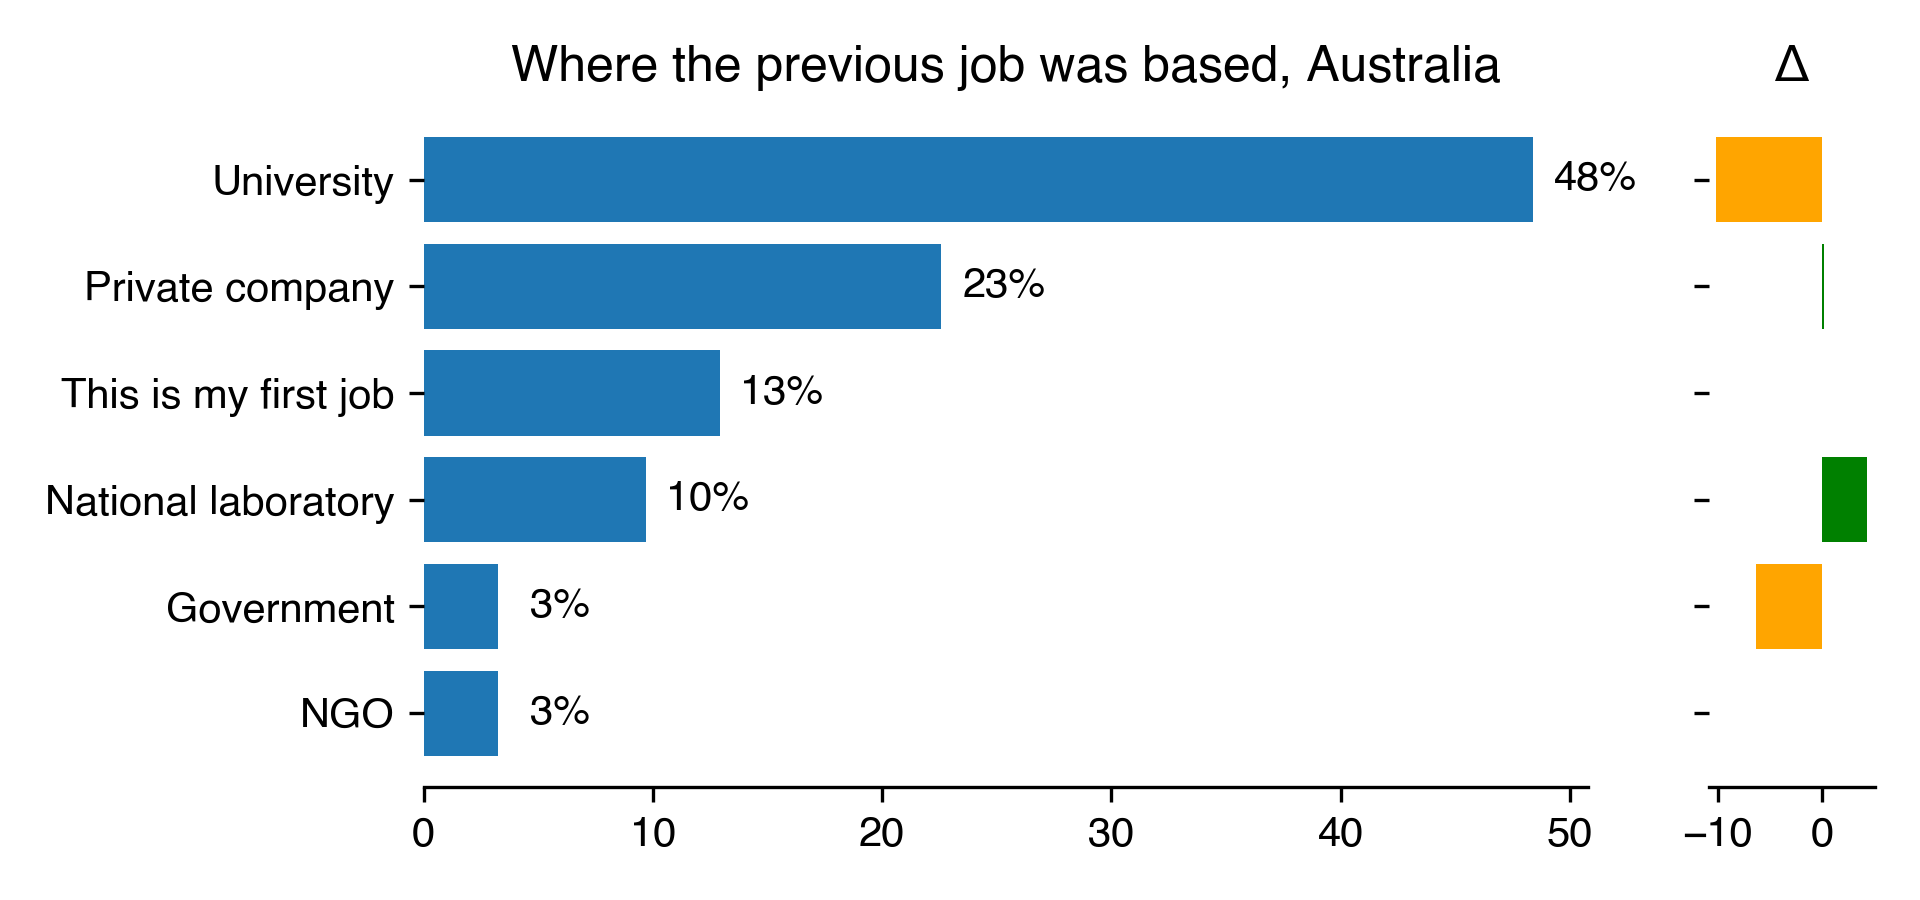
Where the previous job was based for Australia
Count
Percentage
Percentage in 2018
Difference with previous year
University
15
48.39
58.51
-10.12
Private company
7
22.58
22.34
0.24
This is my first job
4
12.9
nan
nan
National laboratory
3
9.68
5.32
4.36
Government
1
3.23
9.57
-6.35
NGO
1
3.23
nan
nan
Download CSV
2022-08-22T11:23:08.209669
image/svg+xml
Matplotlib v3.5.2, https://matplotlib.org/
PNG SVG
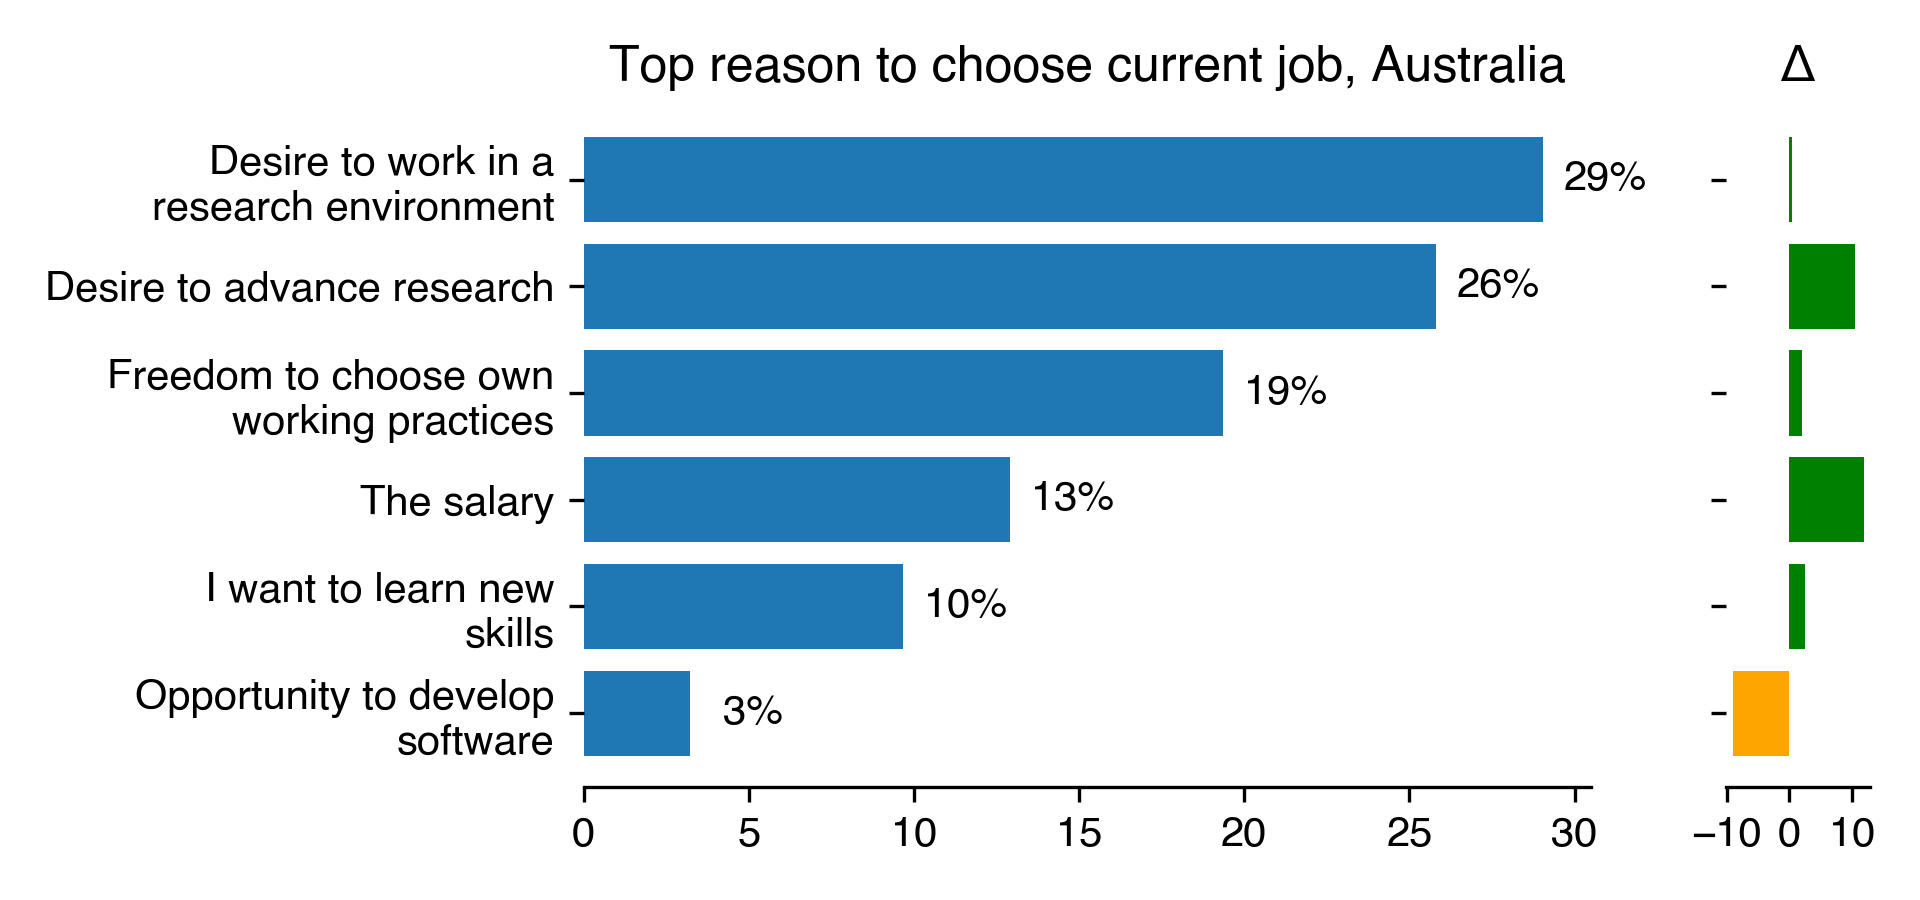
Top reason to choose current job for Australia
Count
Percentage
Percentage in 2018
Difference with previous year
Desire to work in a research environment
9
29.03
28.57
0.46
Desire to advance research
8
25.81
15.31
10.5
Freedom to choose own working practices
6
19.35
17.35
2.01
The salary
4
12.9
1.02
11.88
I want to learn new skills
3
9.68
7.14
2.53
Opportunity to develop software
1
3.23
12.24
-9.02
Download CSV
2022-08-22T11:23:08.651932
image/svg+xml
Matplotlib v3.5.2, https://matplotlib.org/
PNG SVG
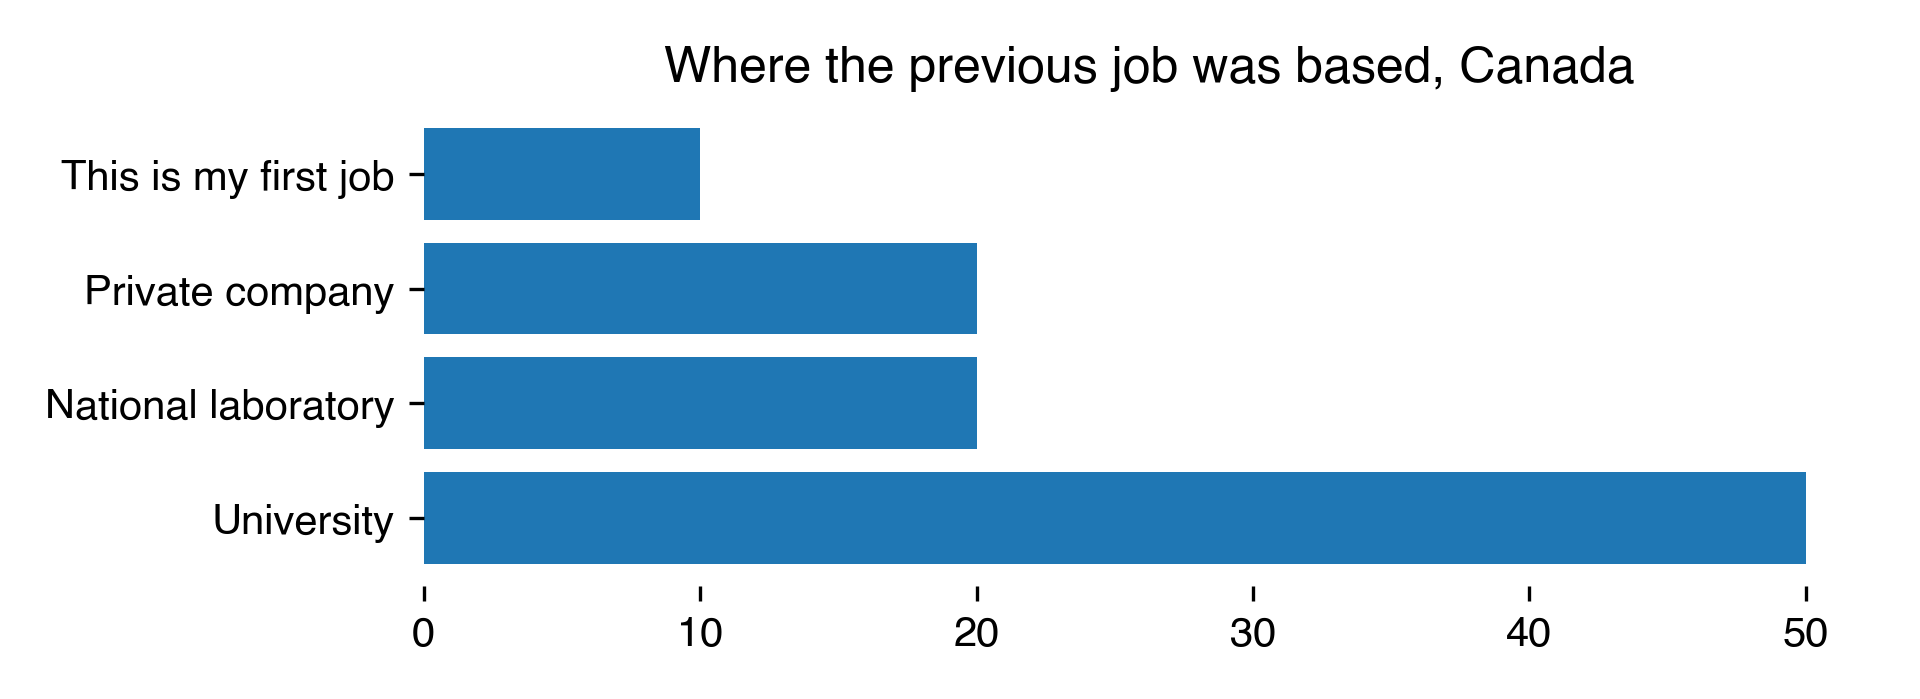
Where the previous job was based for Canada
Count
Percentage
University
5
50
Private company
2
20
National laboratory
2
20
This is my first job
1
10
Download CSV
2022-08-22T11:23:08.974212
image/svg+xml
Matplotlib v3.5.2, https://matplotlib.org/
PNG SVG
No data found in survey.
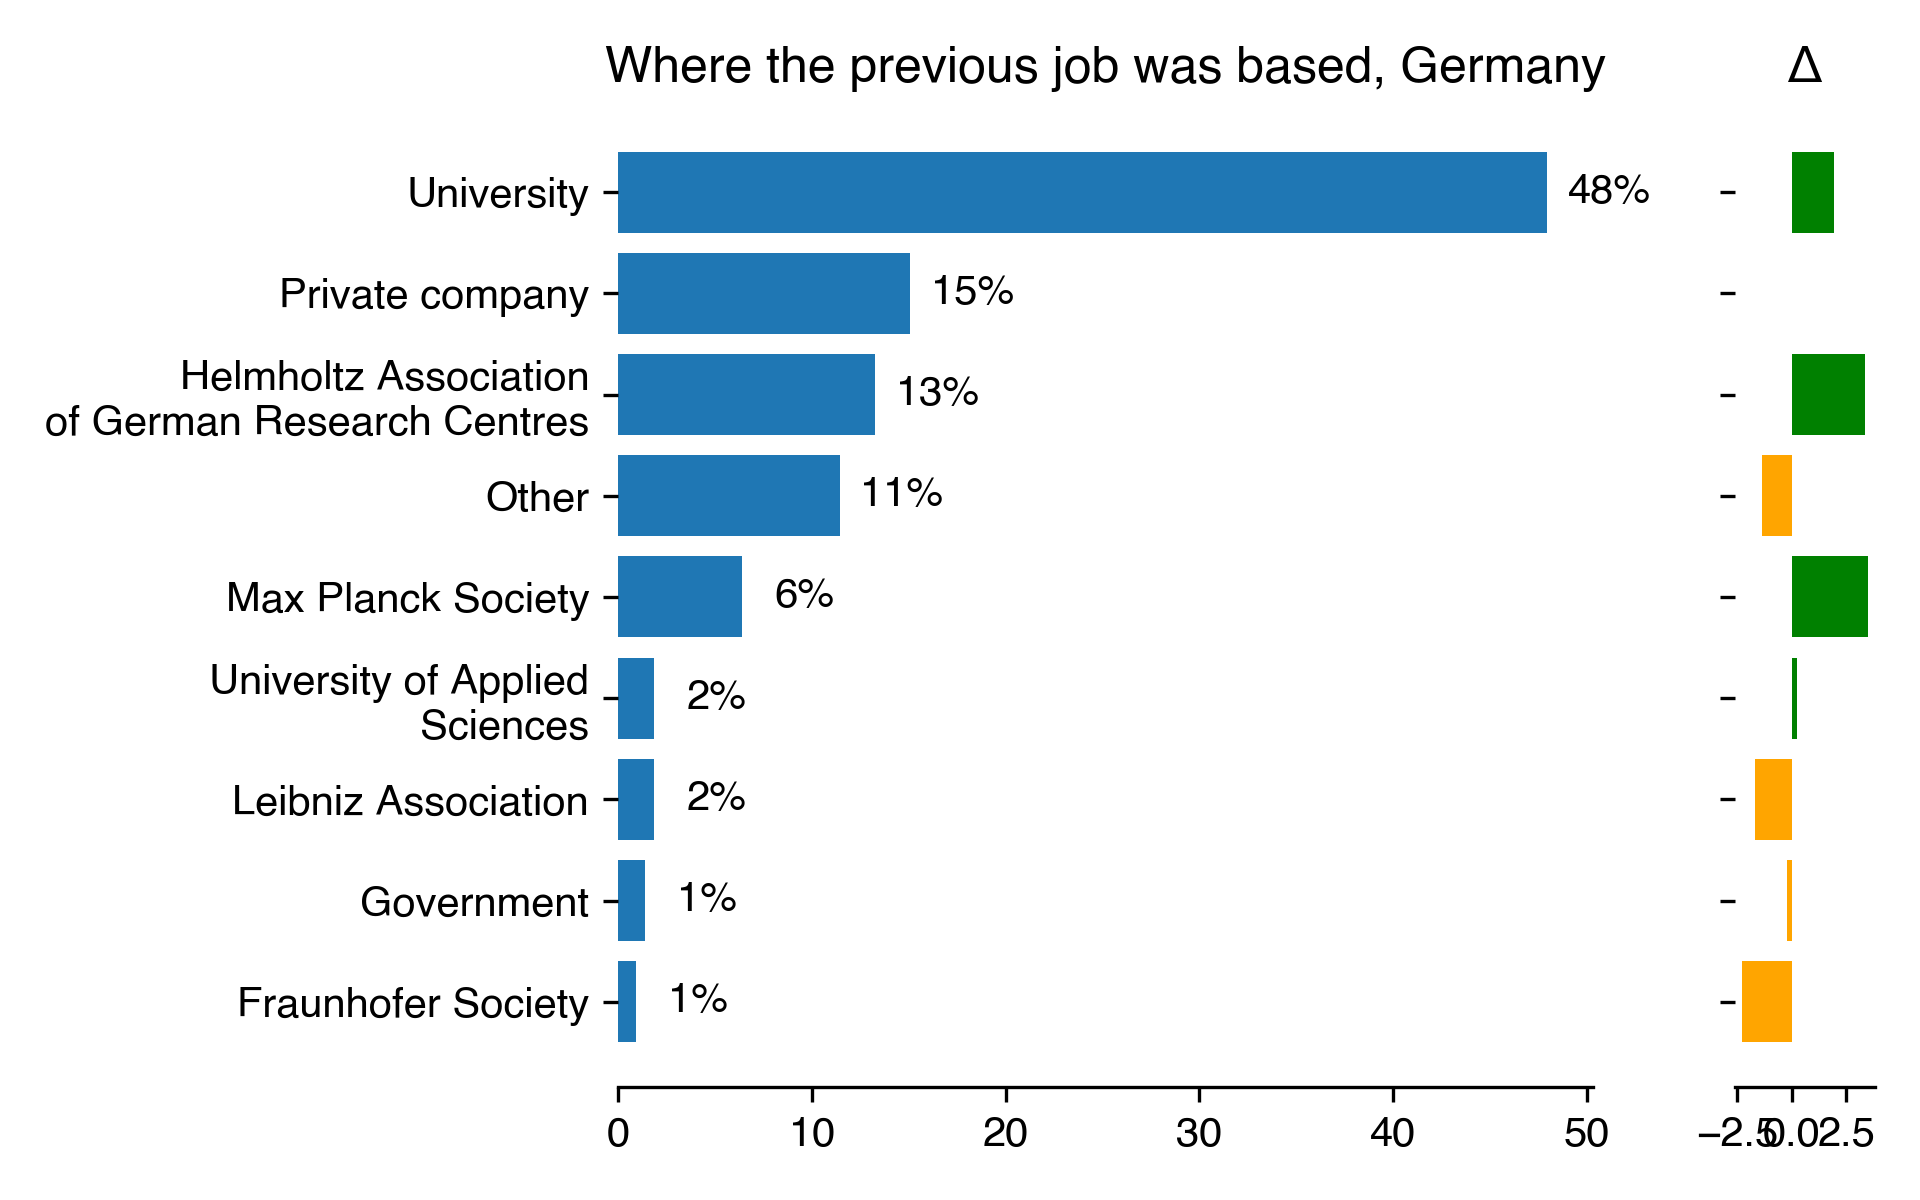
Where the previous job was based for Germany
Count
Percentage
Percentage in 2018
Difference with previous year
University
105
47.95
46.01
1.94
Private company
33
15.07
nan
nan
Helmholtz Association of German Research Centres
29
13.24
9.9
3.34
Other
25
11.42
12.78
-1.36
Max Planck Society
14
6.39
2.88
3.52
University of Applied Sciences
4
1.83
1.6
0.23
Leibniz Association
4
1.83
3.51
-1.69
Government
3
1.37
1.6
-0.23
Fraunhofer Society
2
0.91
3.19
-2.28
Download CSV
2022-08-22T11:23:09.459563
image/svg+xml
Matplotlib v3.5.2, https://matplotlib.org/
PNG SVG
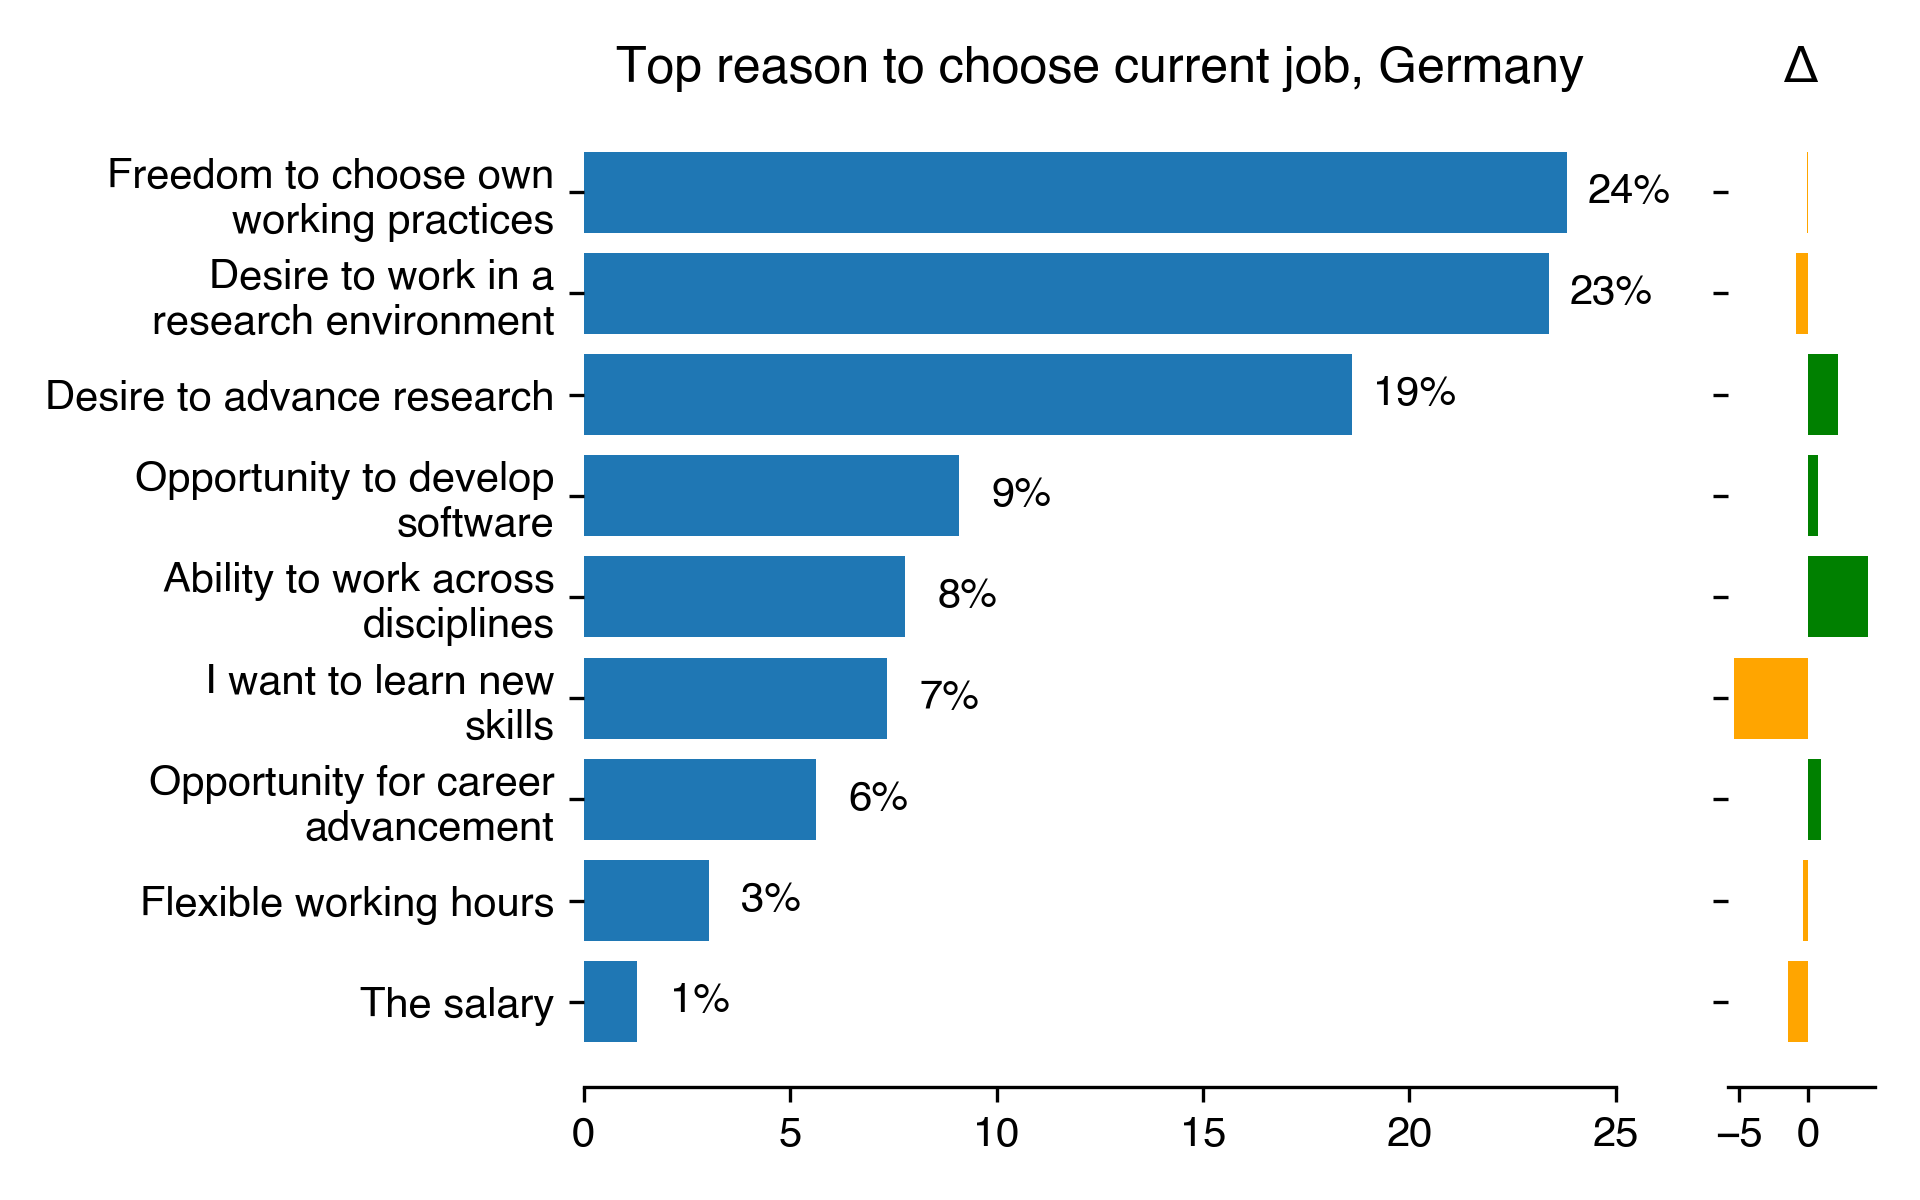
Top reason to choose current job for Germany
Count
Percentage
Percentage in 2018
Difference with previous year
Freedom to choose own working practices
55
23.81
23.91
-0.1
Desire to work in a research environment
54
23.38
24.22
-0.85
Desire to advance research
43
18.61
16.46
2.16
Opportunity to develop software
21
9.09
8.39
0.71
Ability to work across disciplines
18
7.79
3.42
4.38
I want to learn new skills
17
7.36
12.73
-5.37
Opportunity for career advancement
13
5.63
4.66
0.97
Flexible working hours
7
3.03
3.42
-0.39
The salary
3
1.3
2.8
-1.5
Download CSV
2022-08-22T11:23:10.014075
image/svg+xml
Matplotlib v3.5.2, https://matplotlib.org/
PNG SVG
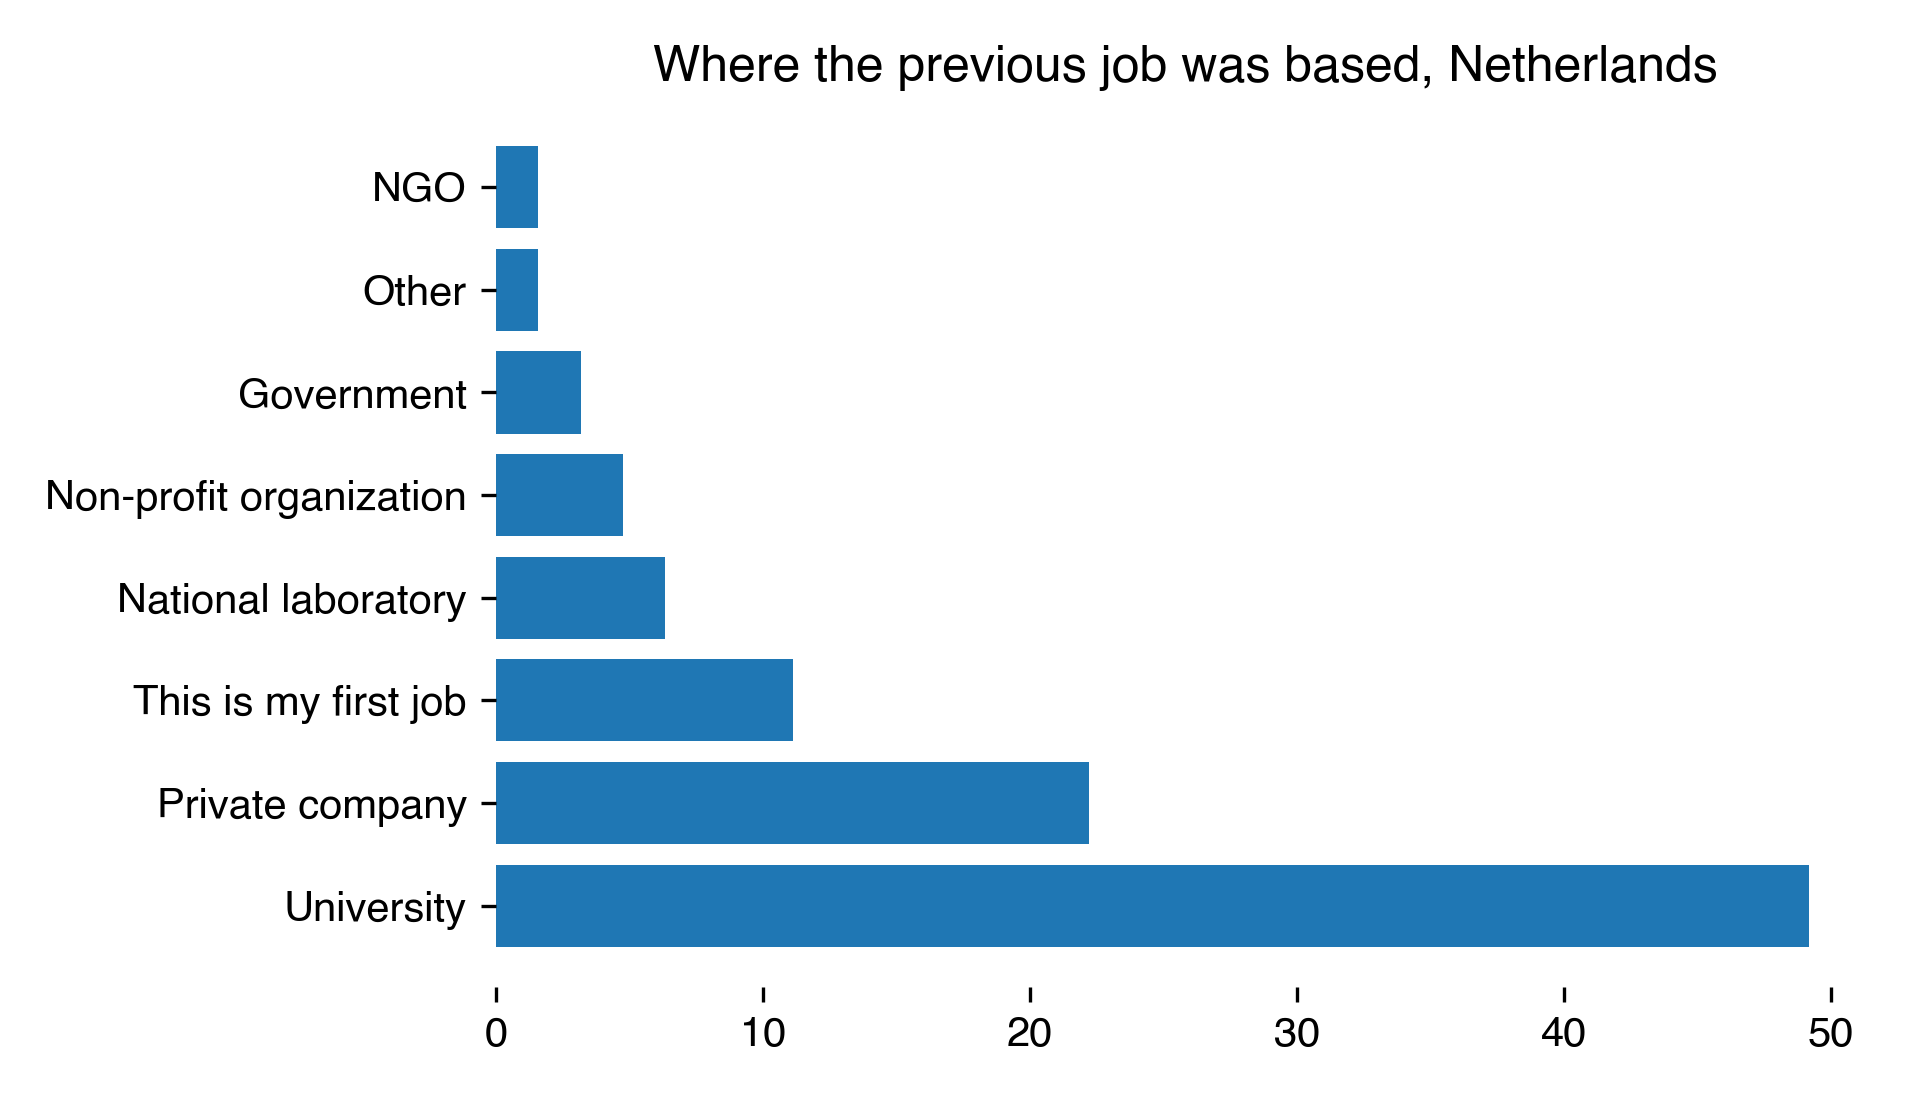
Where the previous job was based for Netherlands
Count
Percentage
University
31
49.21
Private company
14
22.22
This is my first job
7
11.11
National laboratory
4
6.35
Non-profit organization
3
4.76
Government
2
3.17
NGO
1
1.59
Other
1
1.59
Download CSV
2022-08-22T11:23:10.442471
image/svg+xml
Matplotlib v3.5.2, https://matplotlib.org/
PNG SVG
No data found in survey.
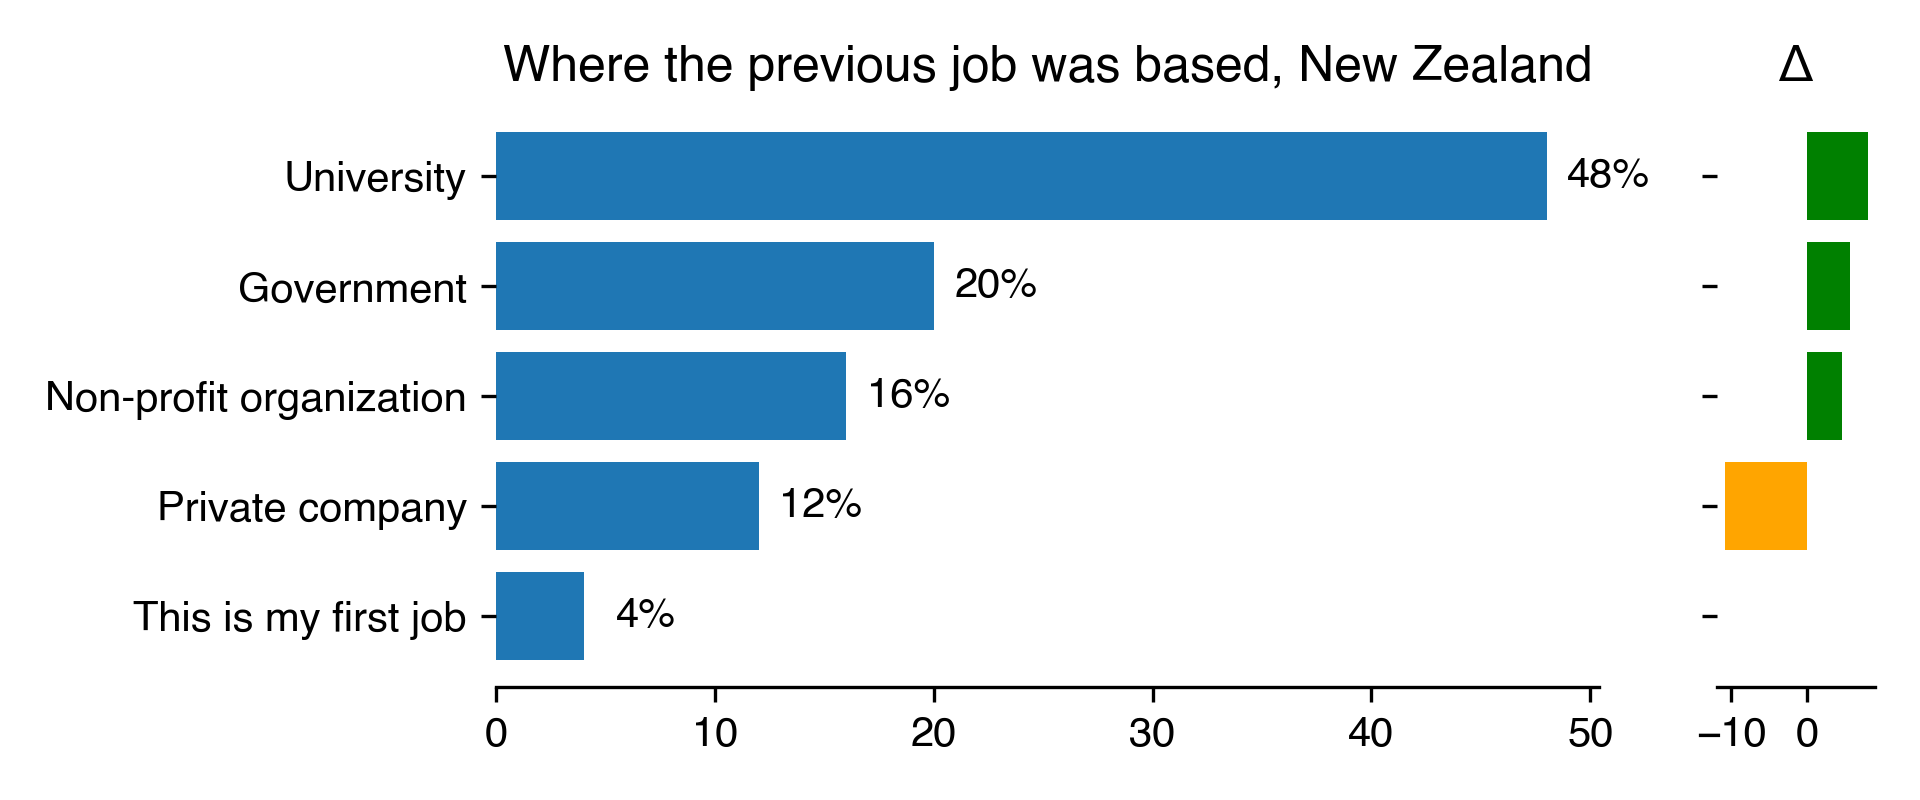
Where the previous job was based for New Zealand
Count
Percentage
Percentage in 2018
Difference with previous year
University
12
48
40
8
Government
5
20
14.29
5.71
Non-profit organization
4
16
11.43
4.57
Private company
3
12
22.86
-10.86
This is my first job
1
4
nan
nan
Download CSV
2022-08-22T11:23:10.901608
image/svg+xml
Matplotlib v3.5.2, https://matplotlib.org/
PNG SVG
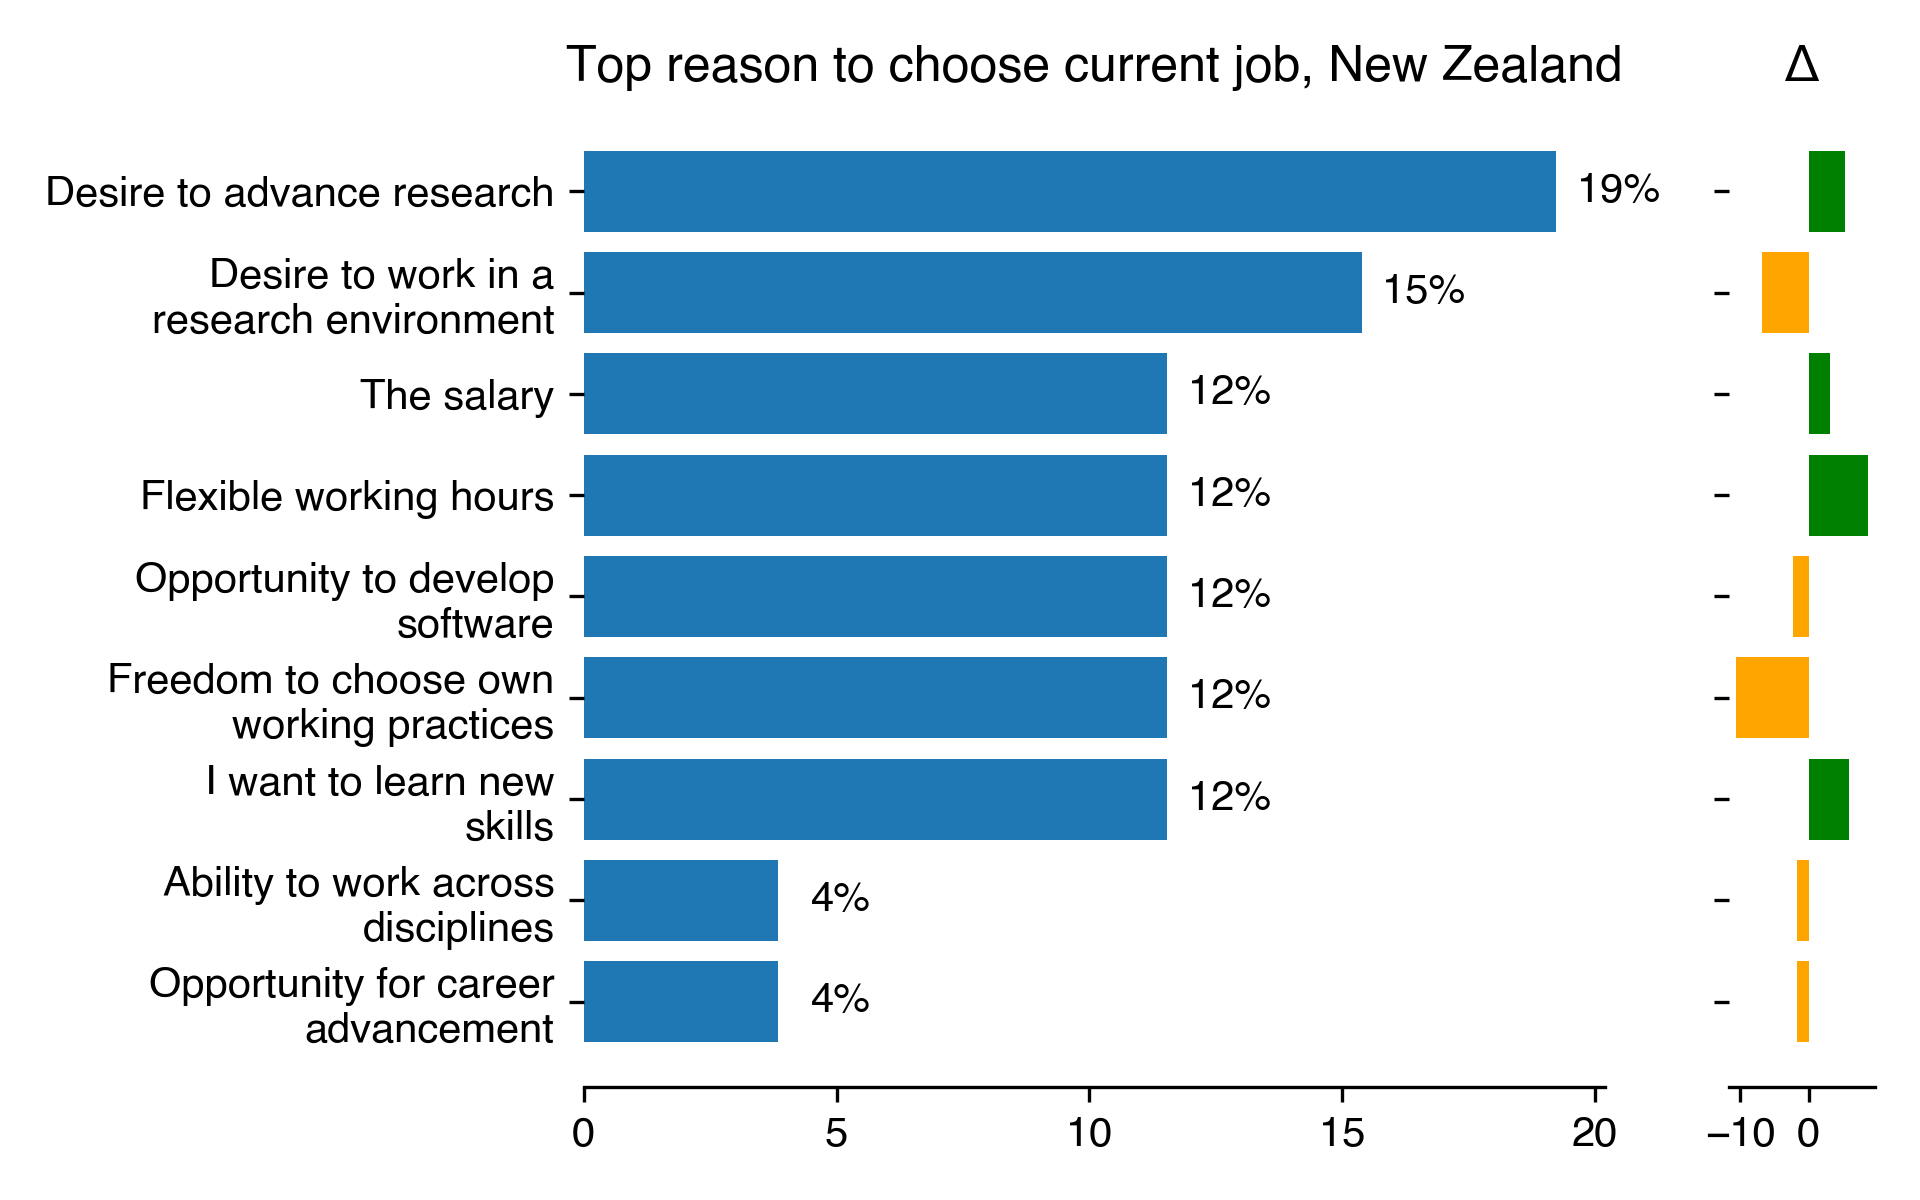
Top reason to choose current job for New Zealand
Count
Percentage
Percentage in 2018
Difference with previous year
Desire to advance research
5
19.23
13.89
5.34
Desire to work in a research environment
4
15.38
22.22
-6.84
The salary
3
11.54
8.33
3.21
Flexible working hours
3
11.54
2.78
8.76
Opportunity to develop software
3
11.54
13.89
-2.35
Freedom to choose own working practices
3
11.54
22.22
-10.68
I want to learn new skills
3
11.54
5.56
5.98
Ability to work across disciplines
1
3.85
5.56
-1.71
Opportunity for career advancement
1
3.85
5.56
-1.71
Download CSV
2022-08-22T11:23:11.409609
image/svg+xml
Matplotlib v3.5.2, https://matplotlib.org/
PNG SVG
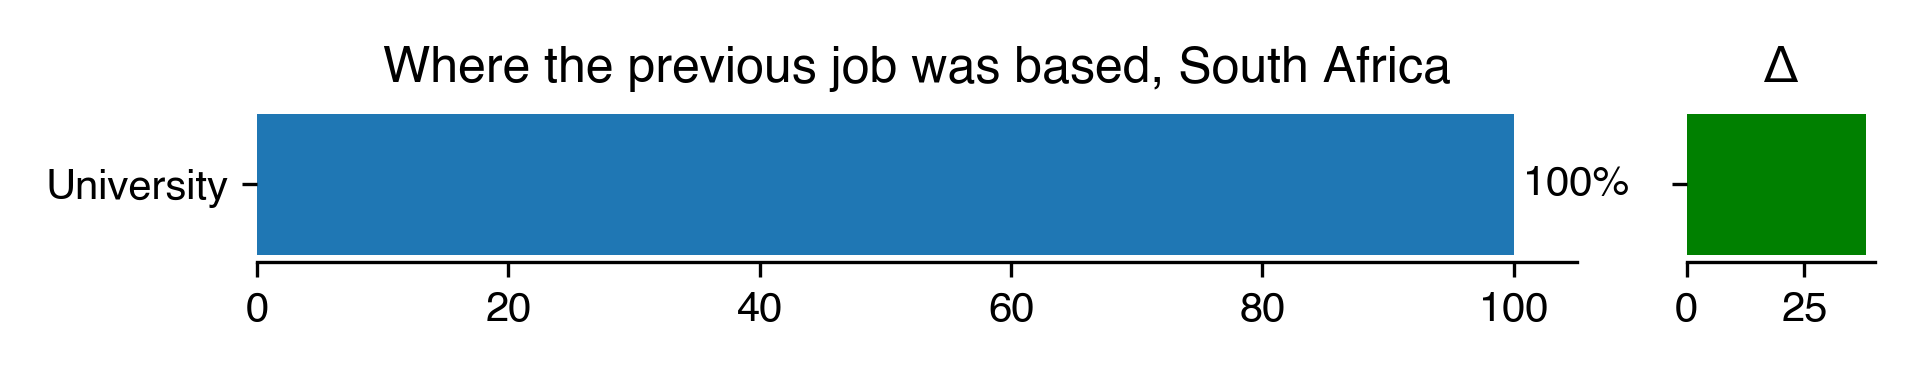
Where the previous job was based for South Africa
Count
Percentage
Percentage in 2018
Difference with previous year
University
2
100
61.9
38.1
Download CSV
2022-08-22T11:23:11.708635
image/svg+xml
Matplotlib v3.5.2, https://matplotlib.org/
PNG SVG
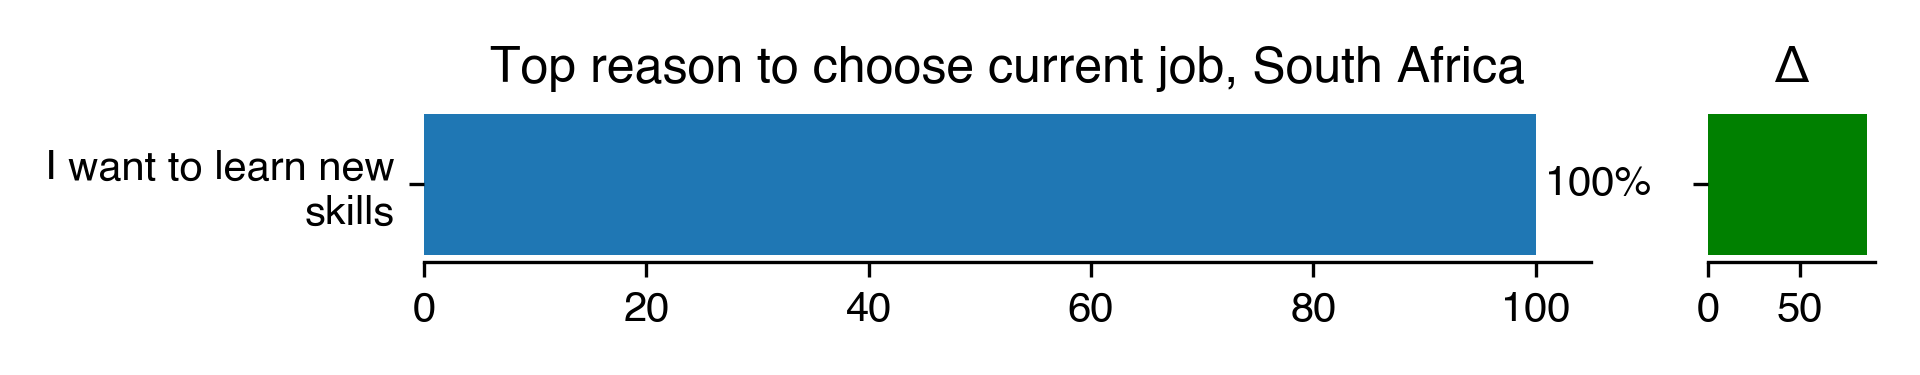
Top reason to choose current job for South Africa
Count
Percentage
Percentage in 2018
Difference with previous year
I want to learn new skills
2
100
13.04
86.96
Download CSV
2022-08-22T11:23:11.949896
image/svg+xml
Matplotlib v3.5.2, https://matplotlib.org/
PNG SVG
Where the previous job was based for United Kingdom
Count
Percentage
Percentage in 2018
Difference with previous year
University
96
60
64.79
-4.79
Private company
29
18.12
20.19
-2.06
This is my first job
12
7.5
nan
nan
National laboratory
8
5
4.23
0.77
Non-profit organization
7
4.38
1.88
2.5
Government
5
3.12
2.82
0.31
Other
3
1.88
6.1
-4.23
Download CSV
2022-08-22T11:23:12.376769
image/svg+xml
Matplotlib v3.5.2, https://matplotlib.org/
PNG SVG
Top reason to choose current job for United Kingdom
Count
Percentage
Percentage in 2018
Difference with previous year
Desire to work in a research environment
40
24.69
25.55
-0.86
Opportunity to develop software
34
20.99
16.3
4.69
Desire to advance research
26
16.05
22.47
-6.42
Freedom to choose own working practices
21
12.96
8.81
4.15
Flexible working hours
12
7.41
5.29
2.12
Opportunity for career advancement
11
6.79
8.81
-2.02
I want to learn new skills
11
6.79
7.49
-0.7
Ability to work across disciplines
5
3.09
2.64
0.44
The salary
2
1.23
2.64
-1.41
Download CSV
2022-08-22T11:23:12.918669
image/svg+xml
Matplotlib v3.5.2, https://matplotlib.org/
PNG SVG
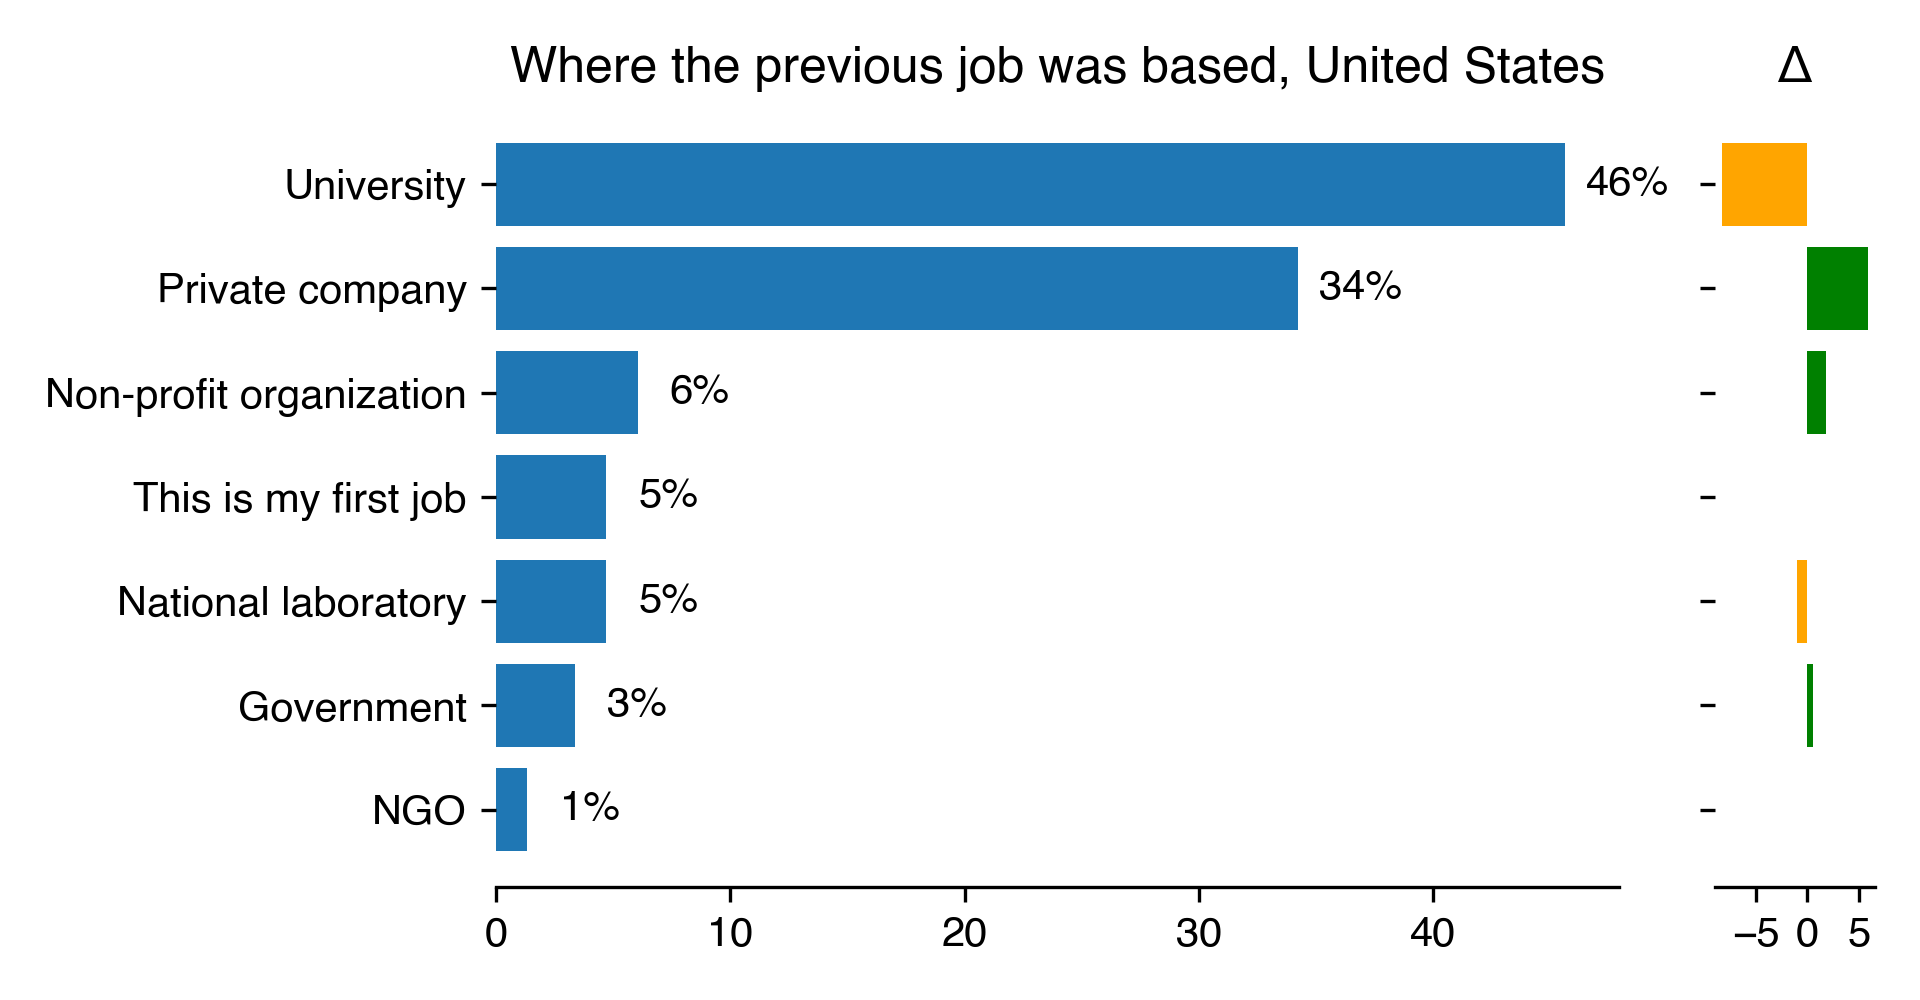
Where the previous job was based for United States
Count
Percentage
Percentage in 2018
Difference with previous year
University
68
45.64
53.9
-8.26
Private company
51
34.23
28.37
5.86
Non-profit organization
9
6.04
4.26
1.78
This is my first job
7
4.7
nan
nan
National laboratory
7
4.7
5.67
-0.98
Government
5
3.36
2.84
0.52
NGO
2
1.34
nan
nan
Download CSV
2022-08-22T11:23:13.406333
image/svg+xml
Matplotlib v3.5.2, https://matplotlib.org/
PNG SVG
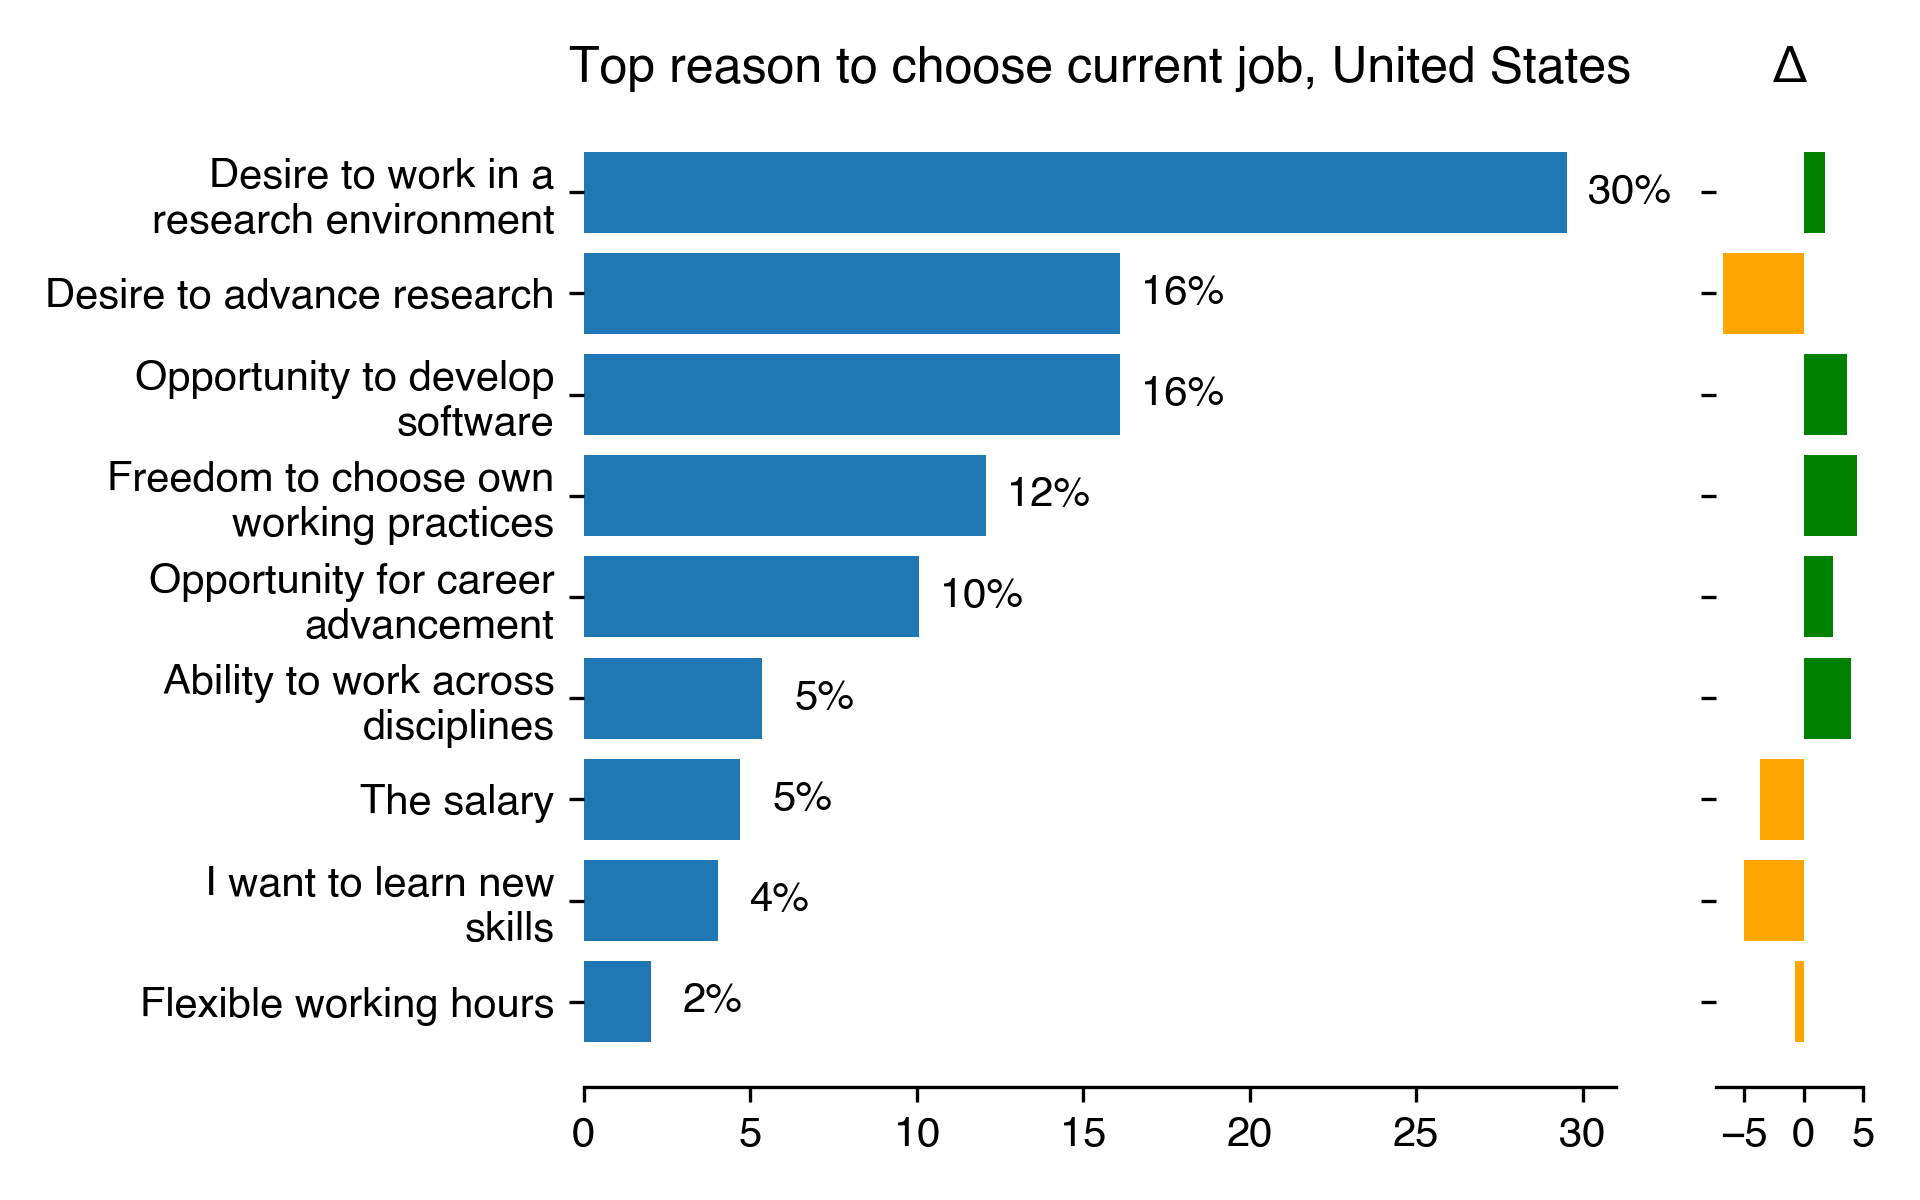
Top reason to choose current job for United States
Count
Percentage
Percentage in 2018
Difference with previous year
Desire to work in a research environment
44
29.53
27.78
1.75
Desire to advance research
24
16.11
22.92
-6.81
Opportunity to develop software
24
16.11
12.5
3.61
Freedom to choose own working practices
18
12.08
7.64
4.44
Opportunity for career advancement
15
10.07
7.64
2.43
Ability to work across disciplines
8
5.37
1.39
3.98
The salary
7
4.7
8.33
-3.64
I want to learn new skills
6
4.03
9.03
-5
Flexible working hours
3
2.01
2.78
-0.76
Download CSV
2022-08-22T11:23:13.931605
image/svg+xml
Matplotlib v3.5.2, https://matplotlib.org/
PNG SVG
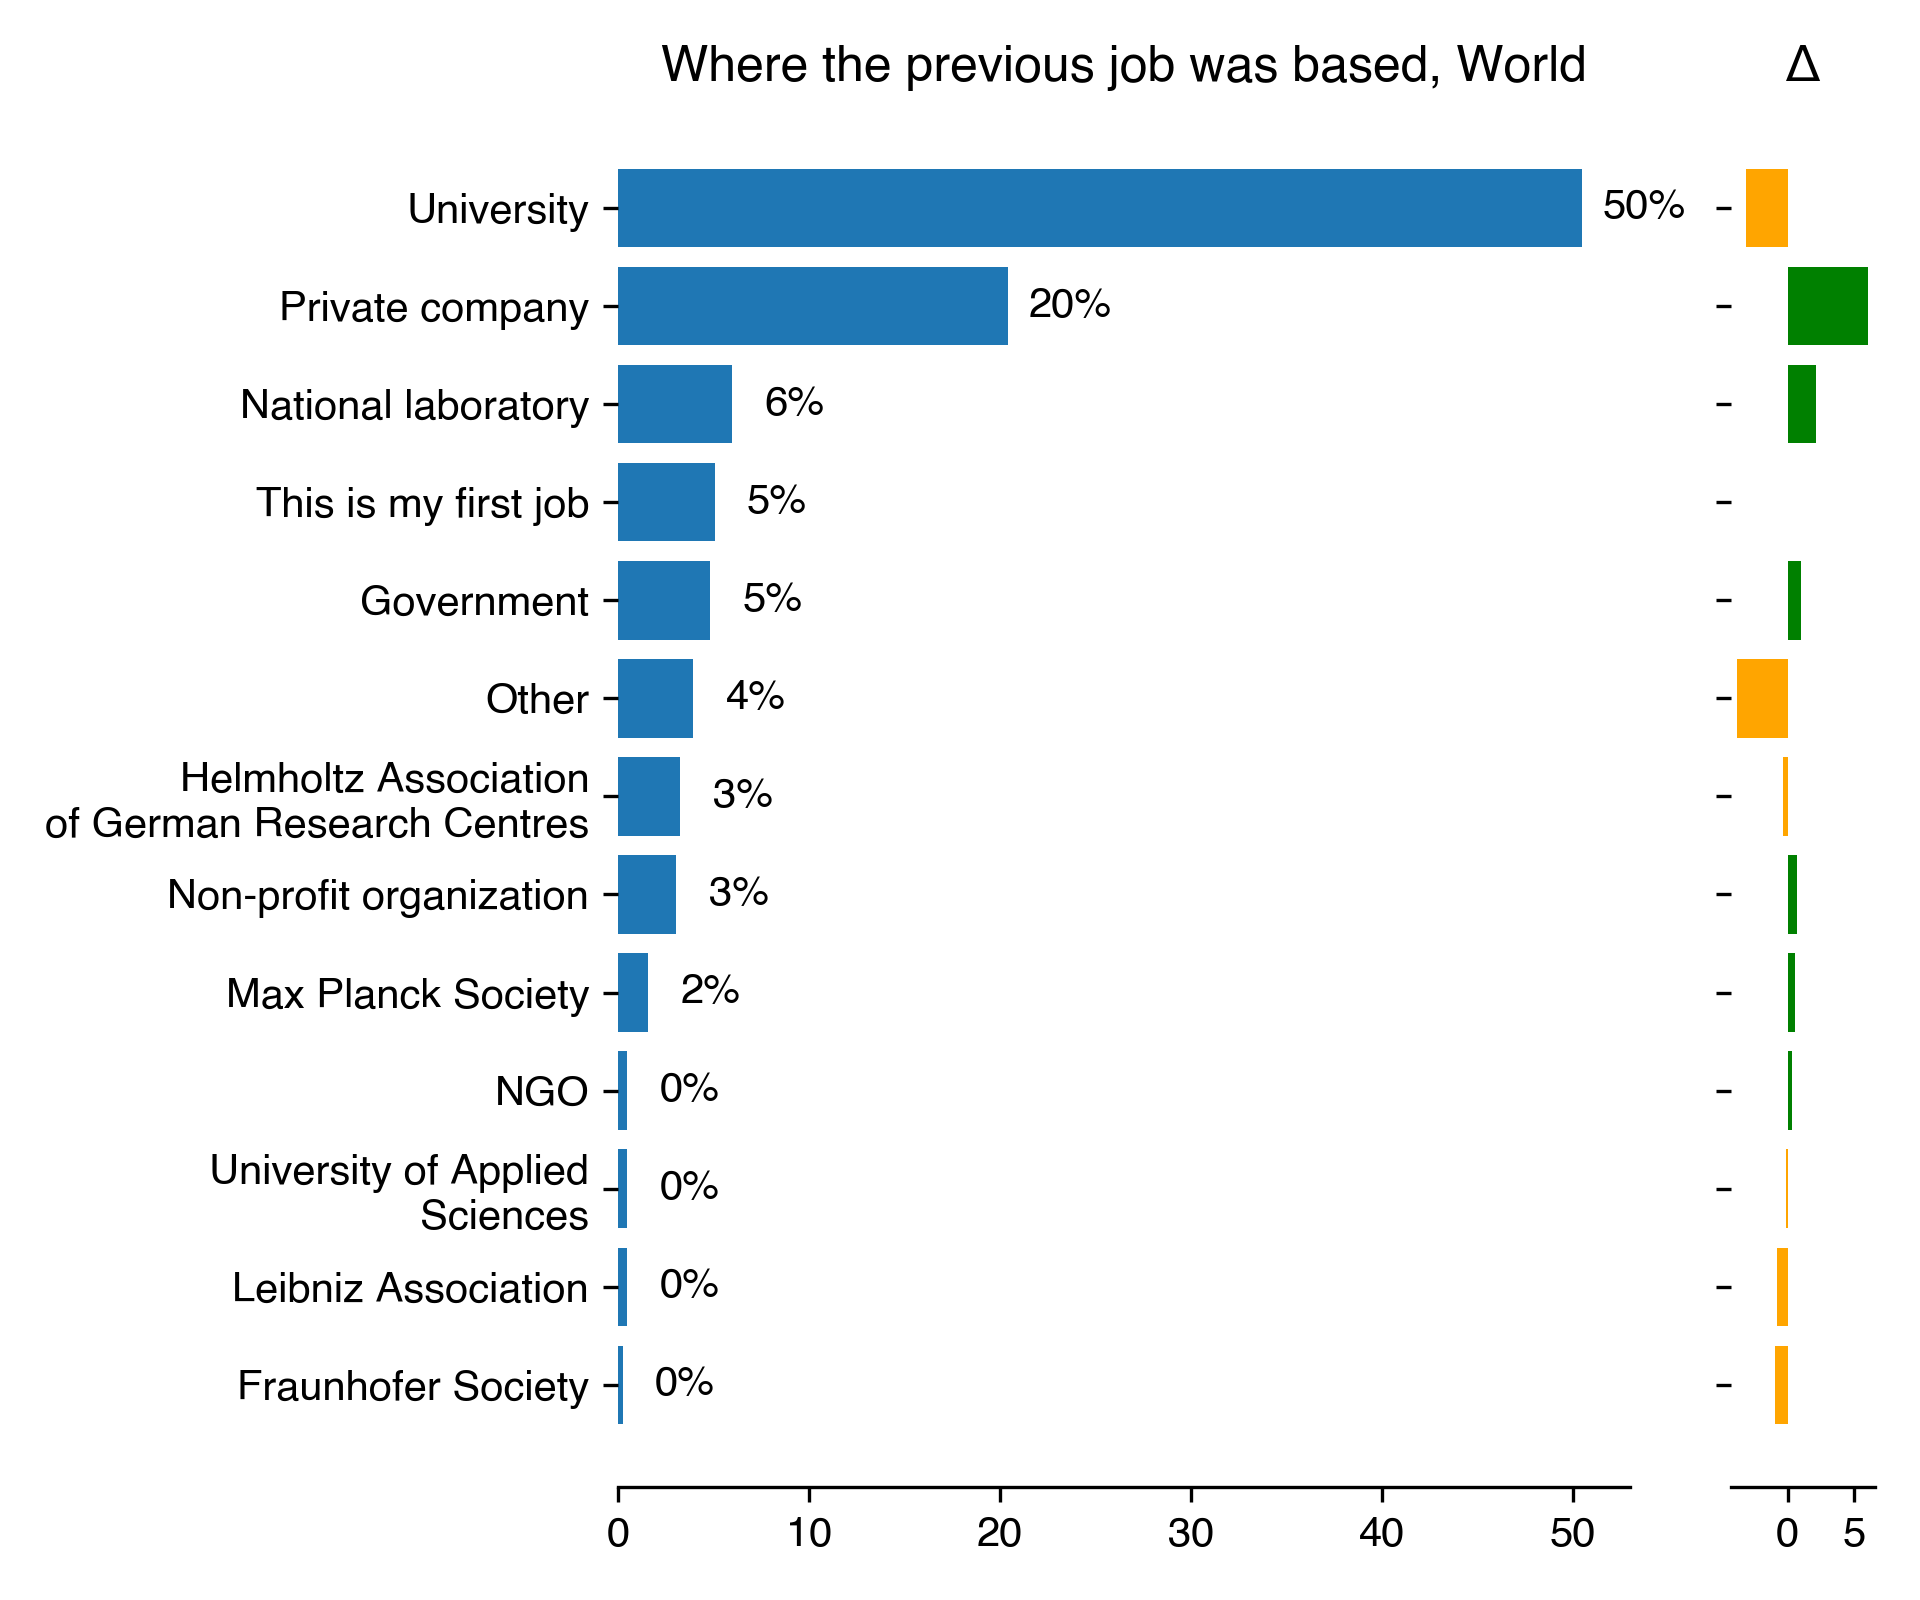
Where the previous job was based for World
Count
Percentage
Percentage in 2018
Difference with previous year
University
450
50.45
53.58
-3.13
Private company
182
20.4
14.32
6.08
National laboratory
53
5.94
3.81
2.13
This is my first job
45
5.04
nan
nan
Government
43
4.82
3.81
1.01
Other
35
3.92
7.74
-3.81
Helmholtz Association of German Research Centres
29
3.25
3.58
-0.33
Non-profit organization
27
3.03
2.31
0.72
Max Planck Society
14
1.57
1.04
0.53
NGO
4
0.45
0.12
0.33
University of Applied Sciences
4
0.45
0.58
-0.13
Leibniz Association
4
0.45
1.27
-0.82
Fraunhofer Society
2
0.22
1.15
-0.93
Download CSV
2022-08-22T11:23:14.585043
image/svg+xml
Matplotlib v3.5.2, https://matplotlib.org/
PNG SVG
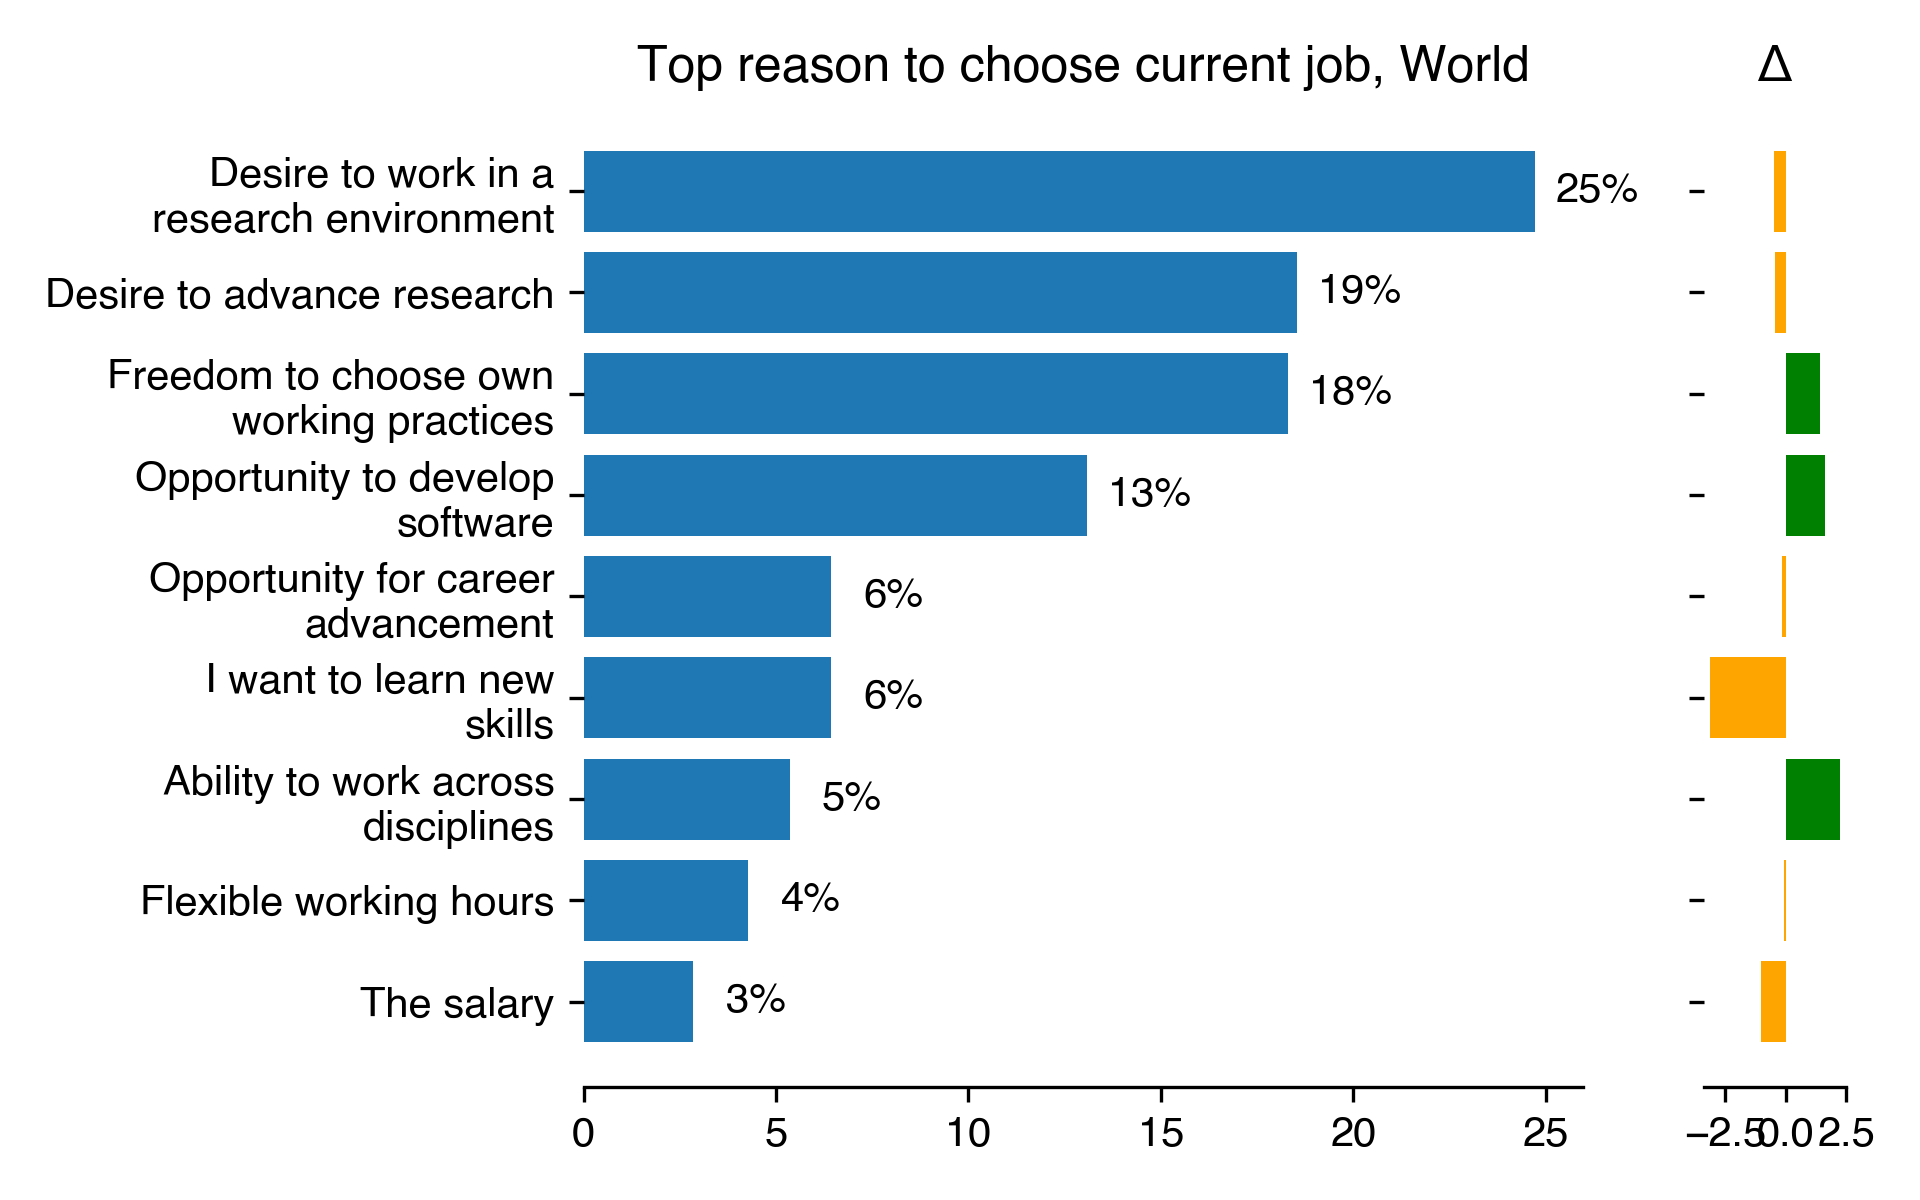
Top reason to choose current job for World
Count
Percentage
Percentage in 2018
Difference with previous year
Desire to work in a research environment
208
24.73
25.22
-0.49
Desire to advance research
156
18.55
19
-0.45
Freedom to choose own working practices
154
18.31
16.89
1.42
Opportunity to develop software
110
13.08
11.44
1.64
Opportunity for career advancement
54
6.42
6.56
-0.13
I want to learn new skills
54
6.42
9.56
-3.13
Ability to work across disciplines
45
5.35
3.11
2.24
Flexible working hours
36
4.28
4.33
-0.05
The salary
24
2.85
3.89
-1.04
Download CSV
2022-08-22T11:23:15.170778
image/svg+xml
Matplotlib v3.5.2, https://matplotlib.org/
PNG SVG