Australia Canada Germany Netherlands New Zealand South Africa United Kingdom United States World
RSEs is an hybrid role between a researcher and a software developer. We
investigated both of these aspects concerning publication and dissemination of
their work, one on the traditional aspect of it (publications and conference).
One essential aspect of career in academia is the publications and the
conferences to gain recognition. However, the role of RSE being less about
writing articles than creating the infrastructure and the software for the
article to exist, there is some fear that they will fail to have recognition
through the papers and conferences.
Questions in the section:
In general, when your software contributes to a paper, are you acknowledged
in that paper? (one choice)
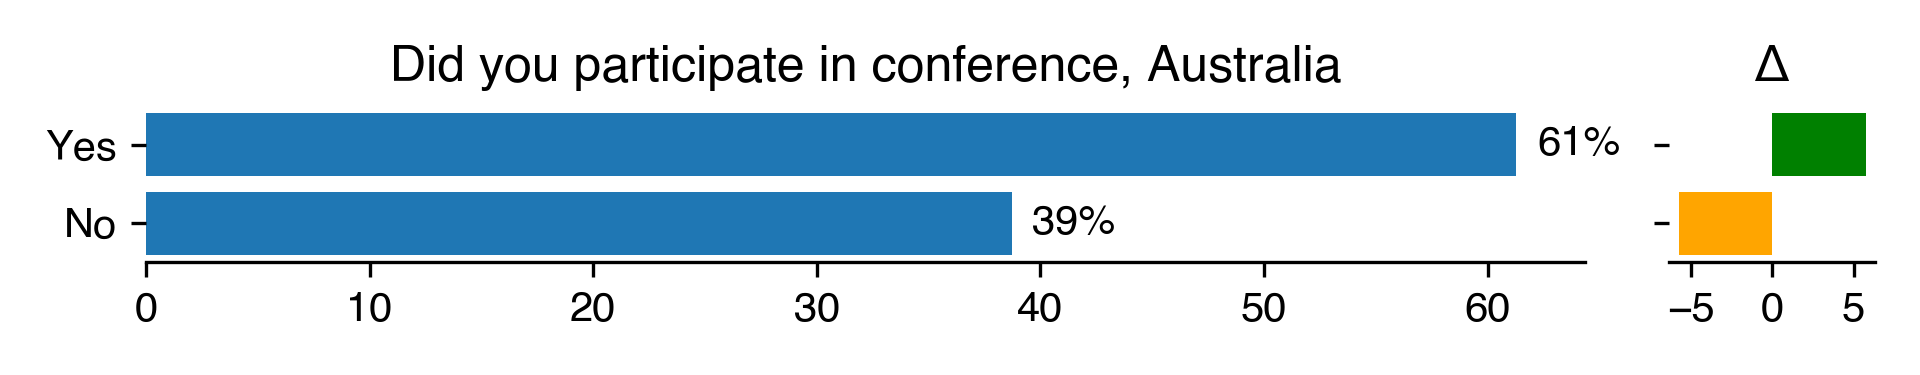
Have you presented your software work at a conference or workshop? (yes-no)
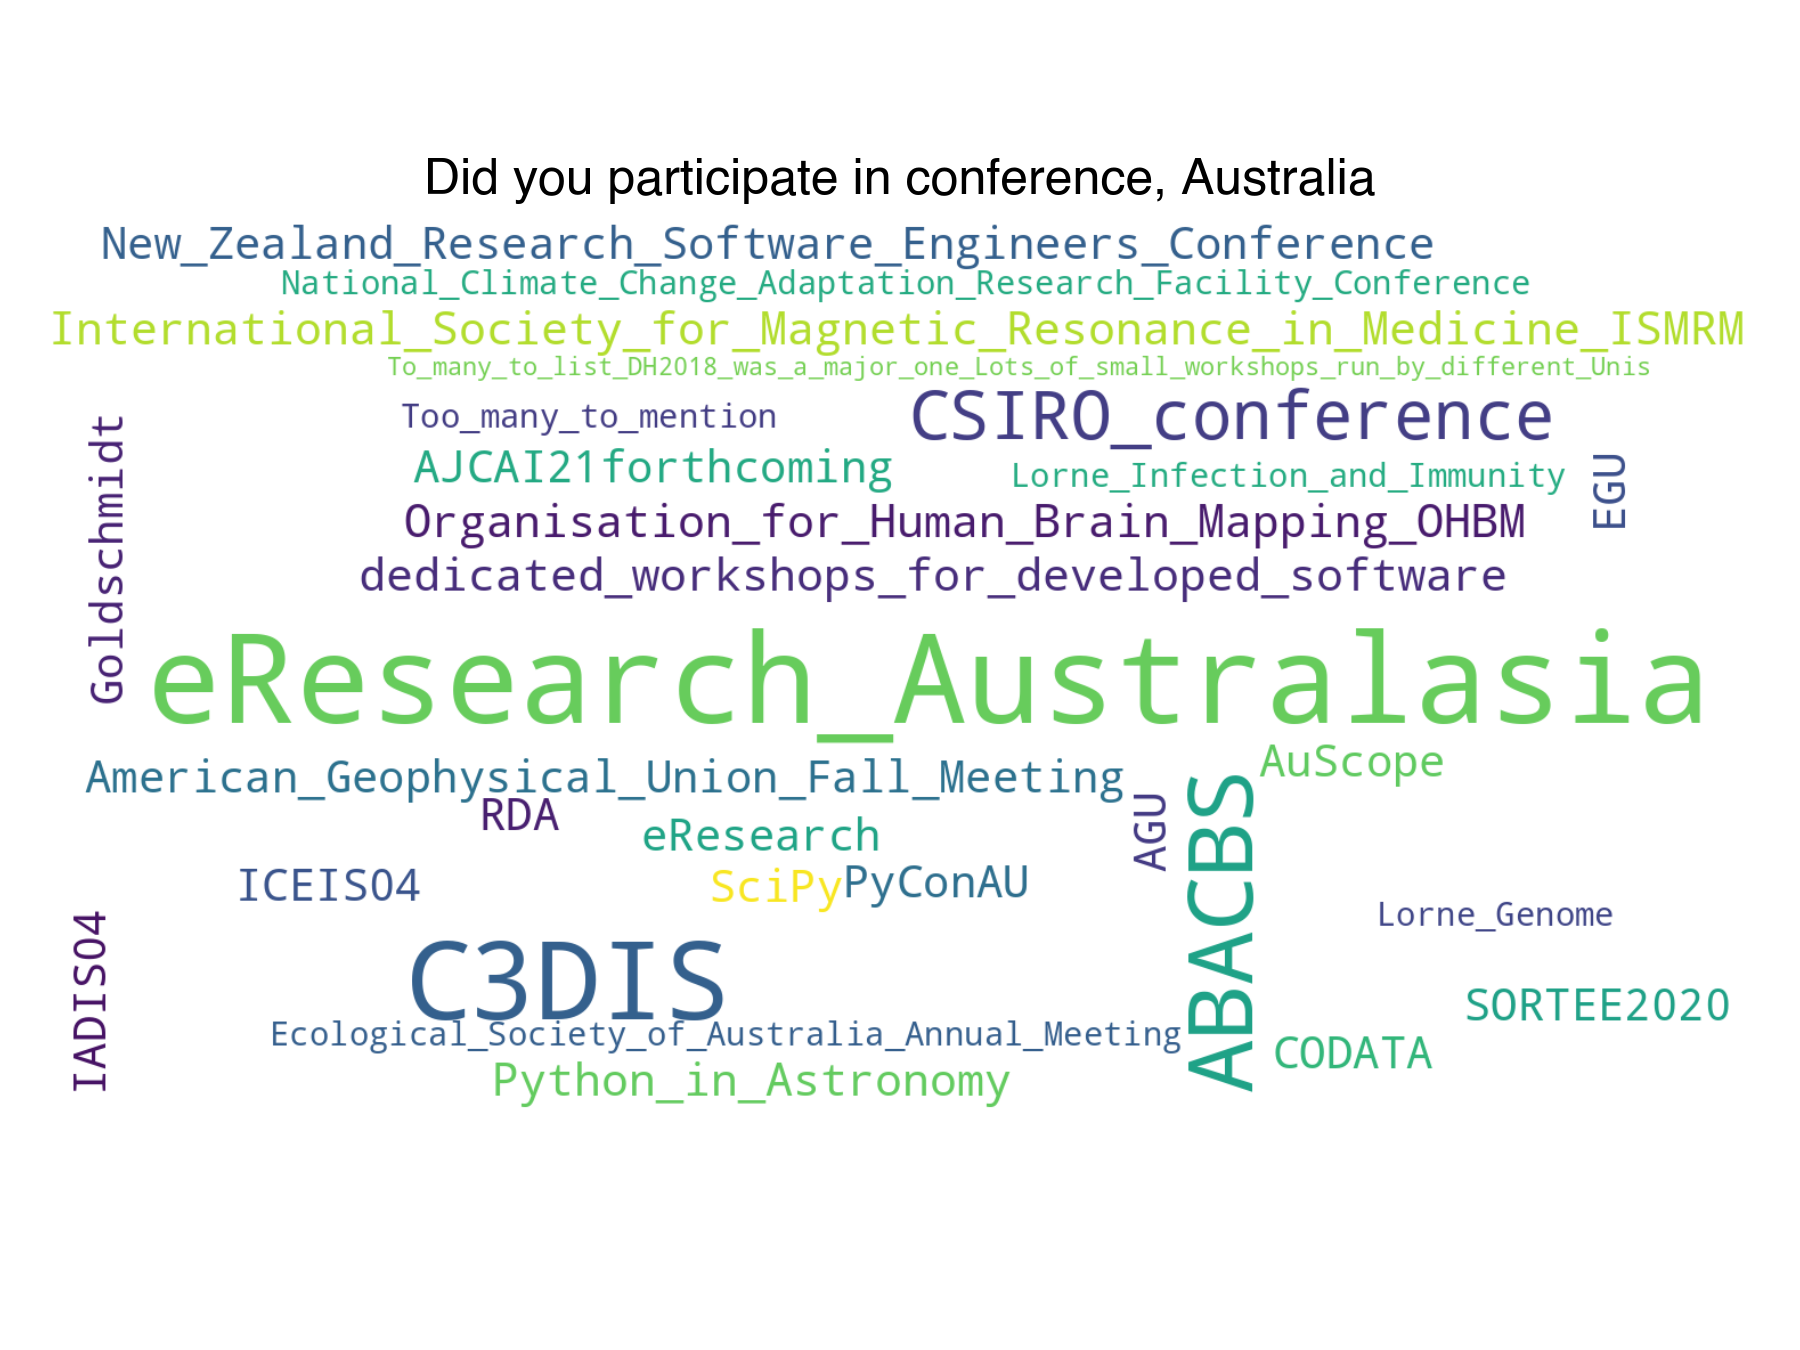
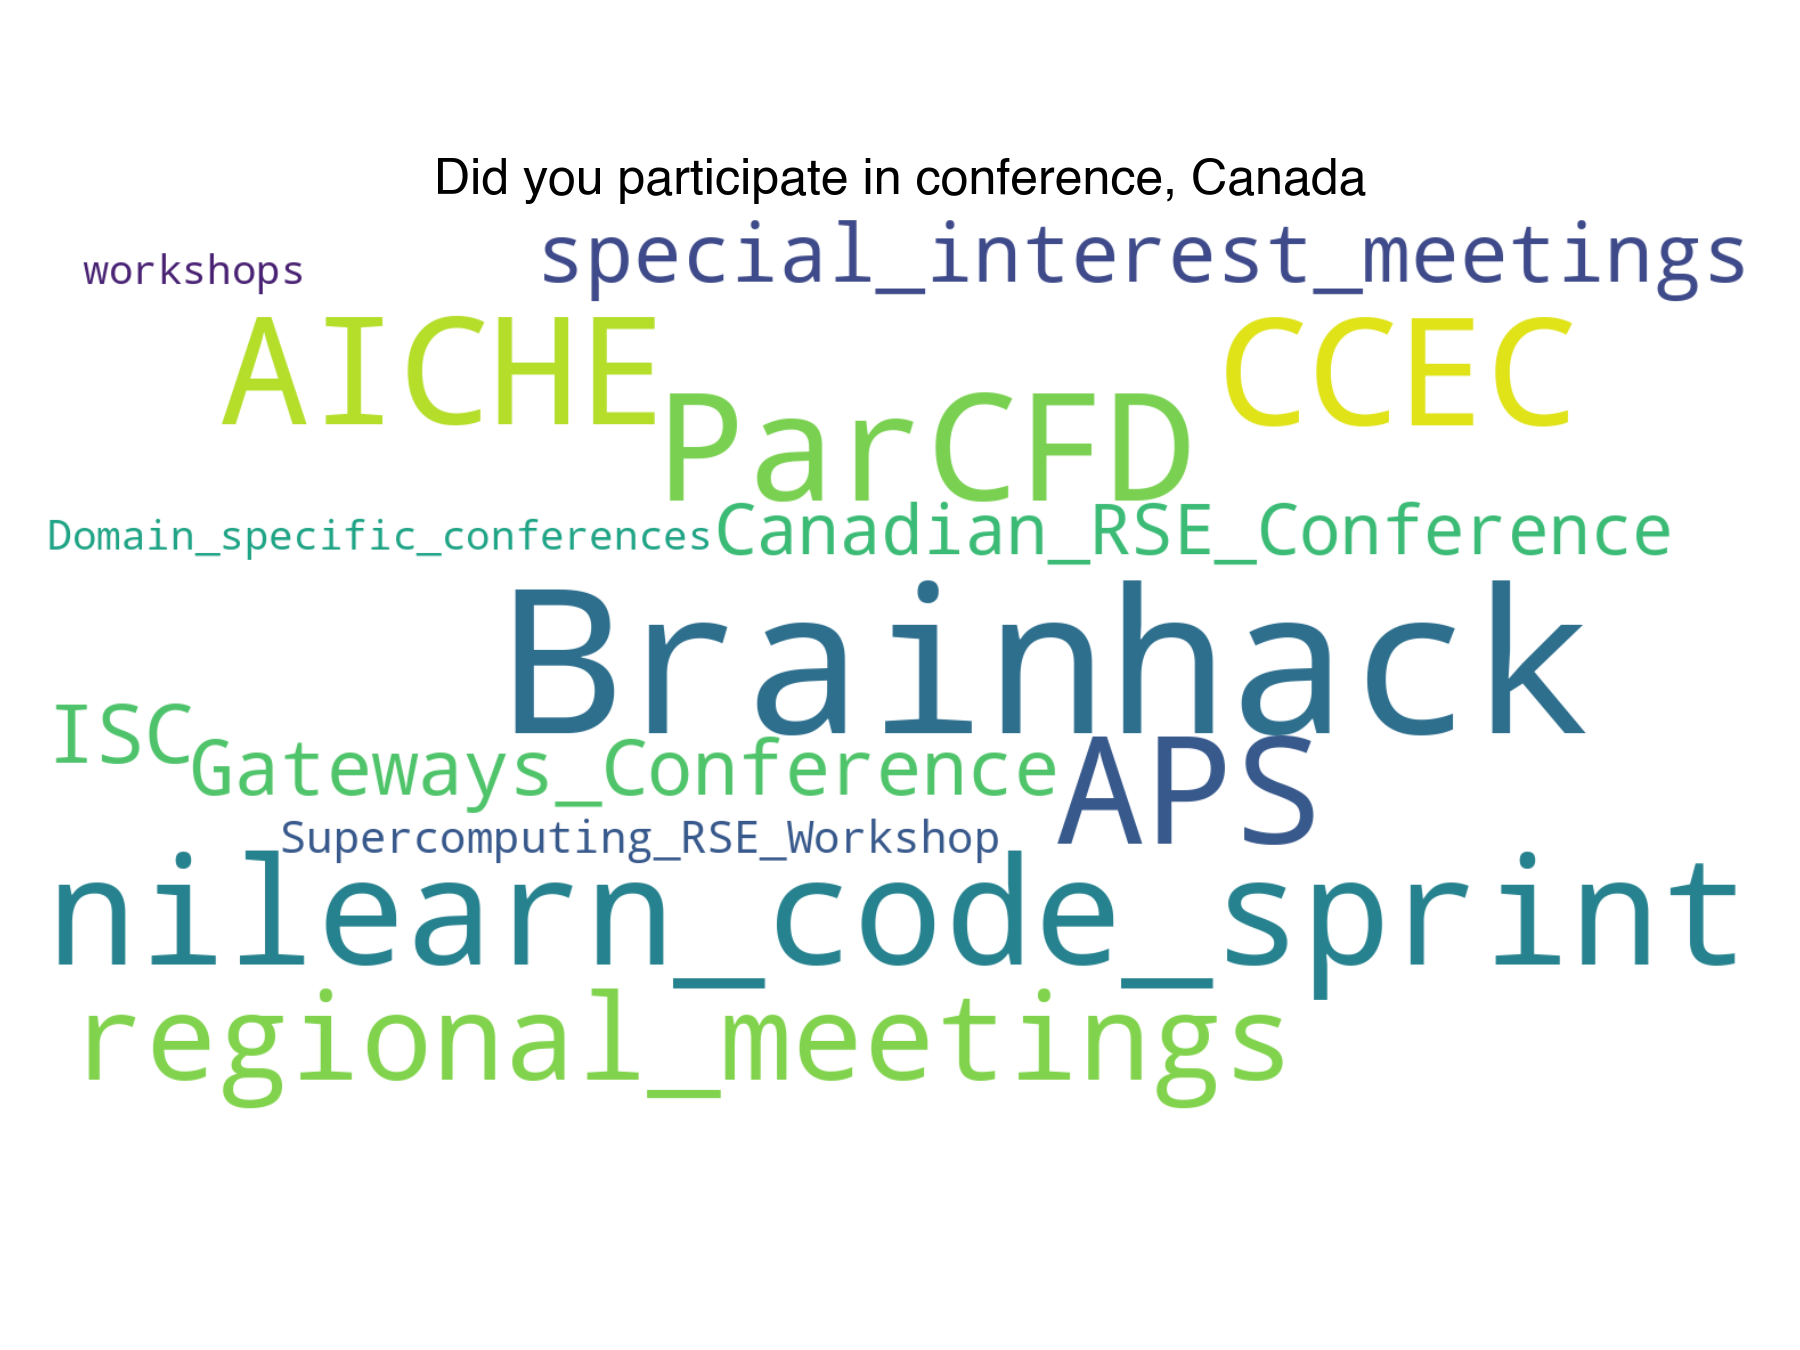
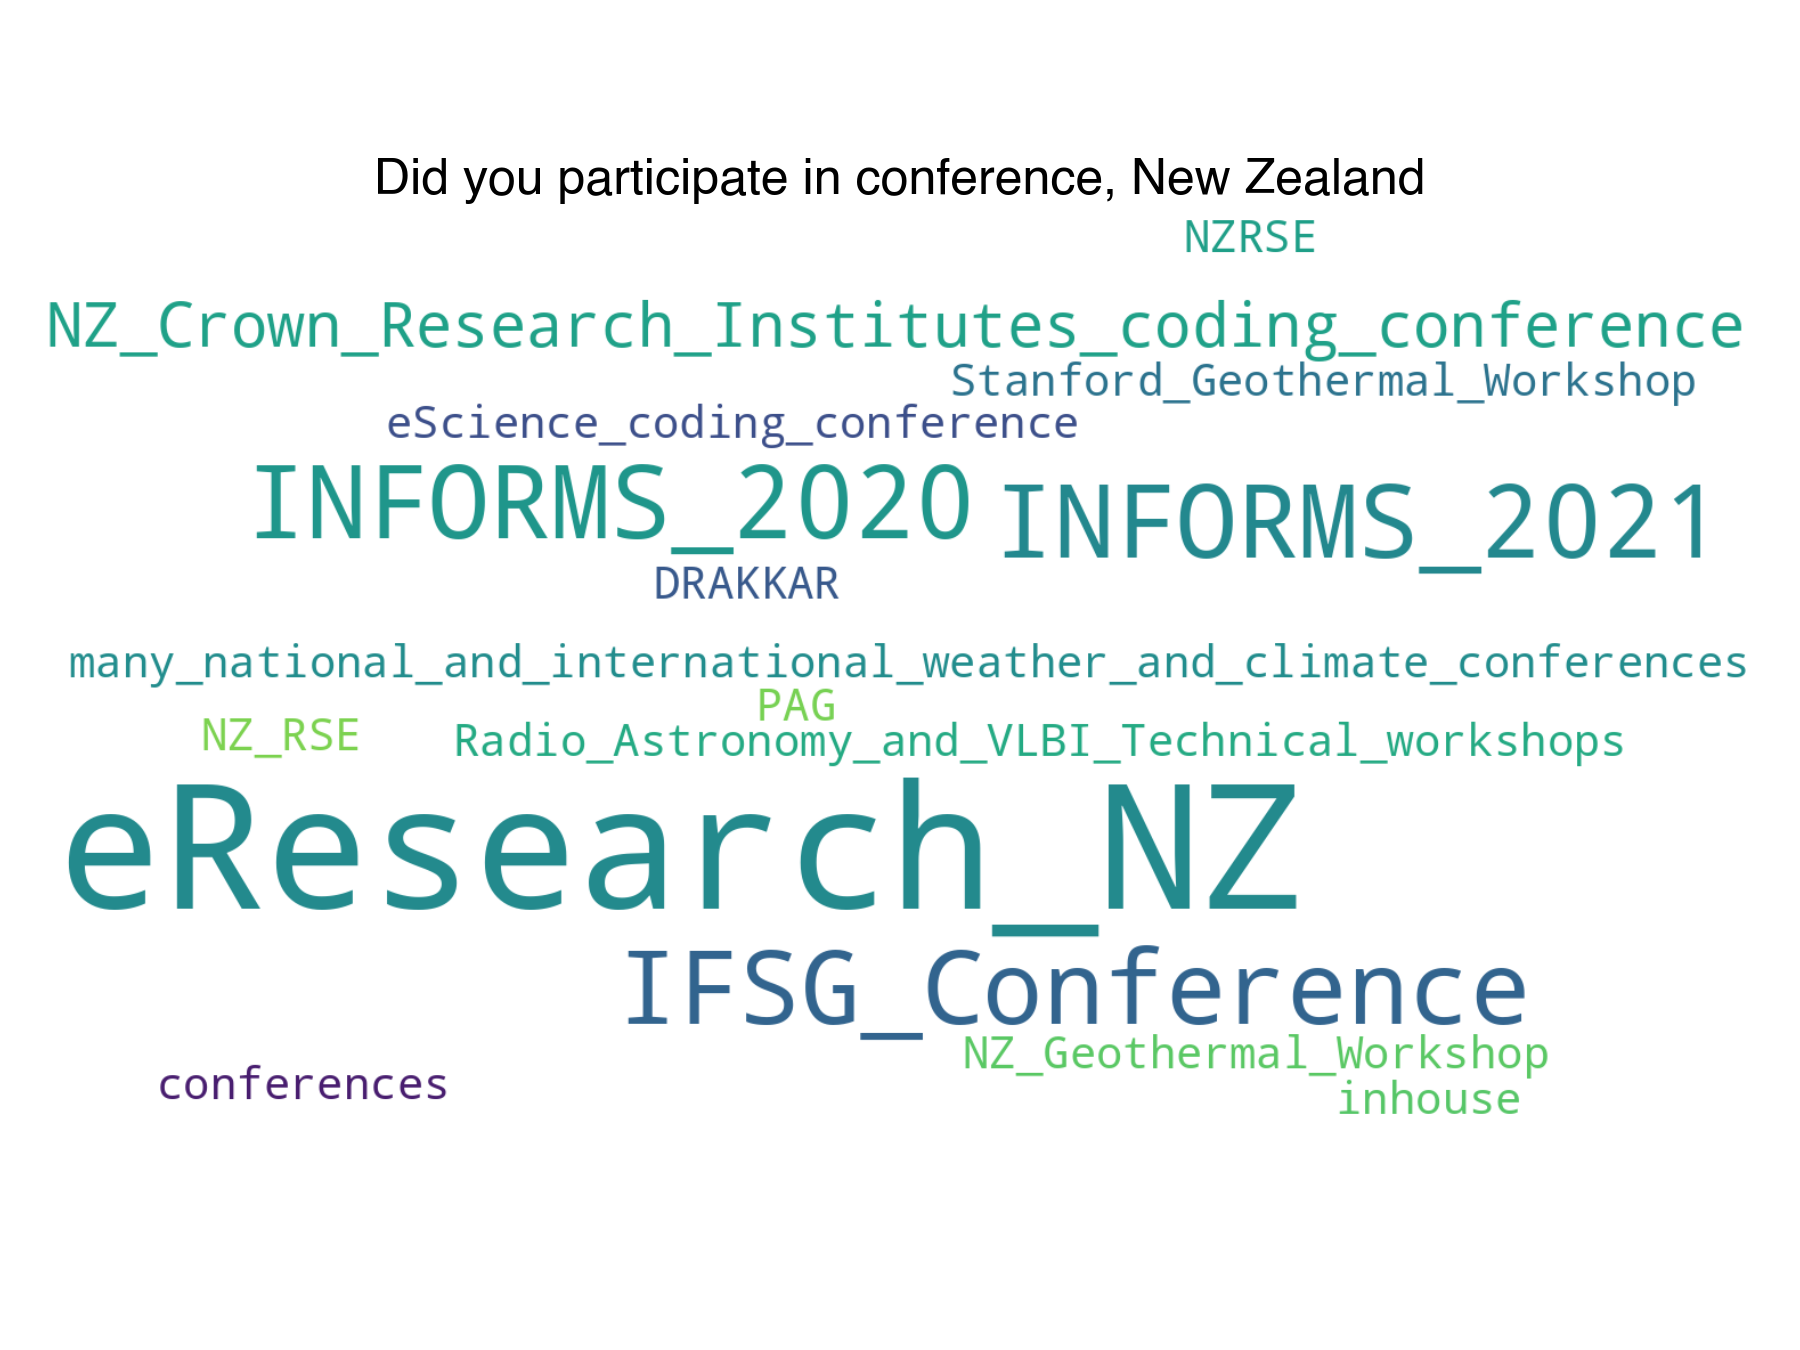
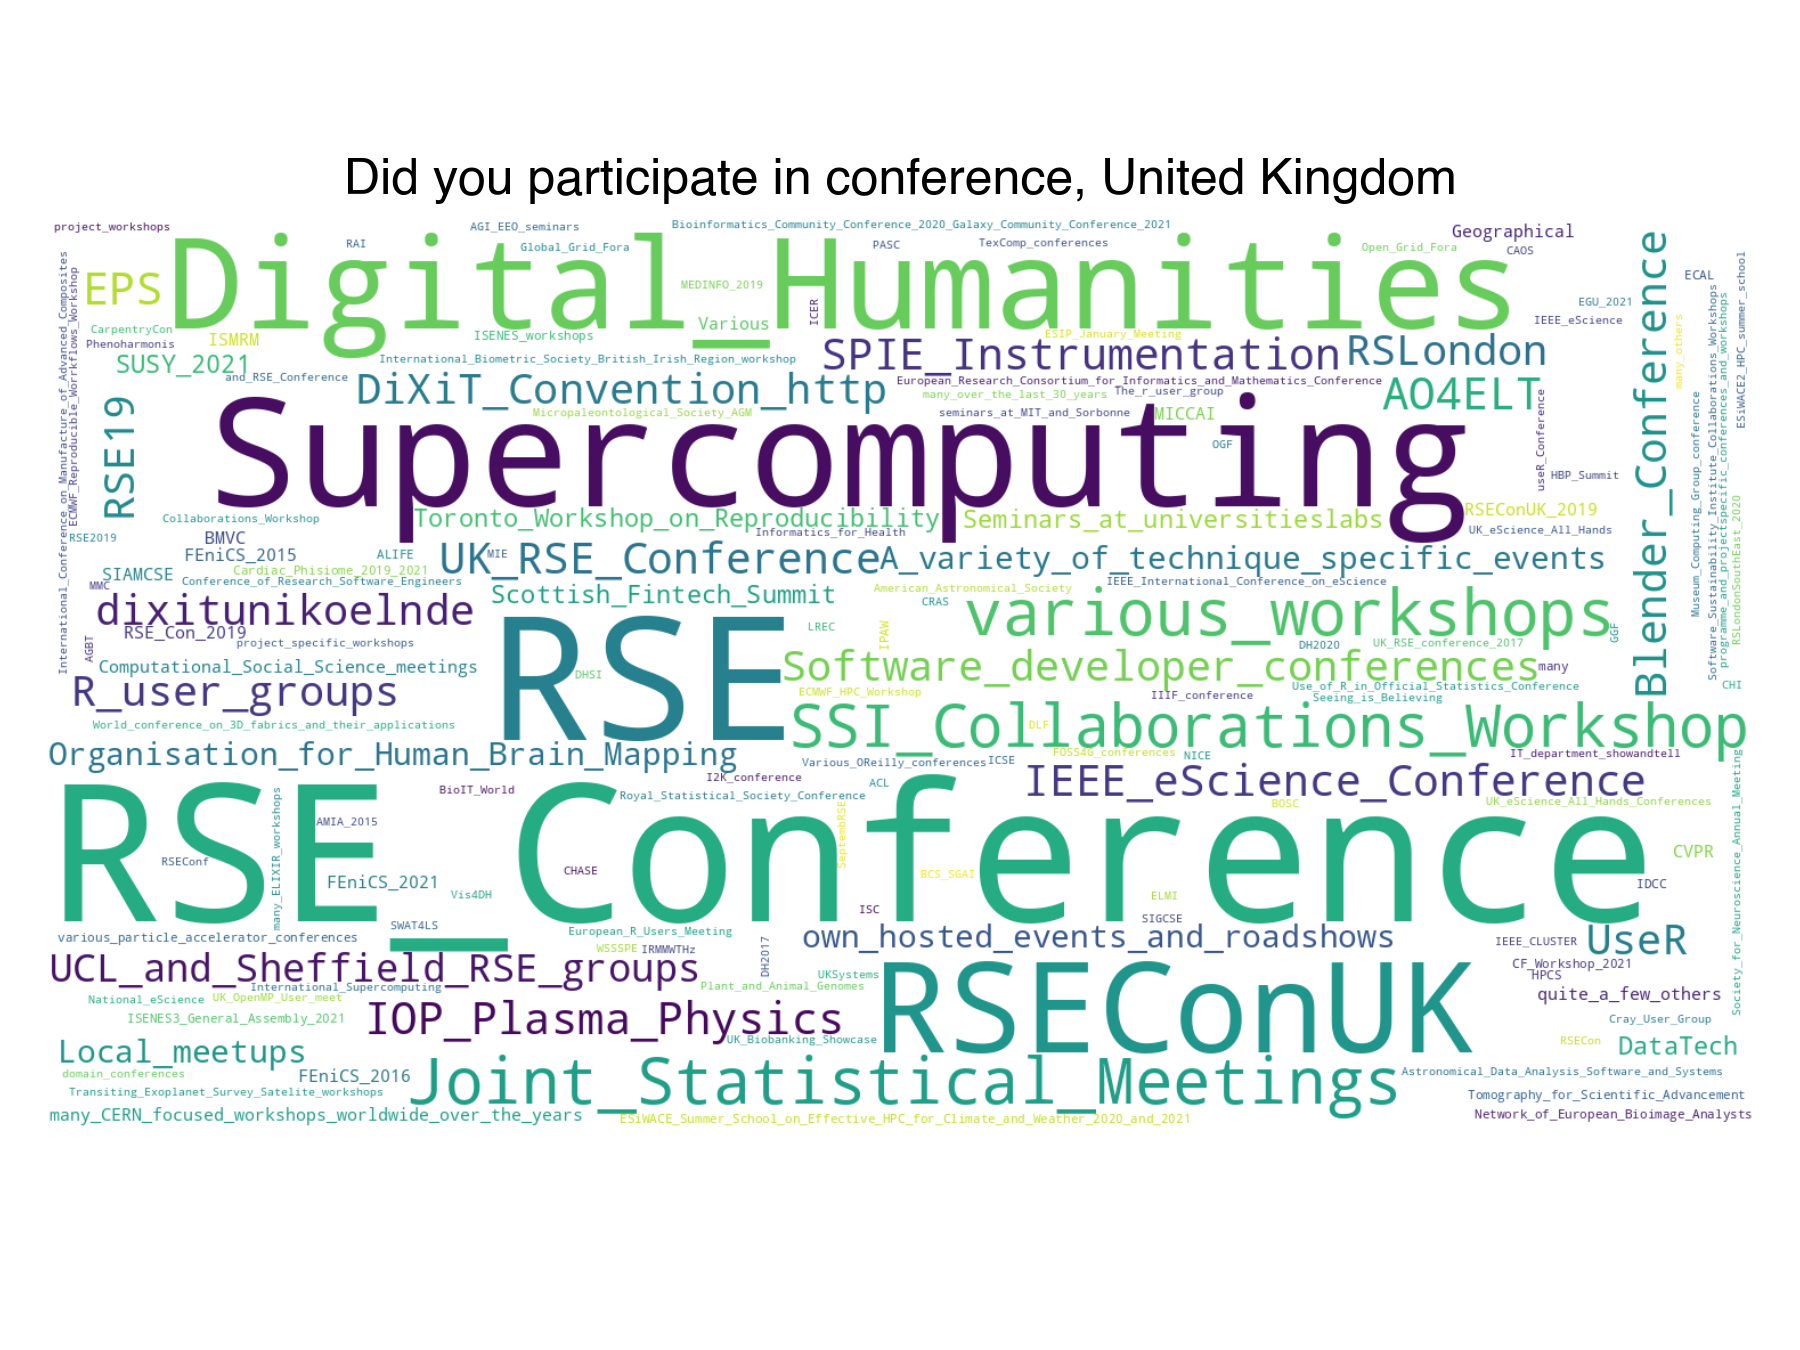
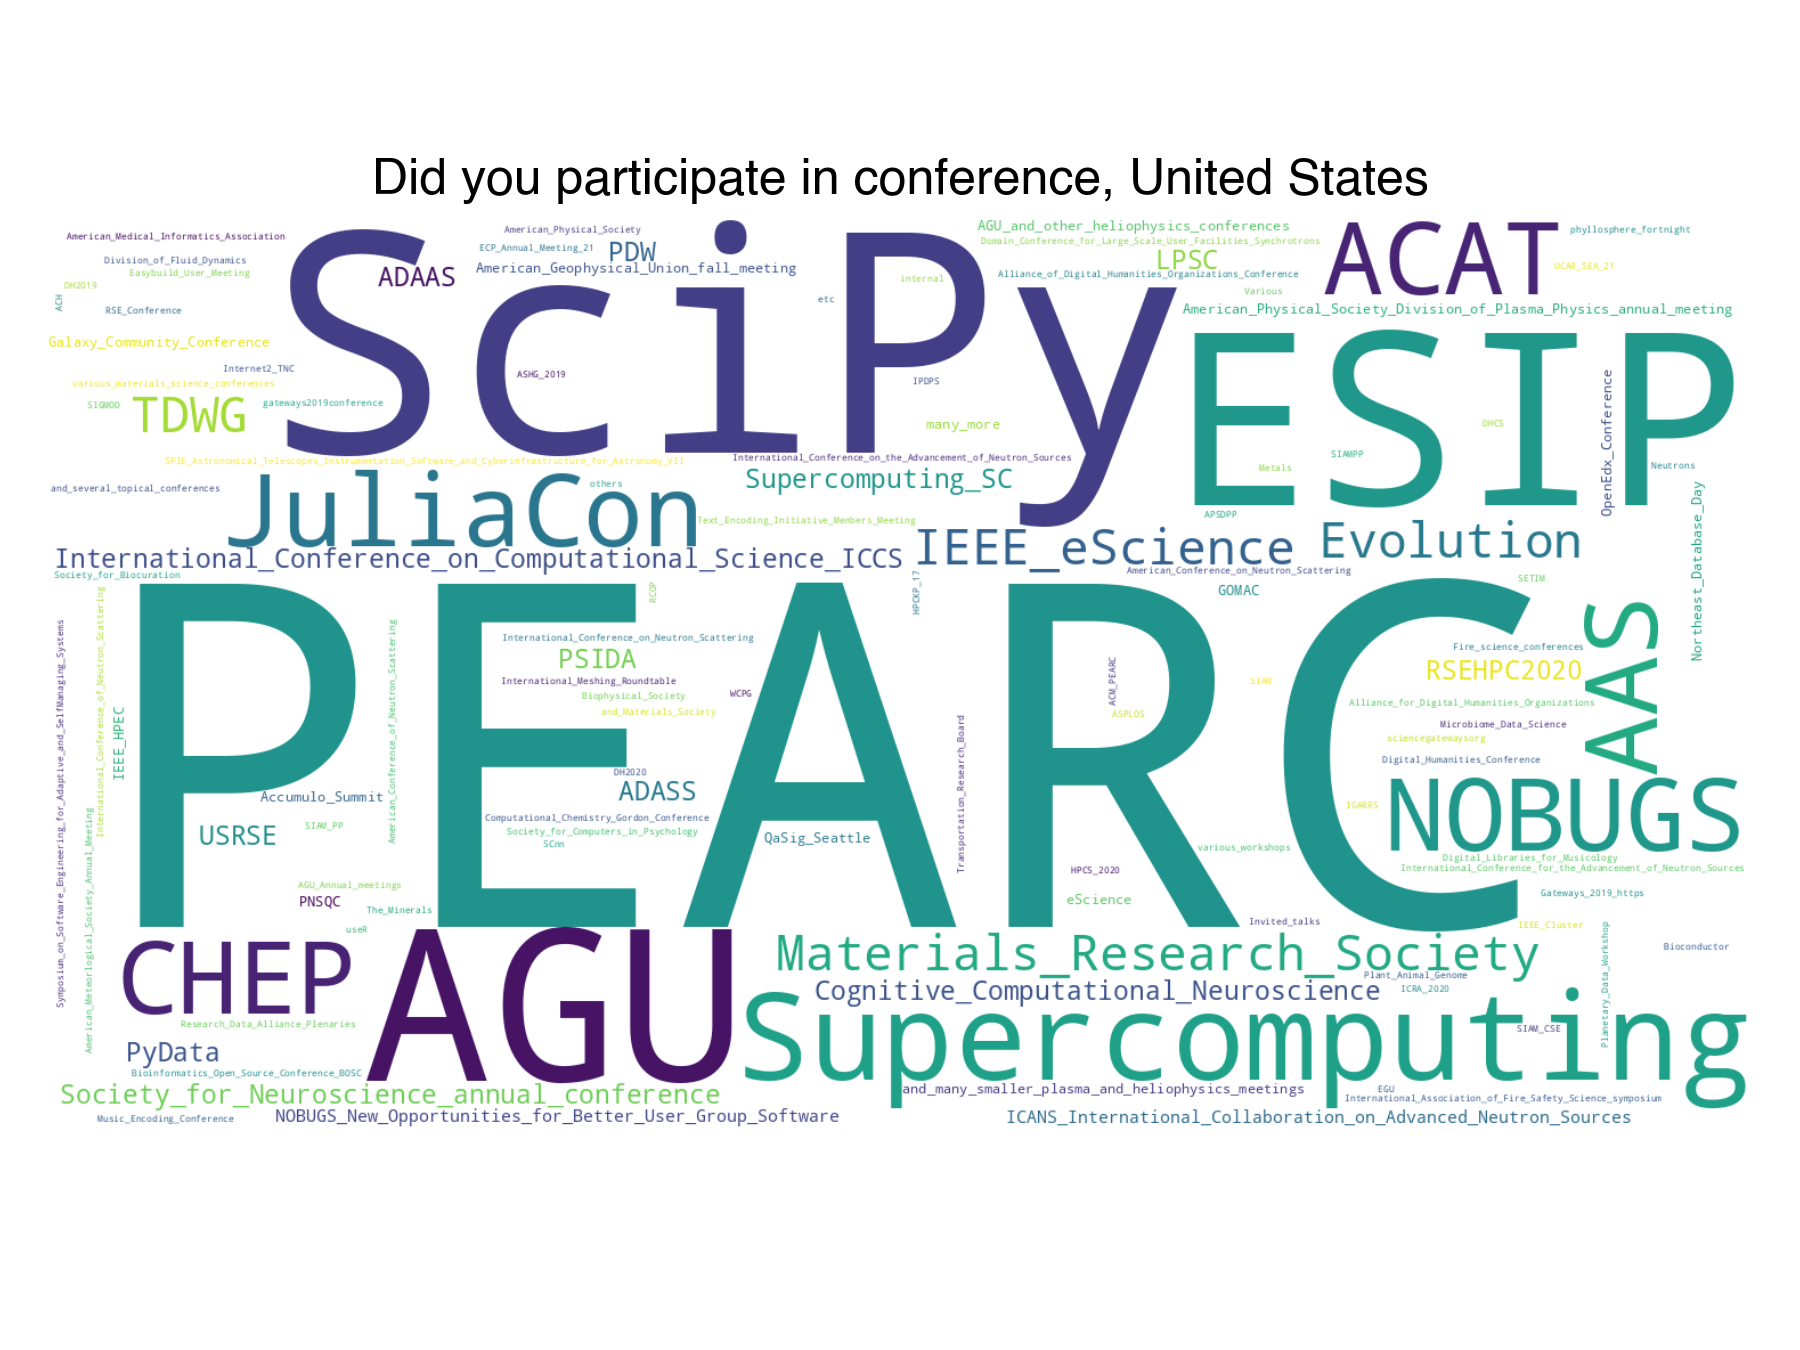
At which conference(s)/workshop(s) have you presented your software work?
(free text)
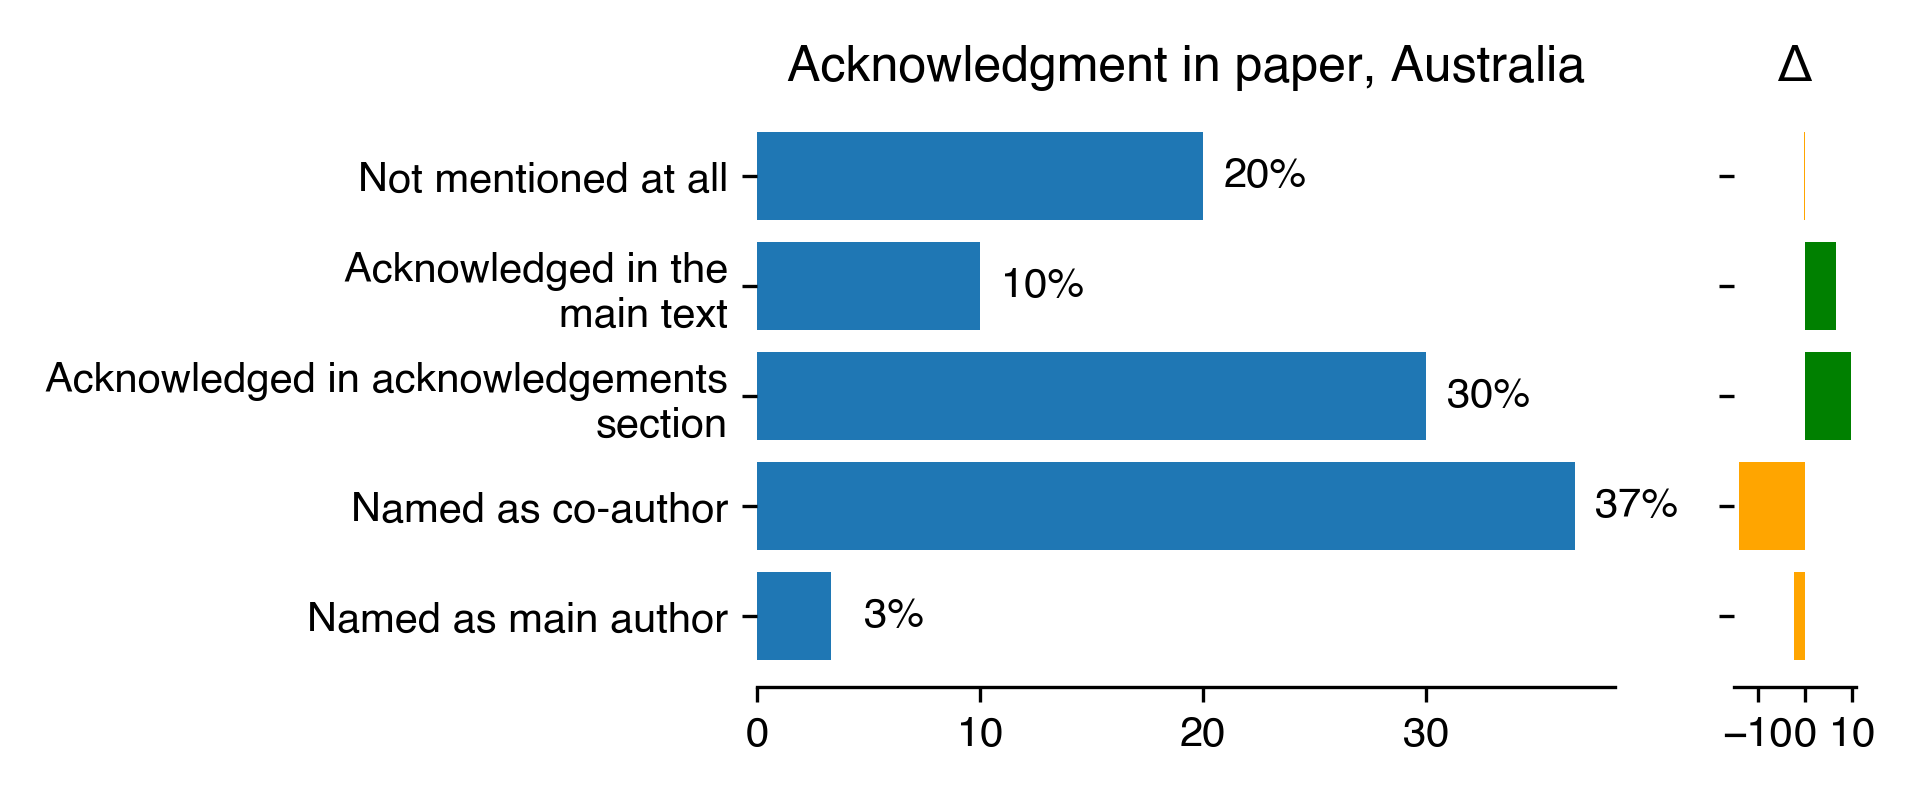
Acknowledgment in paper for Australia
Count
Percentage
Percentage in 2018
Difference with previous year
Not mentioned at all
6
20
20.22
-0.22
Acknowledged in the main text
3
10
3.37
6.63
Acknowledged in acknowledgements section
9
30
20.22
9.78
Named as co-author
11
36.67
50.56
-13.9
Named as main author
1
3.33
5.62
-2.28
Download CSV
2022-08-22T11:28:26.196997
image/svg+xml
Matplotlib v3.5.2, https://matplotlib.org/
PNG SVG
Did you participate in conference for Australia
Count
Percentage
Percentage in 2018
Difference with previous year
Yes
19
61.29
55.56
5.73
No
12
38.71
44.44
-5.73
Download CSV
2022-08-22T11:28:26.484451
image/svg+xml
Matplotlib v3.5.2, https://matplotlib.org/
PNG SVG
2022-08-22T11:28:27.807565
image/svg+xml
Matplotlib v3.5.2, https://matplotlib.org/
PNG SVG
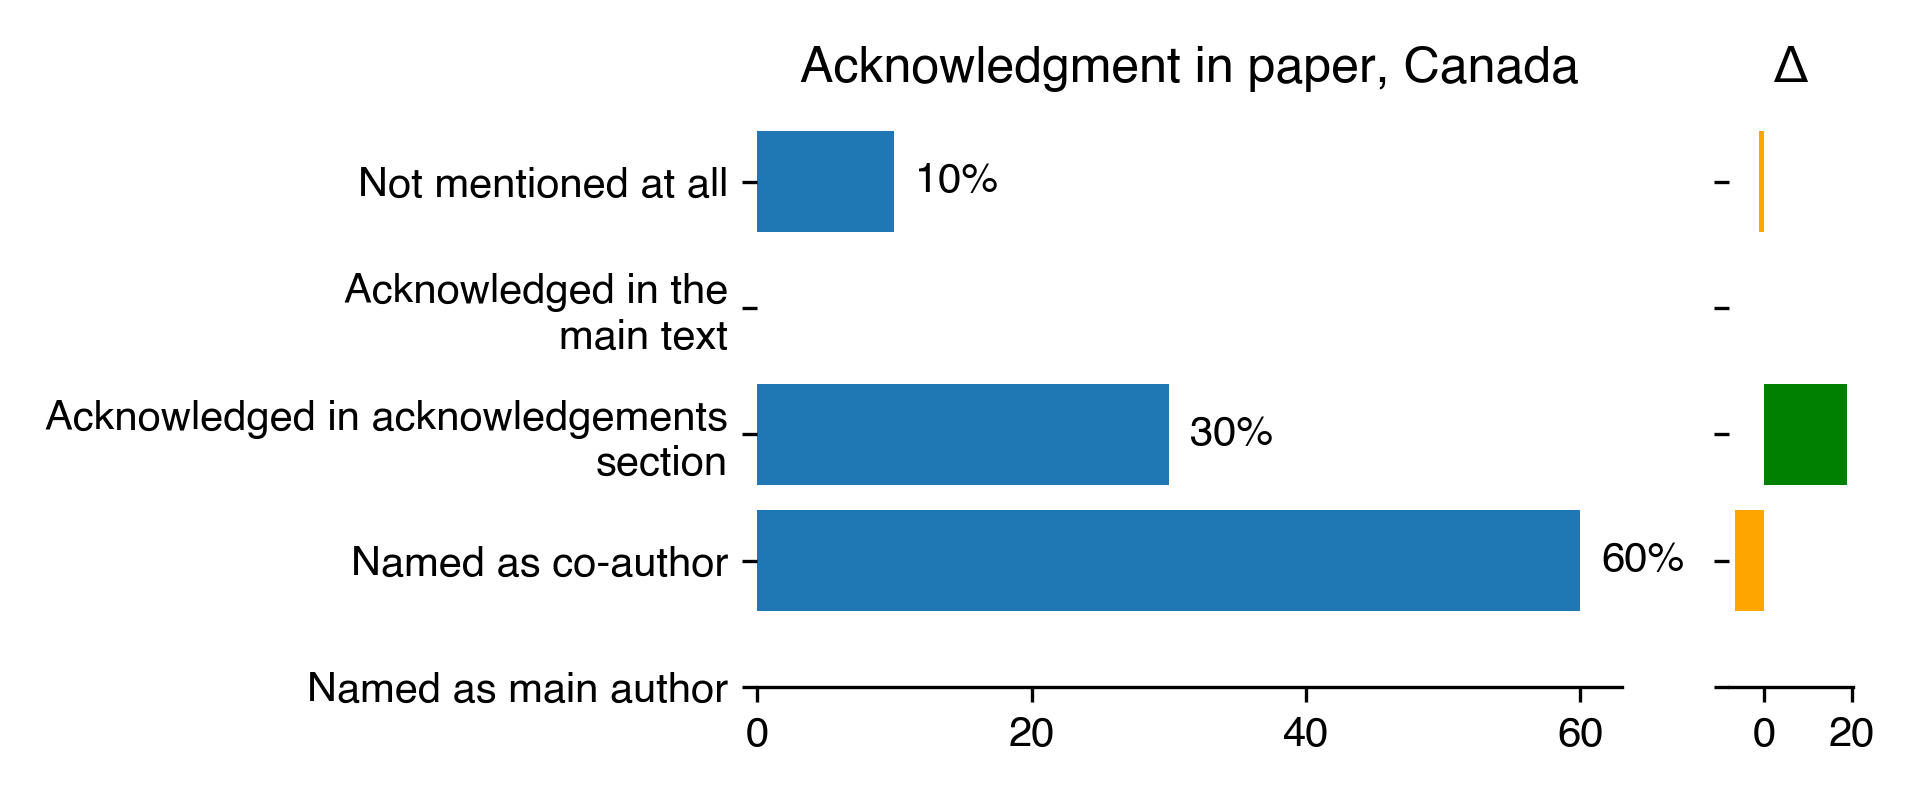
Acknowledgment in paper for Canada
Count
Percentage
Percentage in 2018
Difference with previous year
Not mentioned at all
1
10
11.11
-1.11
Acknowledged in the main text
nan
nan
nan
nan
Acknowledged in acknowledgements section
3
30
11.11
18.89
Named as co-author
6
60
66.67
-6.67
Named as main author
nan
nan
nan
nan
Download CSV
2022-08-22T11:28:28.518564
image/svg+xml
Matplotlib v3.5.2, https://matplotlib.org/
PNG SVG
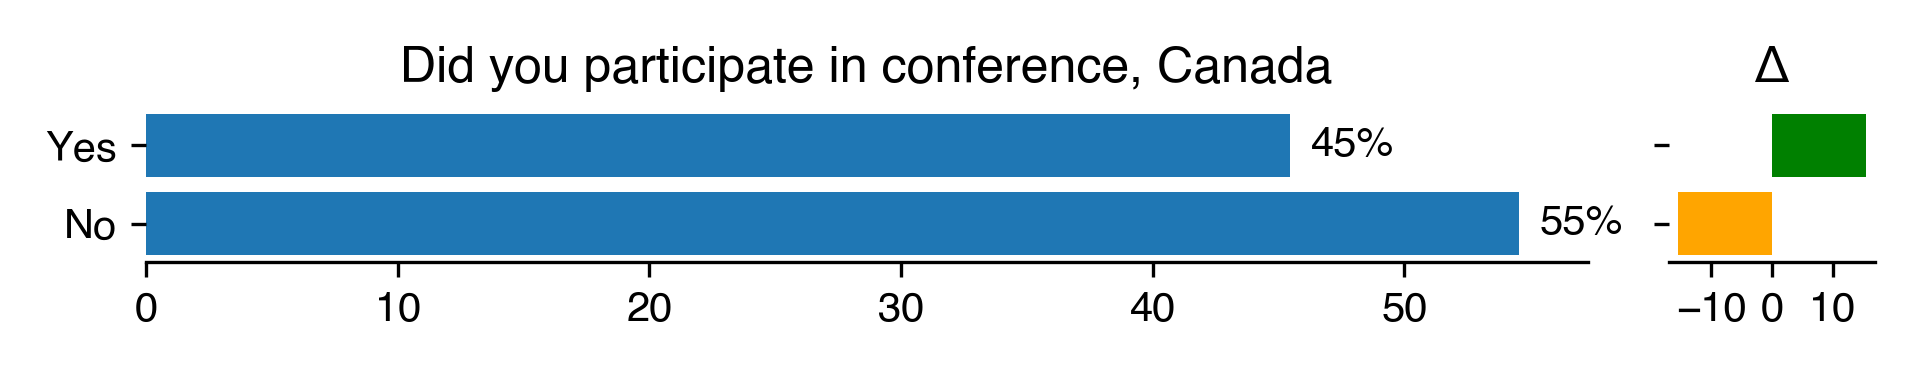
Did you participate in conference for Canada
Count
Percentage
Percentage in 2018
Difference with previous year
Yes
5
45.45
30
15.45
No
6
54.55
70
-15.45
Download CSV
2022-08-22T11:28:28.786197
image/svg+xml
Matplotlib v3.5.2, https://matplotlib.org/
PNG SVG
2022-08-22T11:28:29.850067
image/svg+xml
Matplotlib v3.5.2, https://matplotlib.org/
PNG SVG
Acknowledgment in paper for Germany
Count
Percentage
Percentage in 2018
Difference with previous year
Not mentioned at all
40
20.3
21.36
-1.05
Acknowledged in the main text
17
8.63
9.49
-0.86
Acknowledged in acknowledgements section
26
13.2
18.98
-5.79
Named as co-author
98
49.75
42.03
7.71
Named as main author
16
8.12
8.14
-0.01
Download CSV
2022-08-22T11:28:30.548888
image/svg+xml
Matplotlib v3.5.2, https://matplotlib.org/
PNG SVG
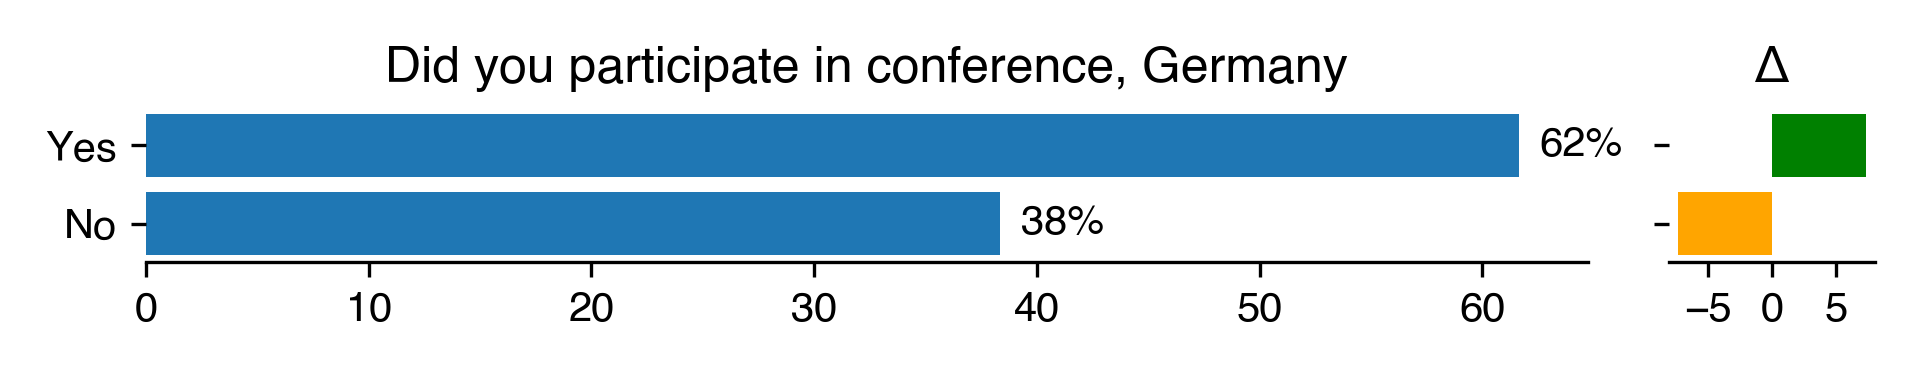
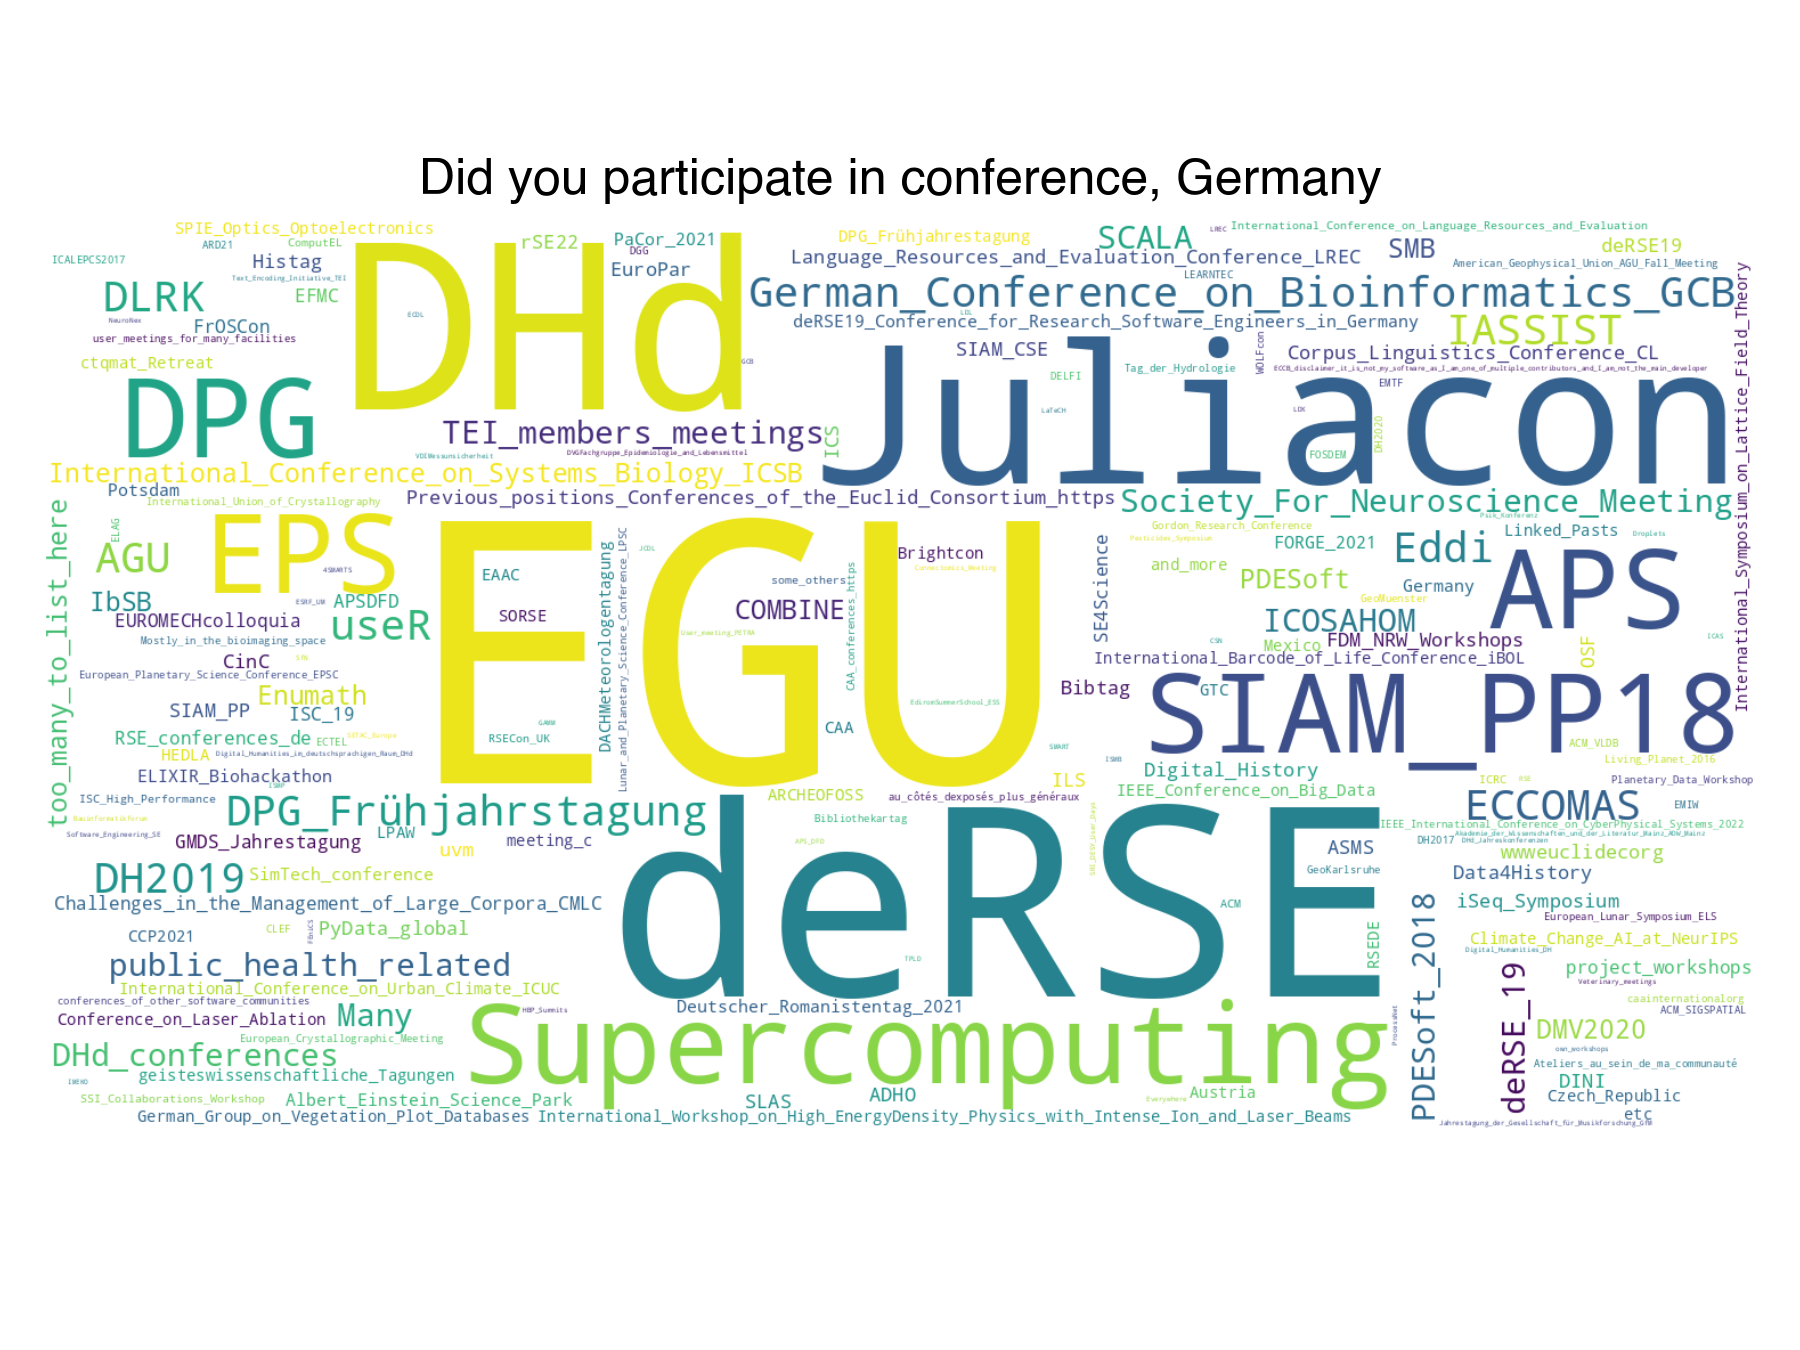
Did you participate in conference for Germany
Count
Percentage
Percentage in 2018
Difference with previous year
Yes
127
61.65
54.35
7.3
No
79
38.35
45.65
-7.3
Download CSV
2022-08-22T11:28:30.833926
image/svg+xml
Matplotlib v3.5.2, https://matplotlib.org/
PNG SVG
2022-08-22T11:28:33.725459
image/svg+xml
Matplotlib v3.5.2, https://matplotlib.org/
PNG SVG
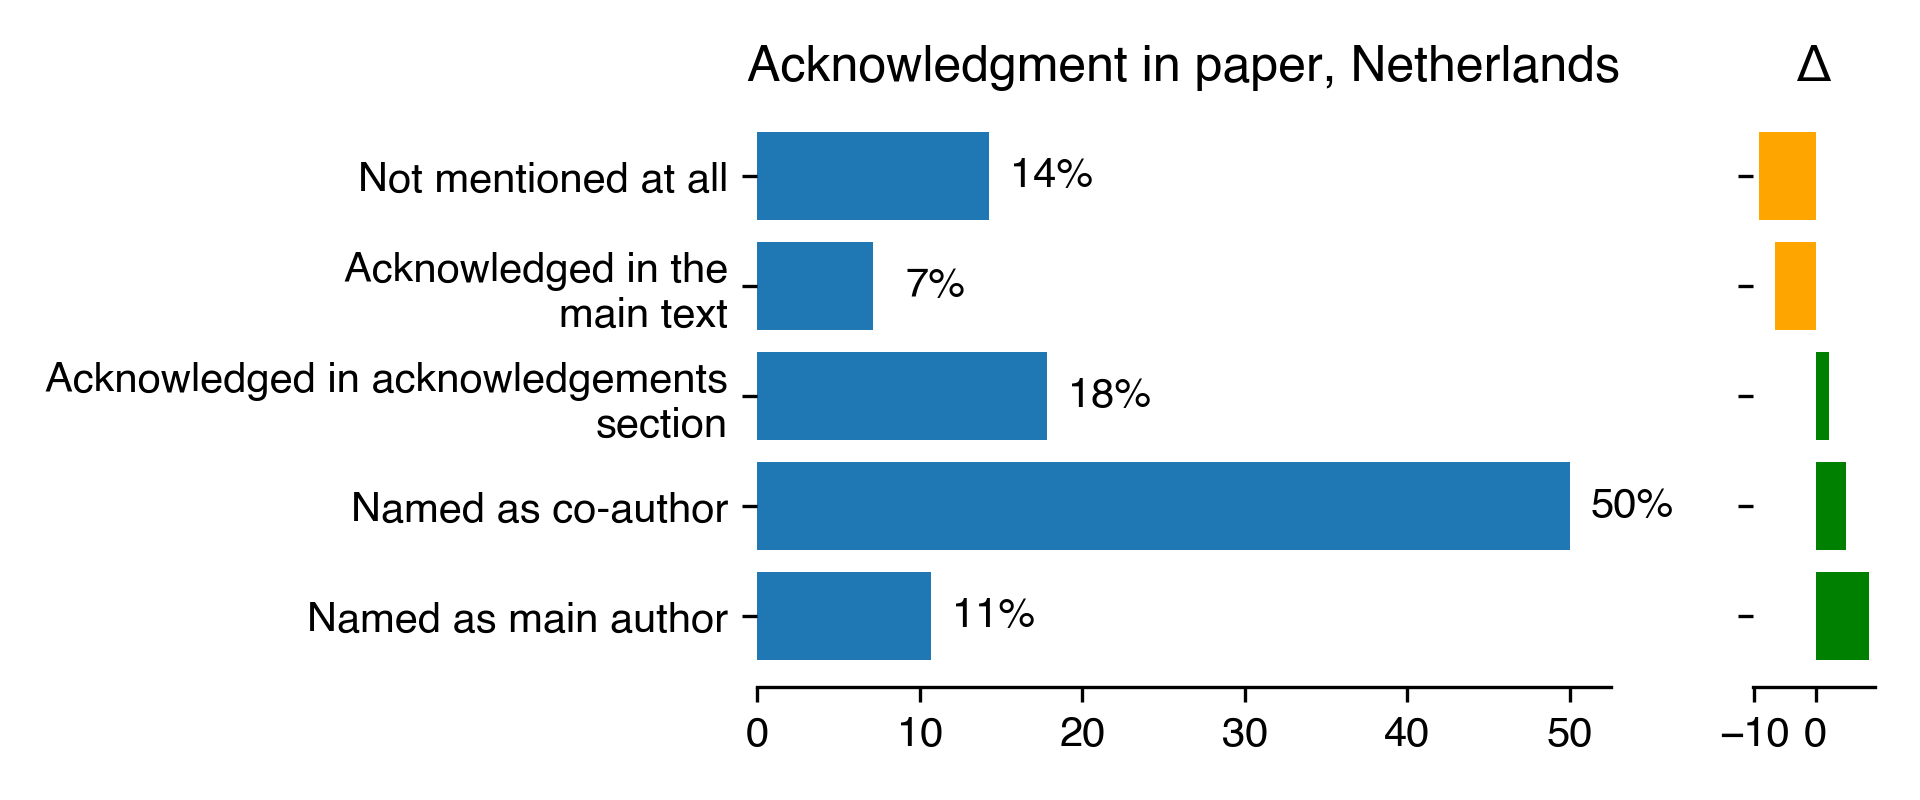
Acknowledgment in paper for Netherlands
Count
Percentage
Percentage in 2018
Difference with previous year
Not mentioned at all
8
14.29
23.53
-9.24
Acknowledged in the main text
4
7.14
13.73
-6.58
Acknowledged in acknowledgements section
10
17.86
15.69
2.17
Named as co-author
28
50
45.1
4.9
Named as main author
6
10.71
1.96
8.75
Download CSV
2022-08-22T11:28:34.493349
image/svg+xml
Matplotlib v3.5.2, https://matplotlib.org/
PNG SVG
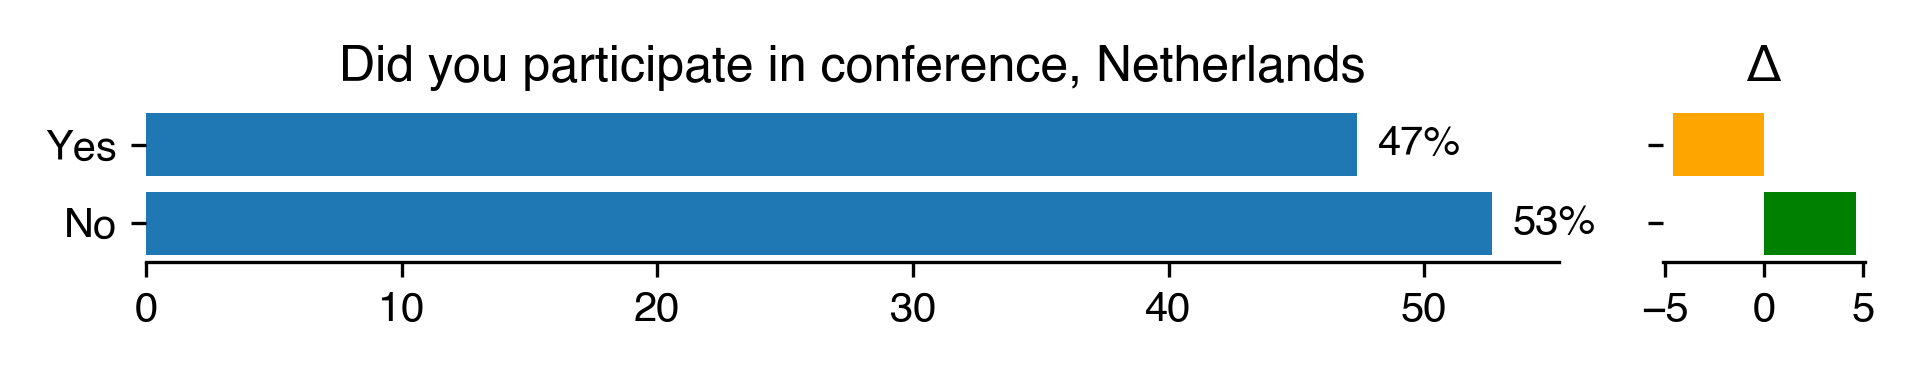
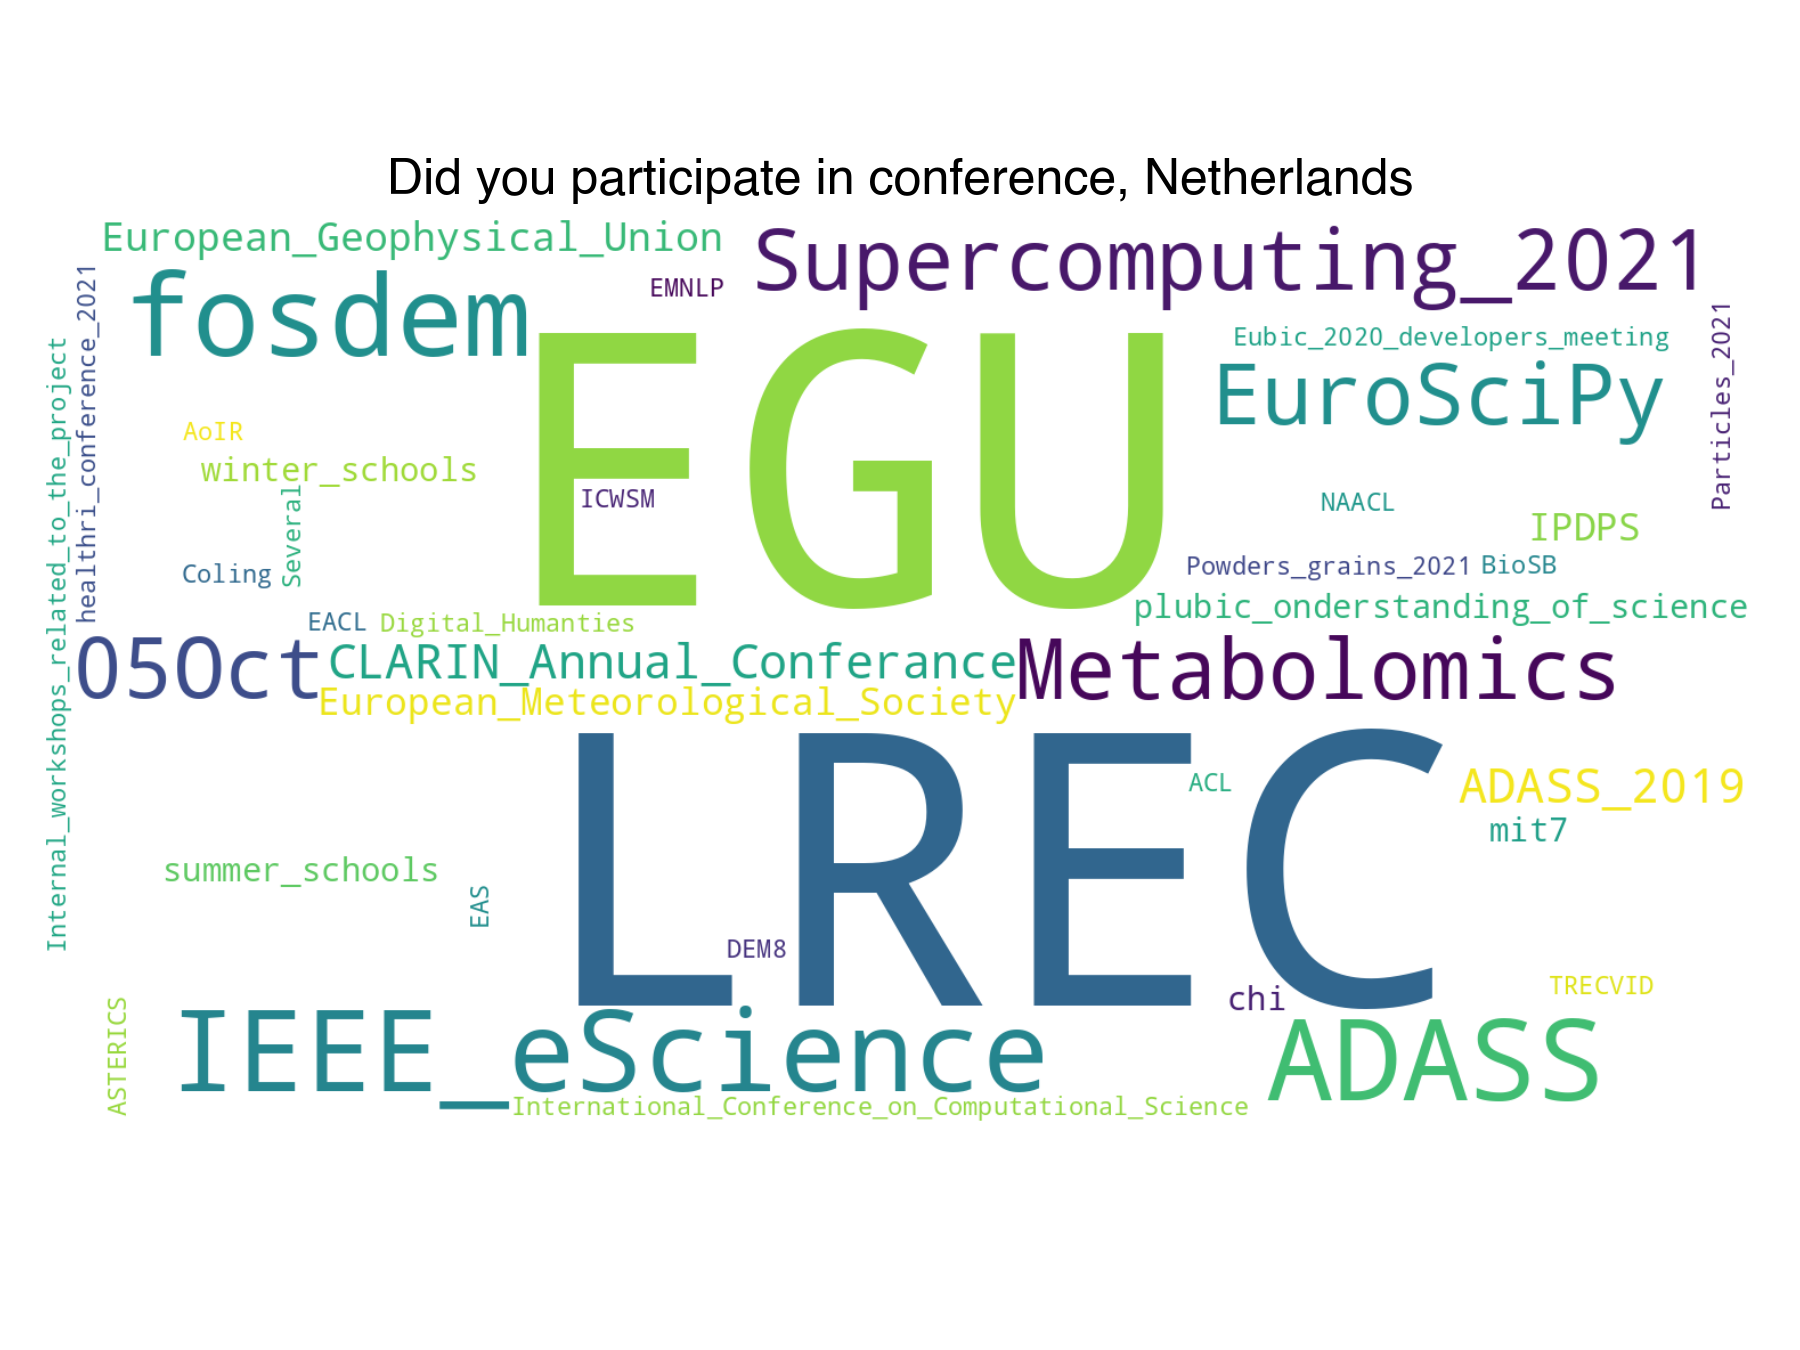
Did you participate in conference for Netherlands
Count
Percentage
Percentage in 2018
Difference with previous year
Yes
27
47.37
52
-4.63
No
30
52.63
48
4.63
Download CSV
2022-08-22T11:28:34.771162
image/svg+xml
Matplotlib v3.5.2, https://matplotlib.org/
PNG SVG
2022-08-22T11:28:36.233082
image/svg+xml
Matplotlib v3.5.2, https://matplotlib.org/
PNG SVG
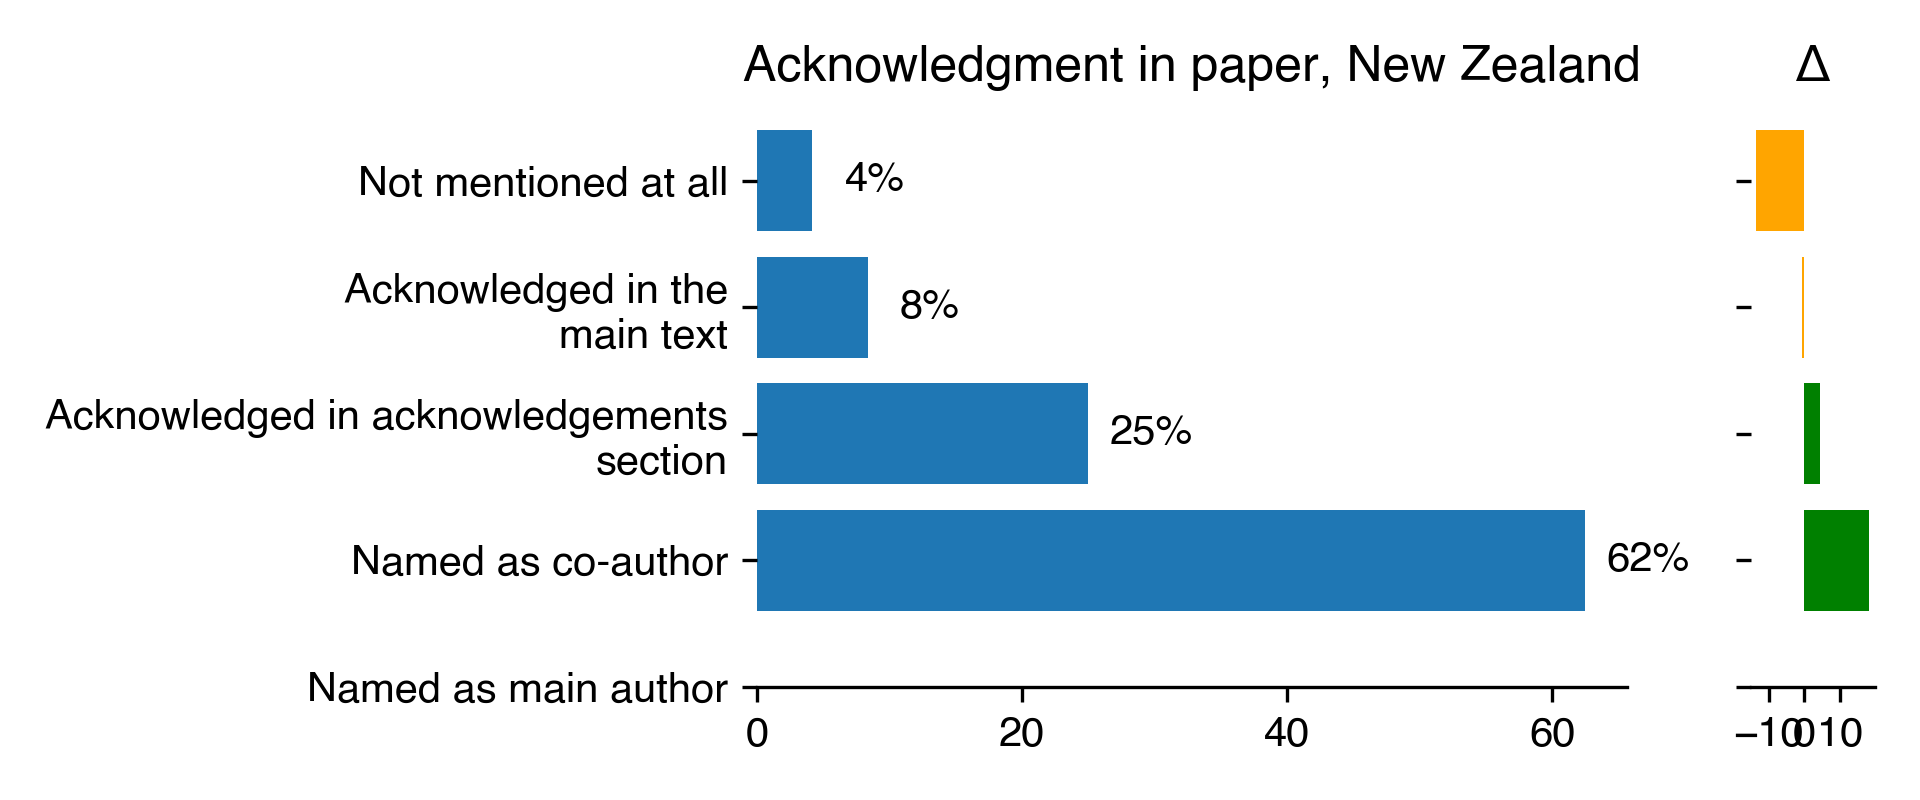
Acknowledgment in paper for New Zealand
Count
Percentage
Percentage in 2018
Difference with previous year
Not mentioned at all
1
4.17
17.65
-13.48
Acknowledged in the main text
2
8.33
8.82
-0.49
Acknowledged in acknowledgements section
6
25
20.59
4.41
Named as co-author
15
62.5
44.12
18.38
Named as main author
nan
nan
nan
nan
Download CSV
2022-08-22T11:28:36.911971
image/svg+xml
Matplotlib v3.5.2, https://matplotlib.org/
PNG SVG
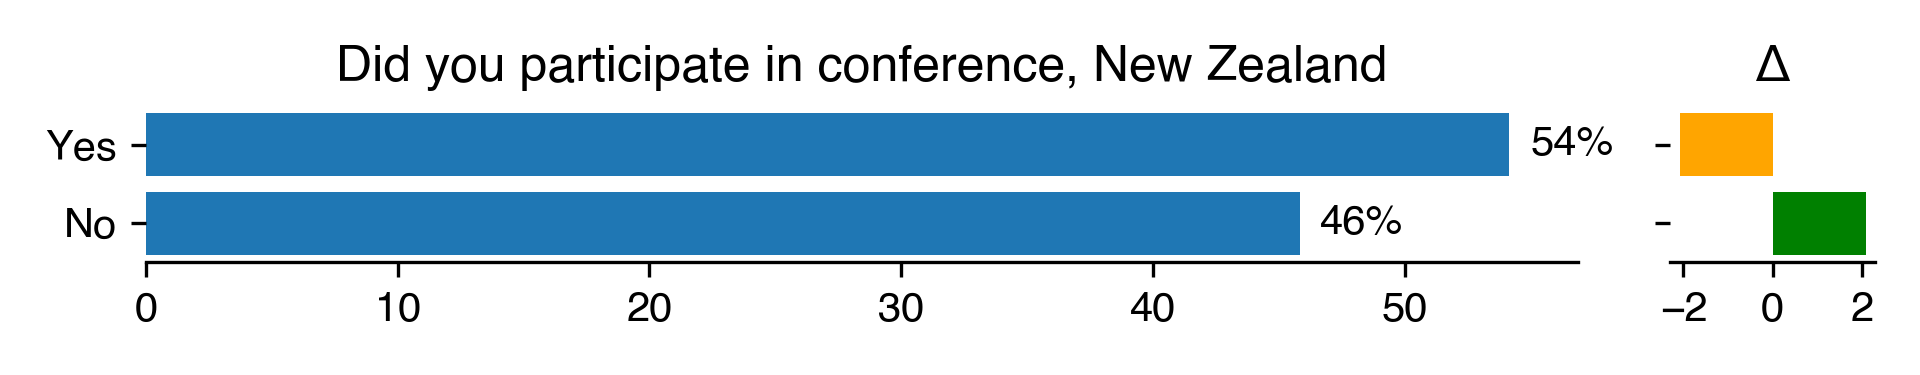
Did you participate in conference for New Zealand
Count
Percentage
Percentage in 2018
Difference with previous year
Yes
13
54.17
56.25
-2.08
No
11
45.83
43.75
2.08
Download CSV
2022-08-22T11:28:37.187743
image/svg+xml
Matplotlib v3.5.2, https://matplotlib.org/
PNG SVG
2022-08-22T11:28:38.155808
image/svg+xml
Matplotlib v3.5.2, https://matplotlib.org/
PNG SVG
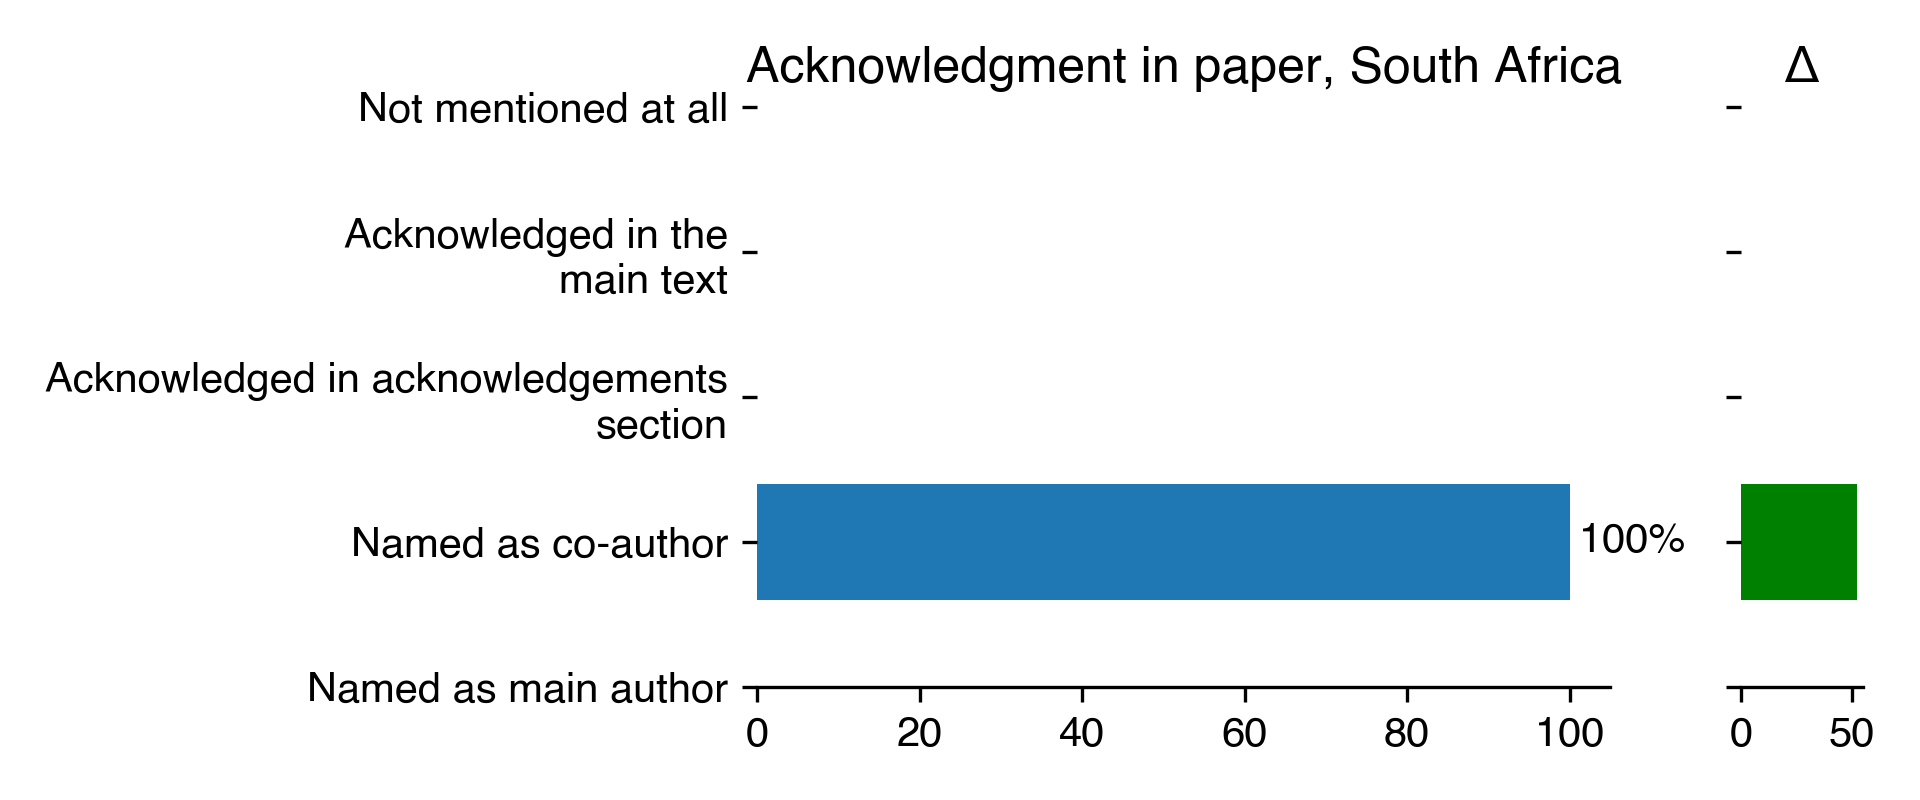
Acknowledgment in paper for South Africa
Count
Percentage
Percentage in 2018
Difference with previous year
Not mentioned at all
nan
nan
nan
nan
Acknowledged in the main text
nan
nan
nan
nan
Acknowledged in acknowledgements section
nan
nan
nan
nan
Named as co-author
2
100
47.62
52.38
Named as main author
nan
nan
nan
nan
Download CSV
2022-08-22T11:28:38.813016
image/svg+xml
Matplotlib v3.5.2, https://matplotlib.org/
PNG SVG
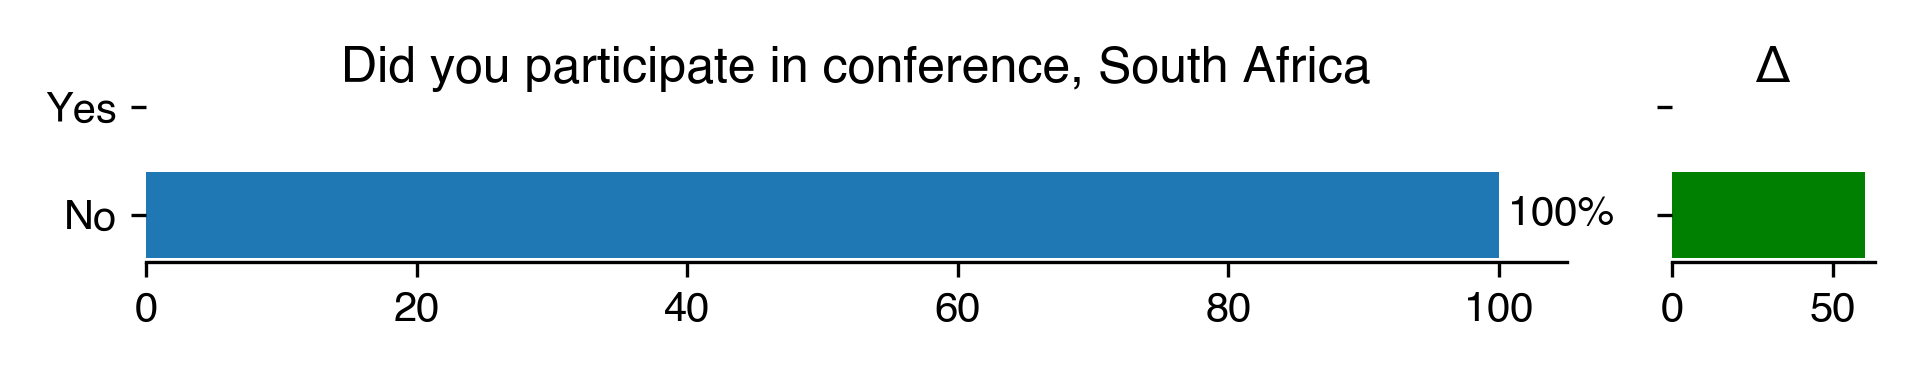
Did you participate in conference for South Africa
Count
Percentage
Percentage in 2018
Difference with previous year
Yes
nan
nan
60
nan
No
2
100
40
60
Download CSV
2022-08-22T11:28:39.089093
image/svg+xml
Matplotlib v3.5.2, https://matplotlib.org/
PNG SVG
2022-08-22T11:28:39.315077
image/svg+xml
Matplotlib v3.5.2, https://matplotlib.org/
PNG SVG
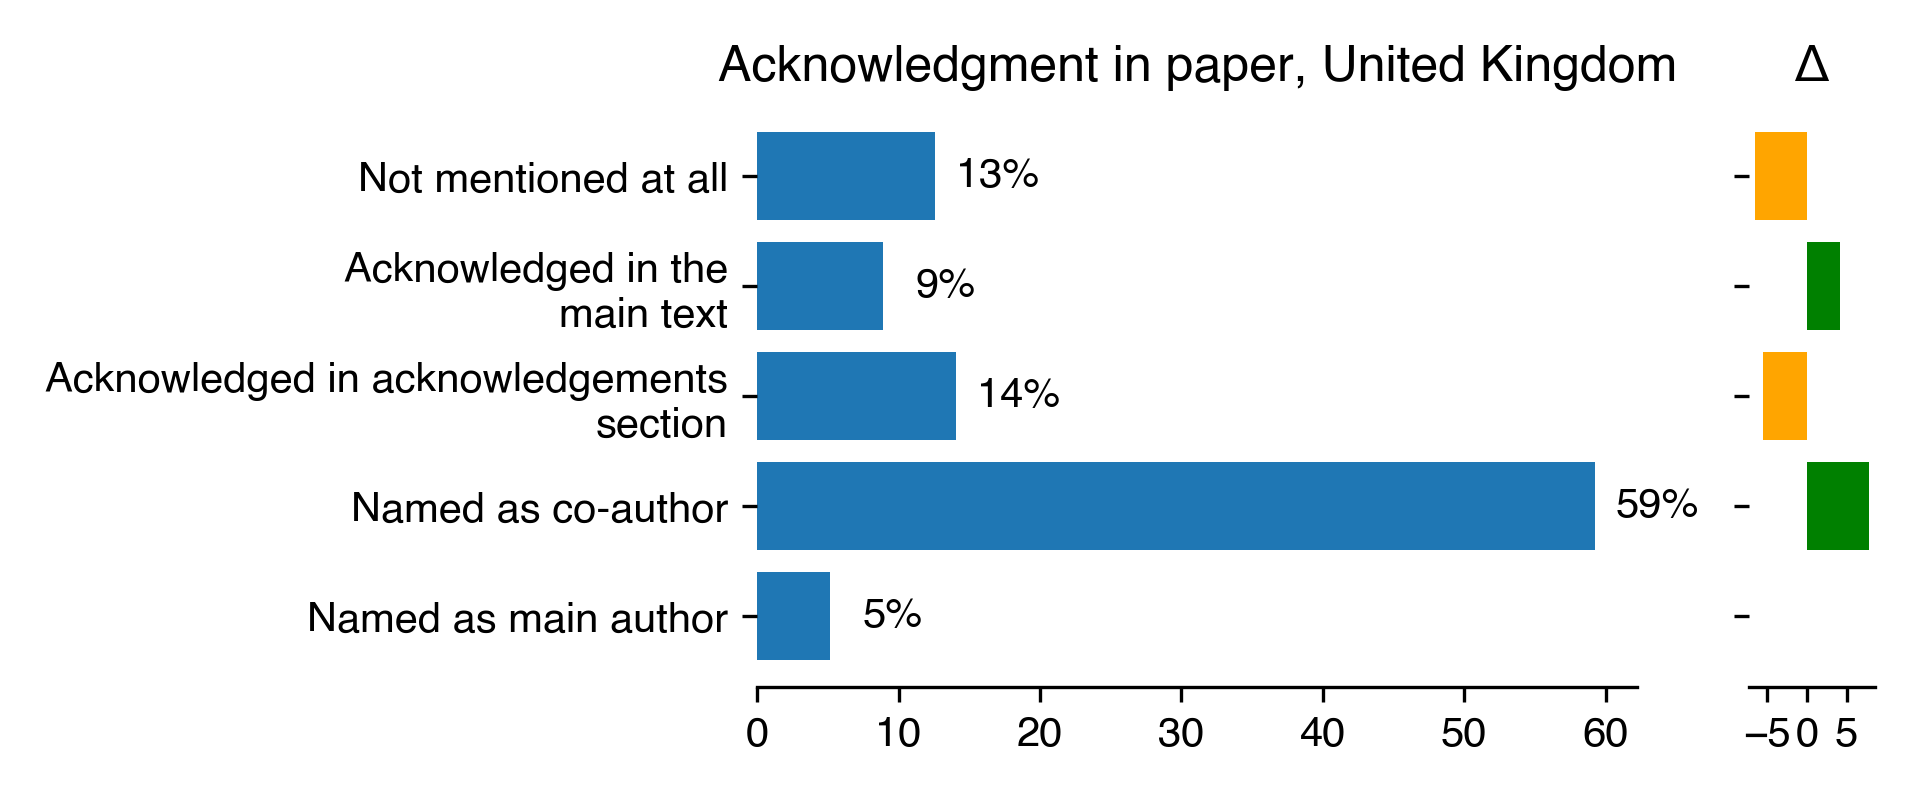
Acknowledgment in paper for United Kingdom
Count
Percentage
Percentage in 2018
Difference with previous year
Not mentioned at all
17
12.59
19.16
-6.57
Acknowledged in the main text
12
8.89
4.67
4.22
Acknowledged in acknowledgements section
19
14.07
19.63
-5.55
Named as co-author
80
59.26
51.4
7.86
Named as main author
7
5.19
5.14
0.04
Download CSV
2022-08-22T11:28:39.624982
image/svg+xml
Matplotlib v3.5.2, https://matplotlib.org/
PNG SVG
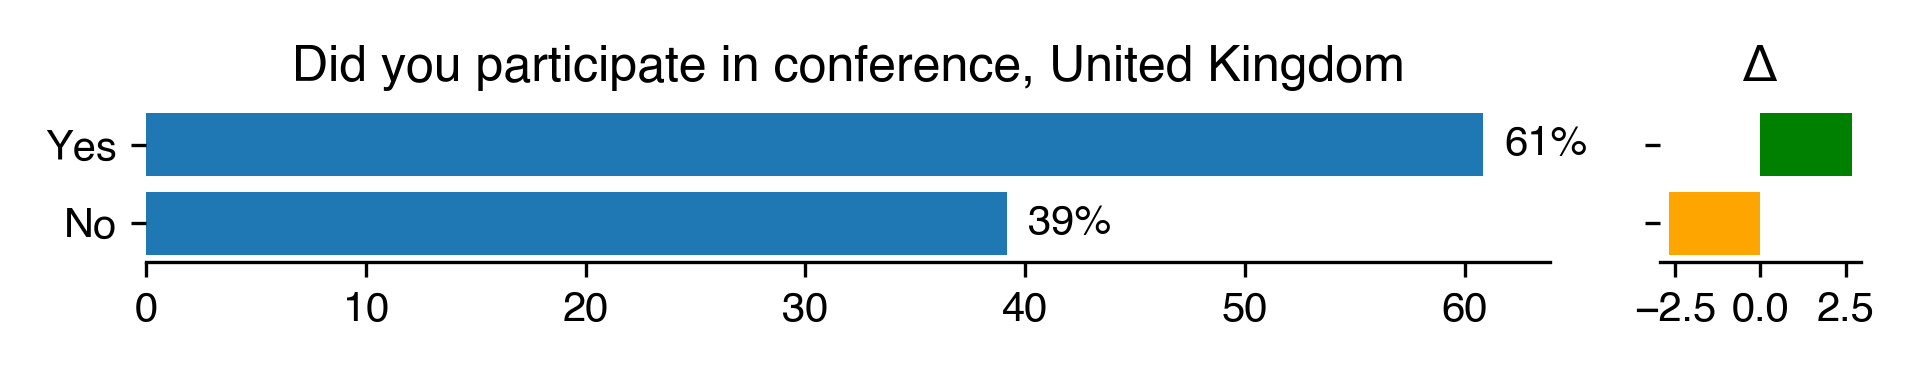
Did you participate in conference for United Kingdom
Count
Percentage
Percentage in 2018
Difference with previous year
Yes
87
60.84
58.17
2.67
No
56
39.16
41.83
-2.67
Download CSV
2022-08-22T11:28:39.916038
image/svg+xml
Matplotlib v3.5.2, https://matplotlib.org/
PNG SVG
2022-08-22T11:28:42.482550
image/svg+xml
Matplotlib v3.5.2, https://matplotlib.org/
PNG SVG
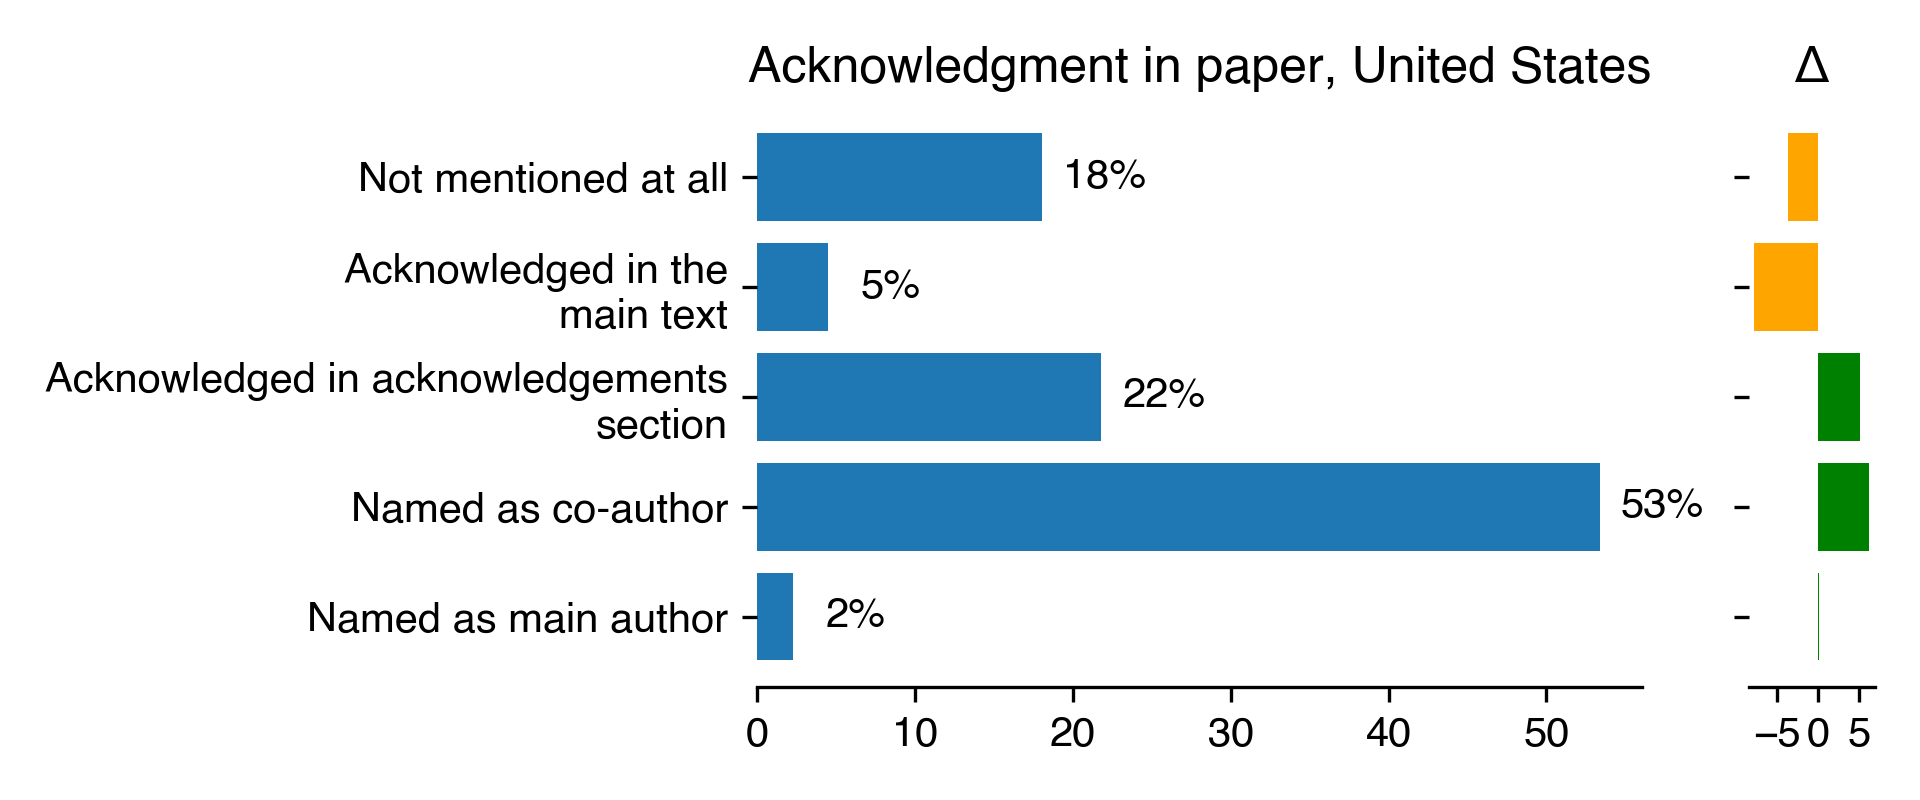
Acknowledgment in paper for United States
Count
Percentage
Percentage in 2018
Difference with previous year
Not mentioned at all
24
18.05
21.74
-3.69
Acknowledged in the main text
6
4.51
12.32
-7.81
Acknowledged in acknowledgements section
29
21.8
16.67
5.14
Named as co-author
71
53.38
47.1
6.28
Named as main author
3
2.26
2.17
0.08
Download CSV
2022-08-22T11:28:43.210181
image/svg+xml
Matplotlib v3.5.2, https://matplotlib.org/
PNG SVG
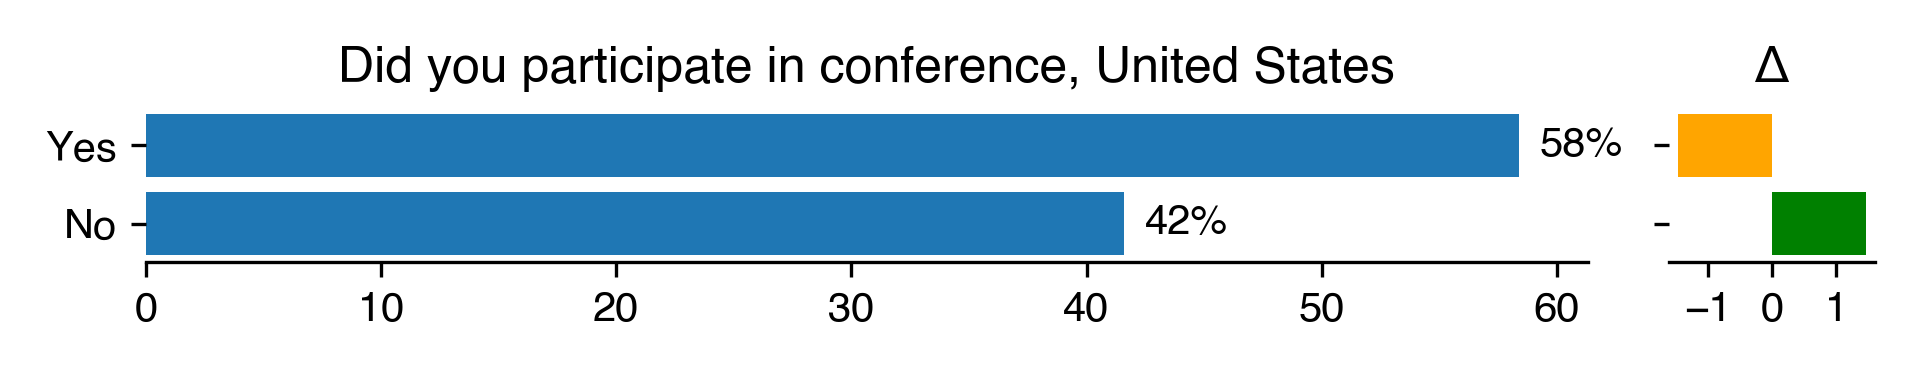
Did you participate in conference for United States
Count
Percentage
Percentage in 2018
Difference with previous year
Yes
80
58.39
59.85
-1.45
No
57
41.61
40.15
1.45
Download CSV
2022-08-22T11:28:43.492368
image/svg+xml
Matplotlib v3.5.2, https://matplotlib.org/
PNG SVG
2022-08-22T11:28:45.708654
image/svg+xml
Matplotlib v3.5.2, https://matplotlib.org/
PNG SVG
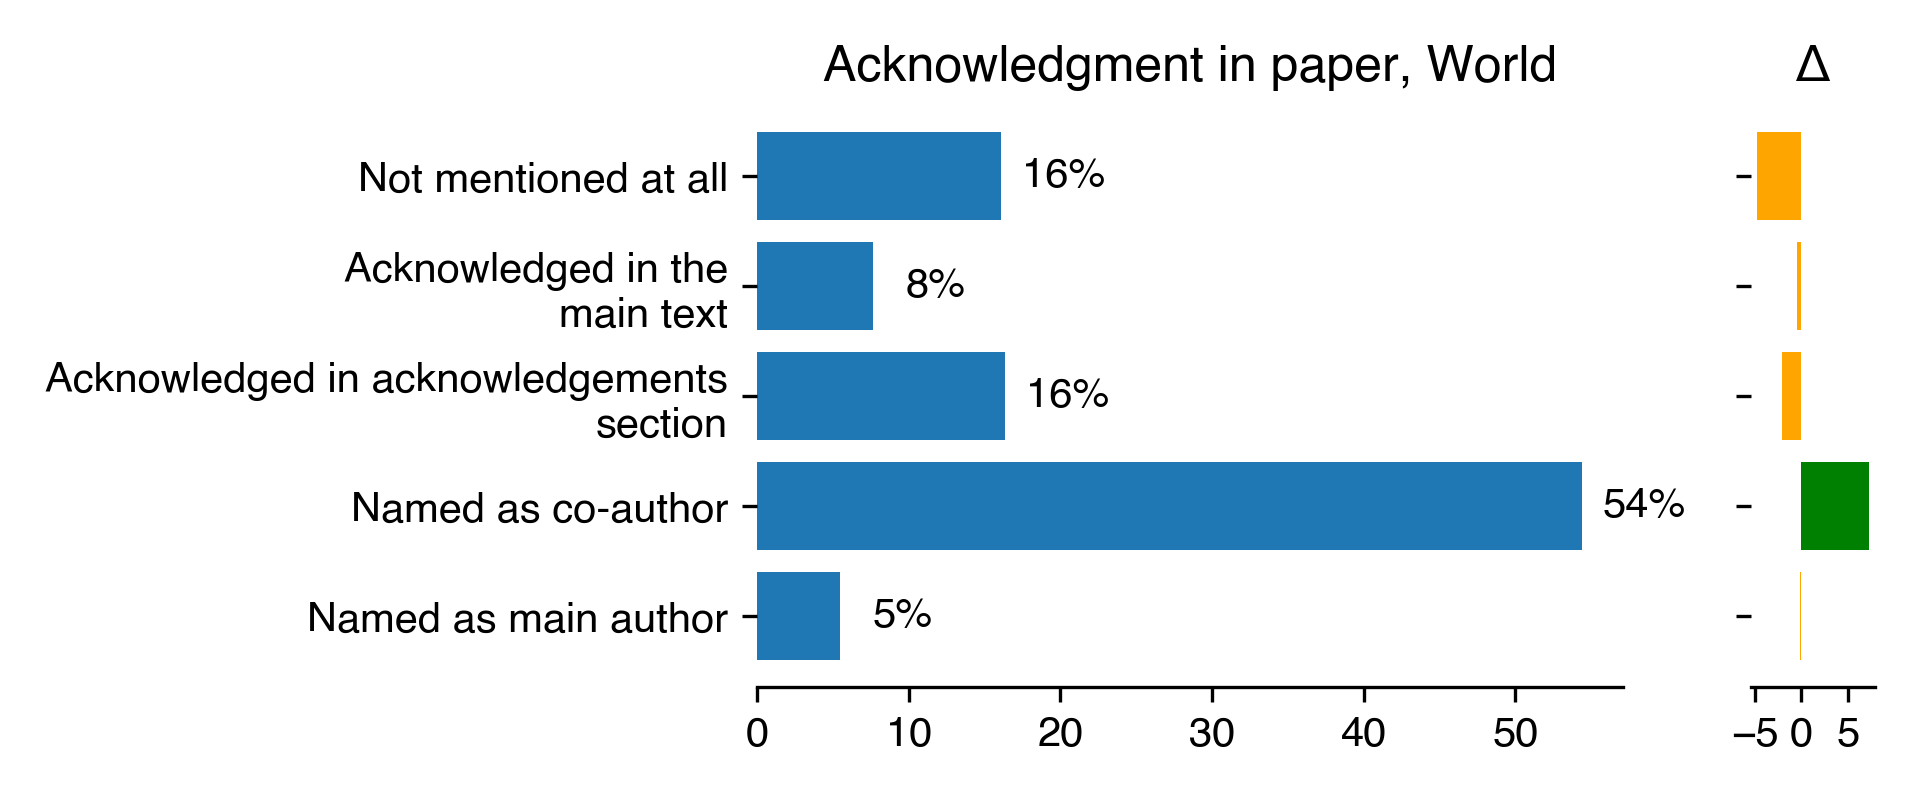
Acknowledgment in paper for World
Count
Percentage
Percentage in 2018
Difference with previous year
Not mentioned at all
126
16.09
20.85
-4.76
Acknowledged in the main text
60
7.66
8.07
-0.41
Acknowledged in acknowledgements section
128
16.35
18.39
-2.04
Named as co-author
426
54.41
47.09
7.32
Named as main author
43
5.49
5.61
-0.11
Download CSV
2022-08-22T11:28:46.450677
image/svg+xml
Matplotlib v3.5.2, https://matplotlib.org/
PNG SVG
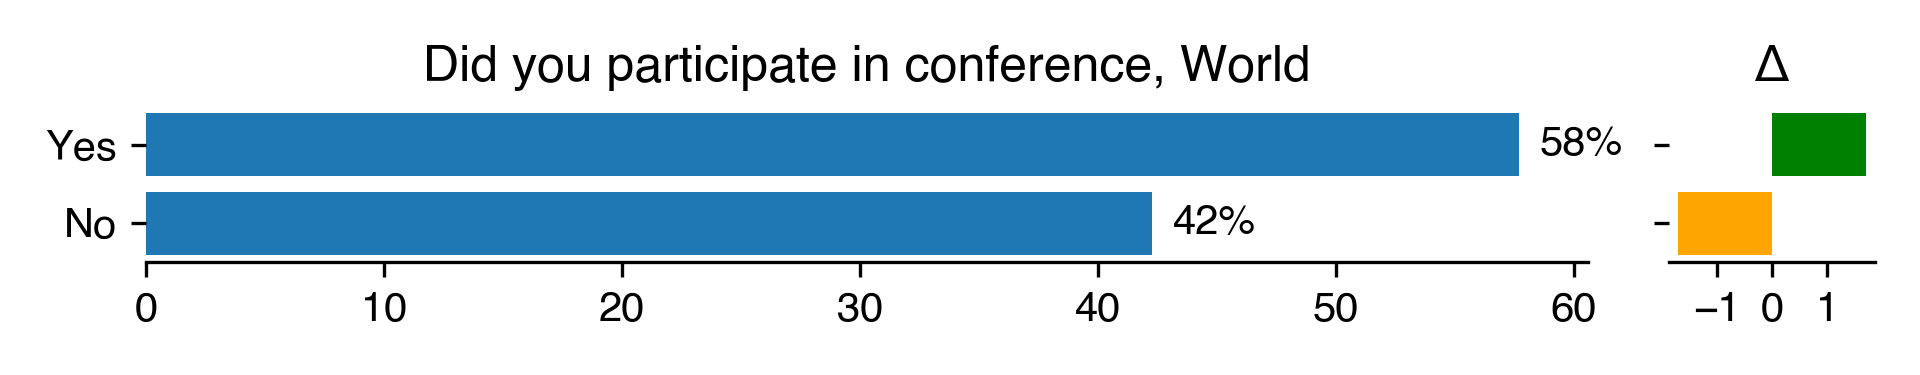
Did you participate in conference for World
Count
Percentage
Percentage in 2018
Difference with previous year
Yes
464
57.71
56.01
1.7
No
340
42.29
43.99
-1.7
Download CSV
2022-08-22T11:28:46.752466
image/svg+xml
Matplotlib v3.5.2, https://matplotlib.org/
PNG SVG
2022-08-22T11:28:49.267287
image/svg+xml
Matplotlib v3.5.2, https://matplotlib.org/
PNG SVG