How time is spent
- How to read the plots
- Questions in this section
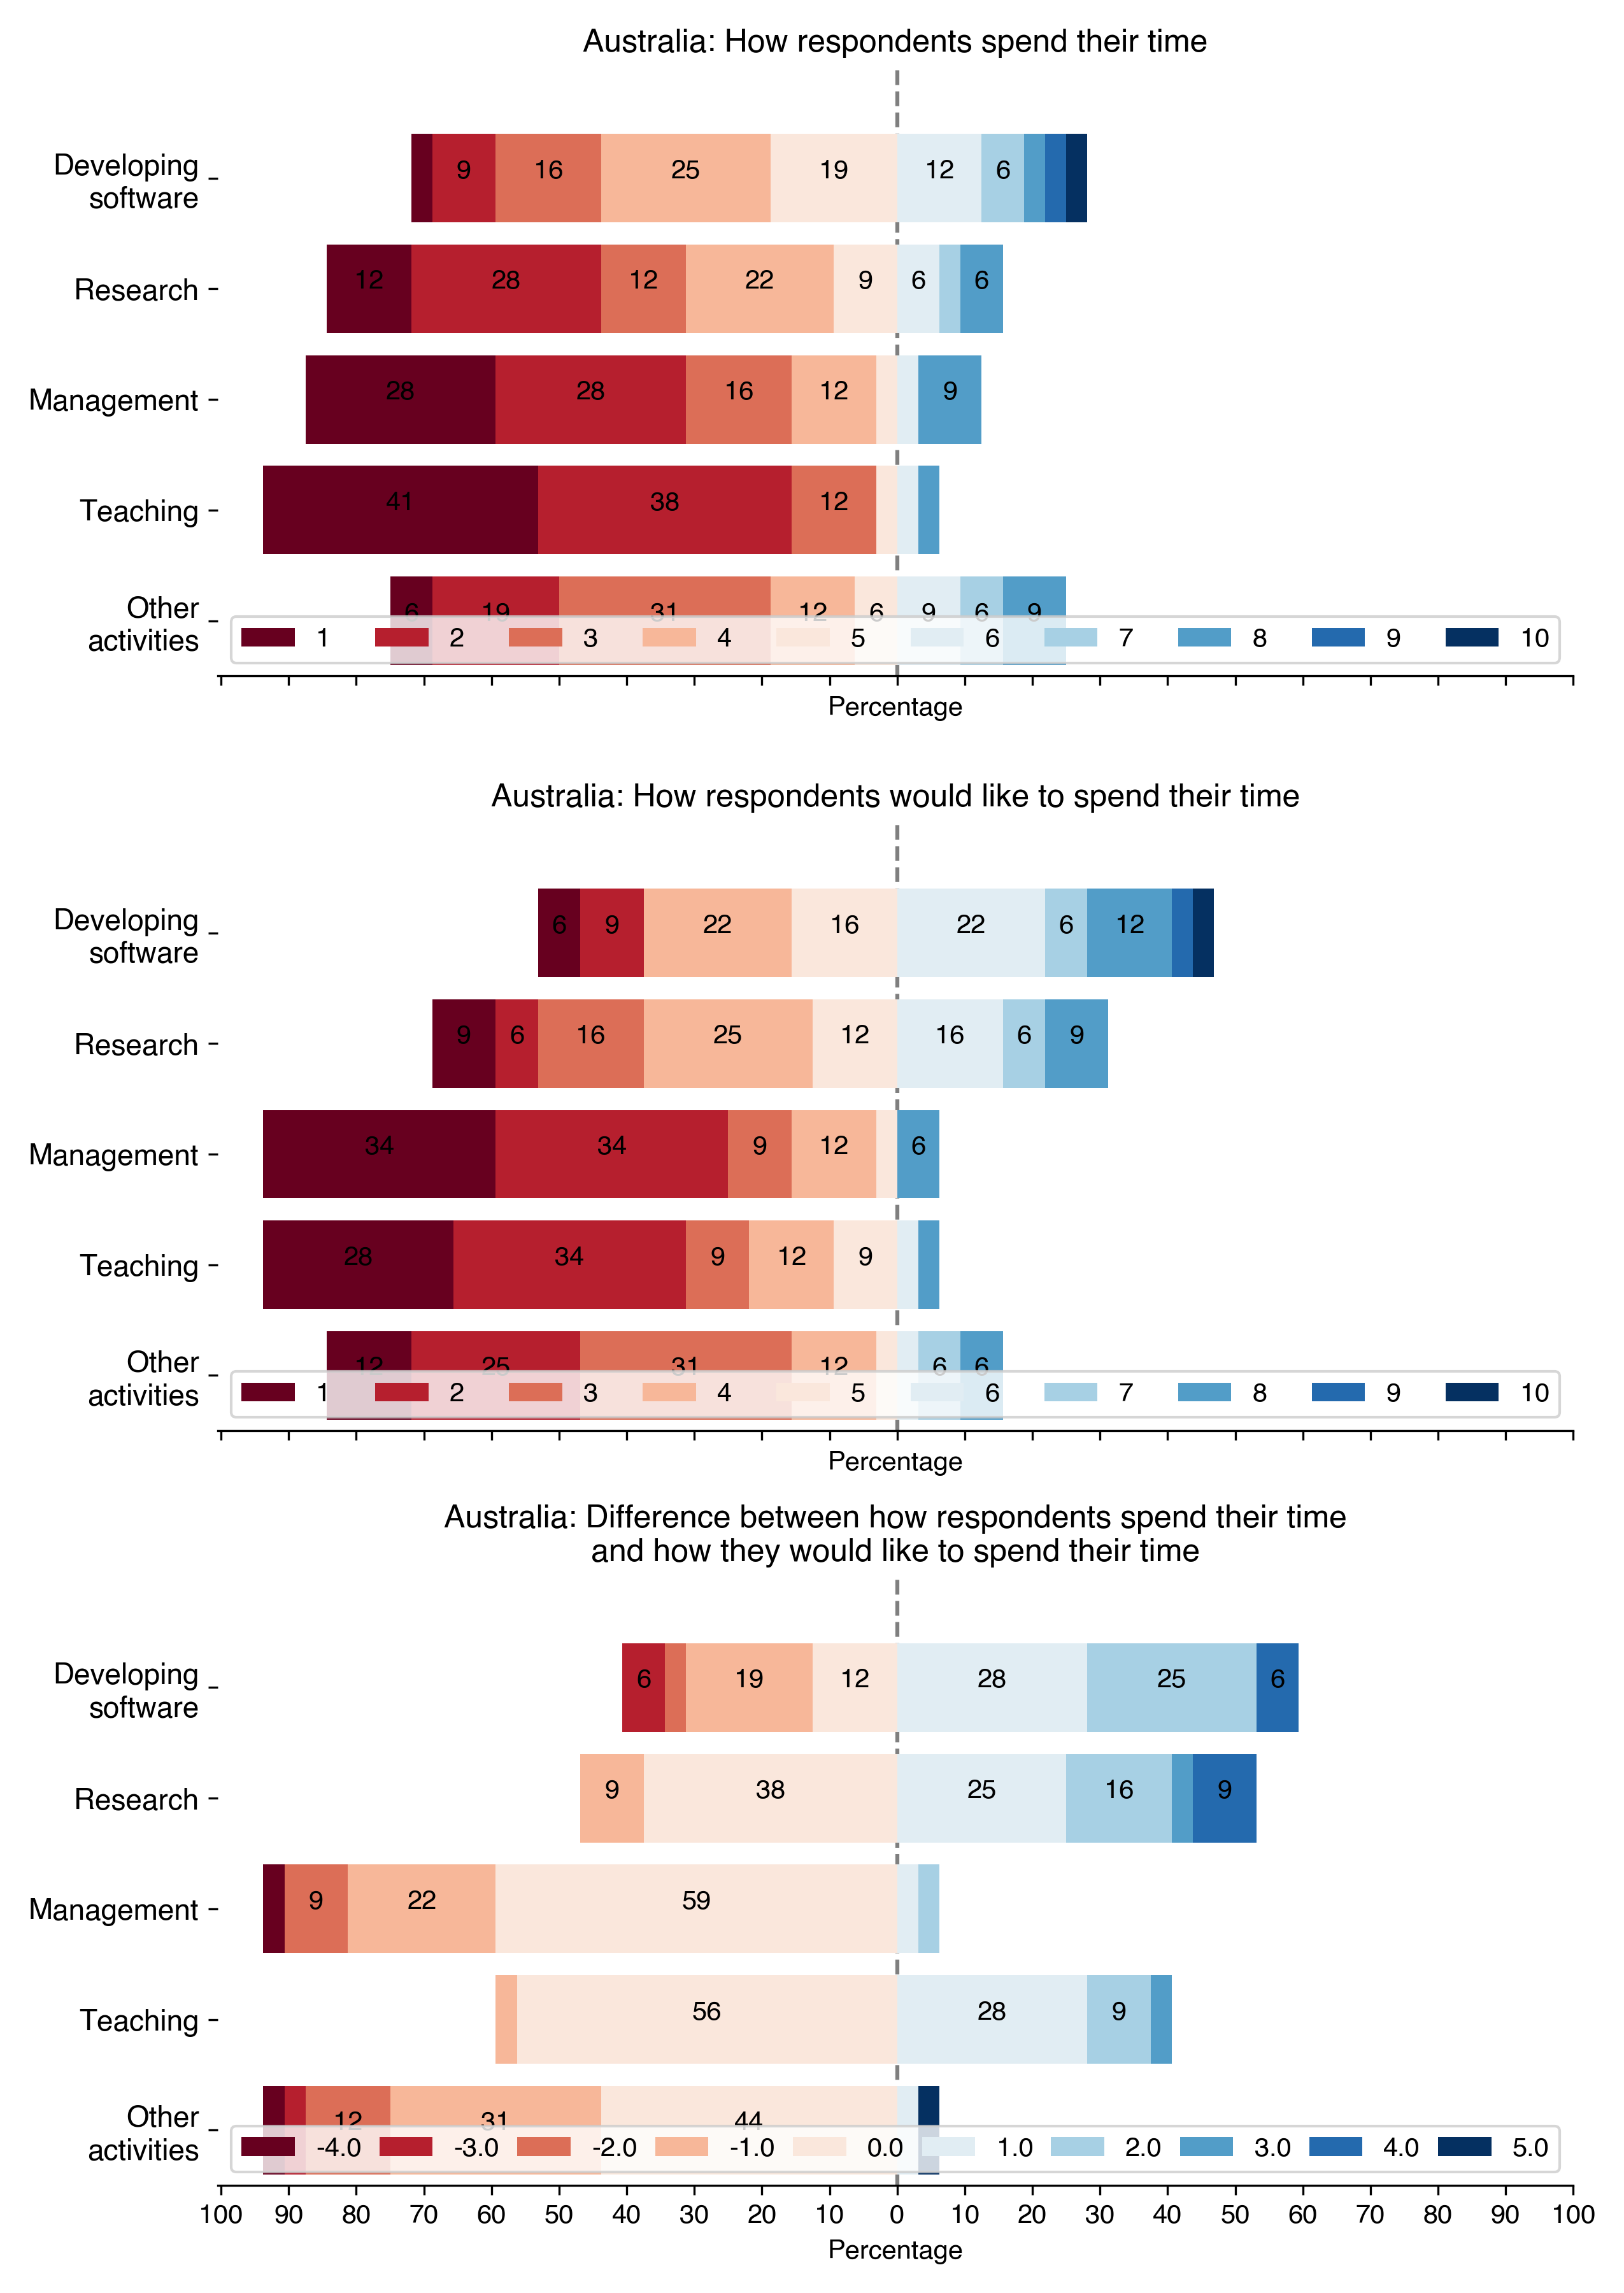
- Australia
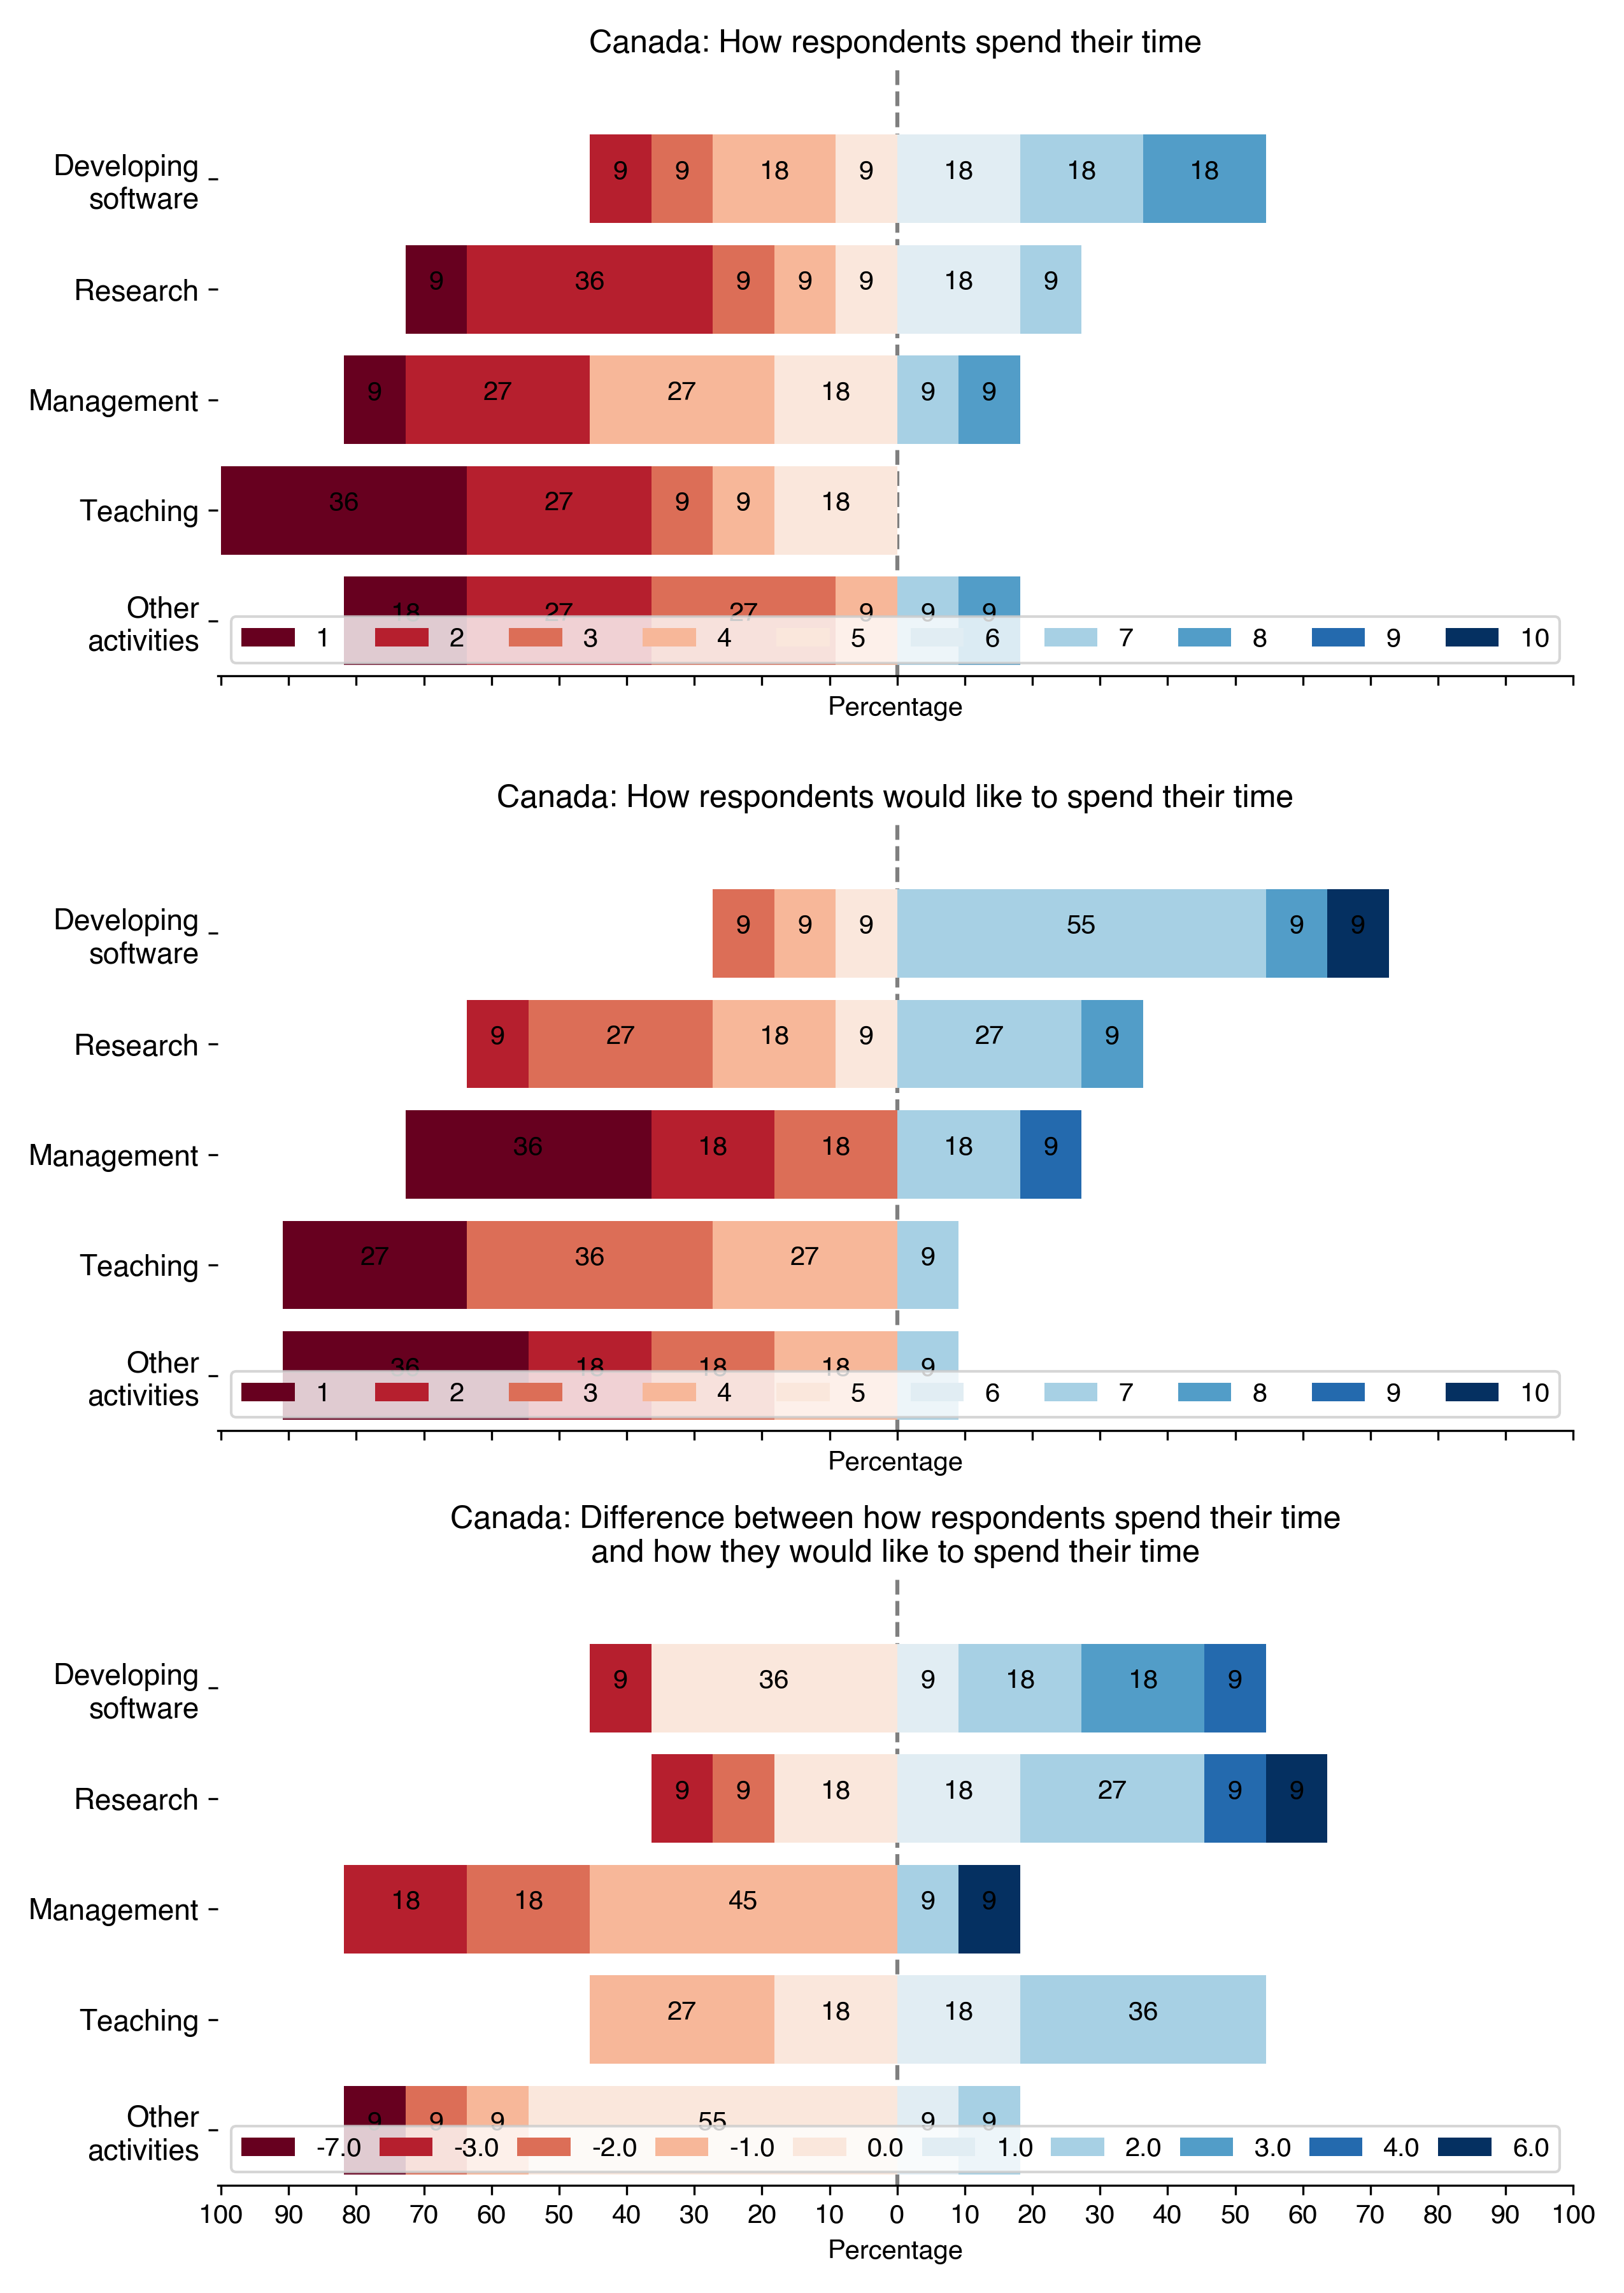
- Canada
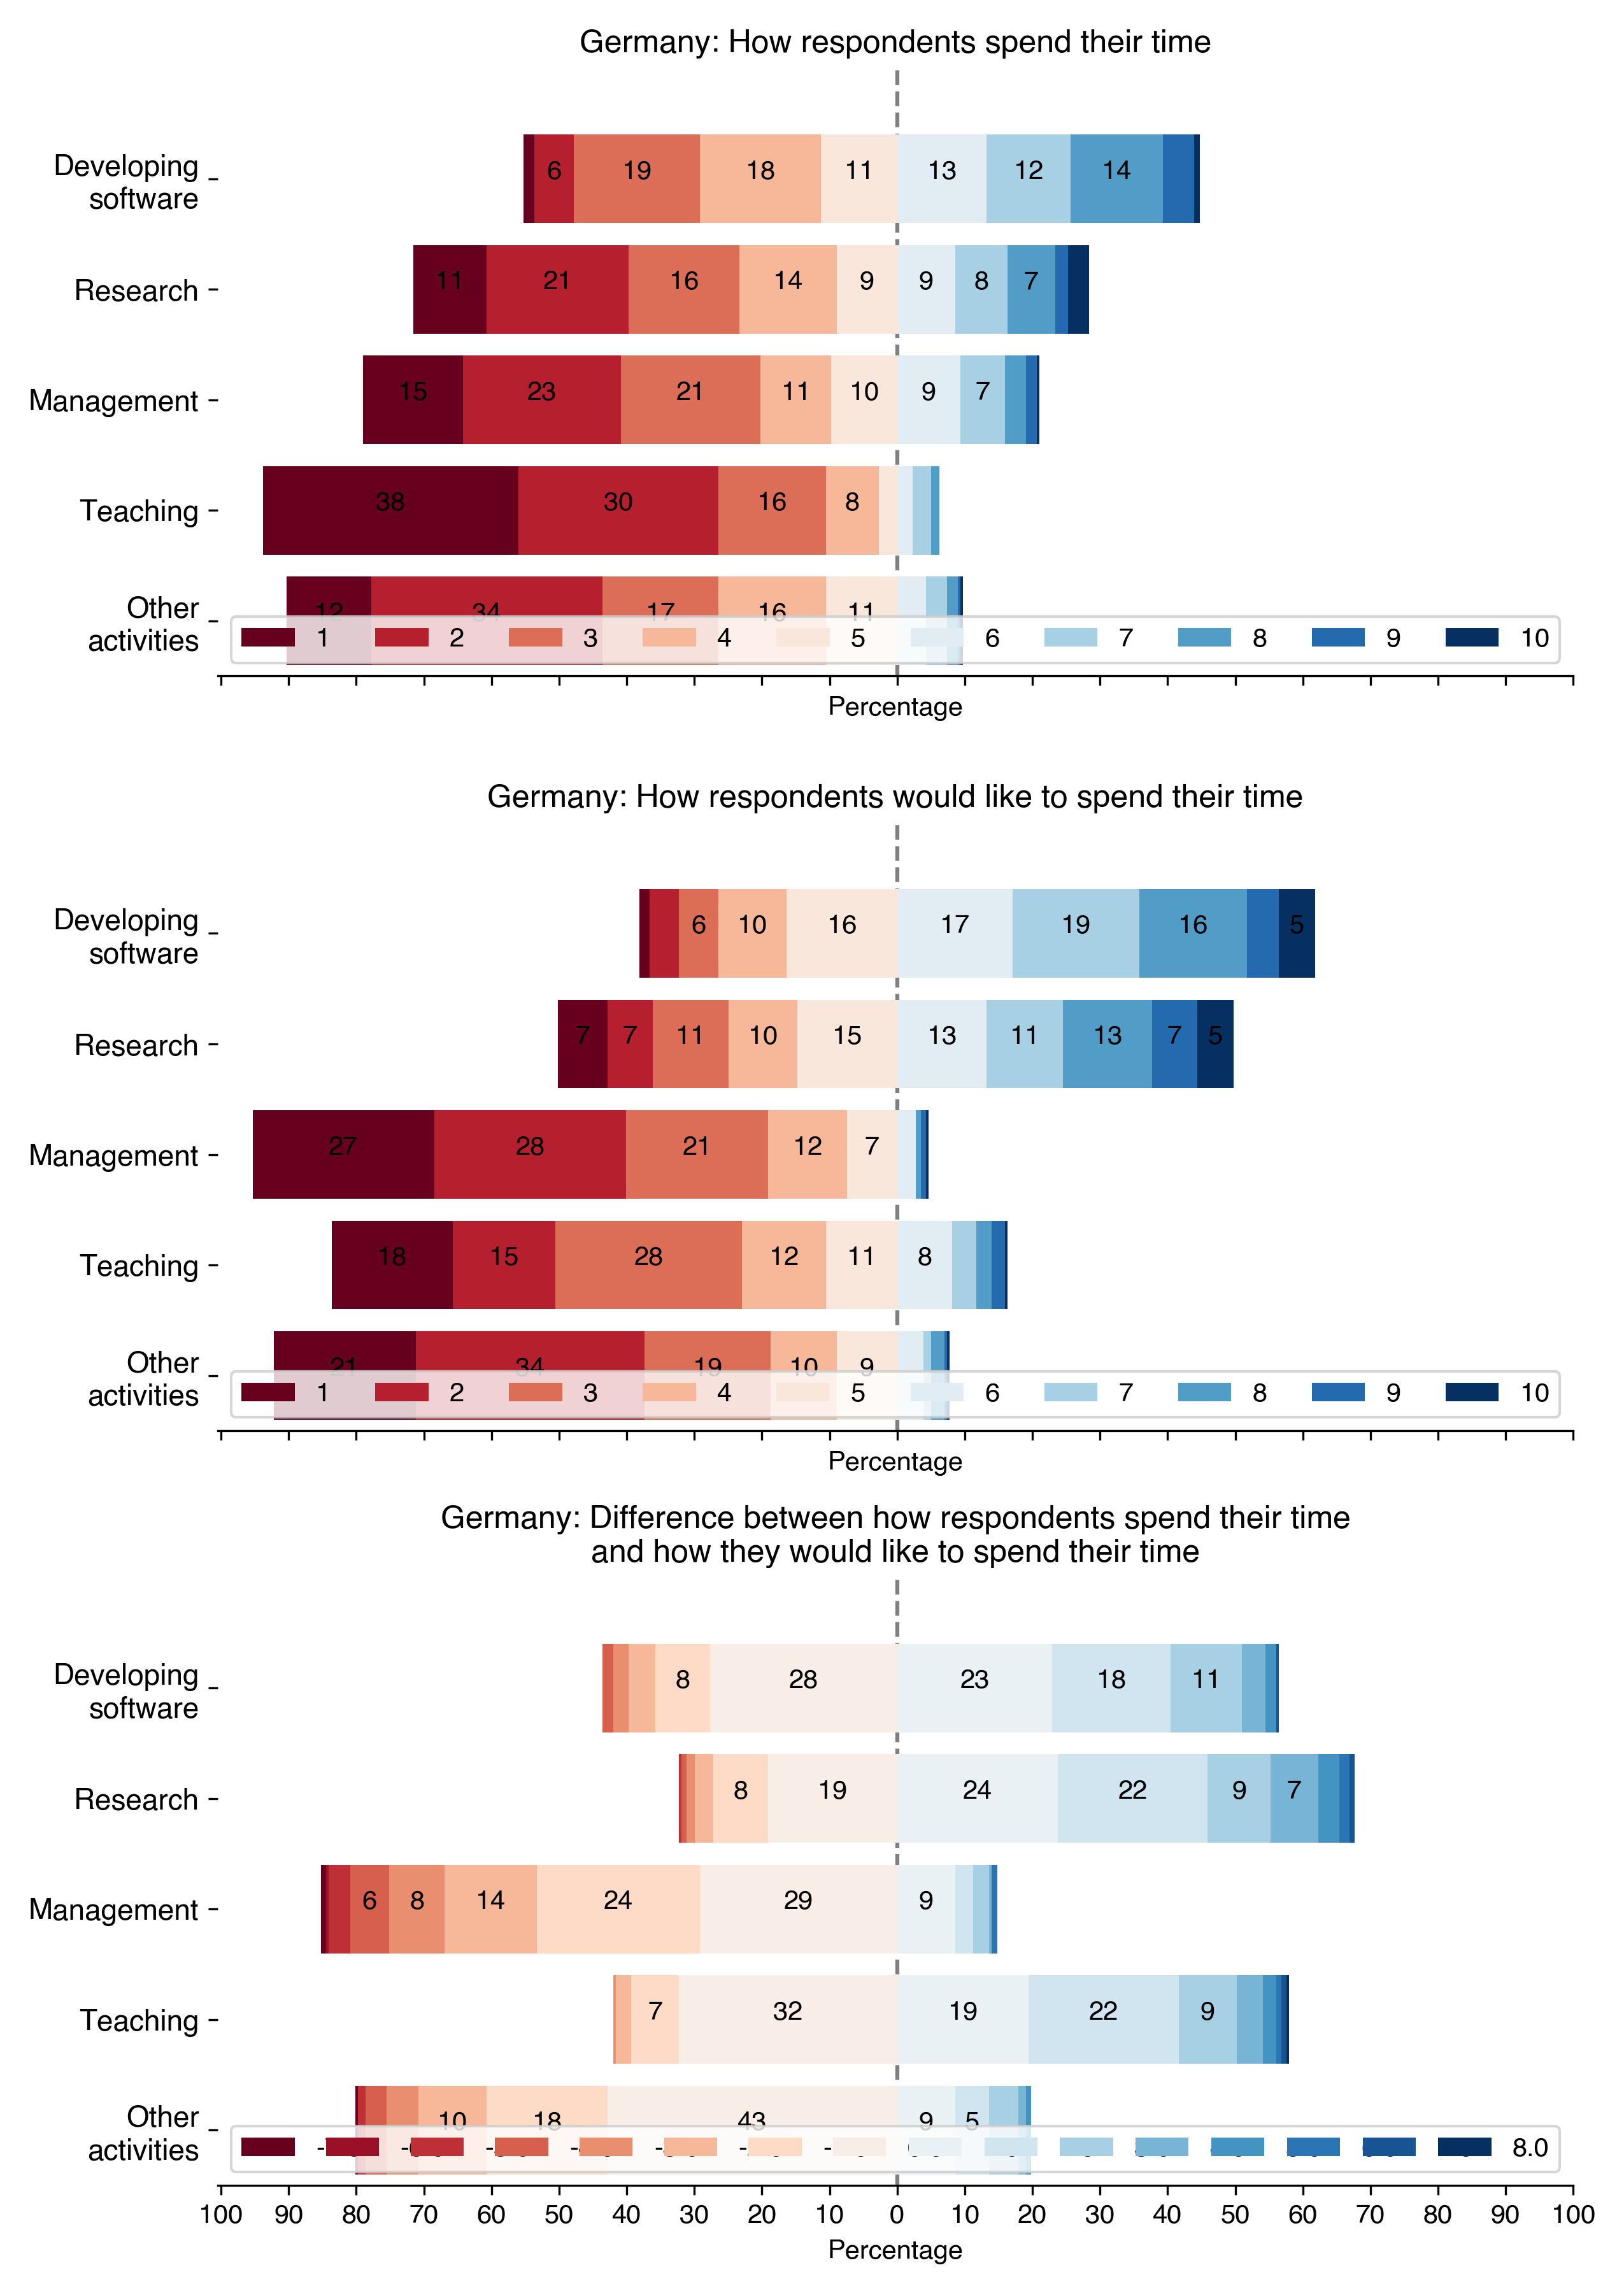
- Germany
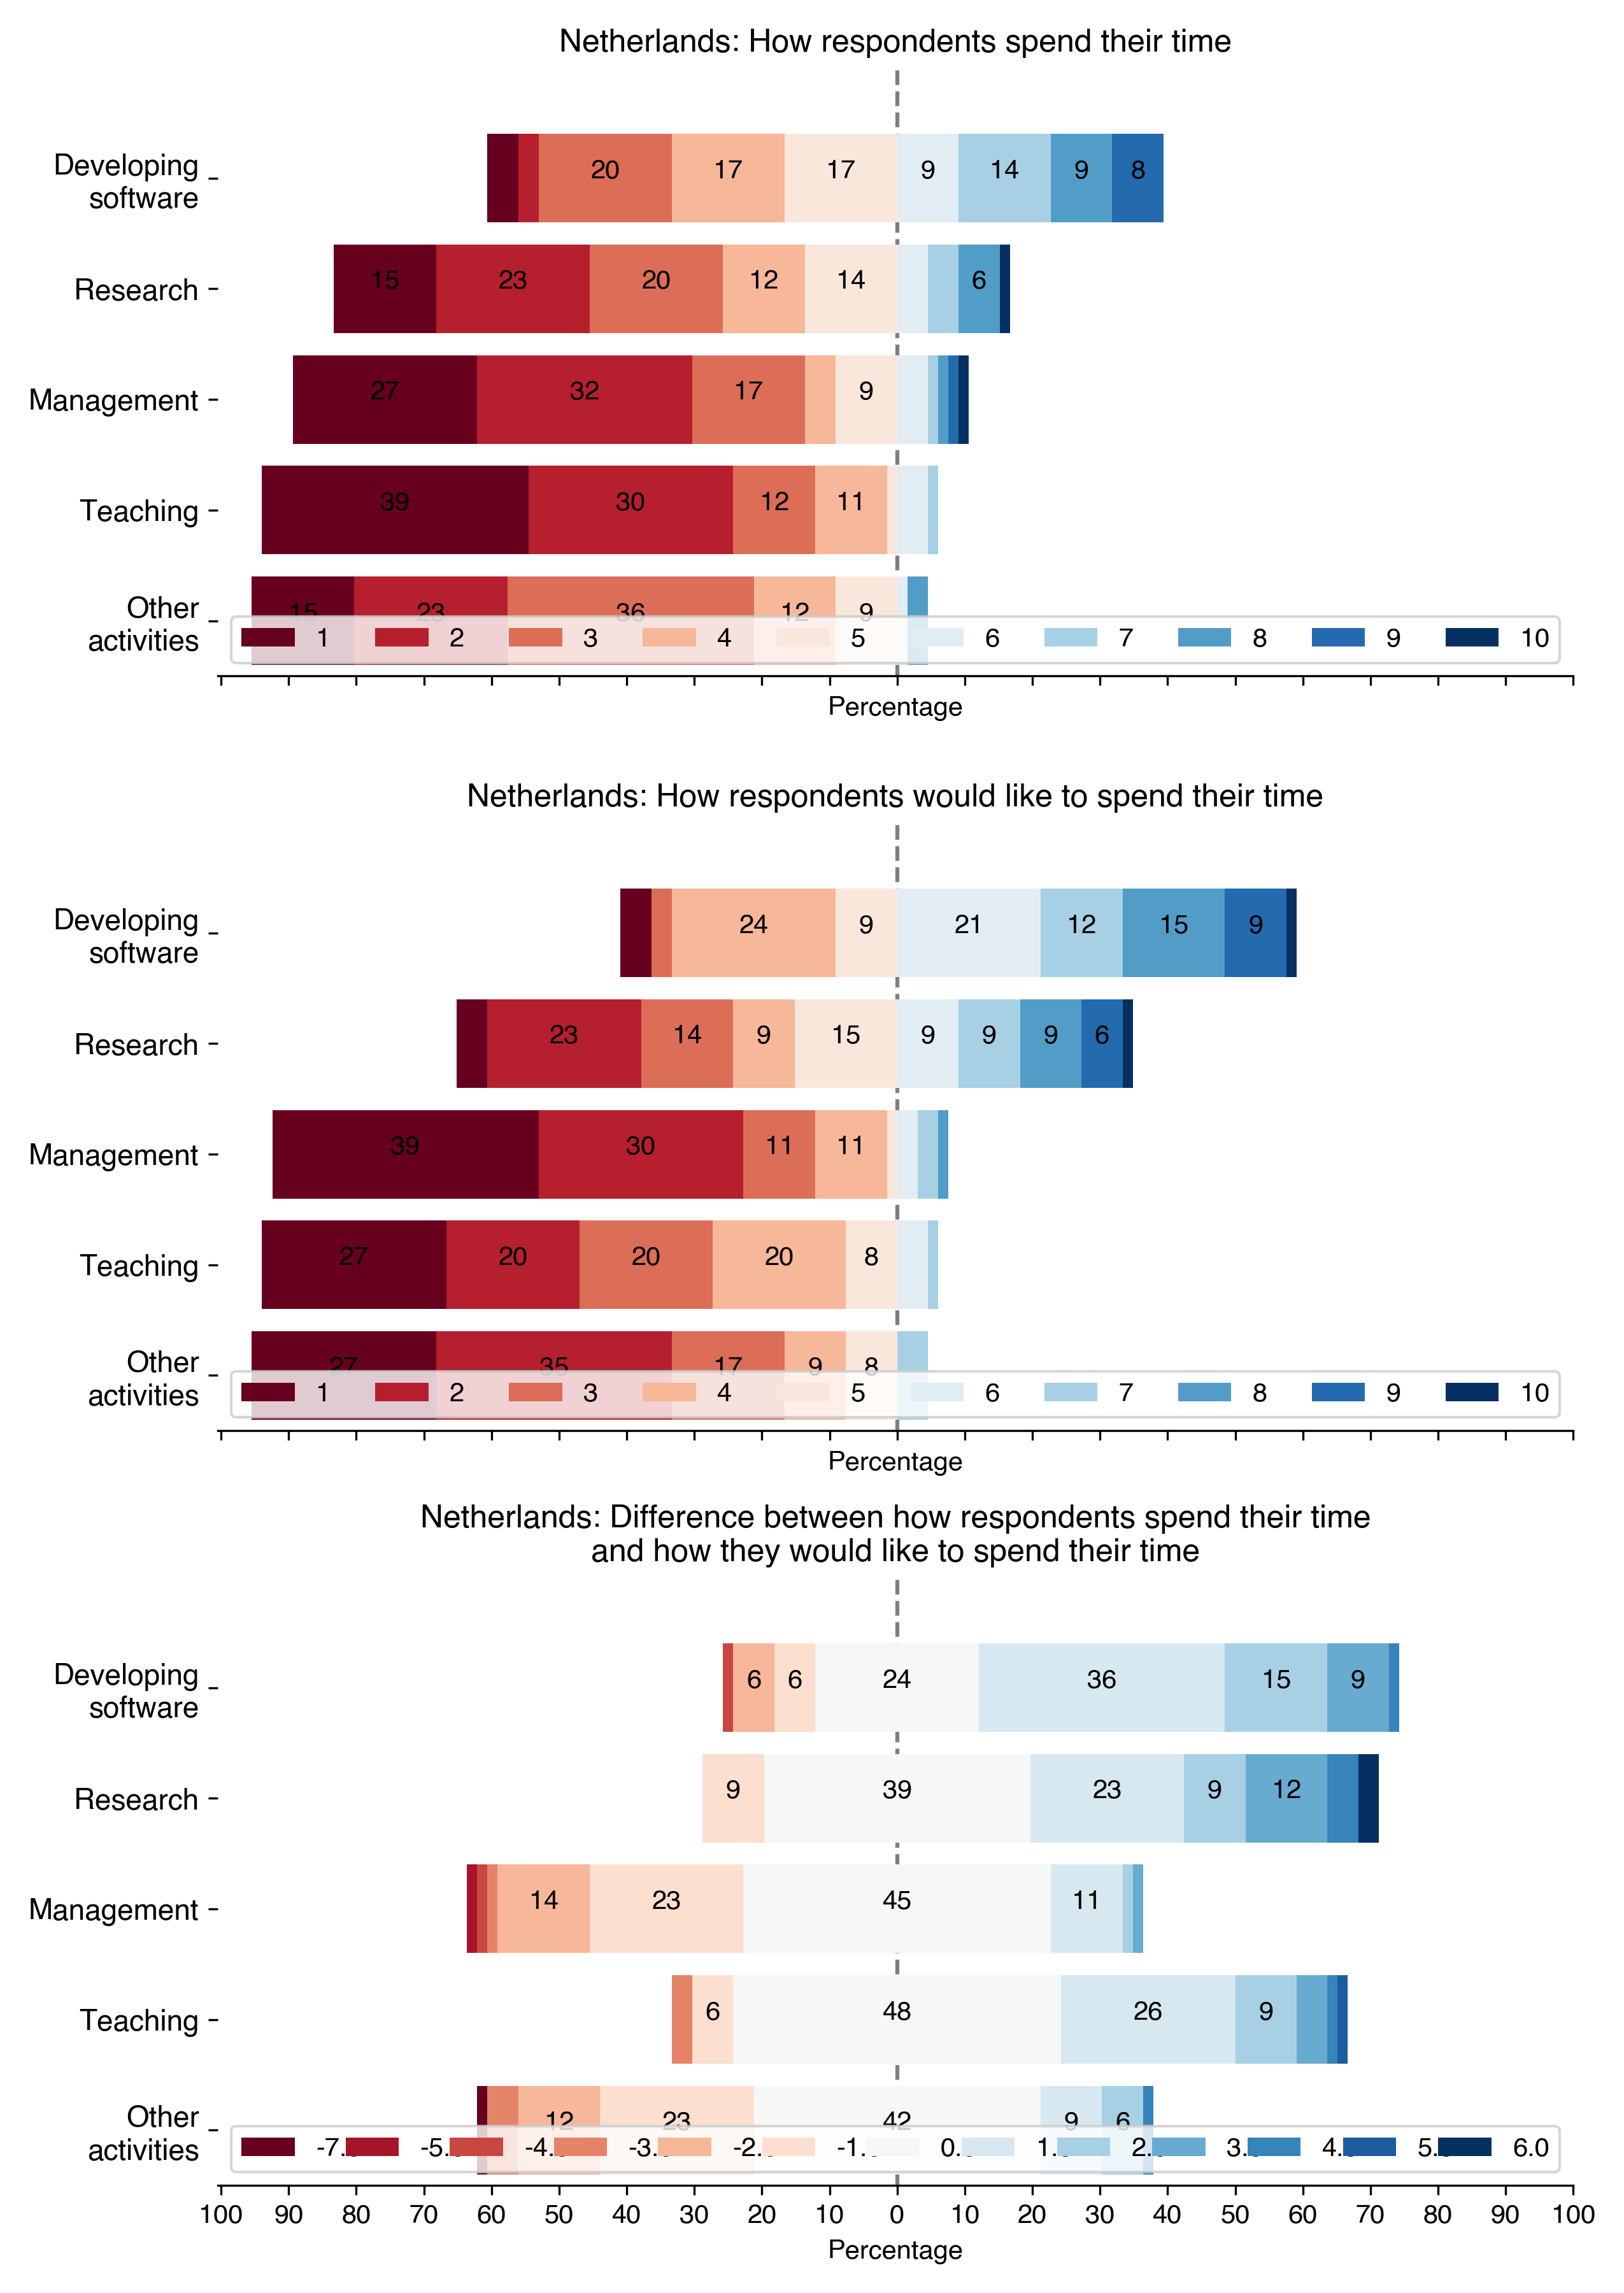
- Netherlands
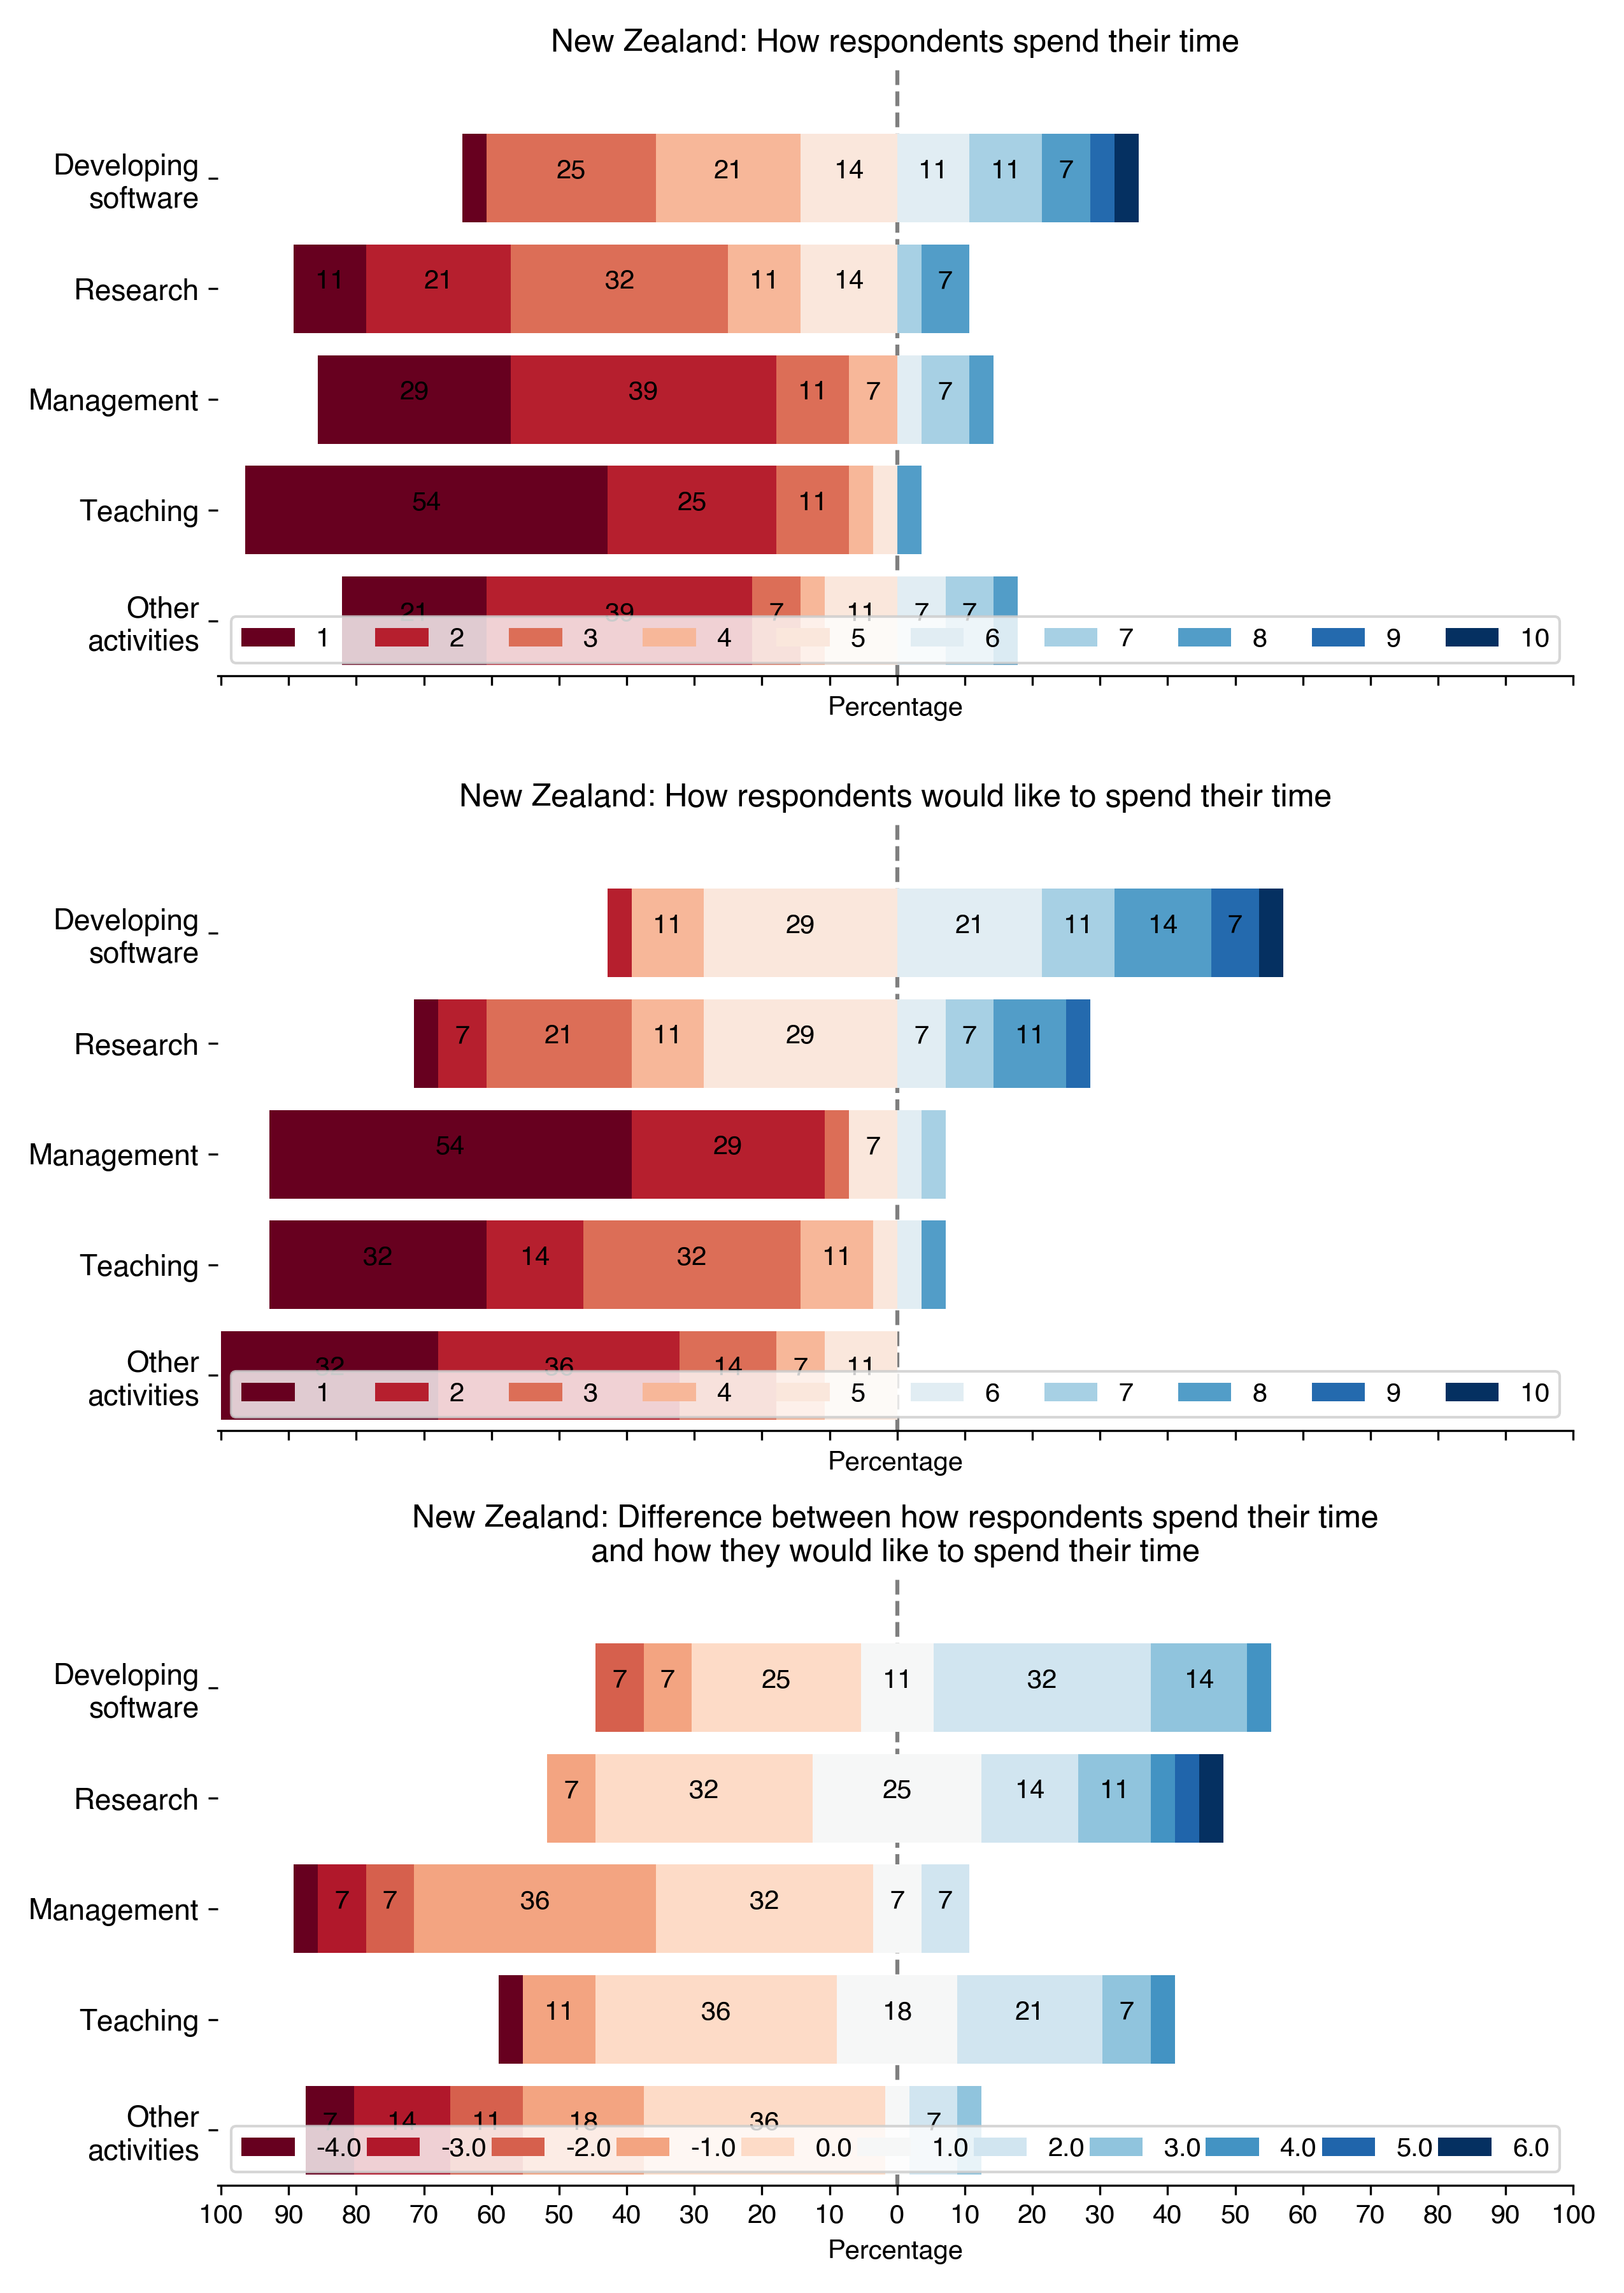
- New Zealand
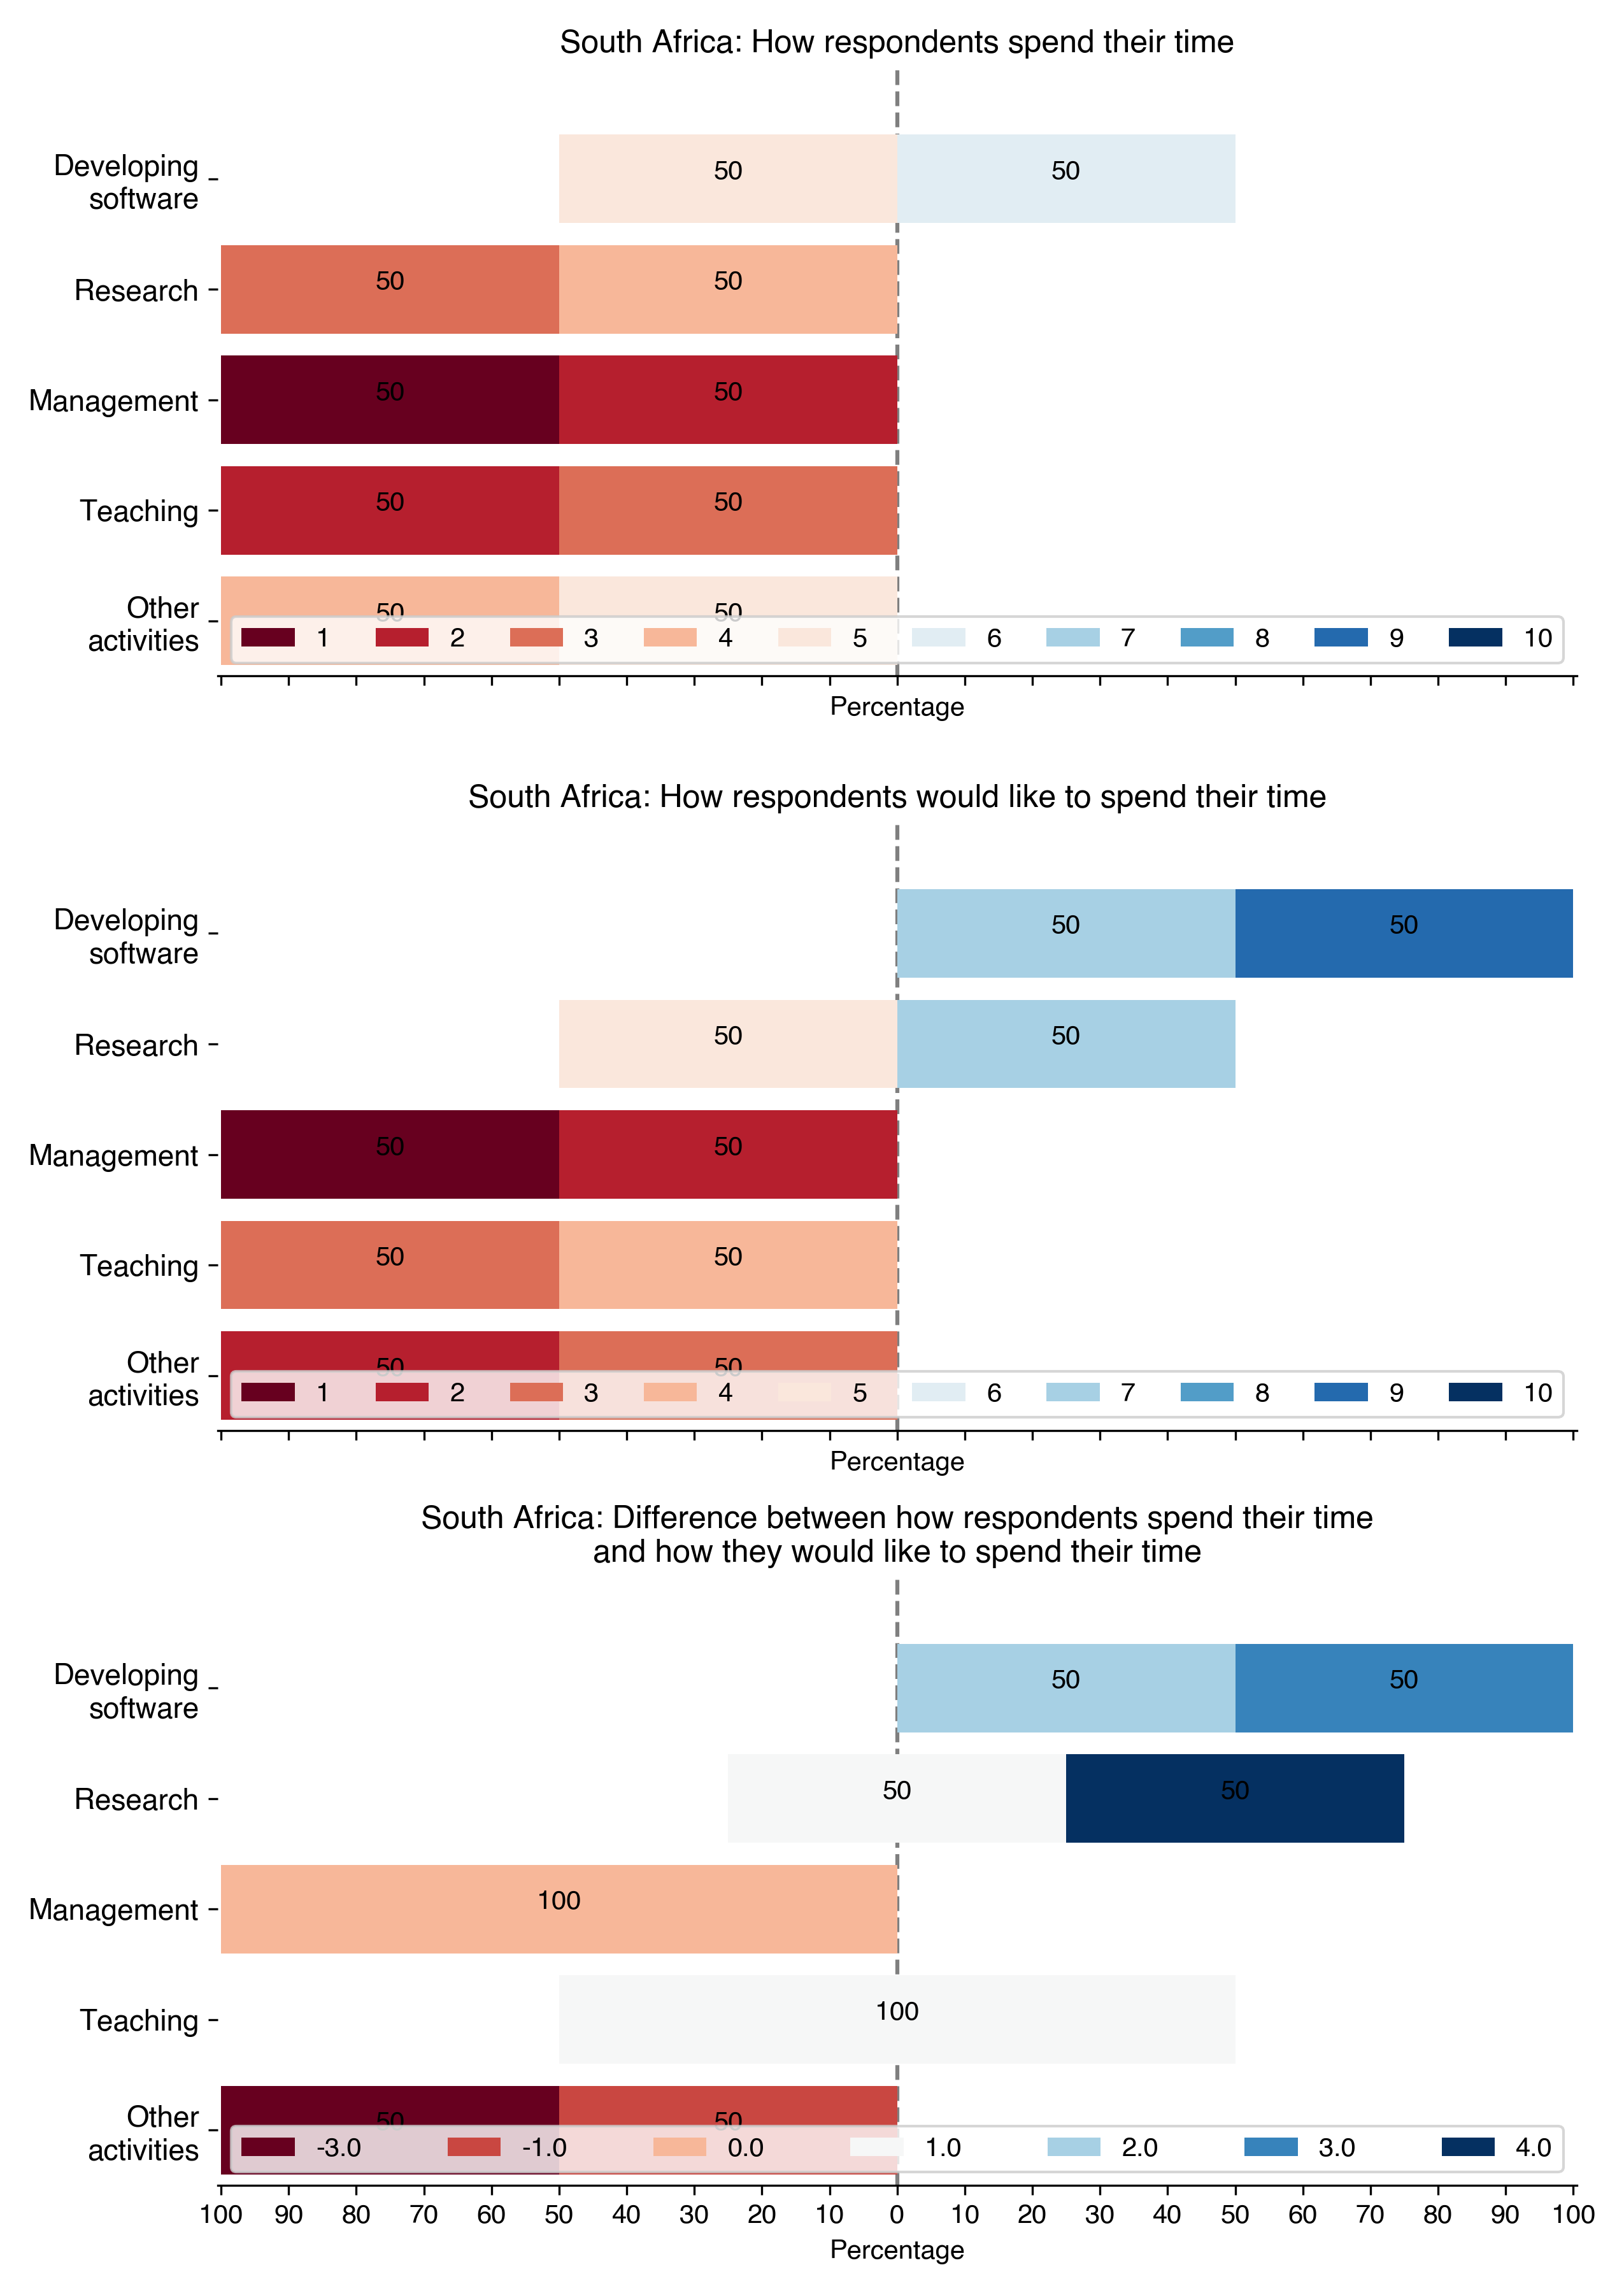
- South Africa
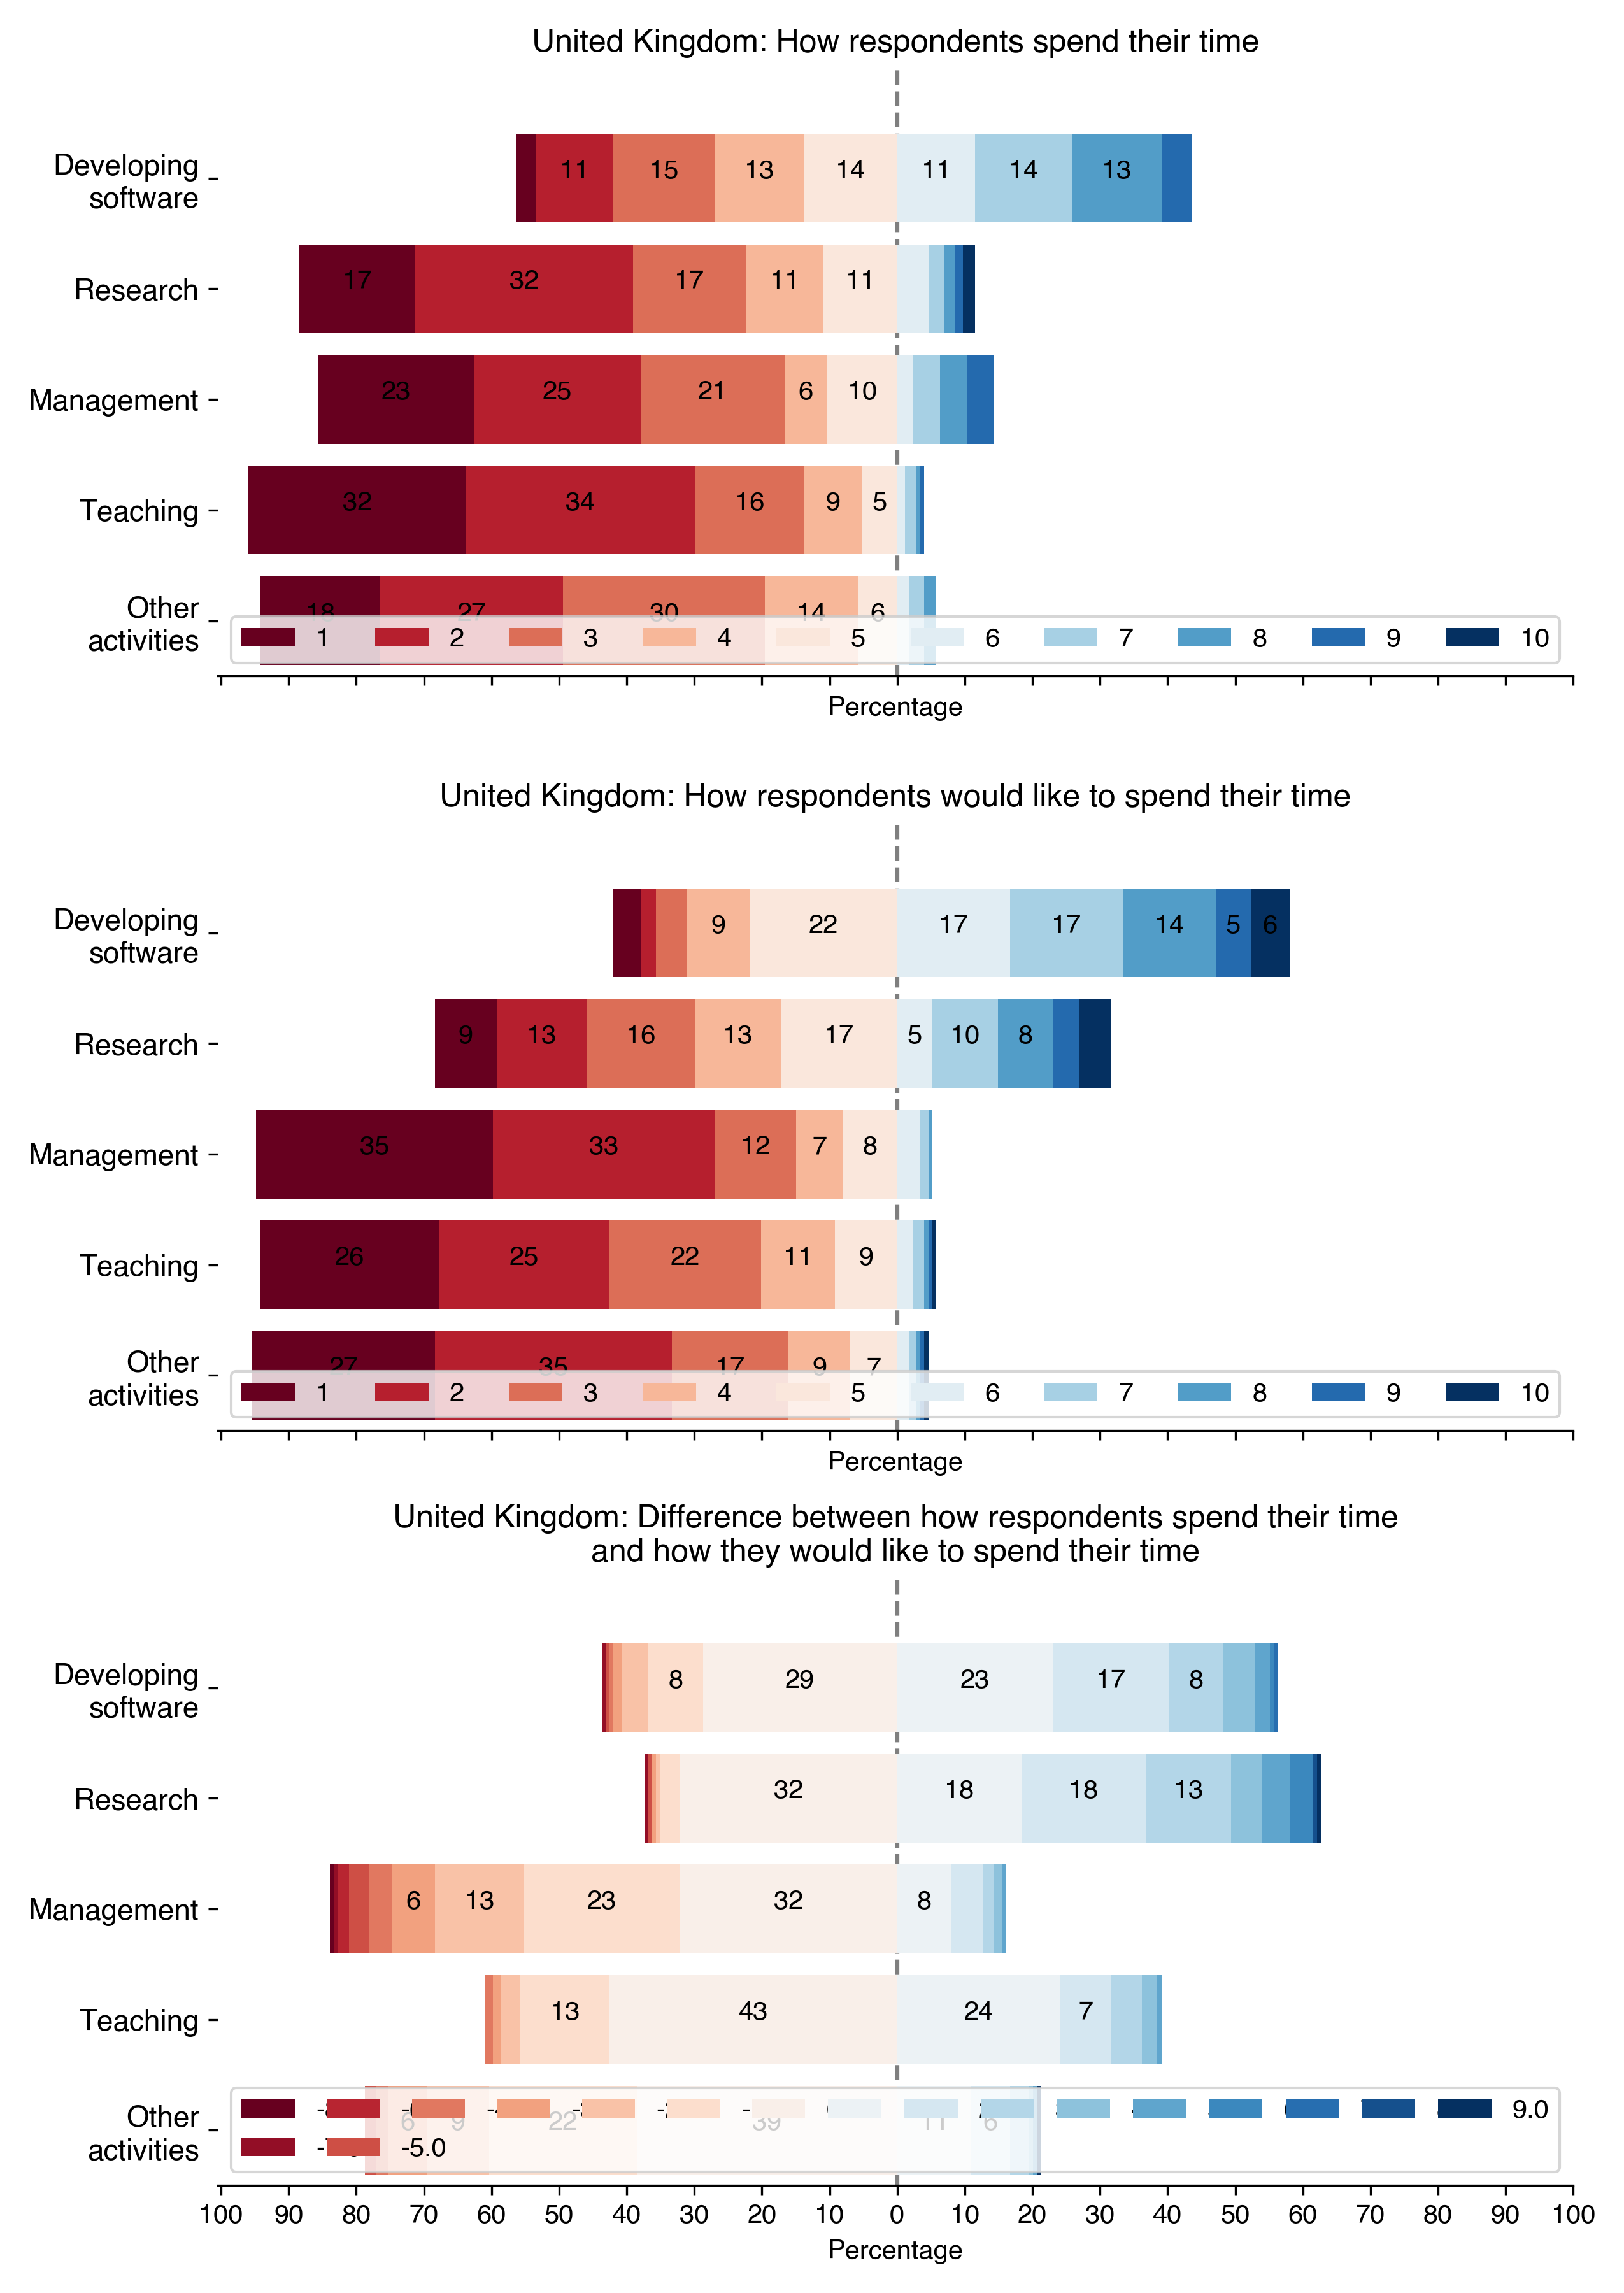
- United Kingdom
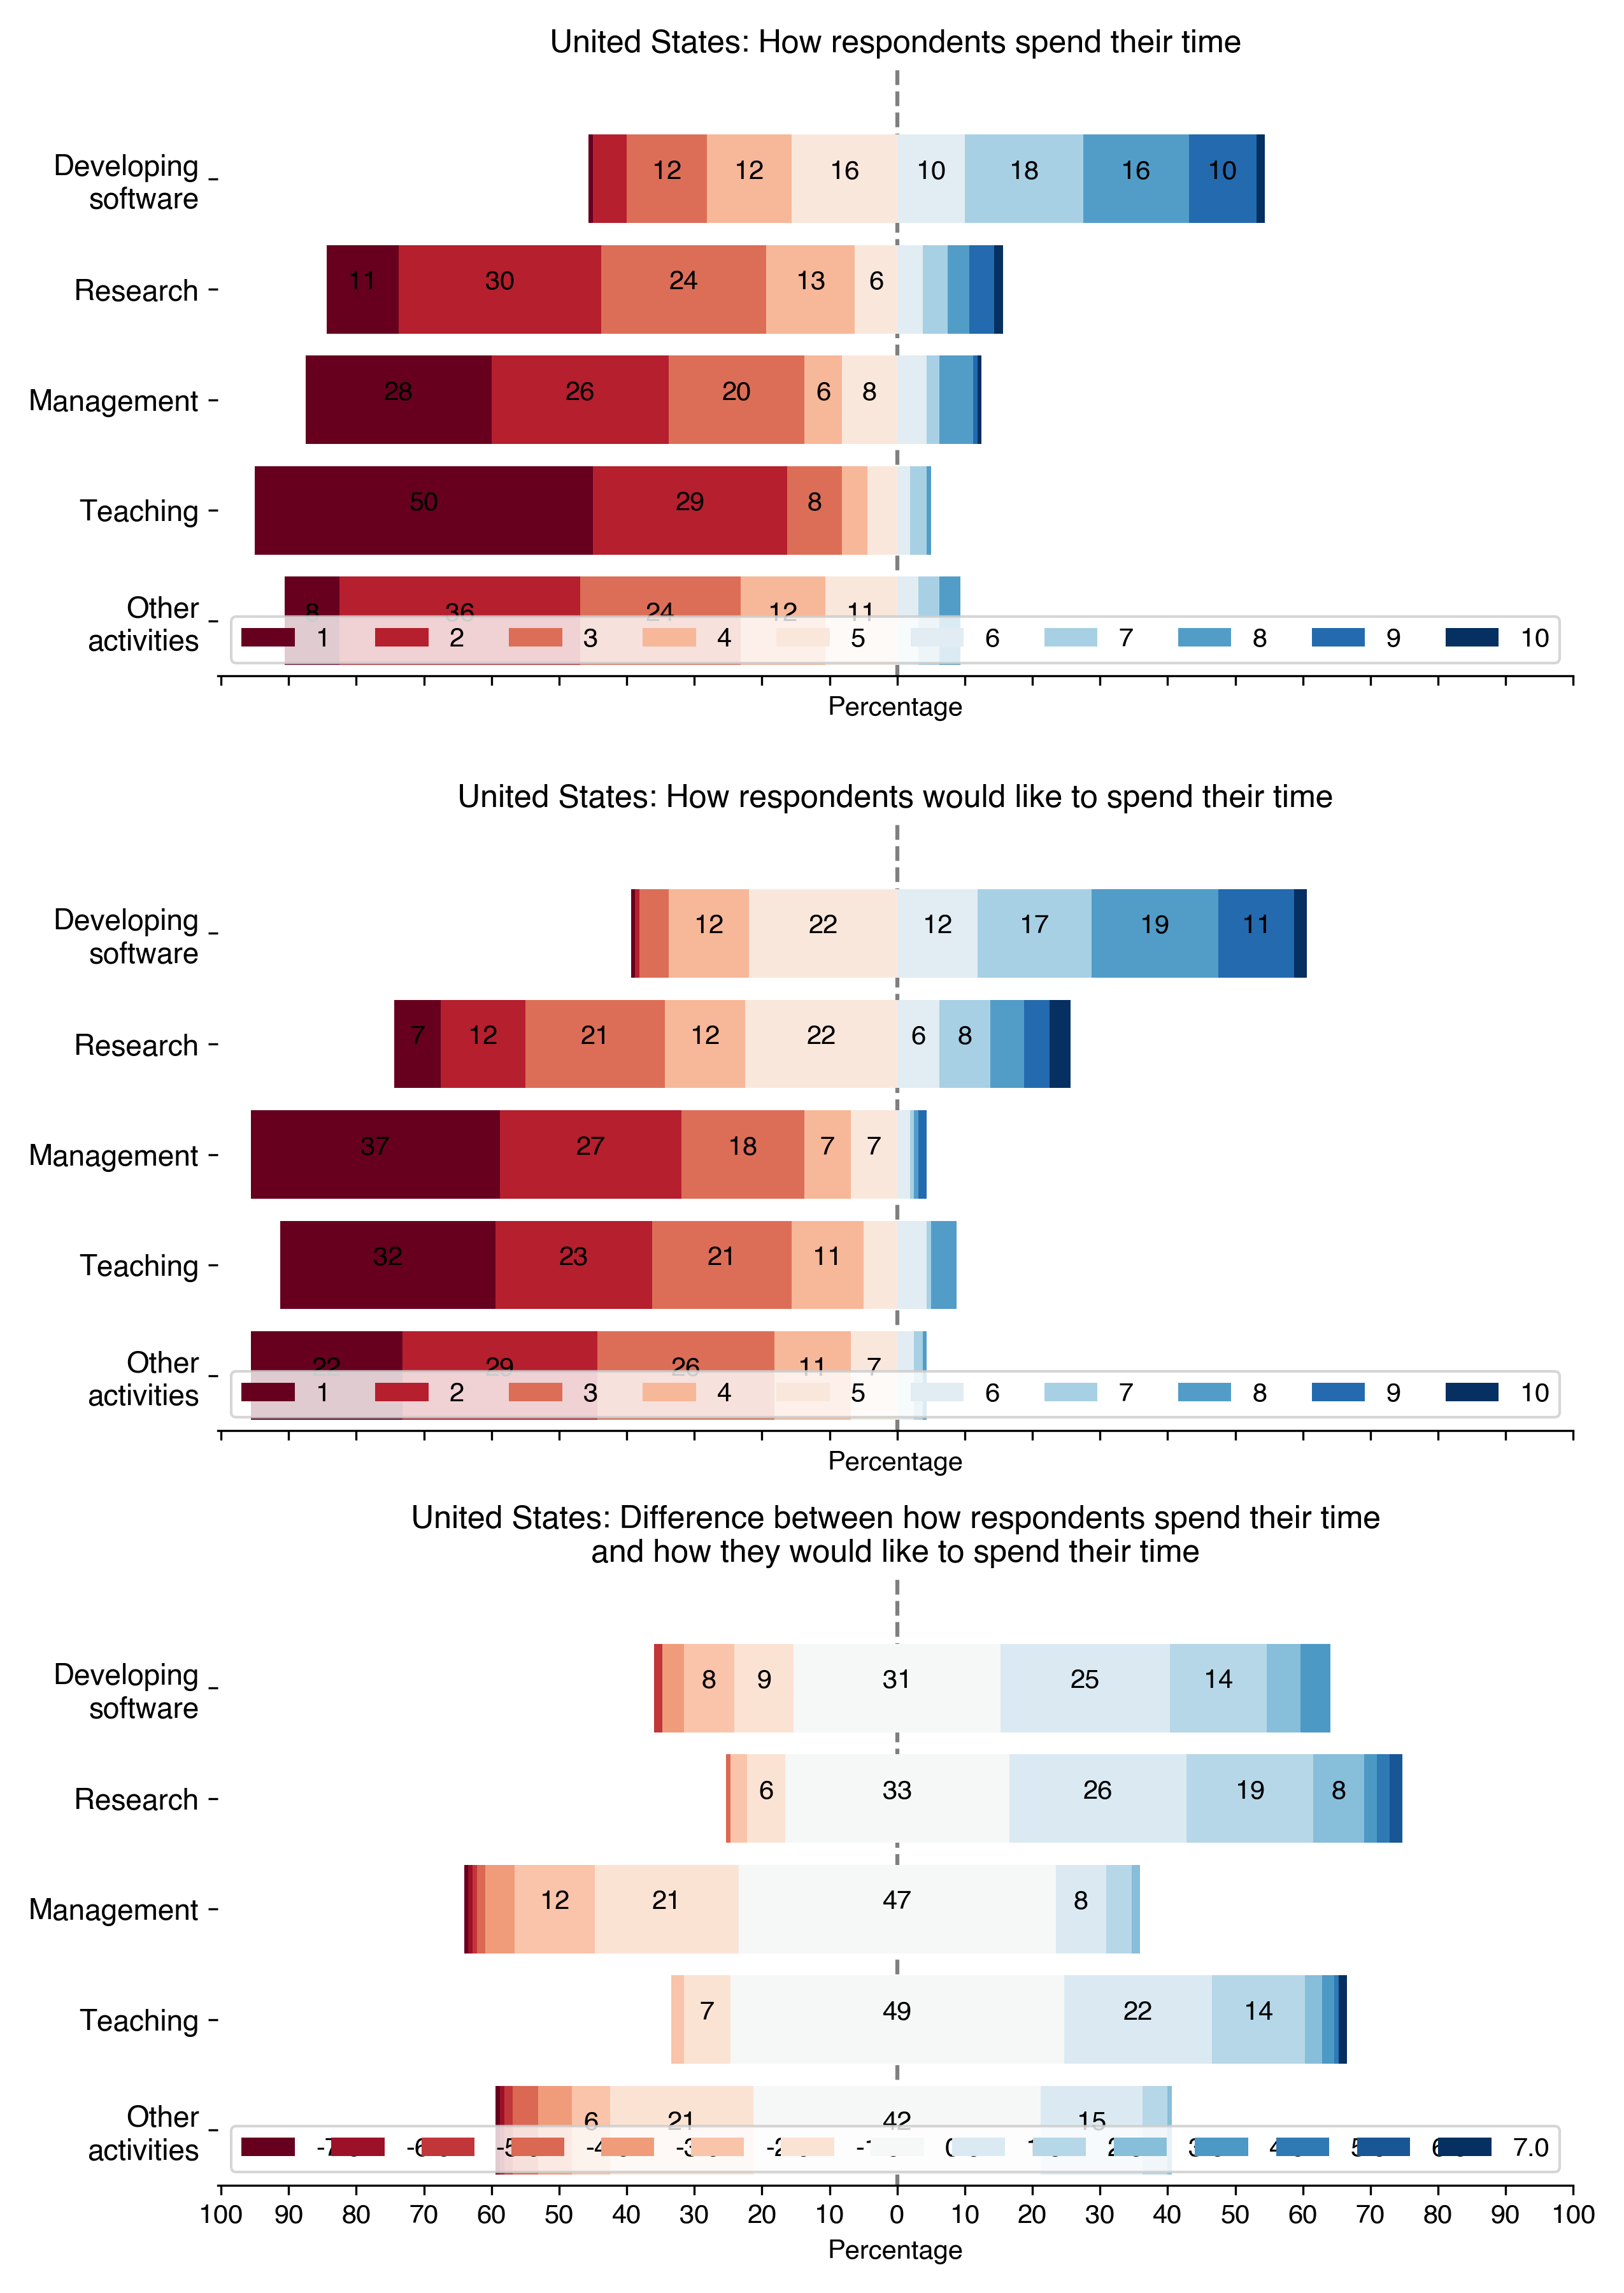
- United States
- World
RSE/RSE are supposed to be an hybrid role, compared to pure software developer. They bring a knowledge from their field but also are developing software. To capture this different tasks they may do during their work, we asked them how they spend their time but also how they wish to spend their time to investigate any difference between what they do and what they want to do.
How to read the plots
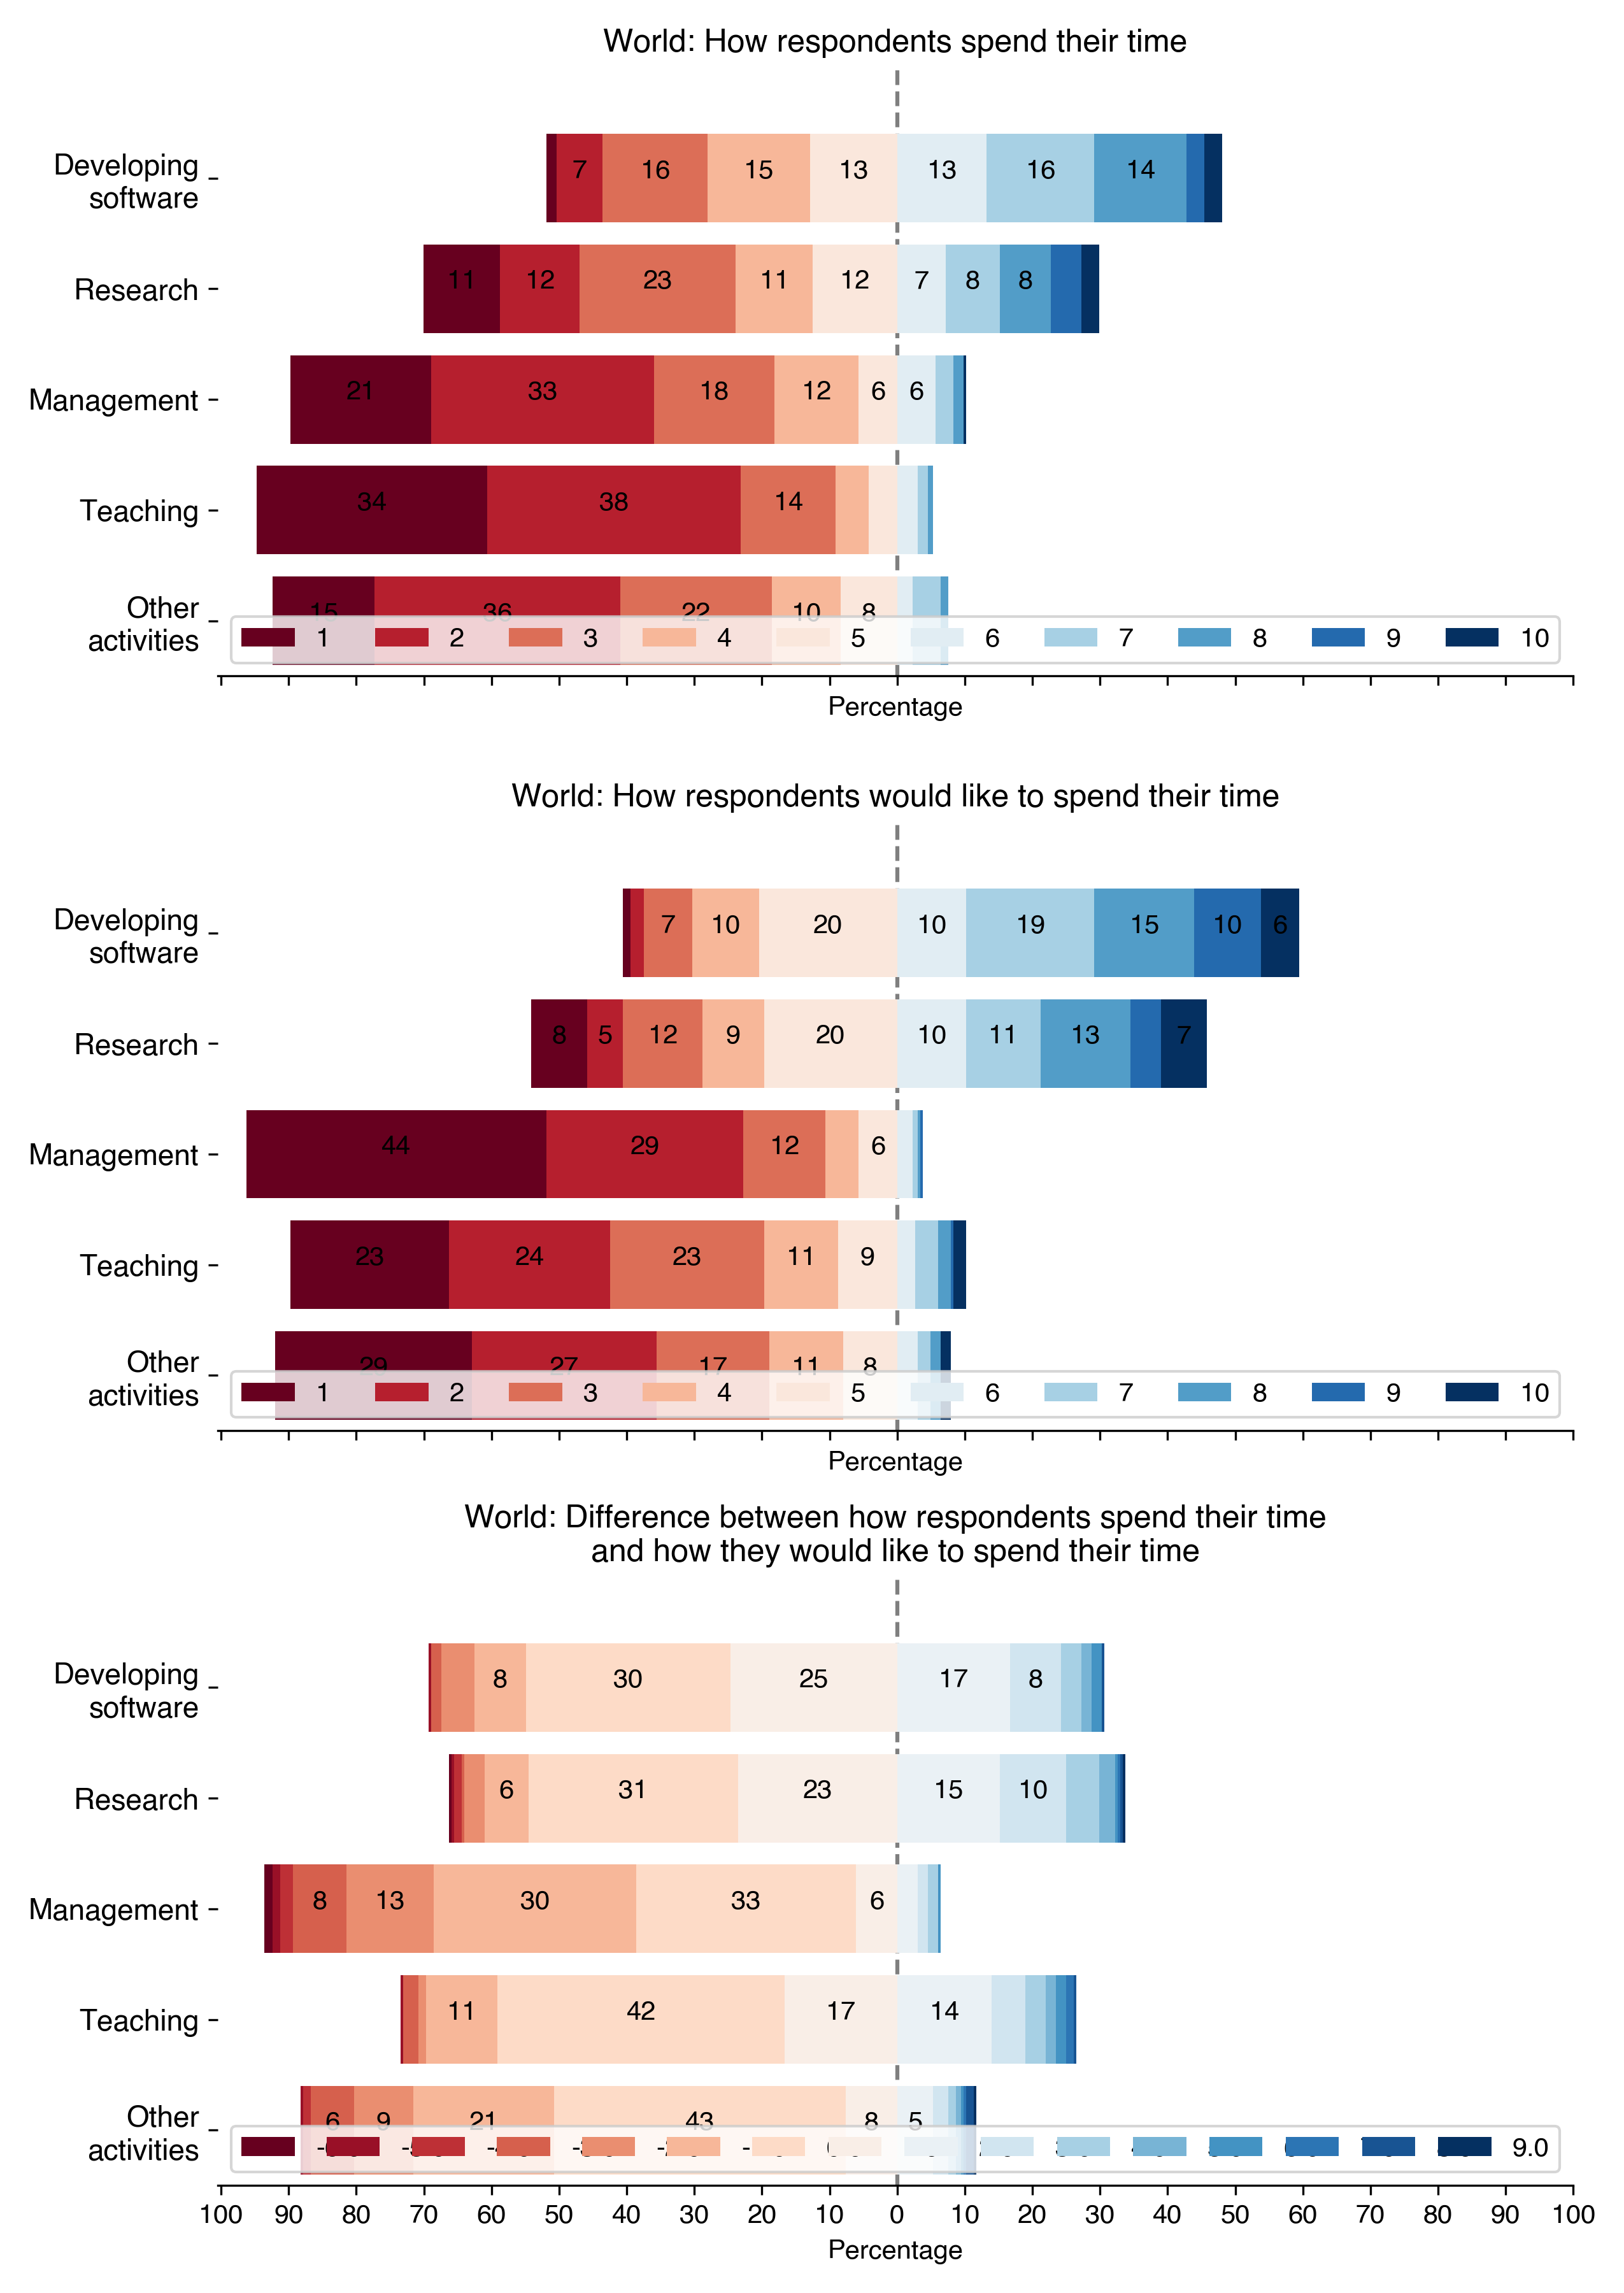
Respondents were asked how much time is spent in a particular activity using a Likert scale from from 1 (None at all) to 10 (All my time).
The same questions asked them how much time they wanted to spend on these activities. With that it was possible to see if discrepancies exist between what they actually do and what they want to do.
To read the results, when the bars shift to the right (in blue), it means they reported positive values (from 6 to 10); when the bars are on the left (in red), it means they reported more negative values (relative to the scale). Each bar has a number that represents the percentage of participants that selected that value. The total bar represents 100%.
To calculate the difference between what they want and what they do, we subtract the answers to the the time that they wished to have spent from the the answer to actual time spent. It is therefore possible to understand the results as:
- The result is zero: The time spent matches, they do as much as they want.
- The result is negative: They wish to spend less time to do that activity
- The result is positive: They wish to spend more time to do that activity
Questions in this section
All questions were asked on a 1 to 10 Likert scale.
- On average, how much of your time is spent developing software?
- On average, how much of your time is spent on research?
- On average, how much of your time is spent on management?
- On average, how much of your time is spent on teaching?
- On average, how much of your time is spent on other activities?