Collaboration and training
- Australia
- Canada
- Germany
- Netherlands
- New Zealand
- South Africa
- United Kingdom
- United States
- World
Questions in this section:
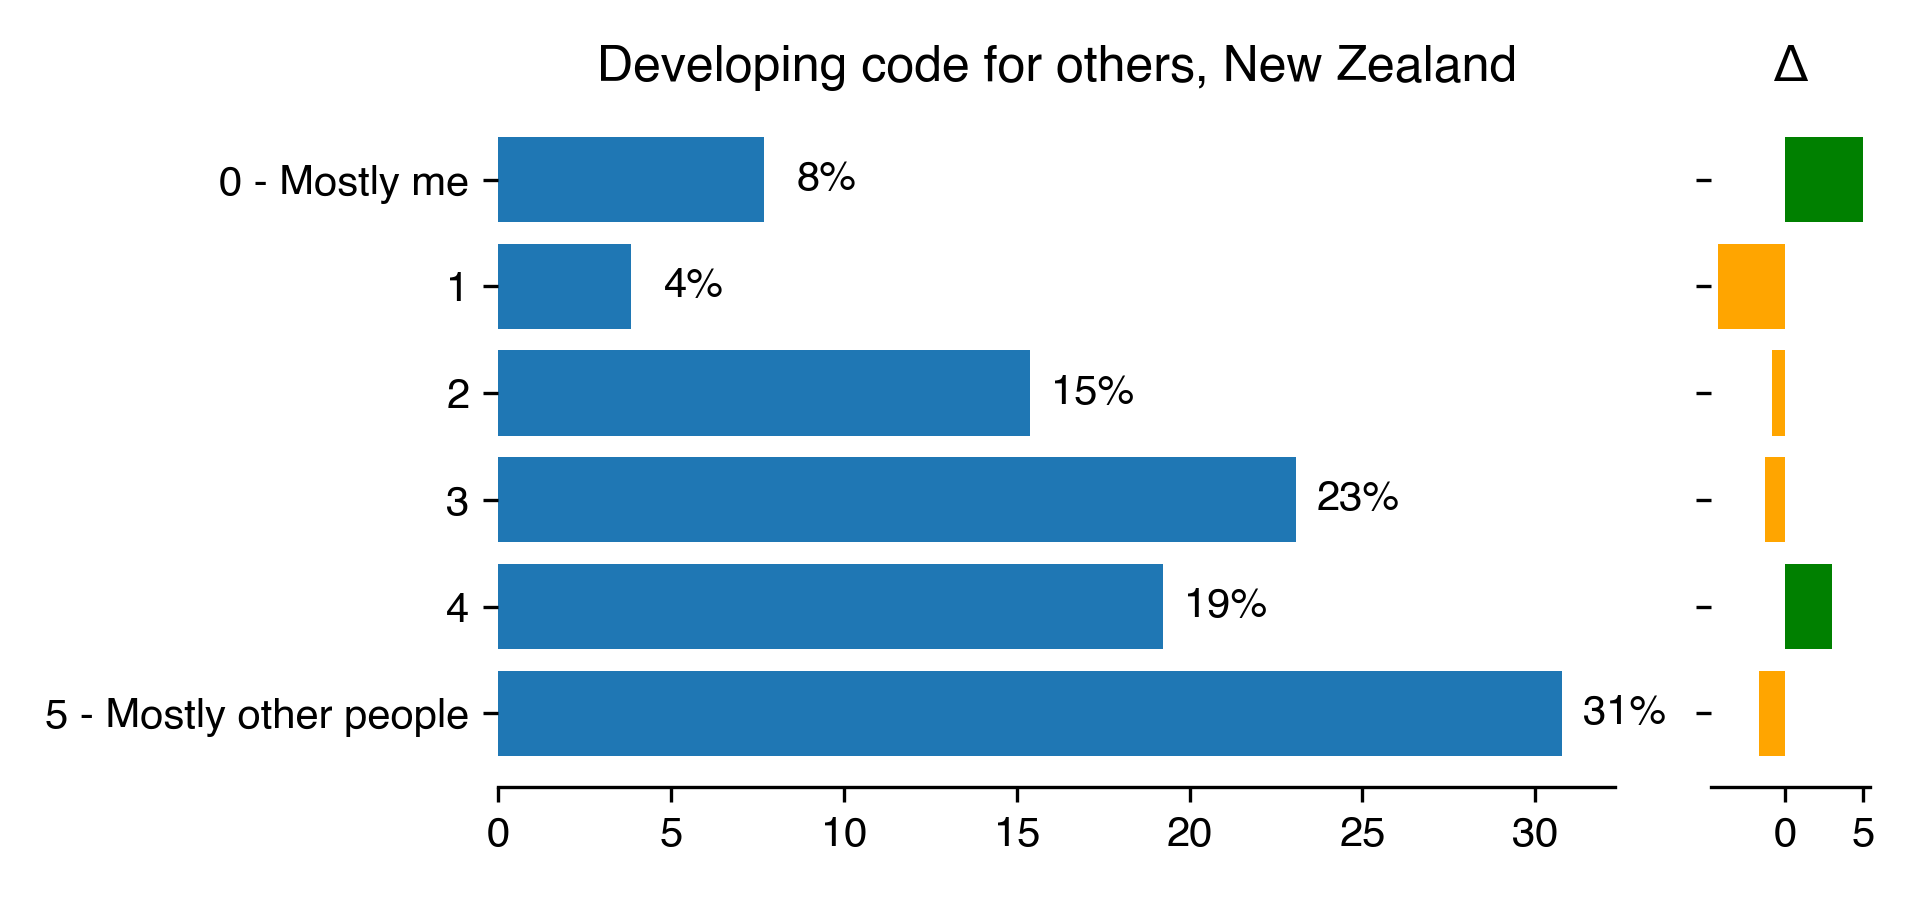
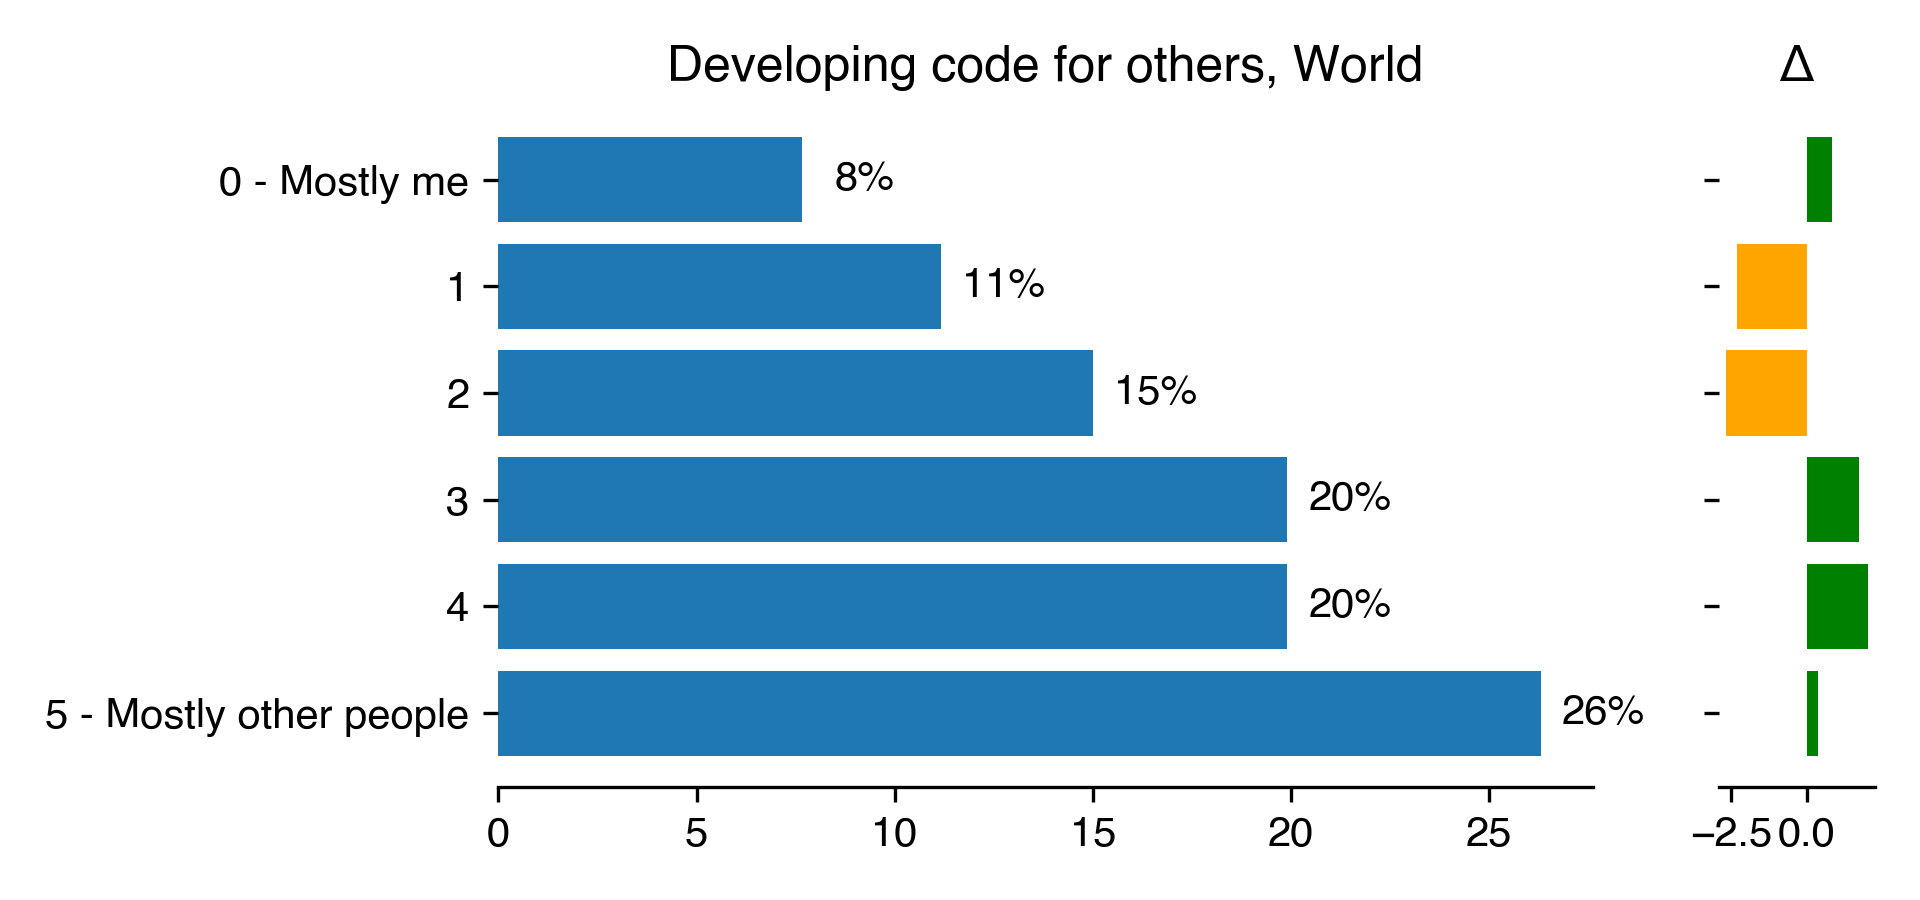
- Who uses the code that you write? (one choice)
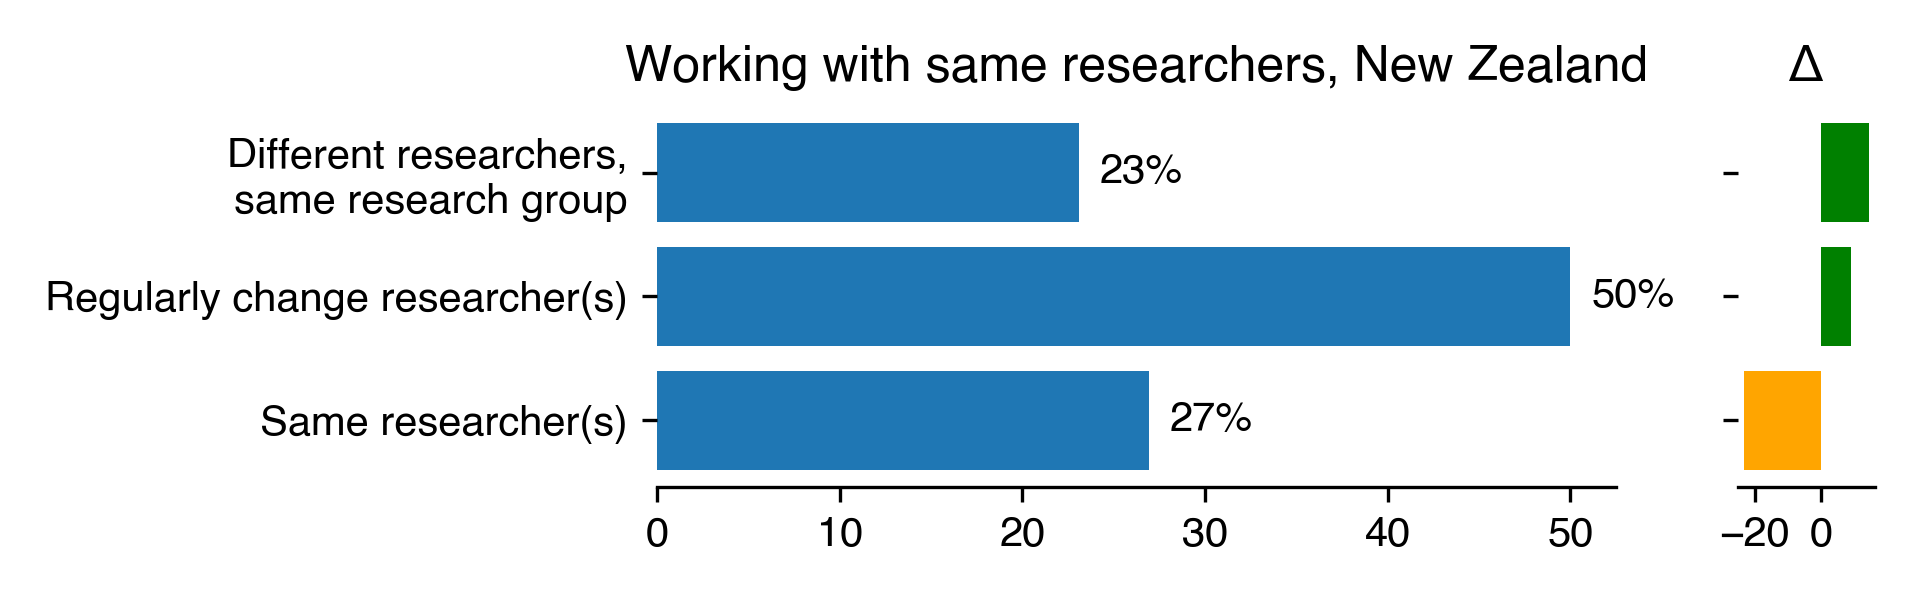
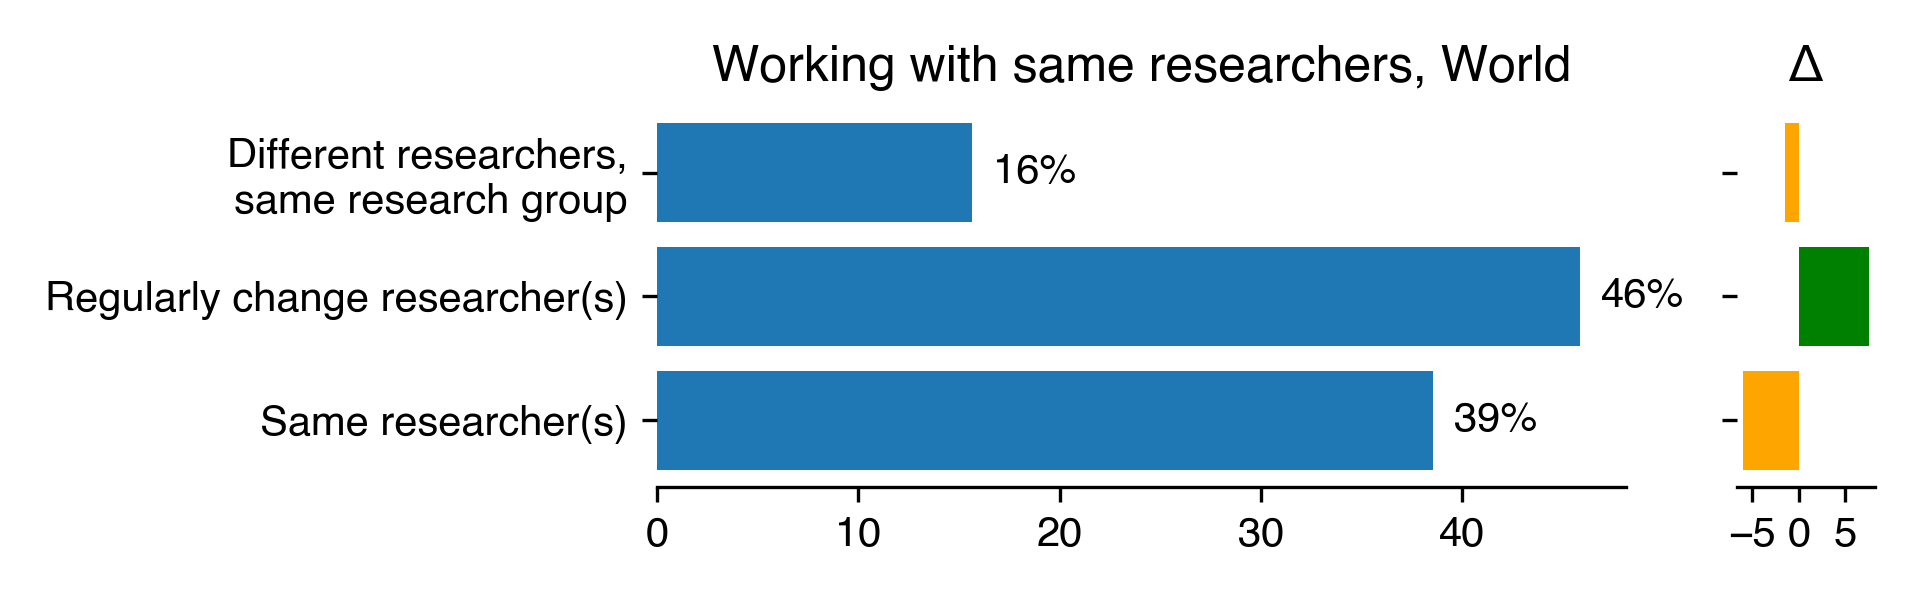
- Do you always work with the same researchers, or do you regularly change the
- Do you always work with the same researchers, or do you regularly change the
researchers you work with? (one choice)
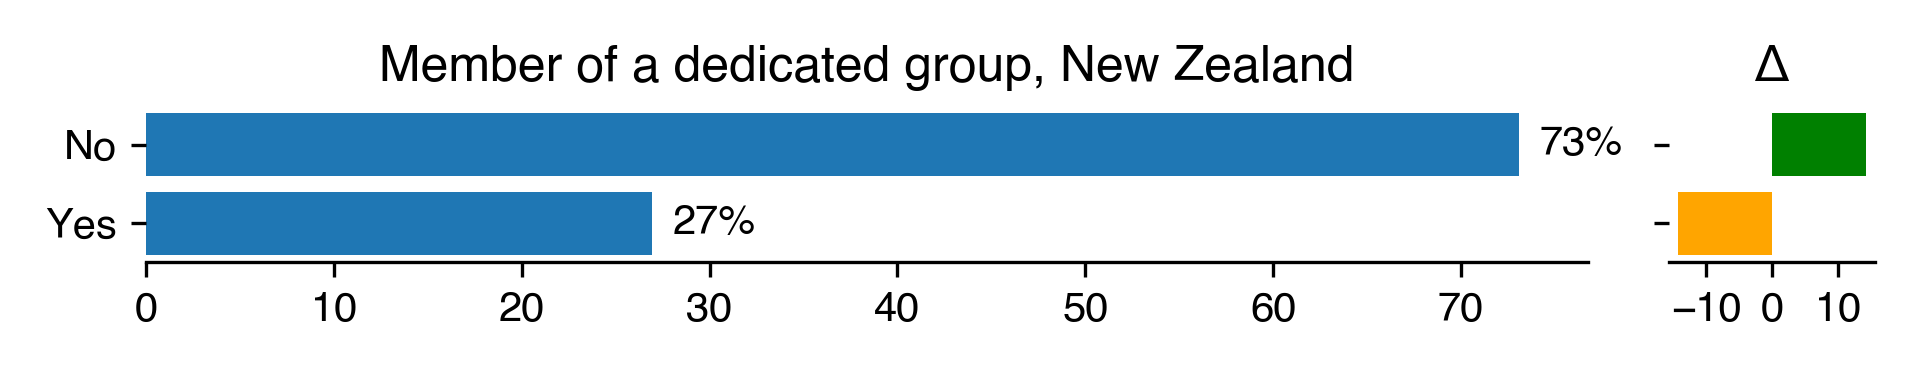
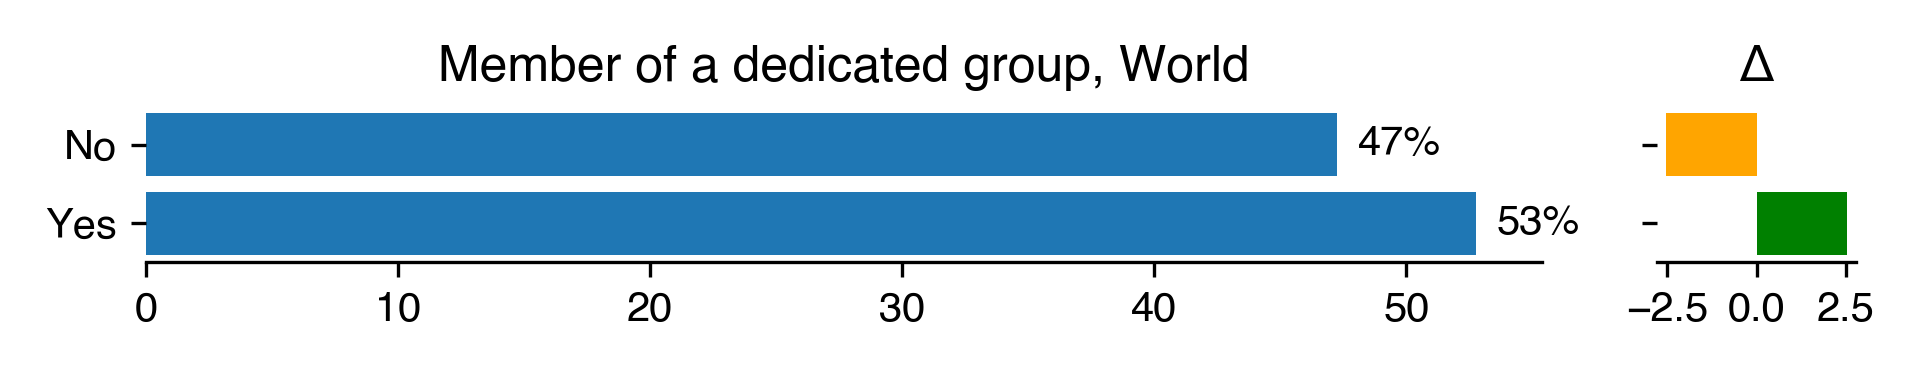
- Are you part of a dedicated research software group within your institution?
(yes-no)
- How many software projects are you currently involved in? (numeric)
- How many people who develop software typically work on your projects? (numeric)
- On average, how many times a year do you take part in providing training?
(numeric)
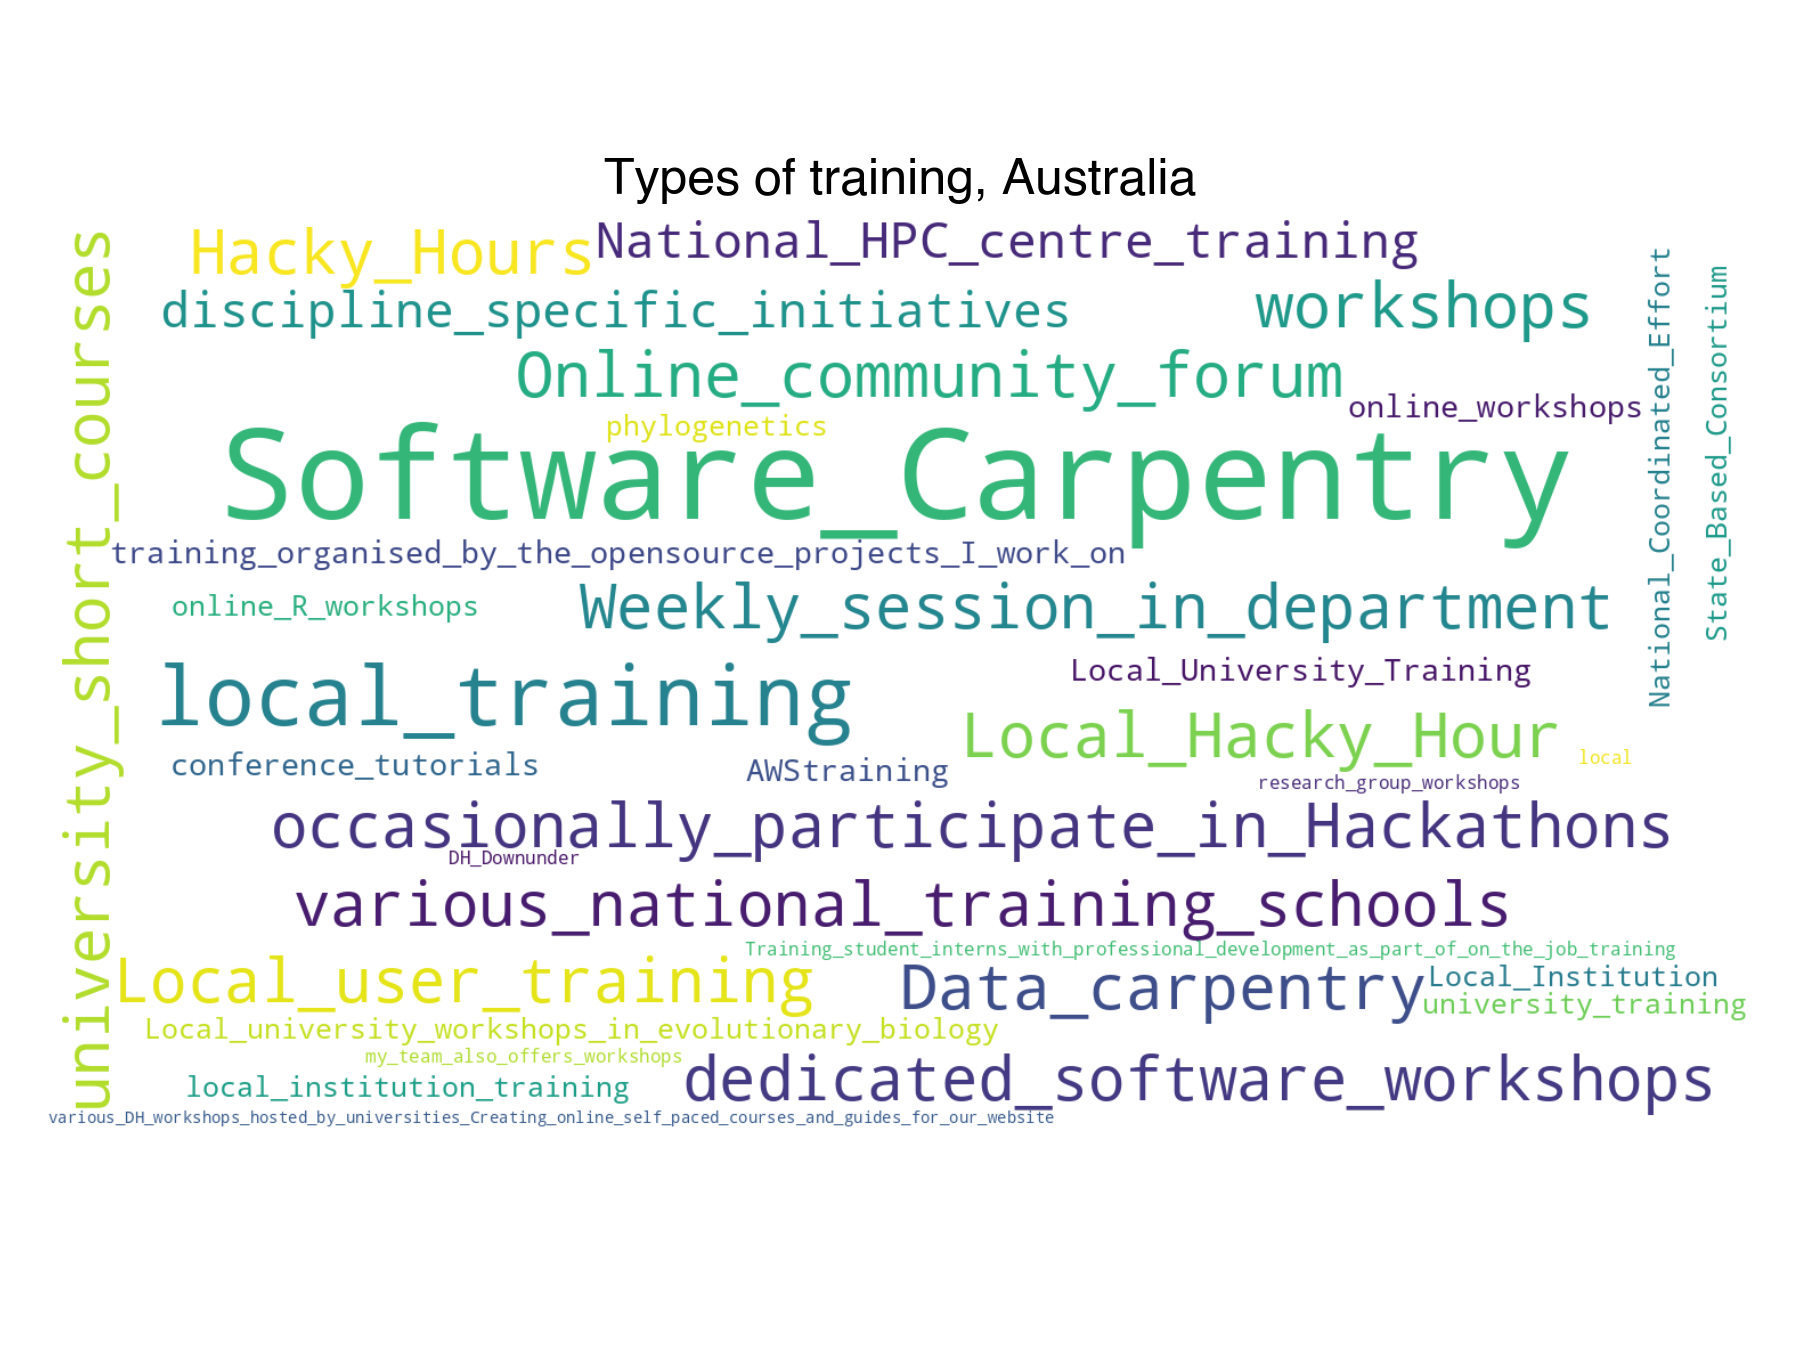
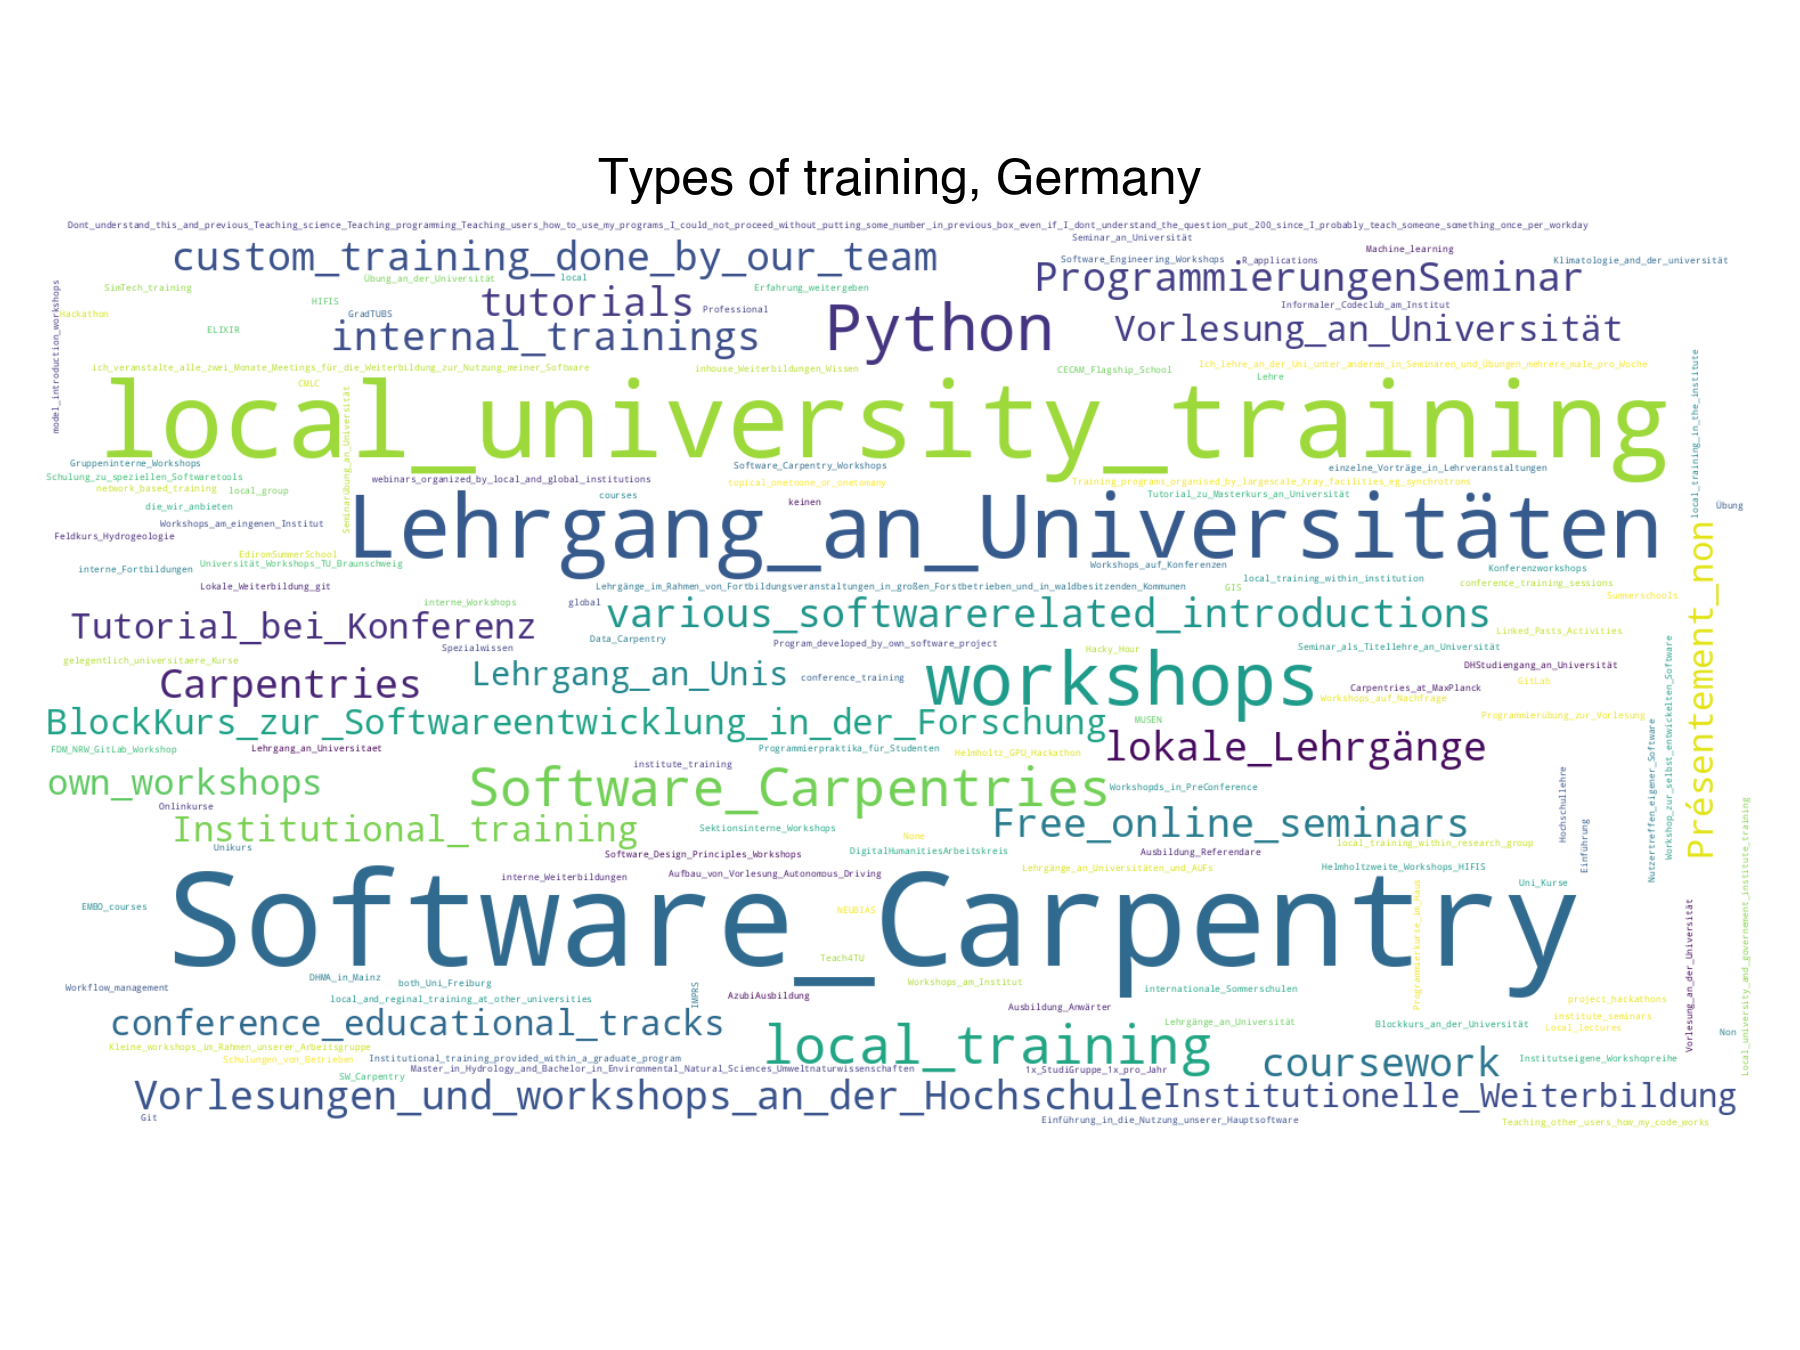
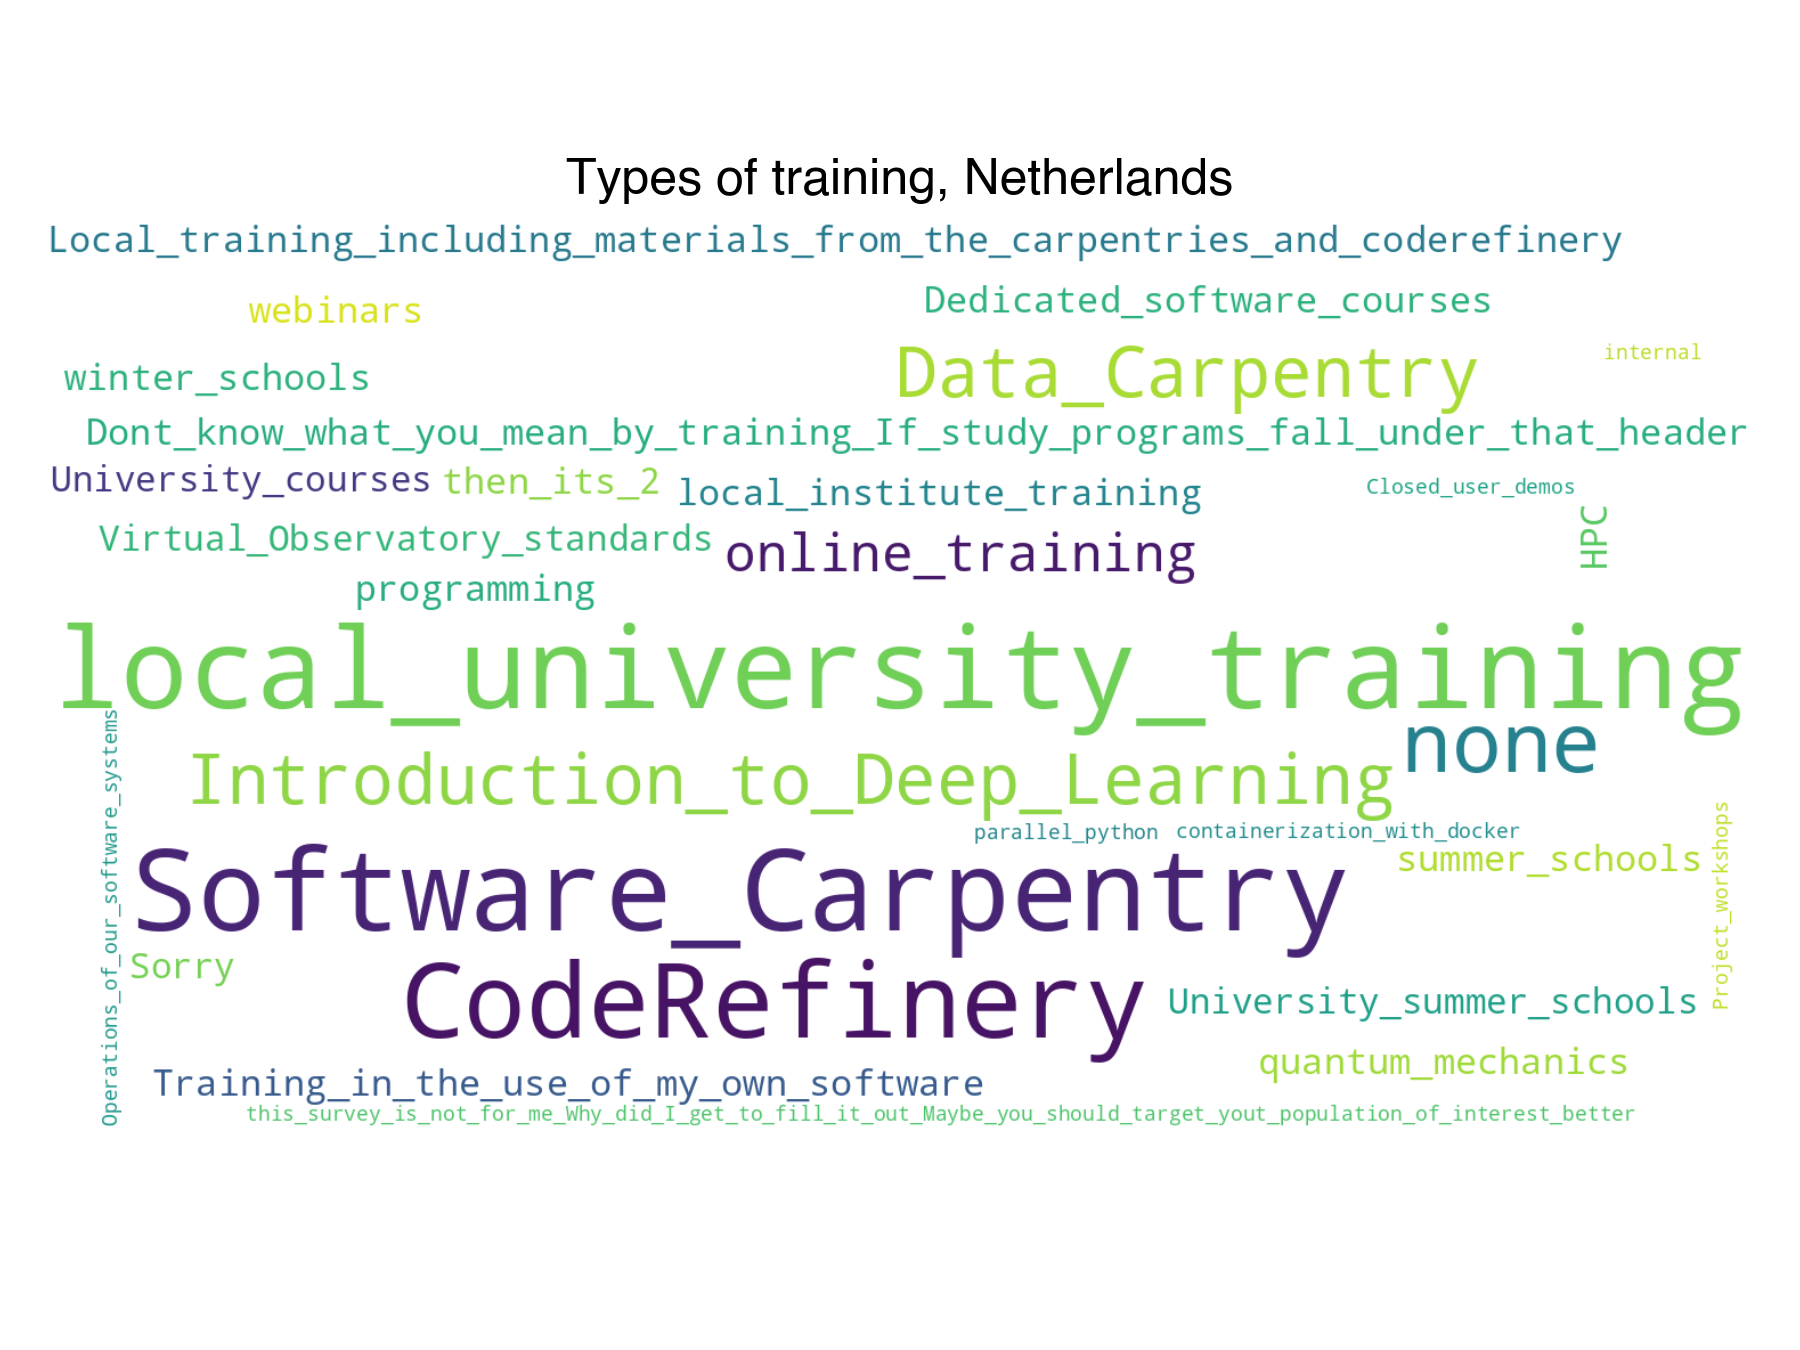
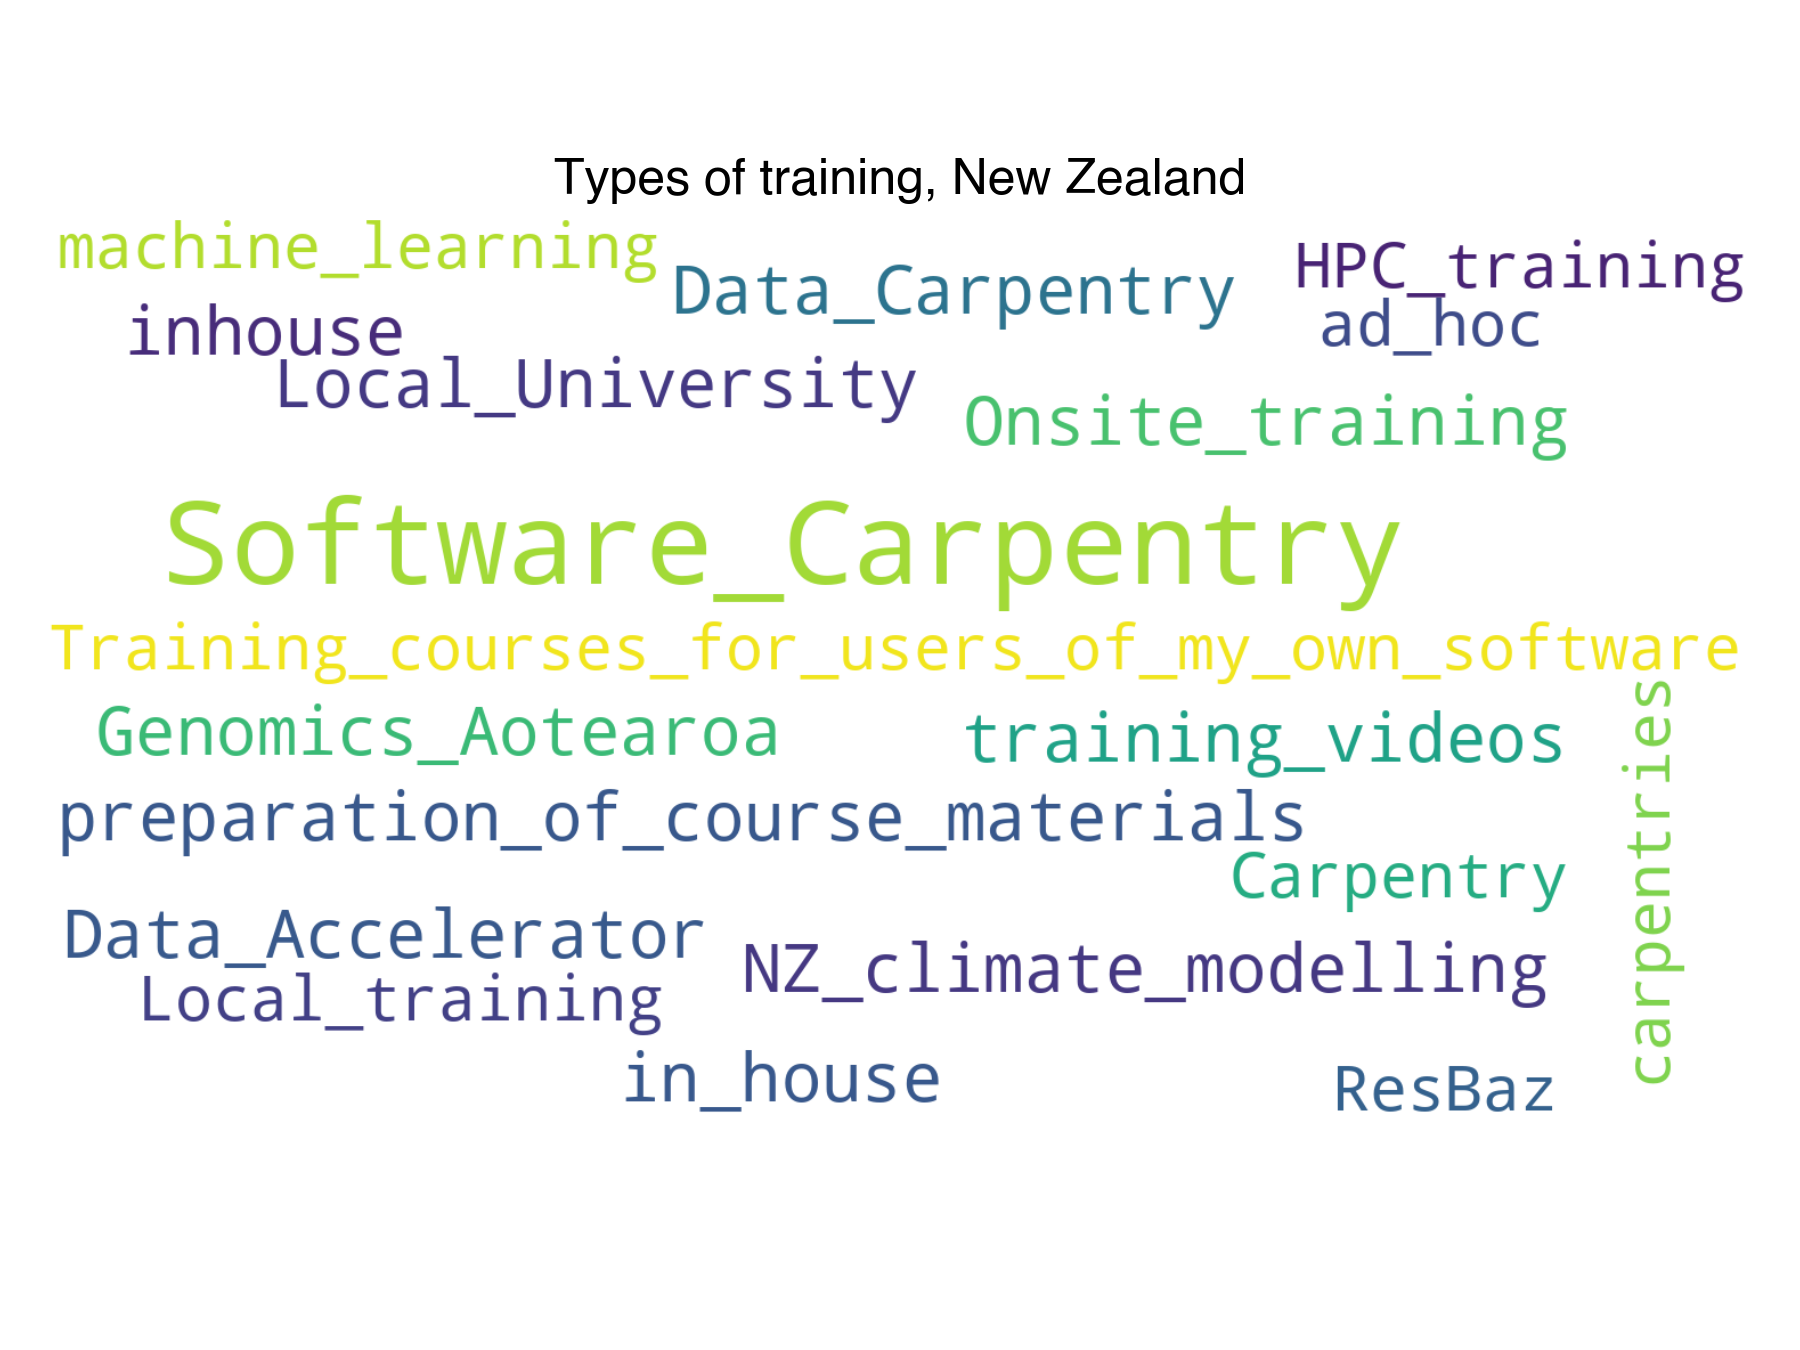
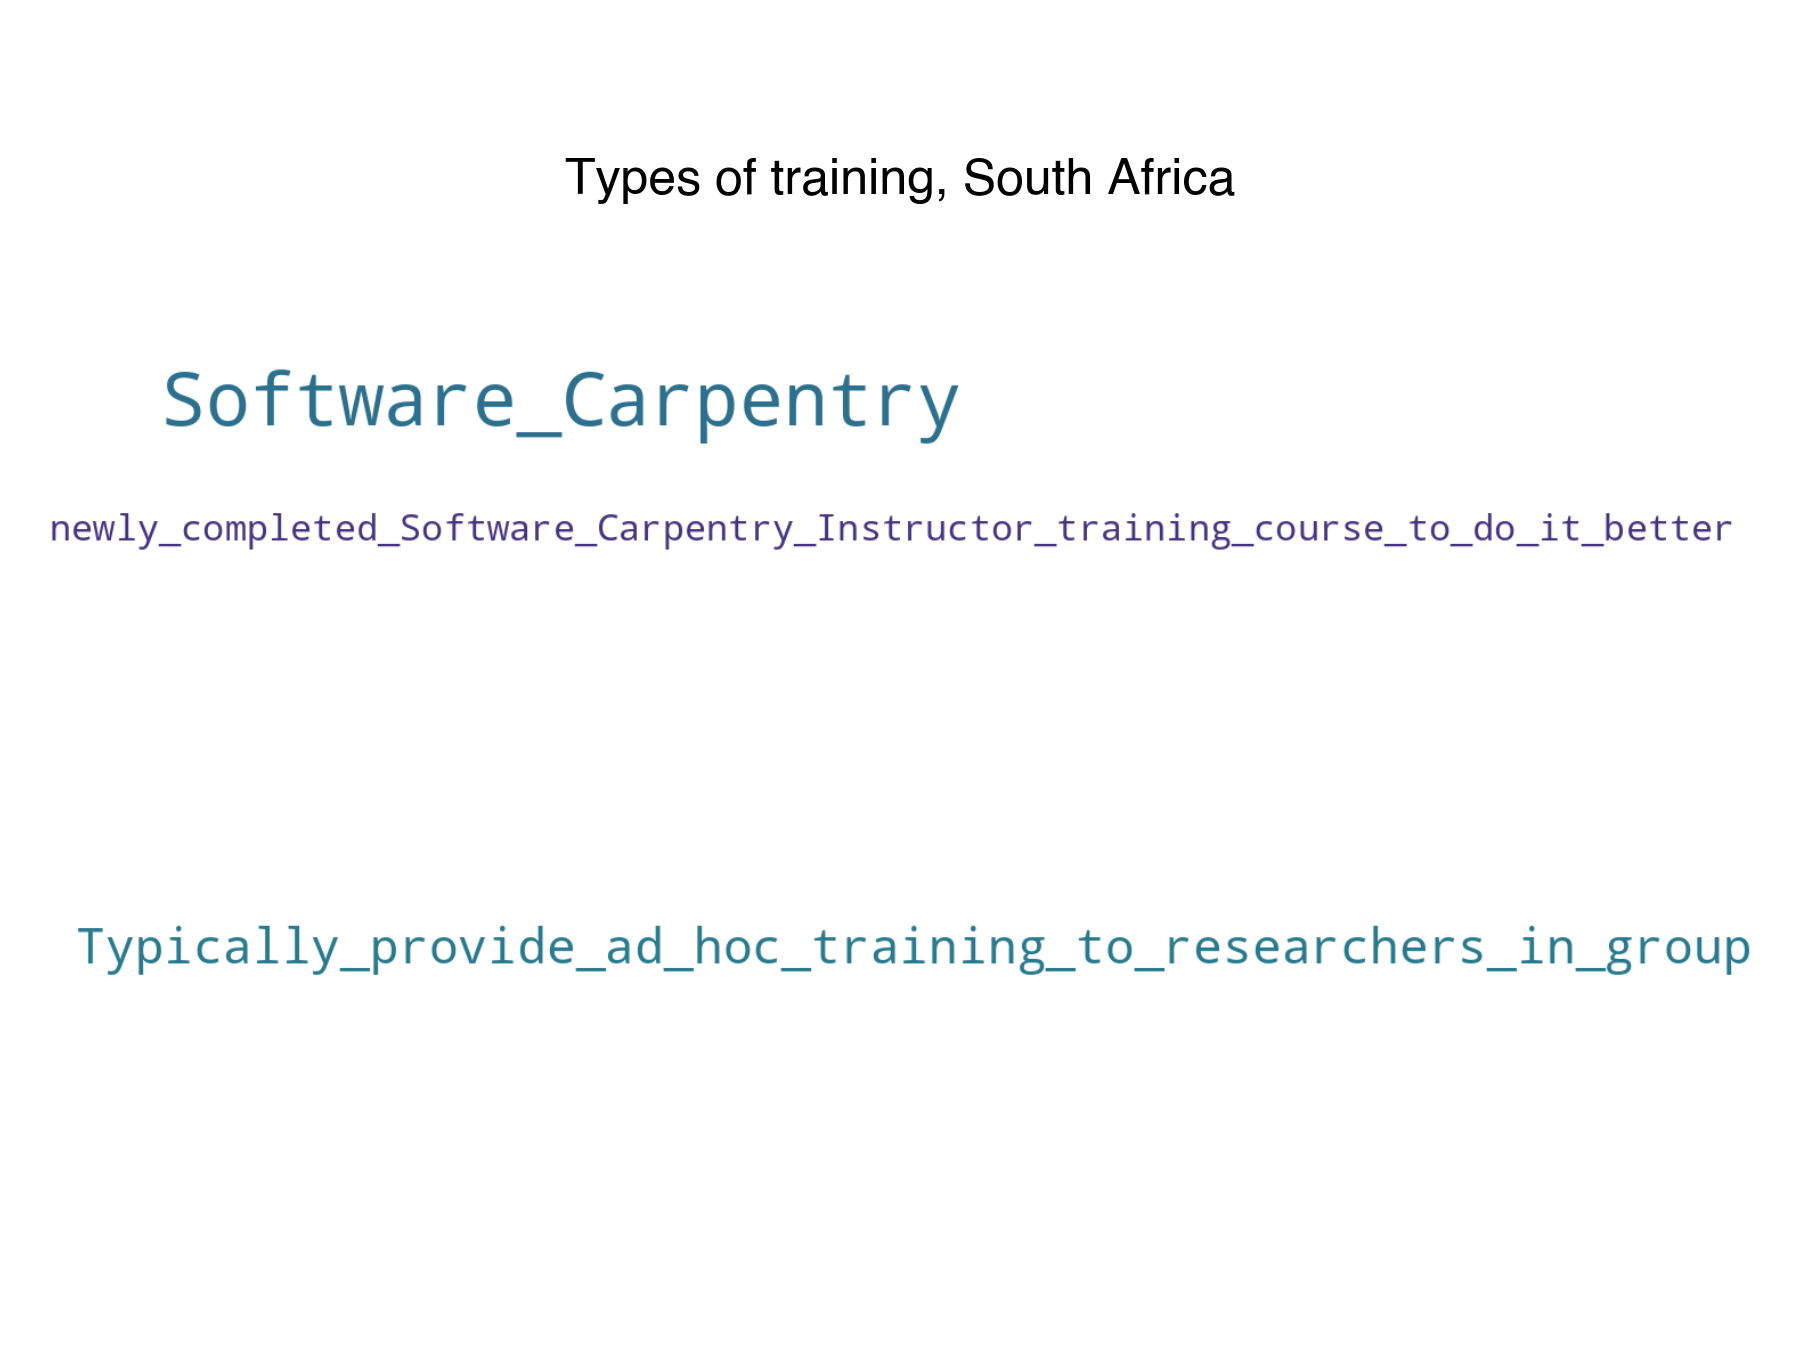
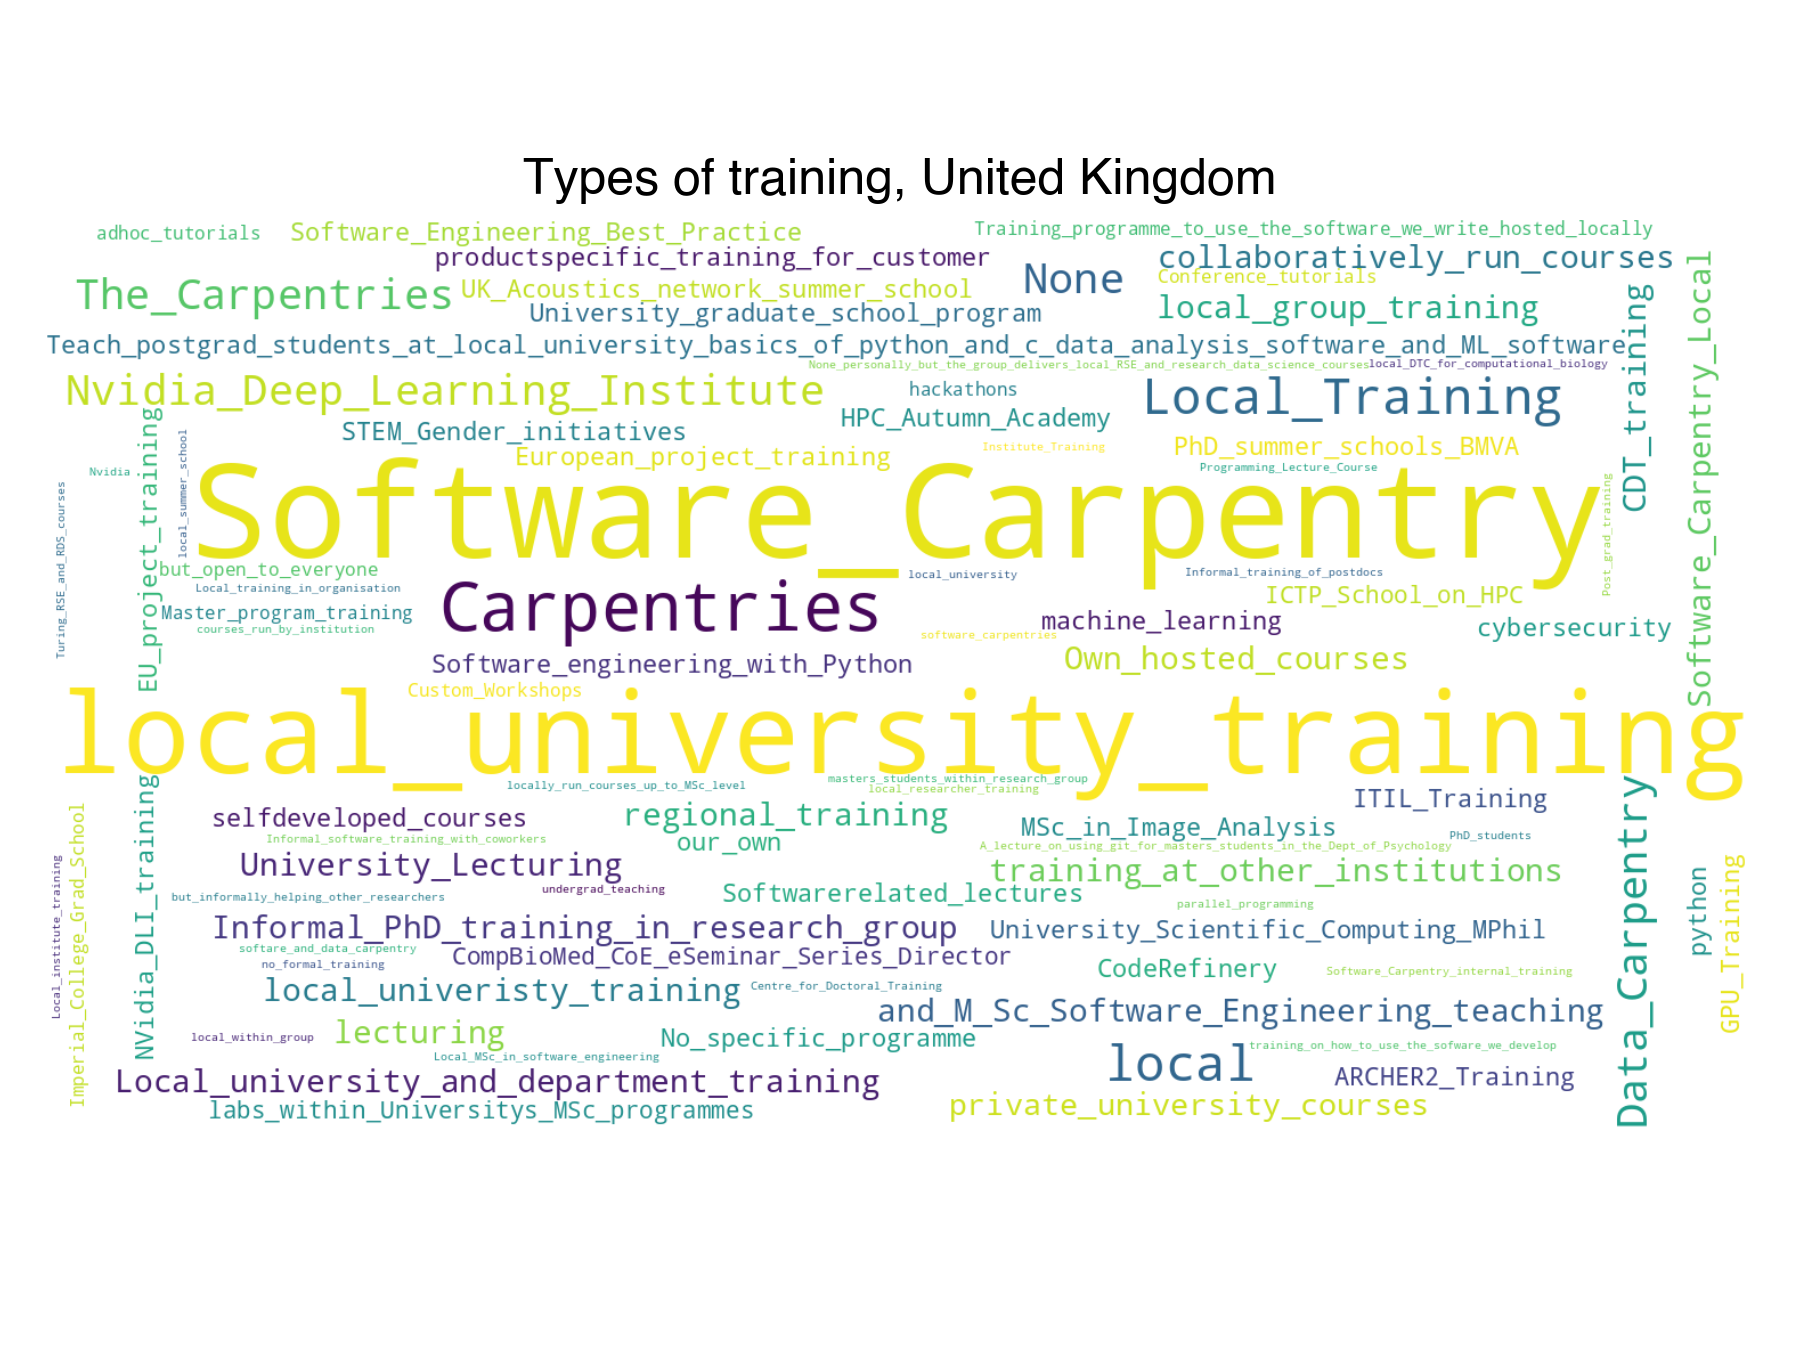
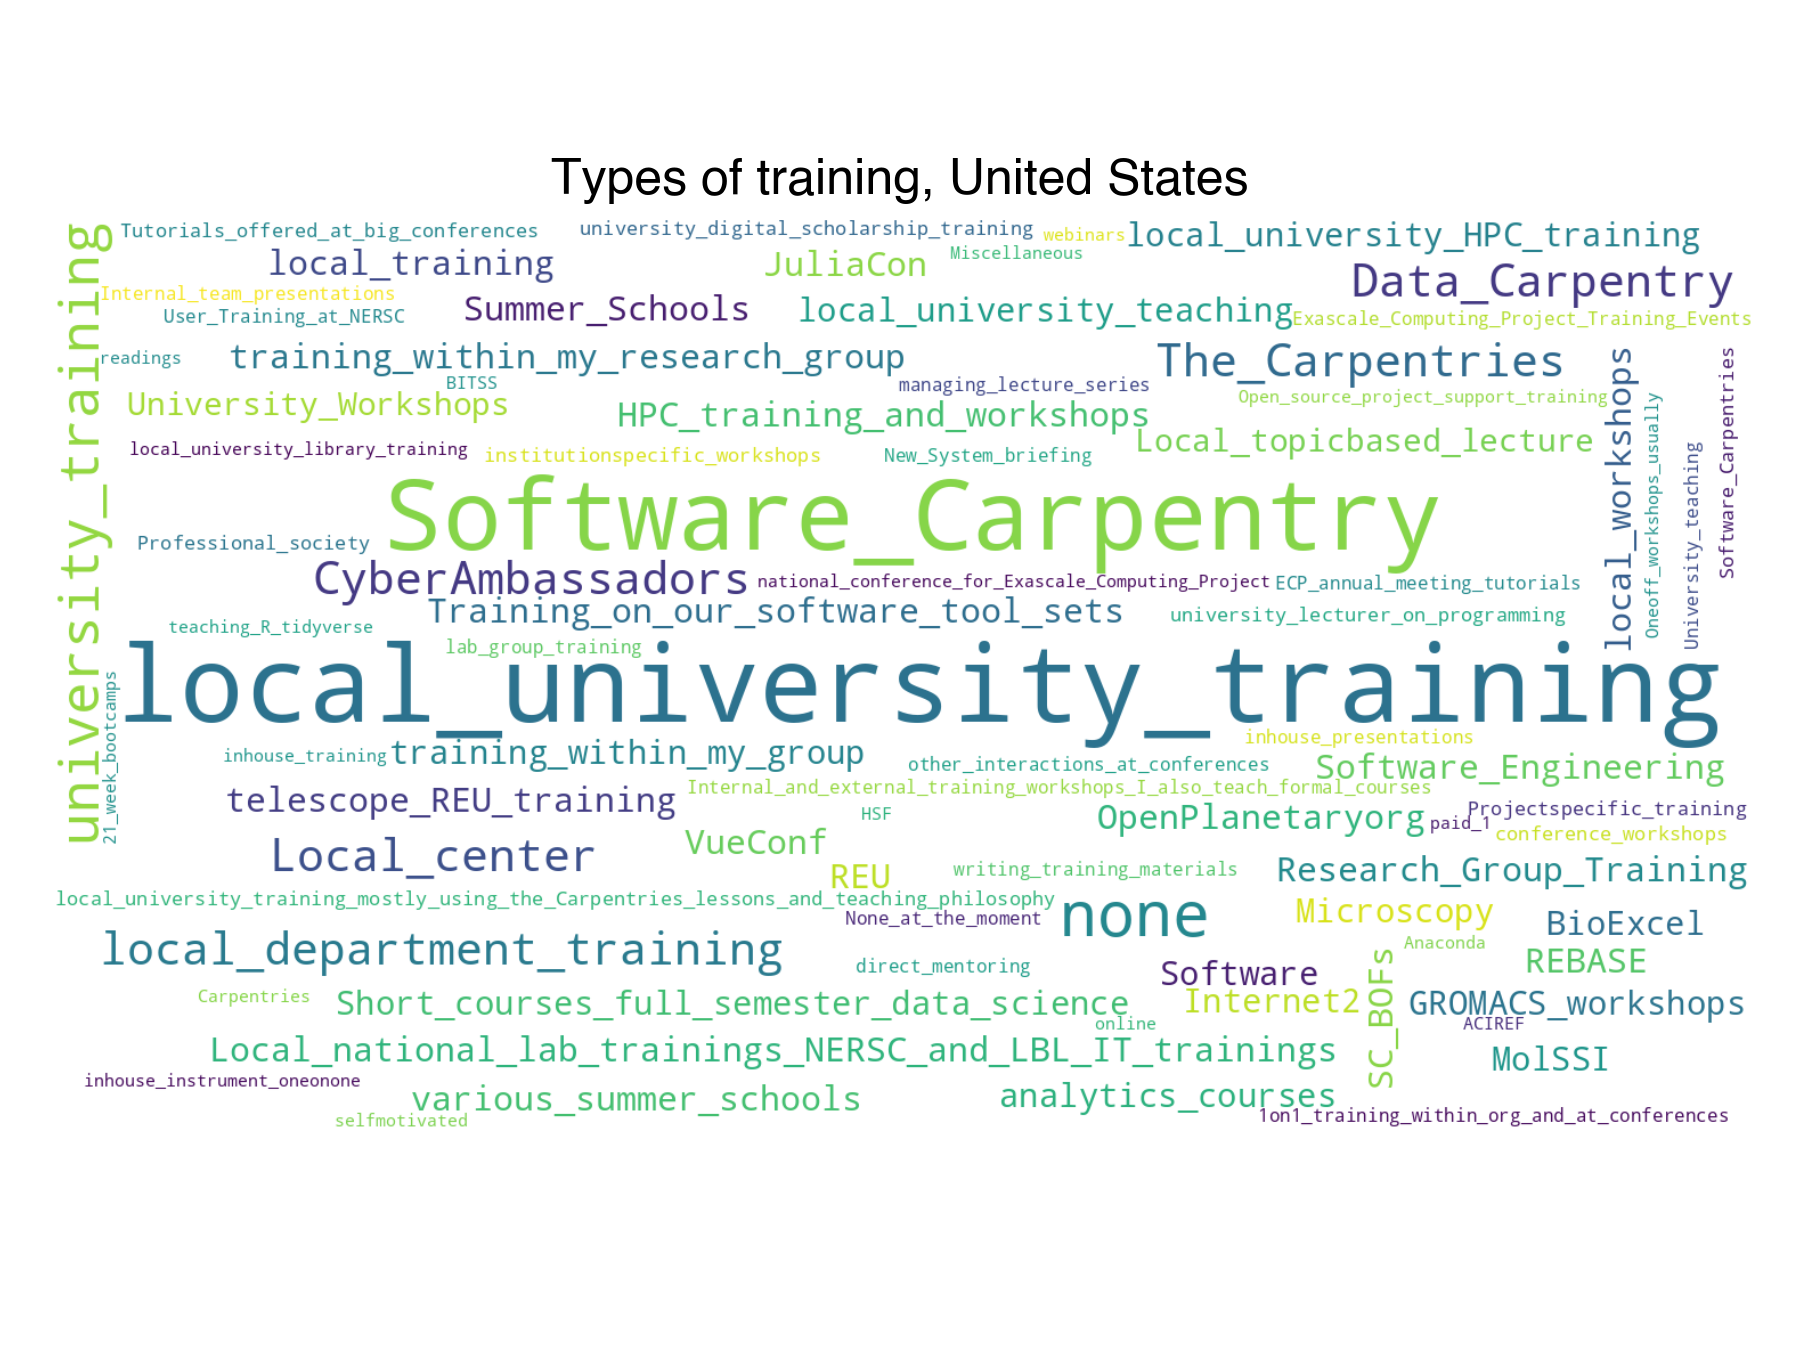
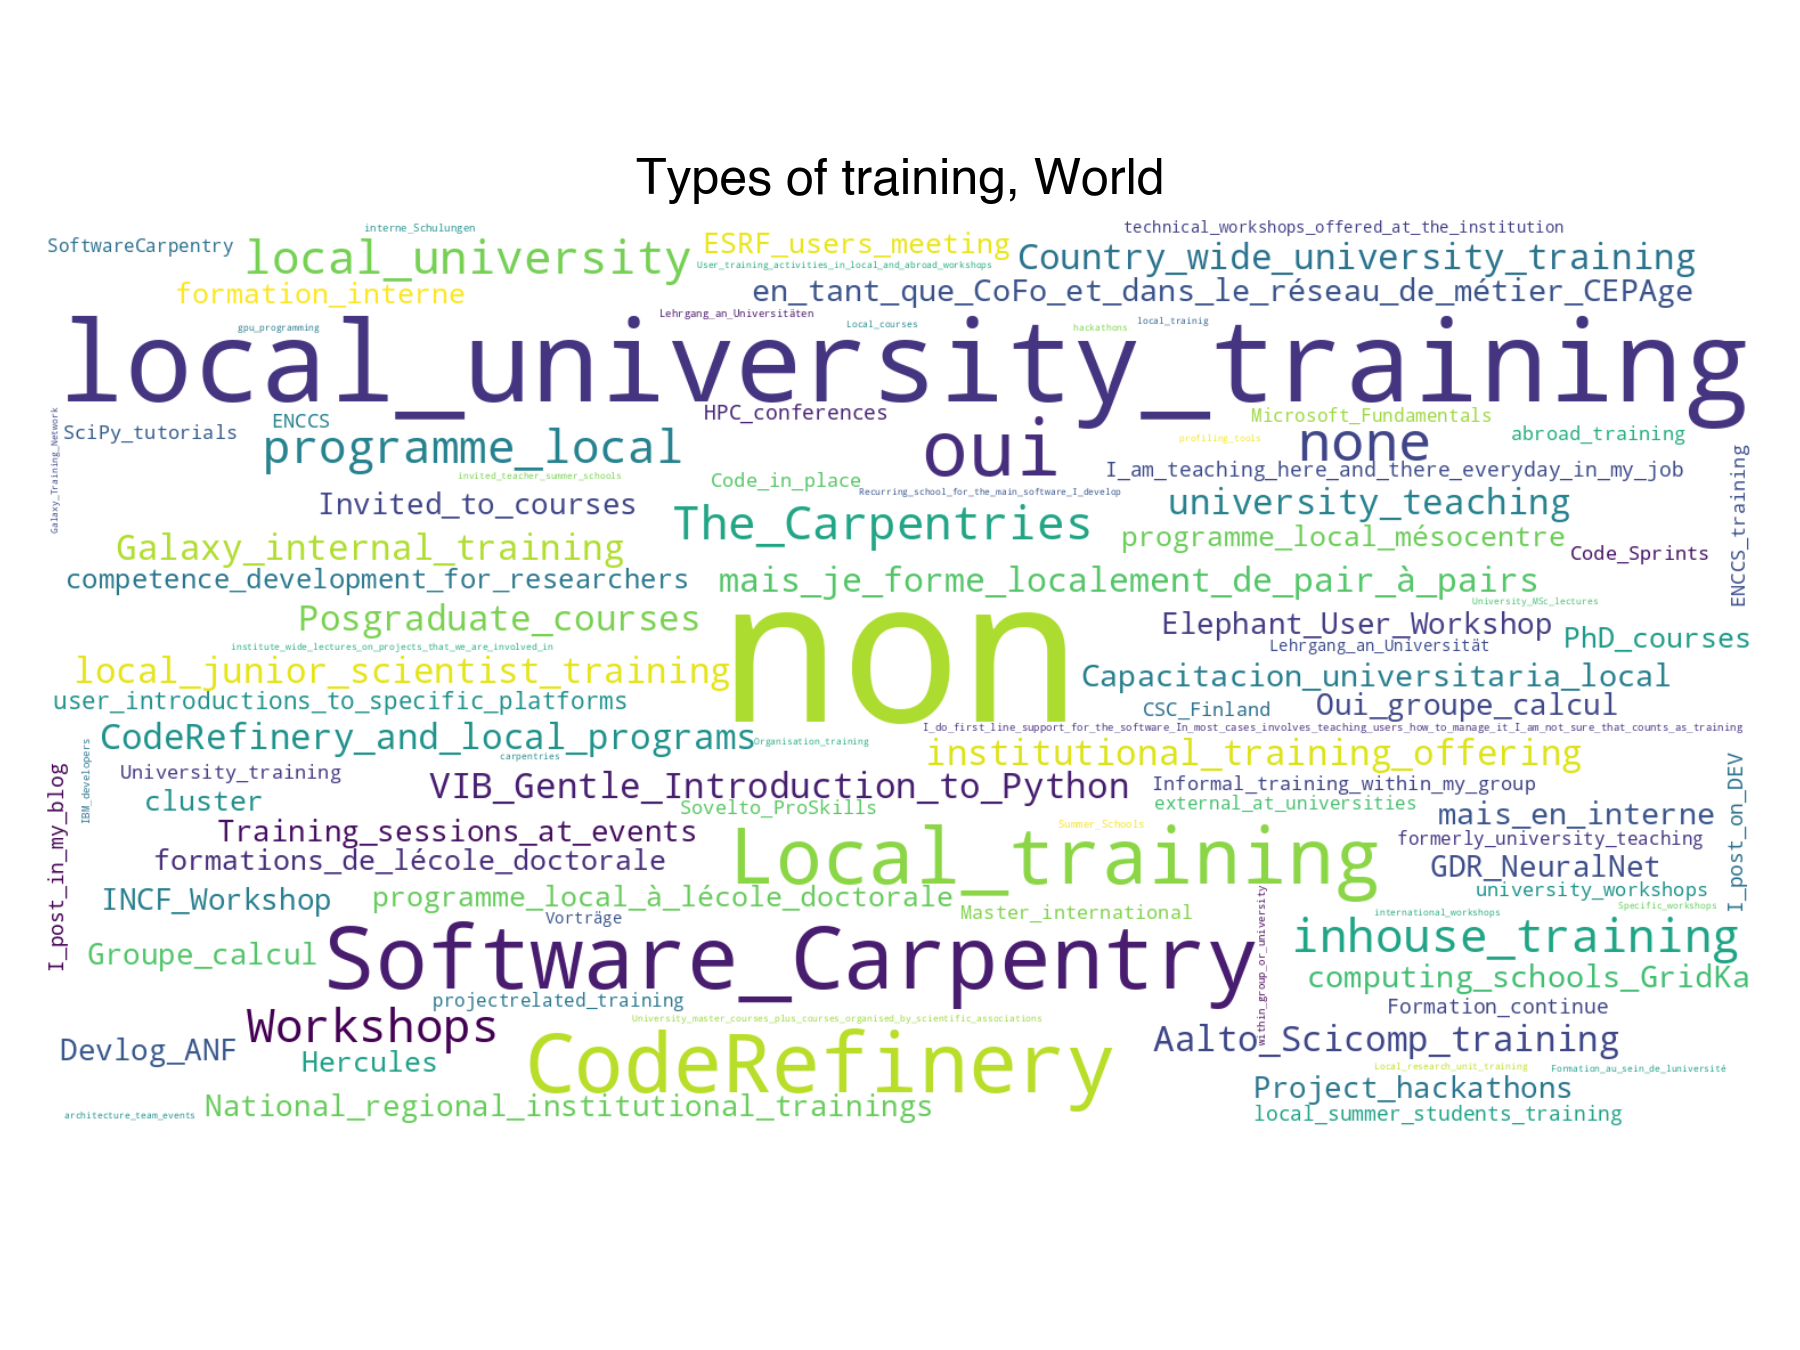
- What training programs are you involved with? (free text)
Australia
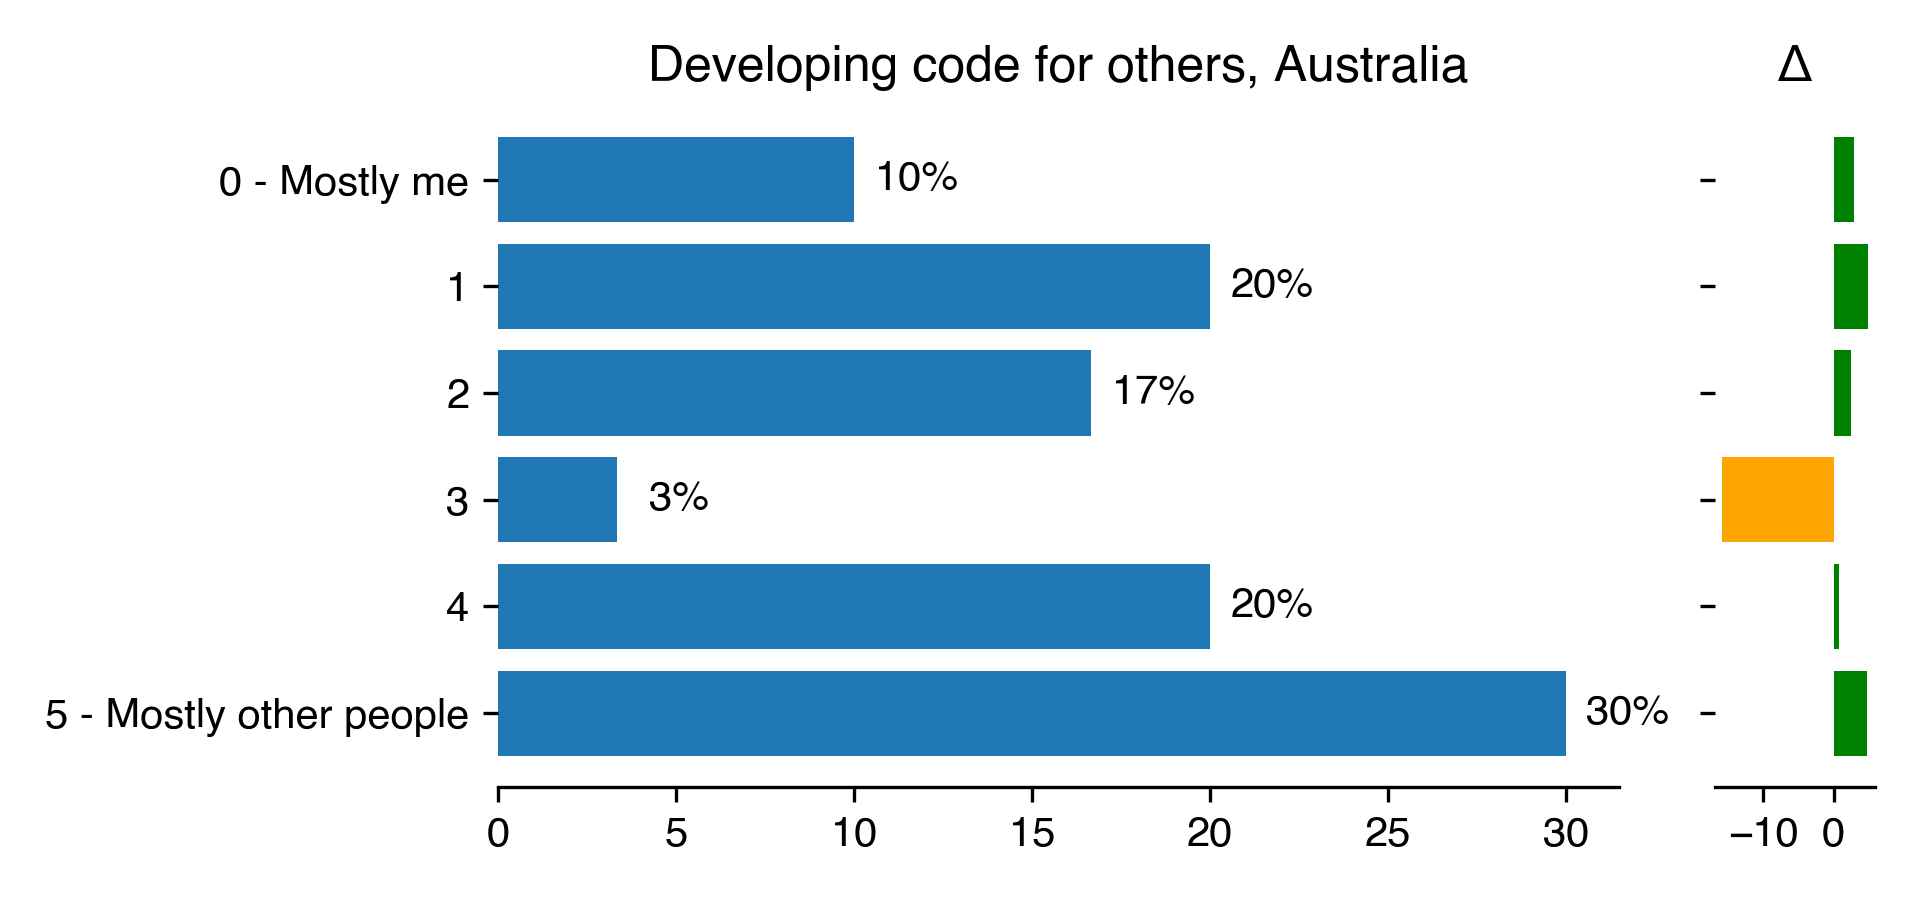
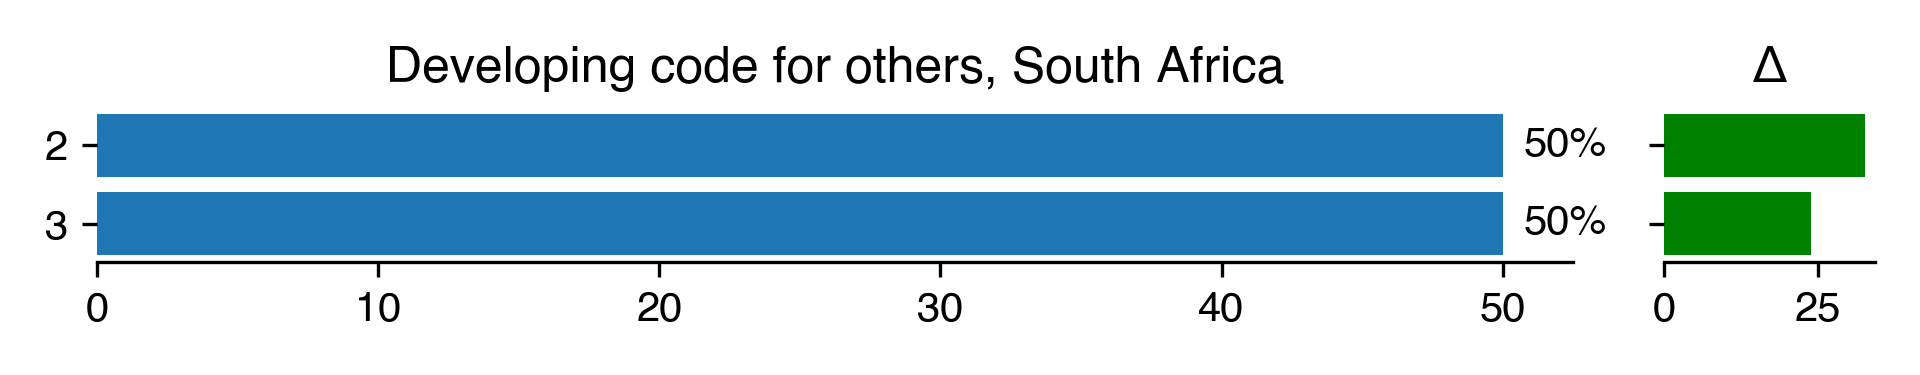
Developing code for others
| Developing code for others for Australia |
Count |
Percentage |
Percentage in 2018 |
Difference with previous year |
| 0 - Mostly me |
3 |
10 |
7.07 |
2.93 |
| 1 |
6 |
20 |
15.15 |
4.85 |
| 2 |
5 |
16.67 |
14.14 |
2.53 |
| 3 |
1 |
3.33 |
19.19 |
-15.86 |
| 4 |
6 |
20 |
19.19 |
0.81 |
| 5 - Mostly other people |
9 |
30 |
25.25 |
4.75 |
Download CSV
PNG SVG
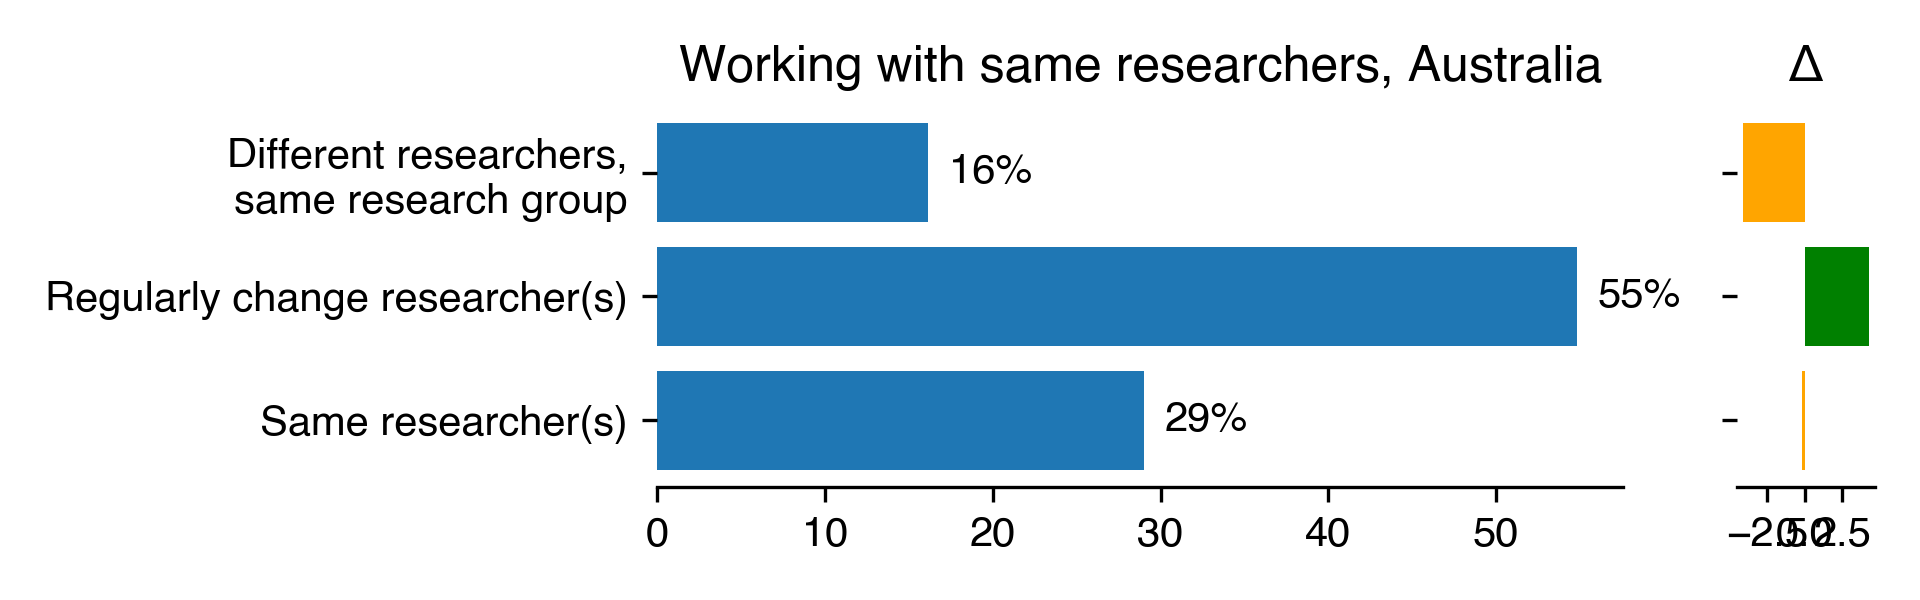
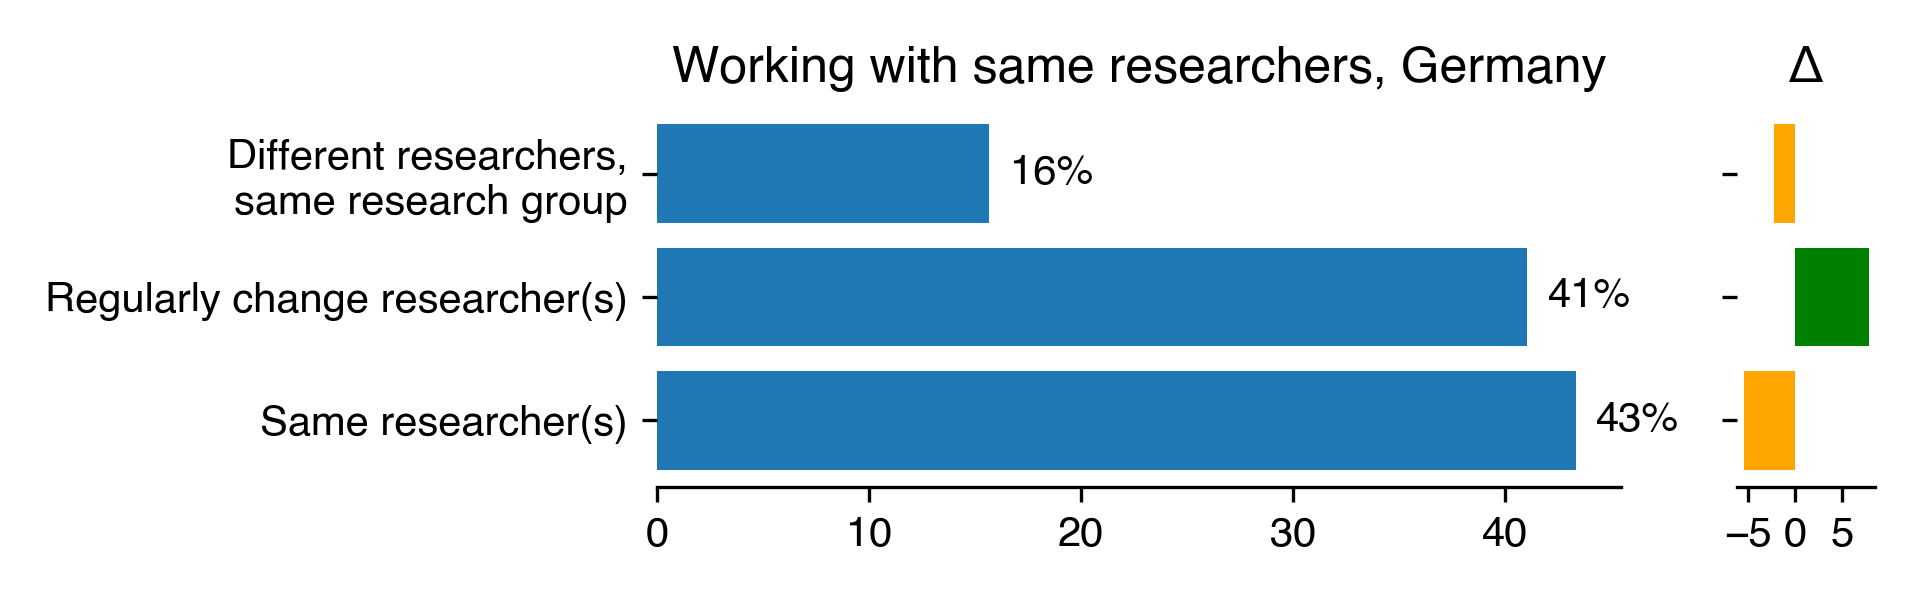
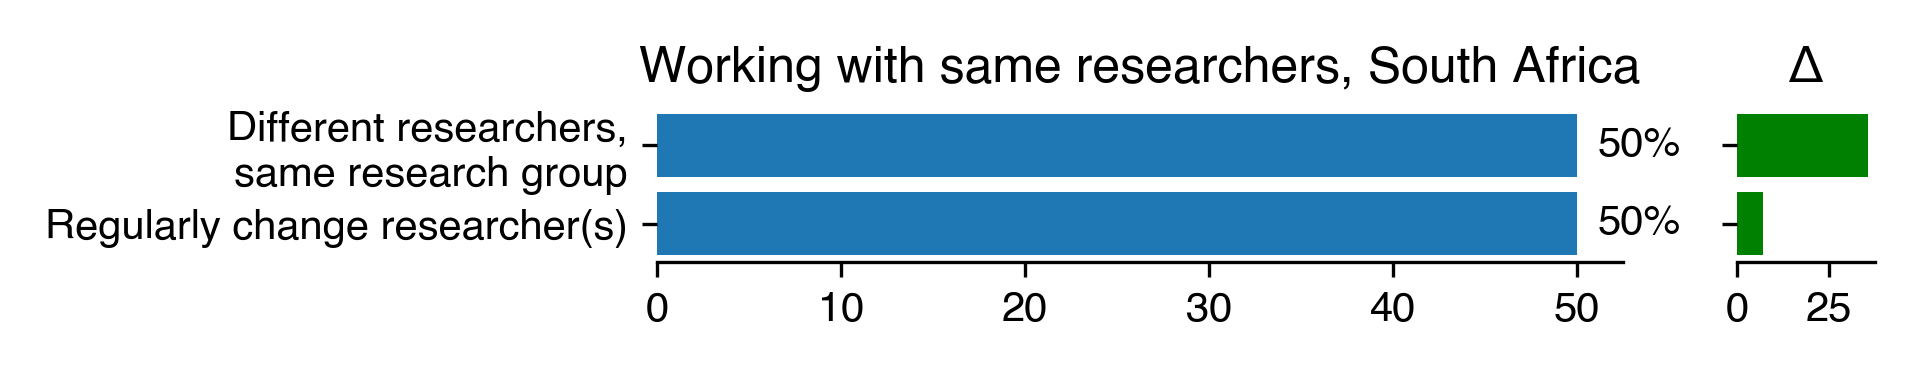
Working with same researchers
| Working with same researchers for Australia |
Count |
Percentage |
Percentage in 2018 |
Difference with previous year |
| Different researchers, same research group |
5 |
16.13 |
20.22 |
-4.1 |
| Regularly change researcher(s) |
17 |
54.84 |
50.56 |
4.28 |
| Same researcher(s) |
9 |
29.03 |
29.21 |
-0.18 |
Download CSV
PNG SVG
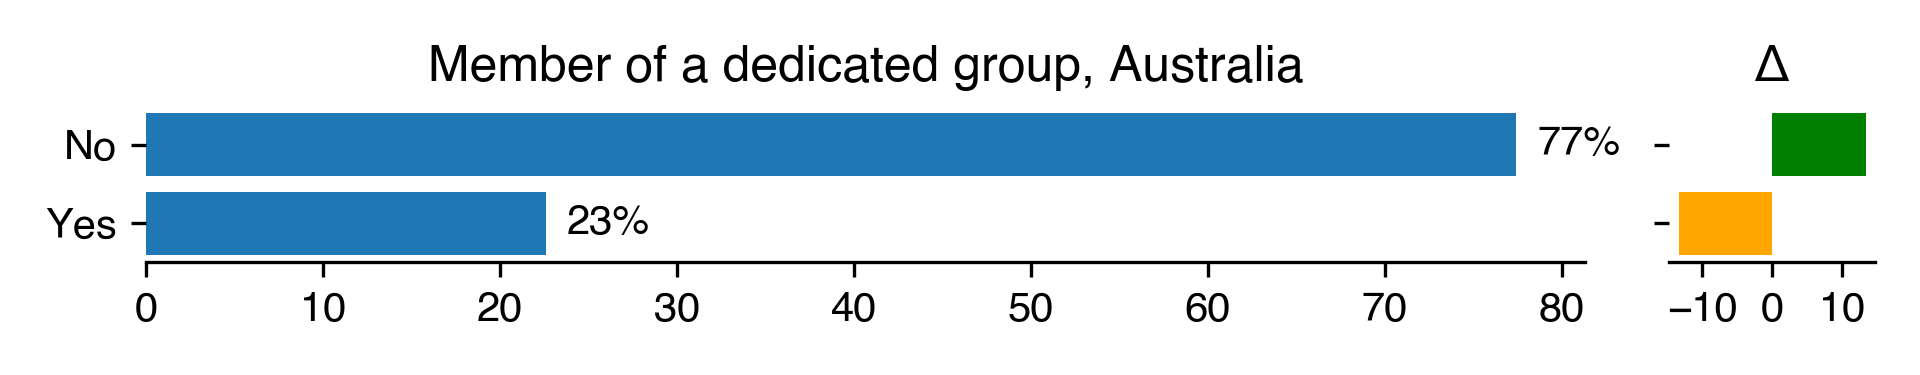
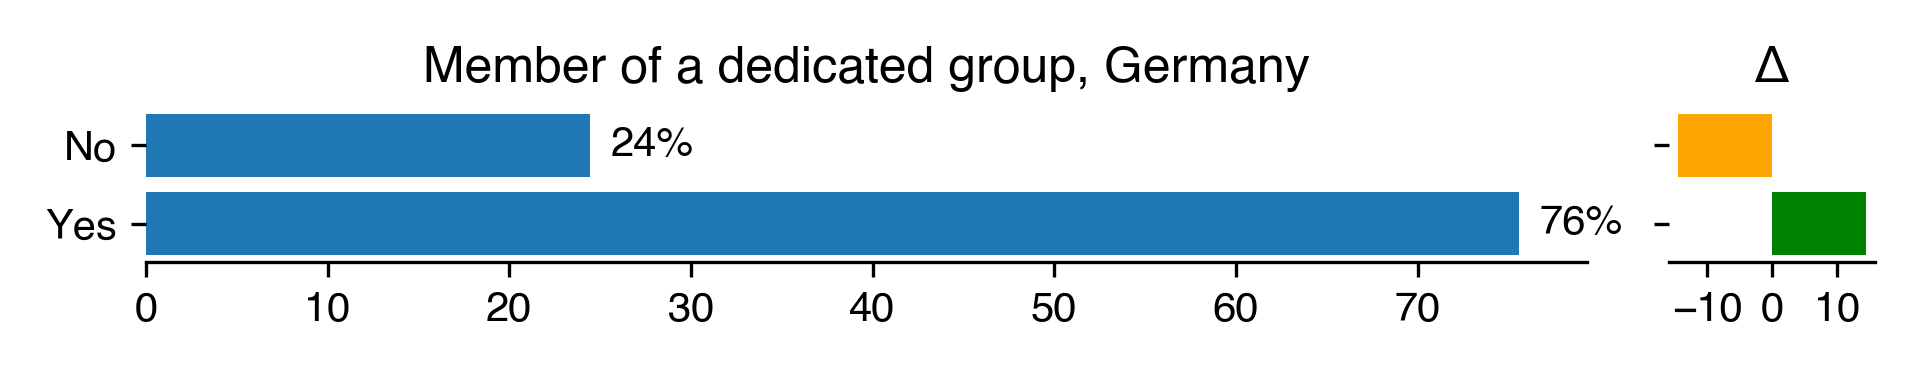
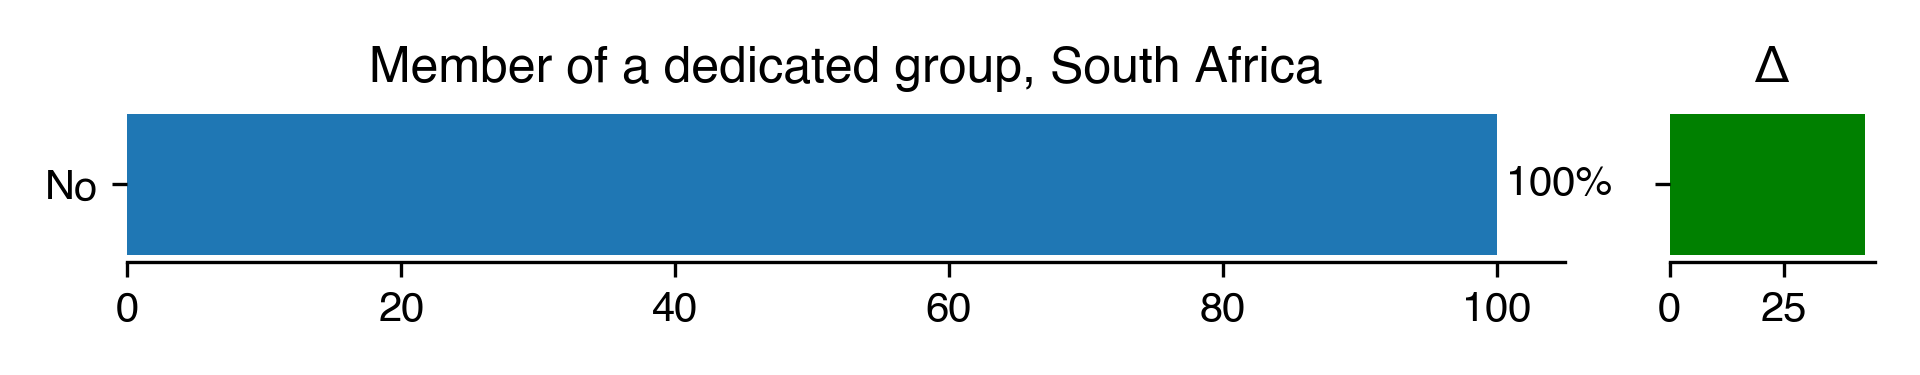
Part of dedicated group
| Member of a dedicated group for Australia |
Count |
Percentage |
Percentage in 2018 |
Difference with previous year |
| No |
24 |
77.42 |
64.04 |
13.37 |
| Yes |
7 |
22.58 |
35.96 |
-13.37 |
Download CSV
PNG SVG
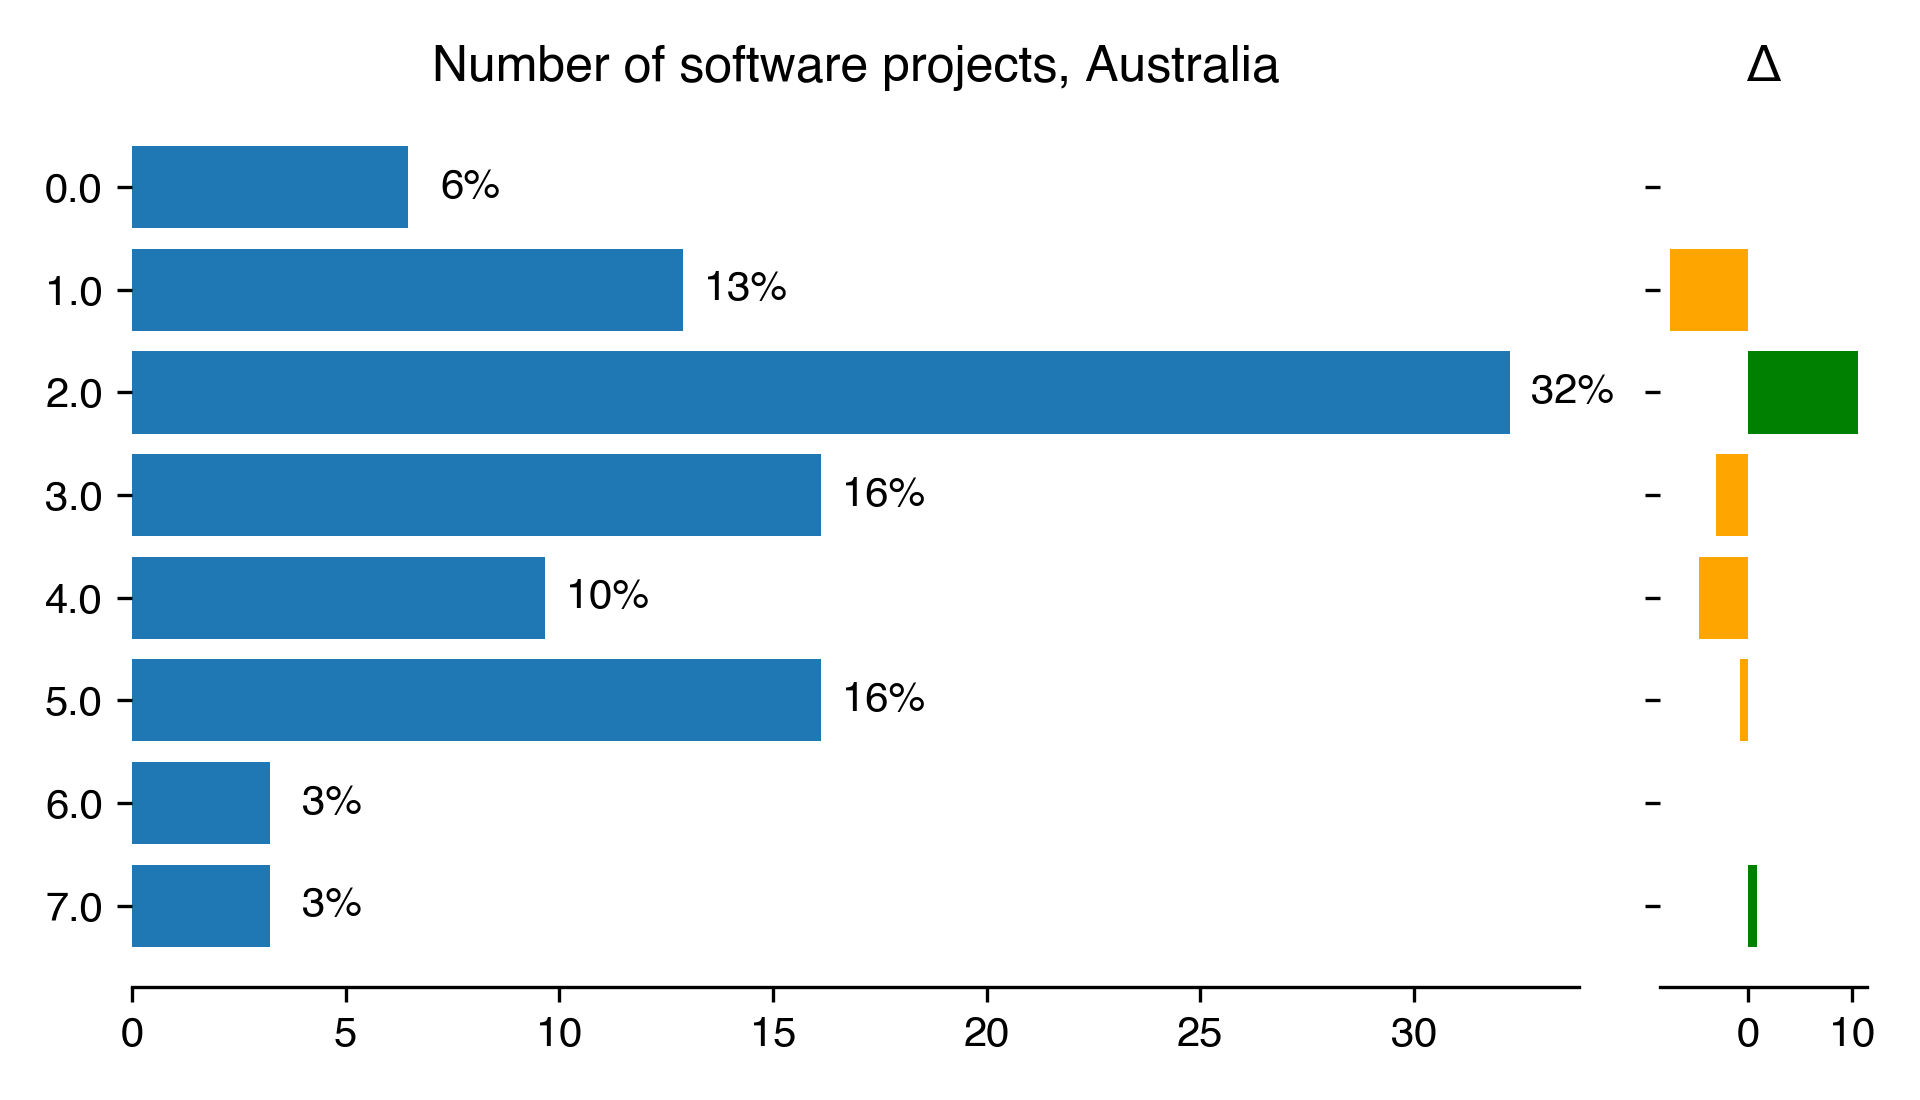
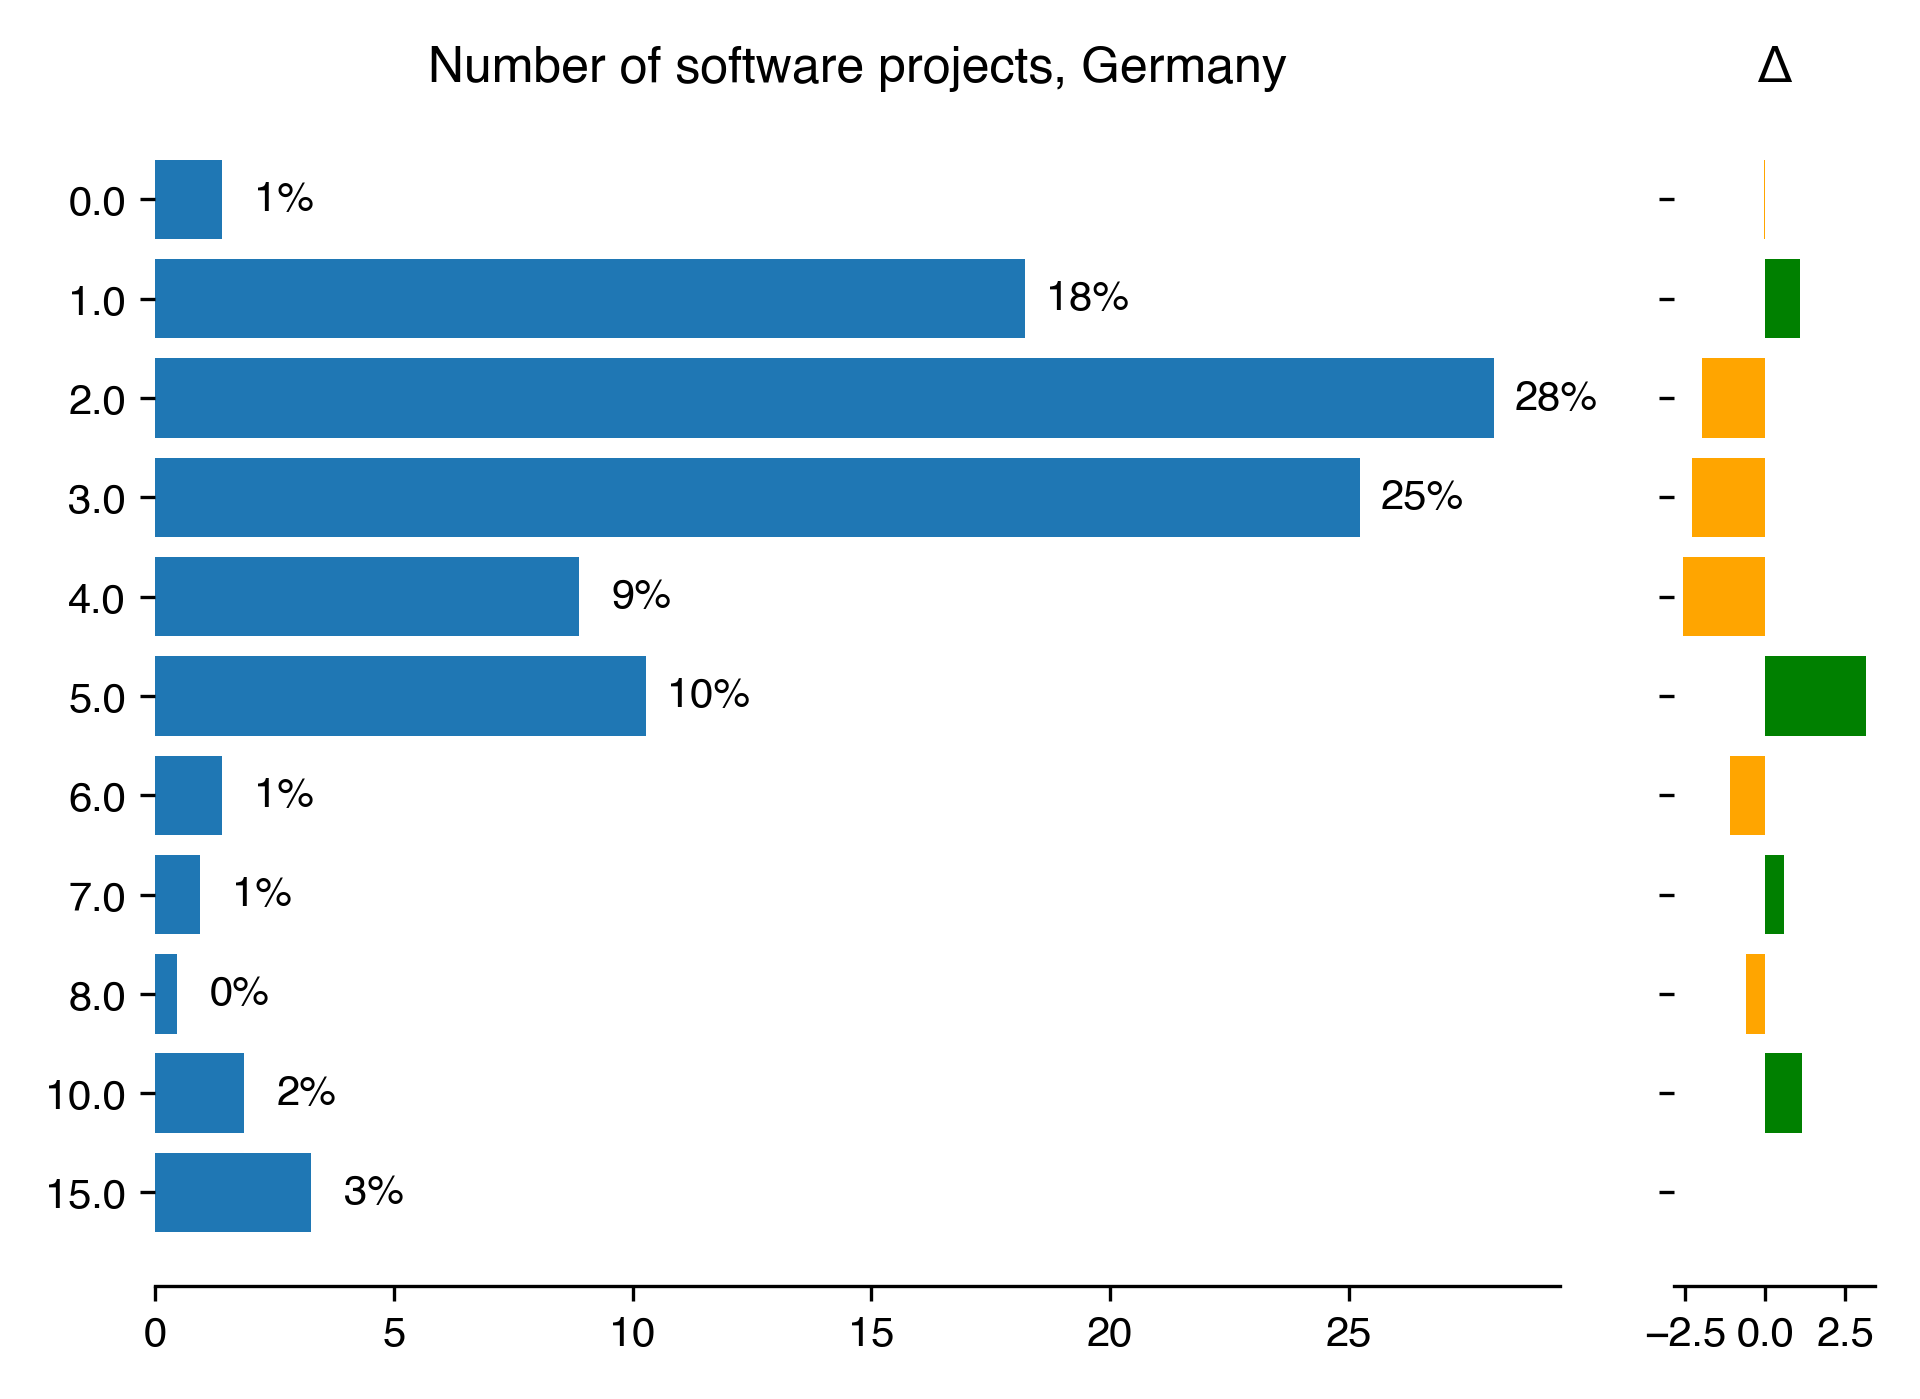
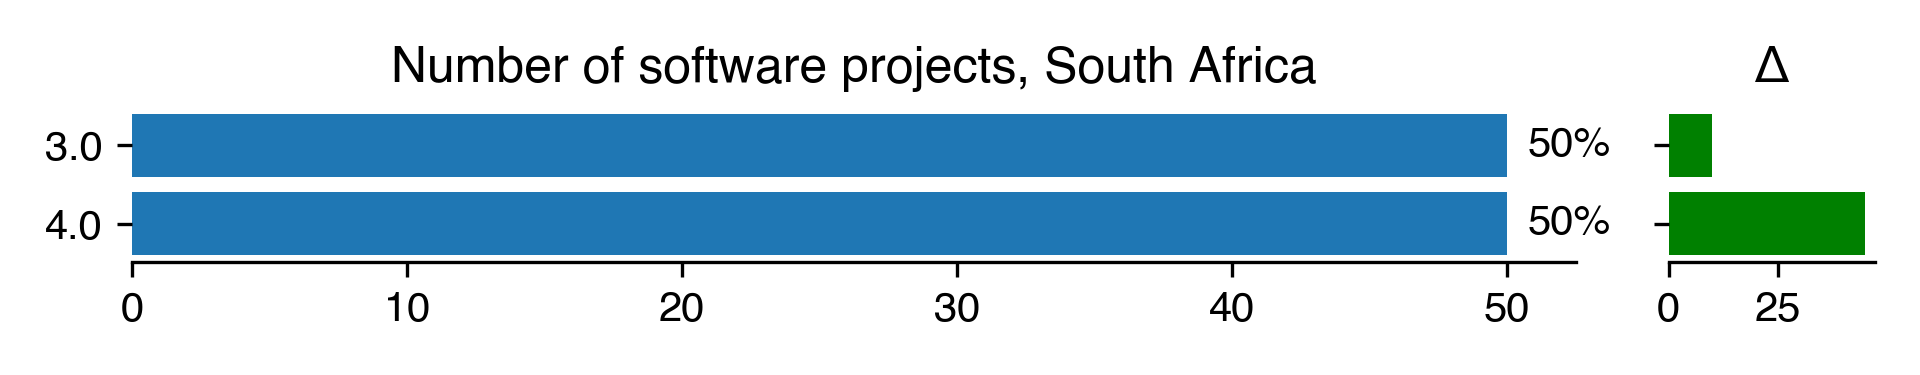
Number of projects
| Number of software projects for Australia |
Count |
Percentage |
Percentage in 2018 |
Difference with previous year |
| 0 |
2 |
6.45 |
nan |
nan |
| 1 |
4 |
12.9 |
20.48 |
-7.58 |
| 2 |
10 |
32.26 |
21.69 |
10.57 |
| 3 |
5 |
16.13 |
19.28 |
-3.15 |
| 4 |
3 |
9.68 |
14.46 |
-4.78 |
| 5 |
5 |
16.13 |
16.87 |
-0.74 |
| 6 |
1 |
3.23 |
nan |
nan |
| 7 |
1 |
3.23 |
2.41 |
0.82 |
Download CSV
PNG SVG
| Number of software developers per projects for Australia |
Count |
Percentage |
Percentage in 2018 |
Difference with previous year |
| 0 |
1 |
3.57 |
2.41 |
1.16 |
| 1 |
11 |
39.29 |
42.17 |
-2.88 |
| 2 |
8 |
28.57 |
19.28 |
9.29 |
| 3 |
2 |
7.14 |
20.48 |
-13.34 |
| 4 |
1 |
3.57 |
3.61 |
-0.04 |
| 5 |
3 |
10.71 |
3.61 |
7.1 |
| 10 |
1 |
3.57 |
1.2 |
2.37 |
| 100 |
1 |
3.57 |
nan |
nan |
Download CSV
PNG SVG
Training
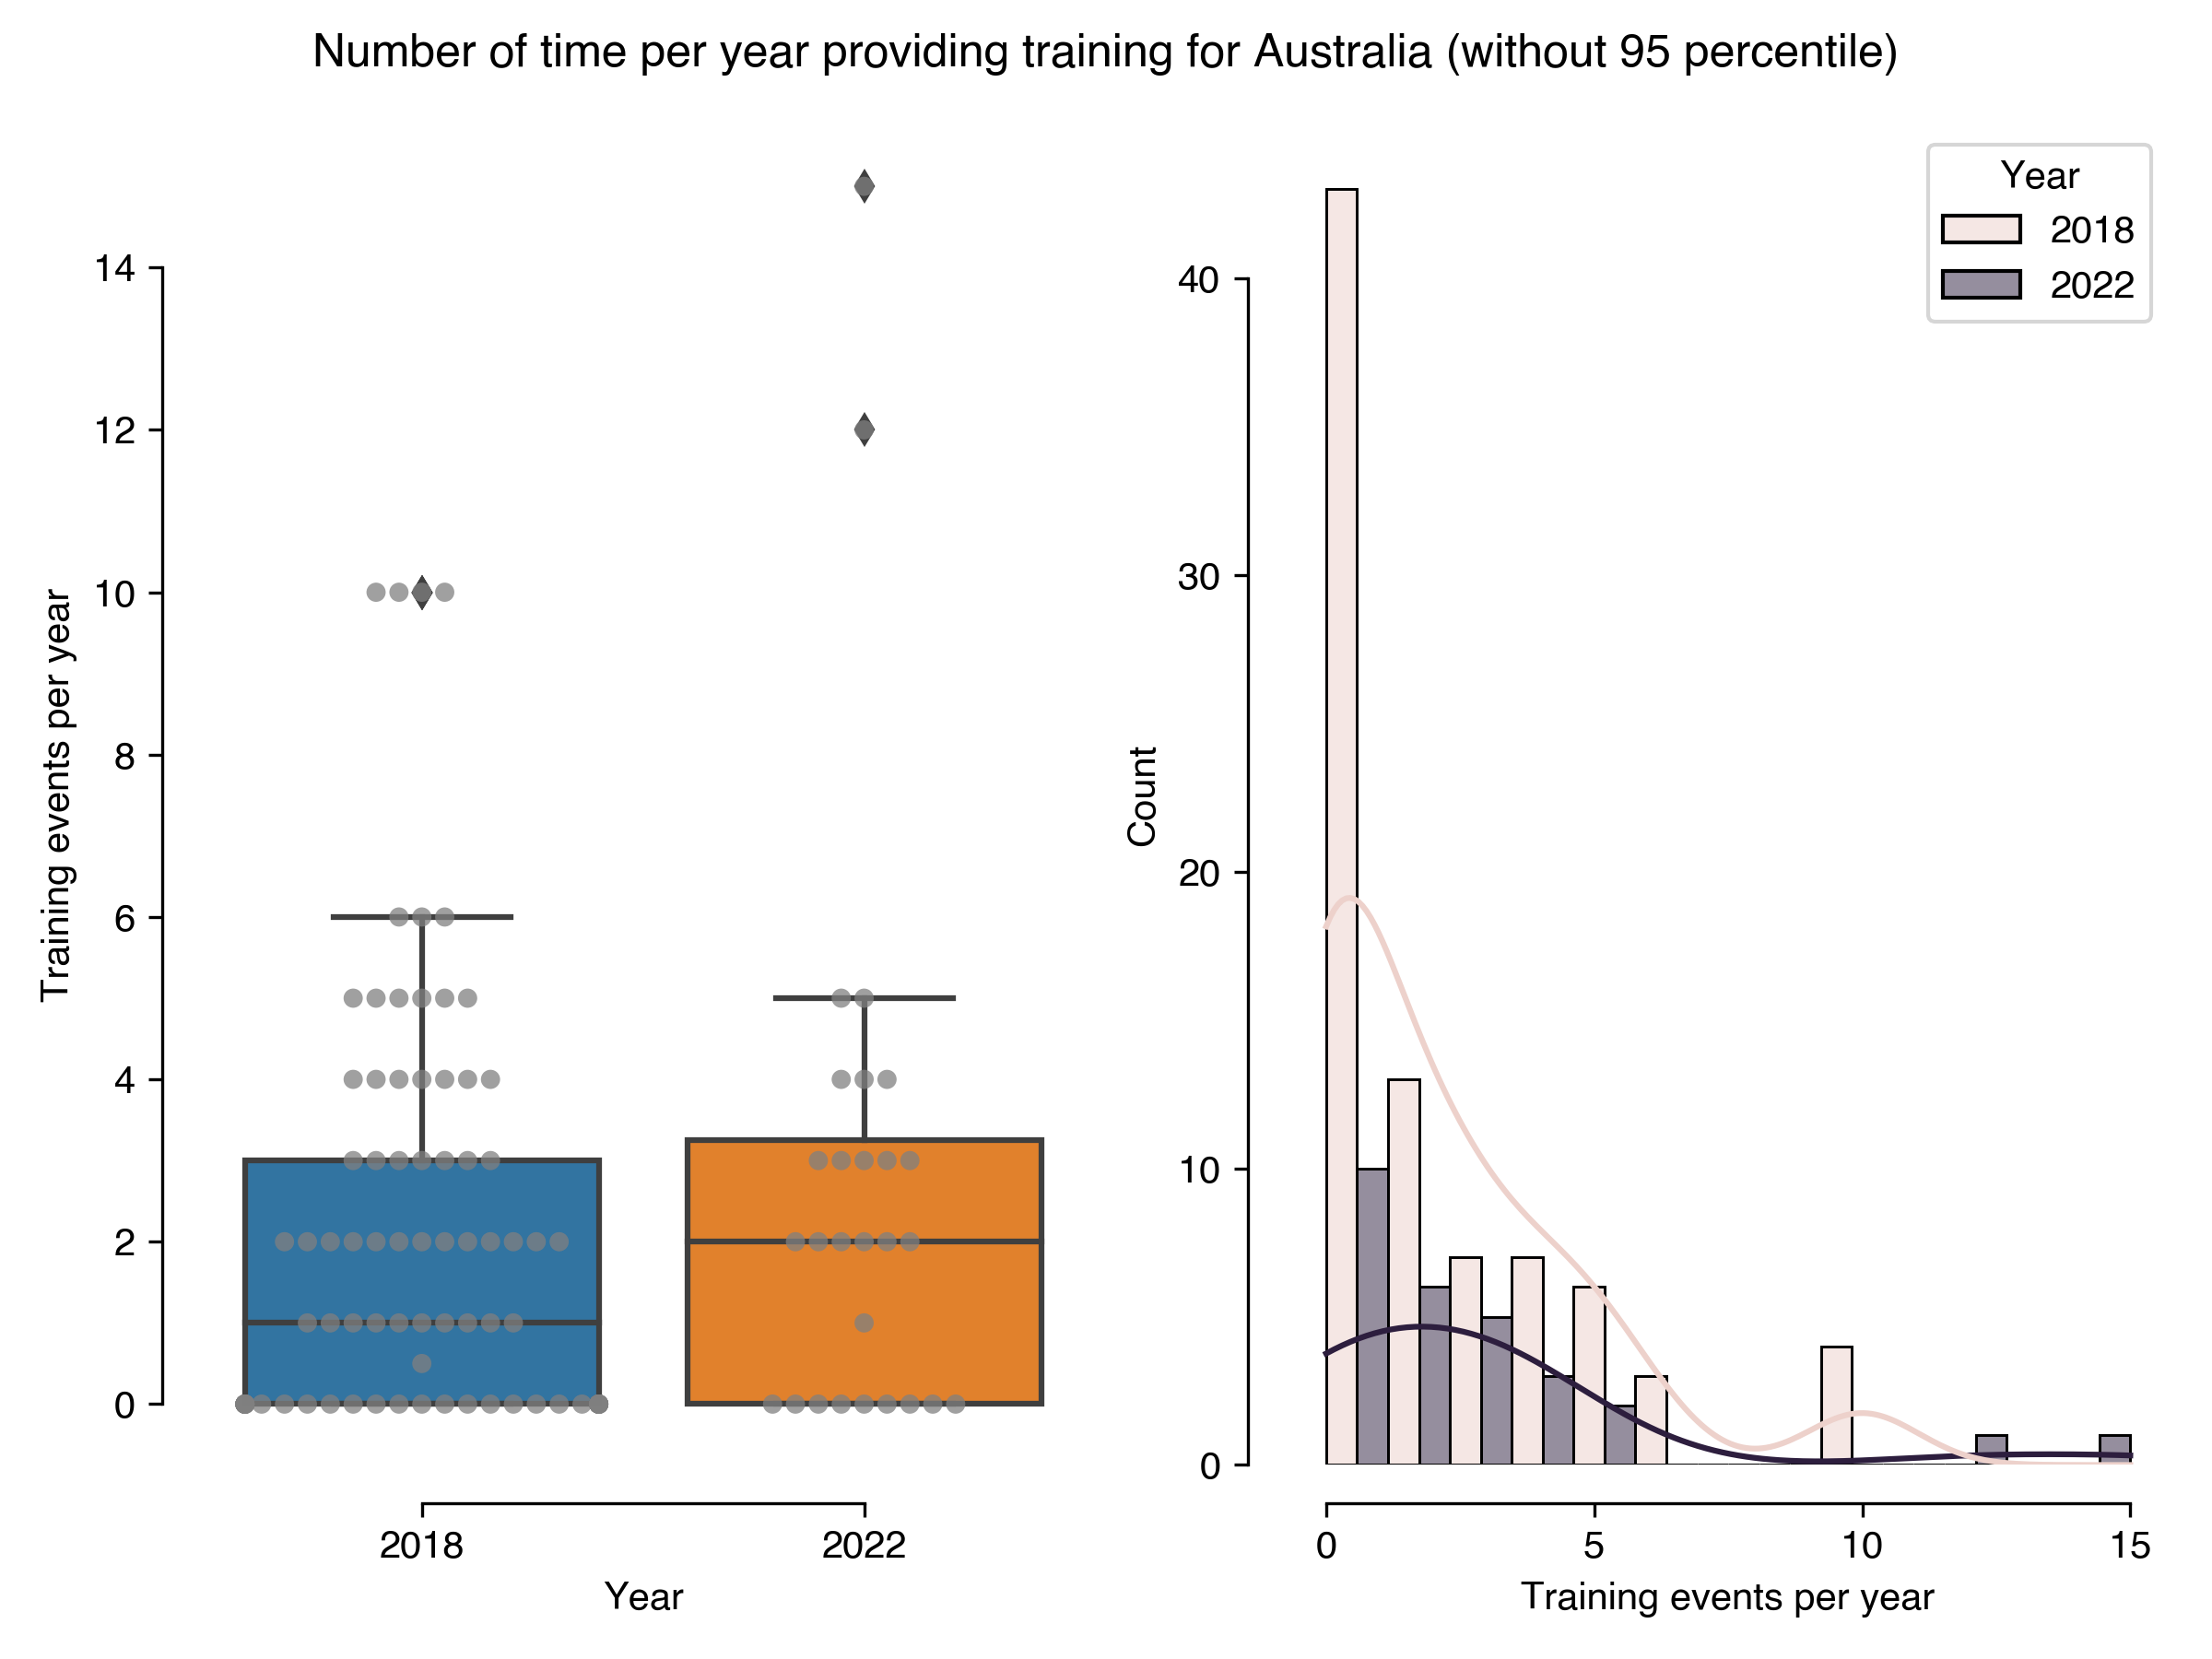
| Number of time per year providing training for Australia (without 95 percentile) |
Results in 2022 |
Results in 2018 |
| count |
28 |
83 |
| mean |
2.75 |
2.09 |
| std |
3.47 |
2.55 |
| min |
0 |
0 |
| 25% |
0 |
0 |
| 50% |
2 |
1 |
| 75% |
3.25 |
3 |
| max |
15 |
10 |
Download CSV
PNG SVG
PNG SVG
Canada
Developing code for others
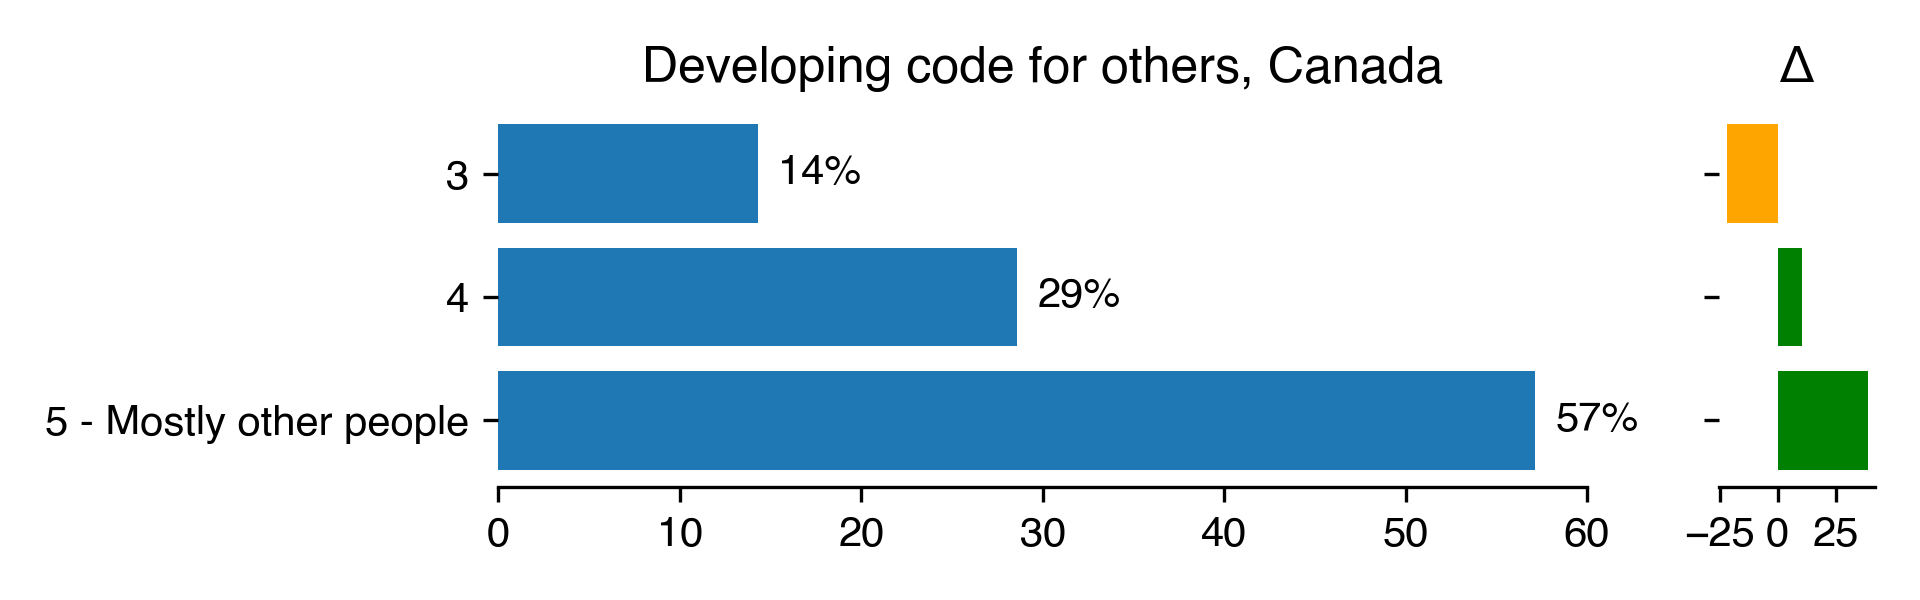
| Developing code for others for Canada |
Count |
Percentage |
Percentage in 2018 |
Difference with previous year |
| 3 |
1 |
14.29 |
36.36 |
-22.08 |
| 4 |
2 |
28.57 |
18.18 |
10.39 |
| 5 - Mostly other people |
4 |
57.14 |
18.18 |
38.96 |
Download CSV
PNG SVG
Working with same researchers
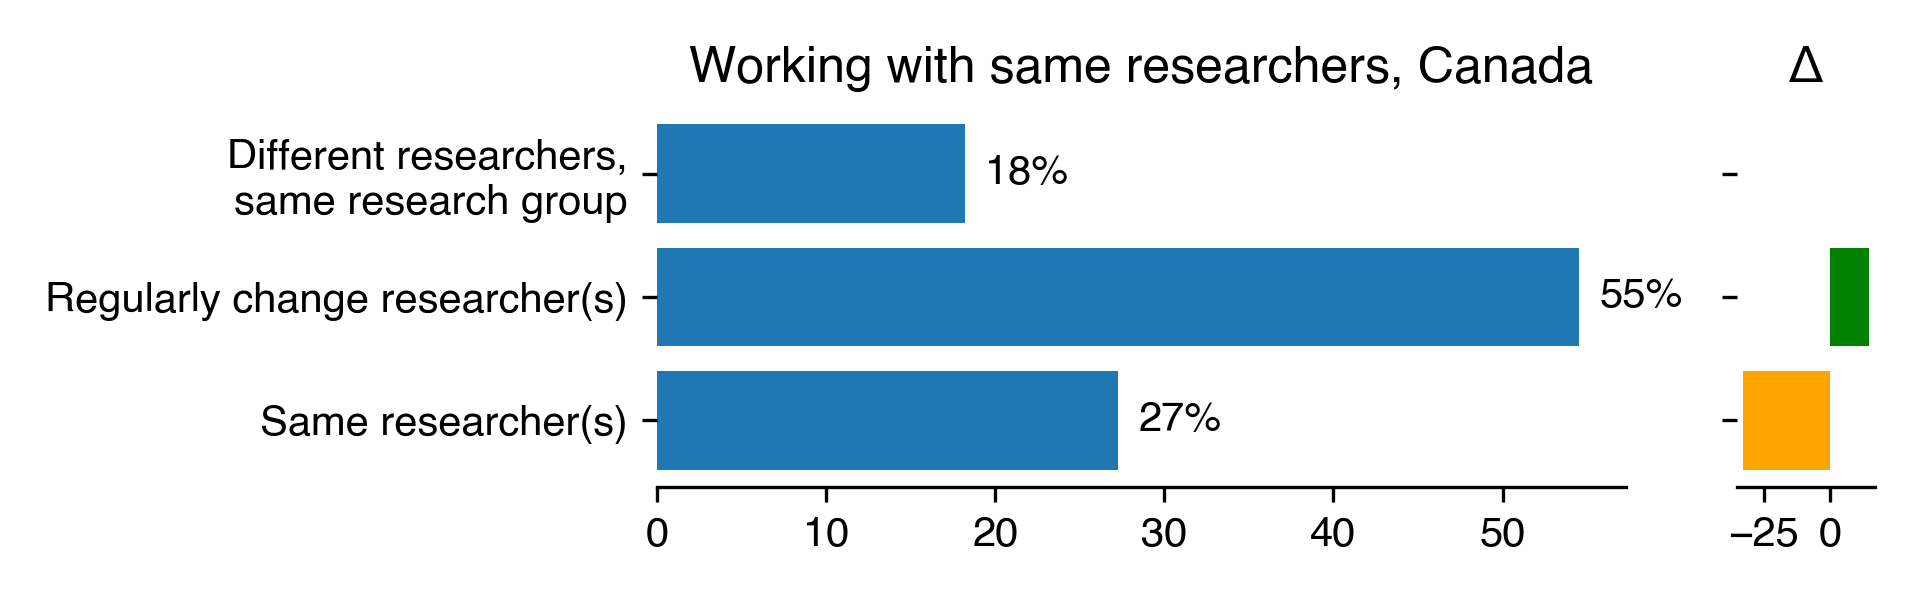
| Working with same researchers for Canada |
Count |
Percentage |
Percentage in 2018 |
Difference with previous year |
| Different researchers, same research group |
2 |
18.18 |
nan |
nan |
| Regularly change researcher(s) |
6 |
54.55 |
40 |
14.55 |
| Same researcher(s) |
3 |
27.27 |
60 |
-32.73 |
Download CSV
PNG SVG
Part of dedicated group
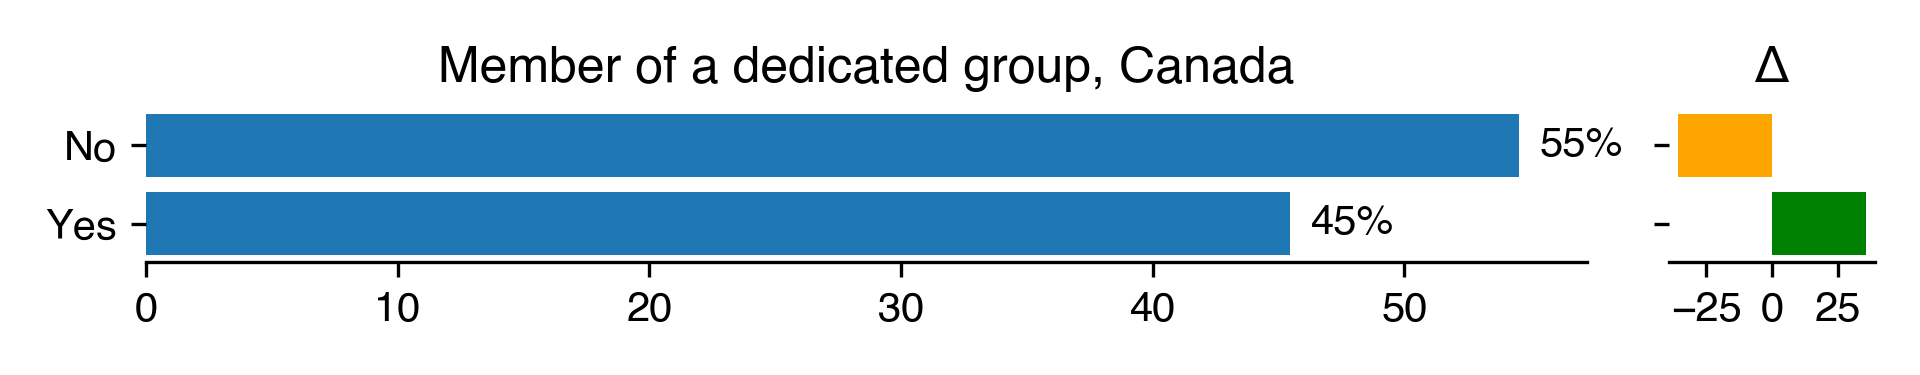
| Member of a dedicated group for Canada |
Count |
Percentage |
Percentage in 2018 |
Difference with previous year |
| No |
6 |
54.55 |
90 |
-35.45 |
| Yes |
5 |
45.45 |
10 |
35.45 |
Download CSV
PNG SVG
Number of projects
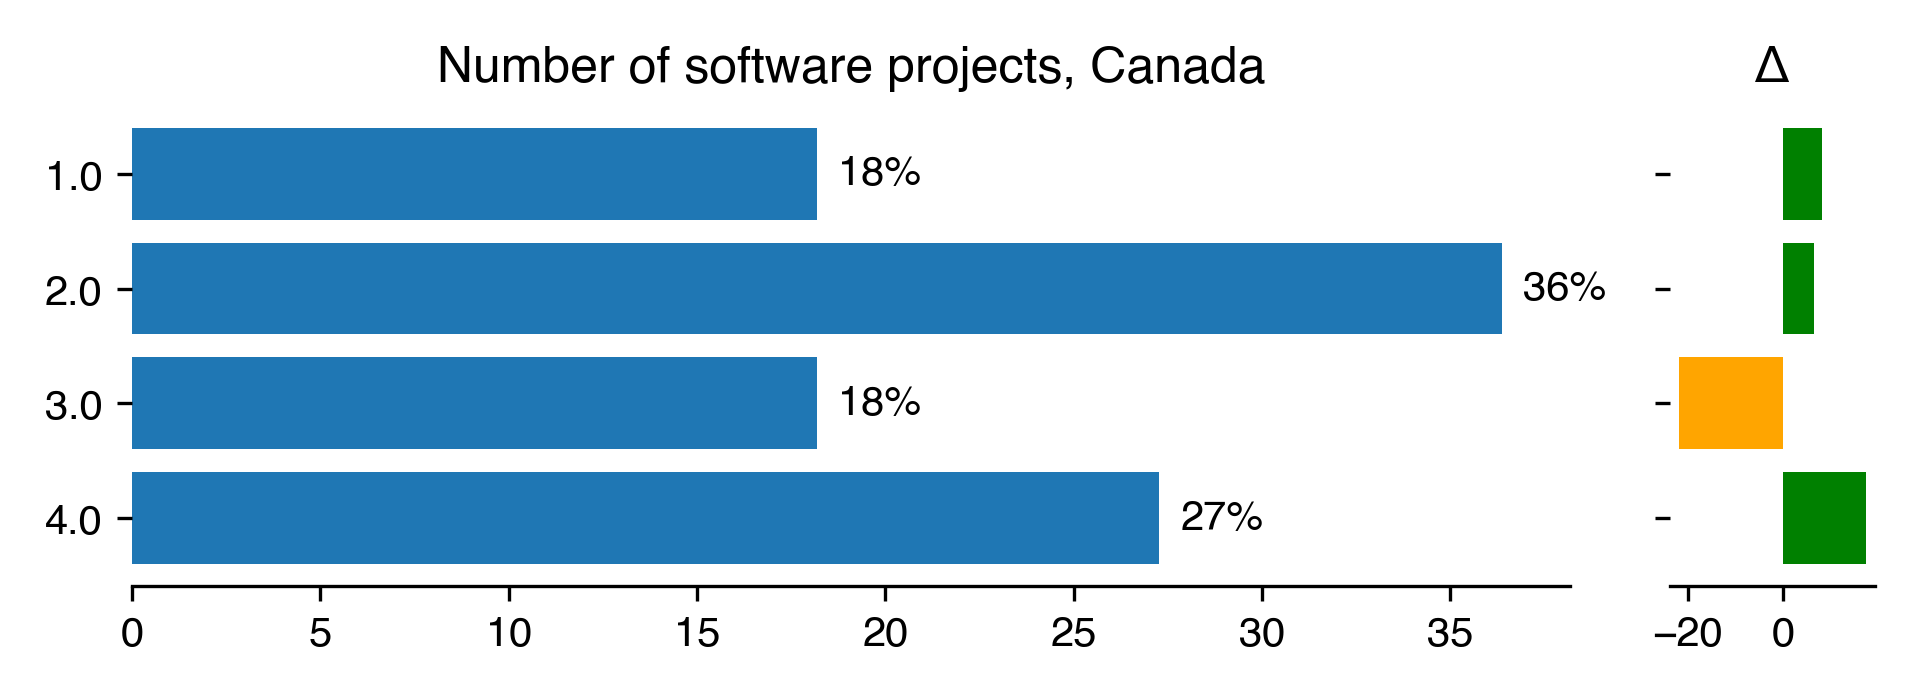
| Number of software projects for Canada |
Count |
Percentage |
Percentage in 2018 |
Difference with previous year |
| 1 |
2 |
18.18 |
10 |
8.18 |
| 2 |
4 |
36.36 |
30 |
6.36 |
| 3 |
2 |
18.18 |
40 |
-21.82 |
| 4 |
3 |
27.27 |
10 |
17.27 |
Download CSV
PNG SVG
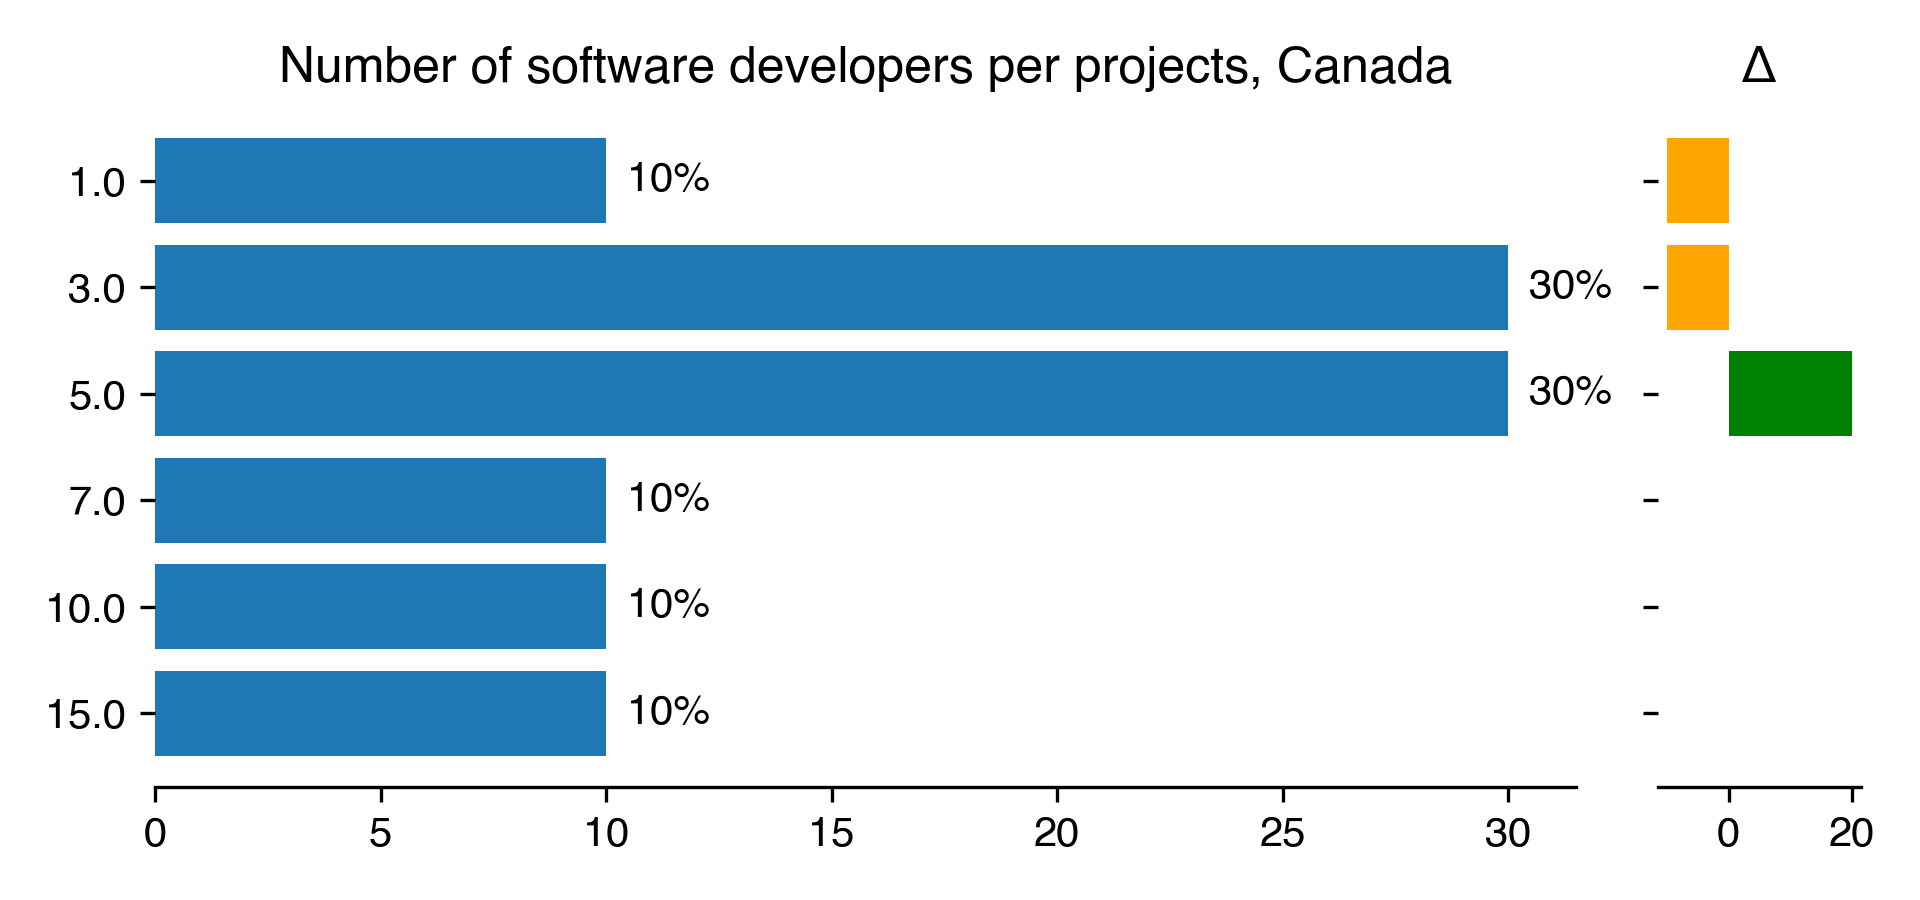
| Number of software developers per projects for Canada |
Count |
Percentage |
Percentage in 2018 |
Difference with previous year |
| 1 |
1 |
10 |
20 |
-10 |
| 3 |
3 |
30 |
40 |
-10 |
| 5 |
3 |
30 |
10 |
20 |
| 7 |
1 |
10 |
nan |
nan |
| 10 |
1 |
10 |
nan |
nan |
| 15 |
1 |
10 |
nan |
nan |
Download CSV
PNG SVG
Training
| Number of time per year providing training for Canada (without 95 percentile) |
Results in 2022 |
| count |
0 |
| mean |
nan |
| std |
nan |
| min |
nan |
| 25% |
nan |
| 50% |
nan |
| 75% |
nan |
| max |
nan |
Download CSV
PNG SVG
PNG SVG
Germany
Developing code for others
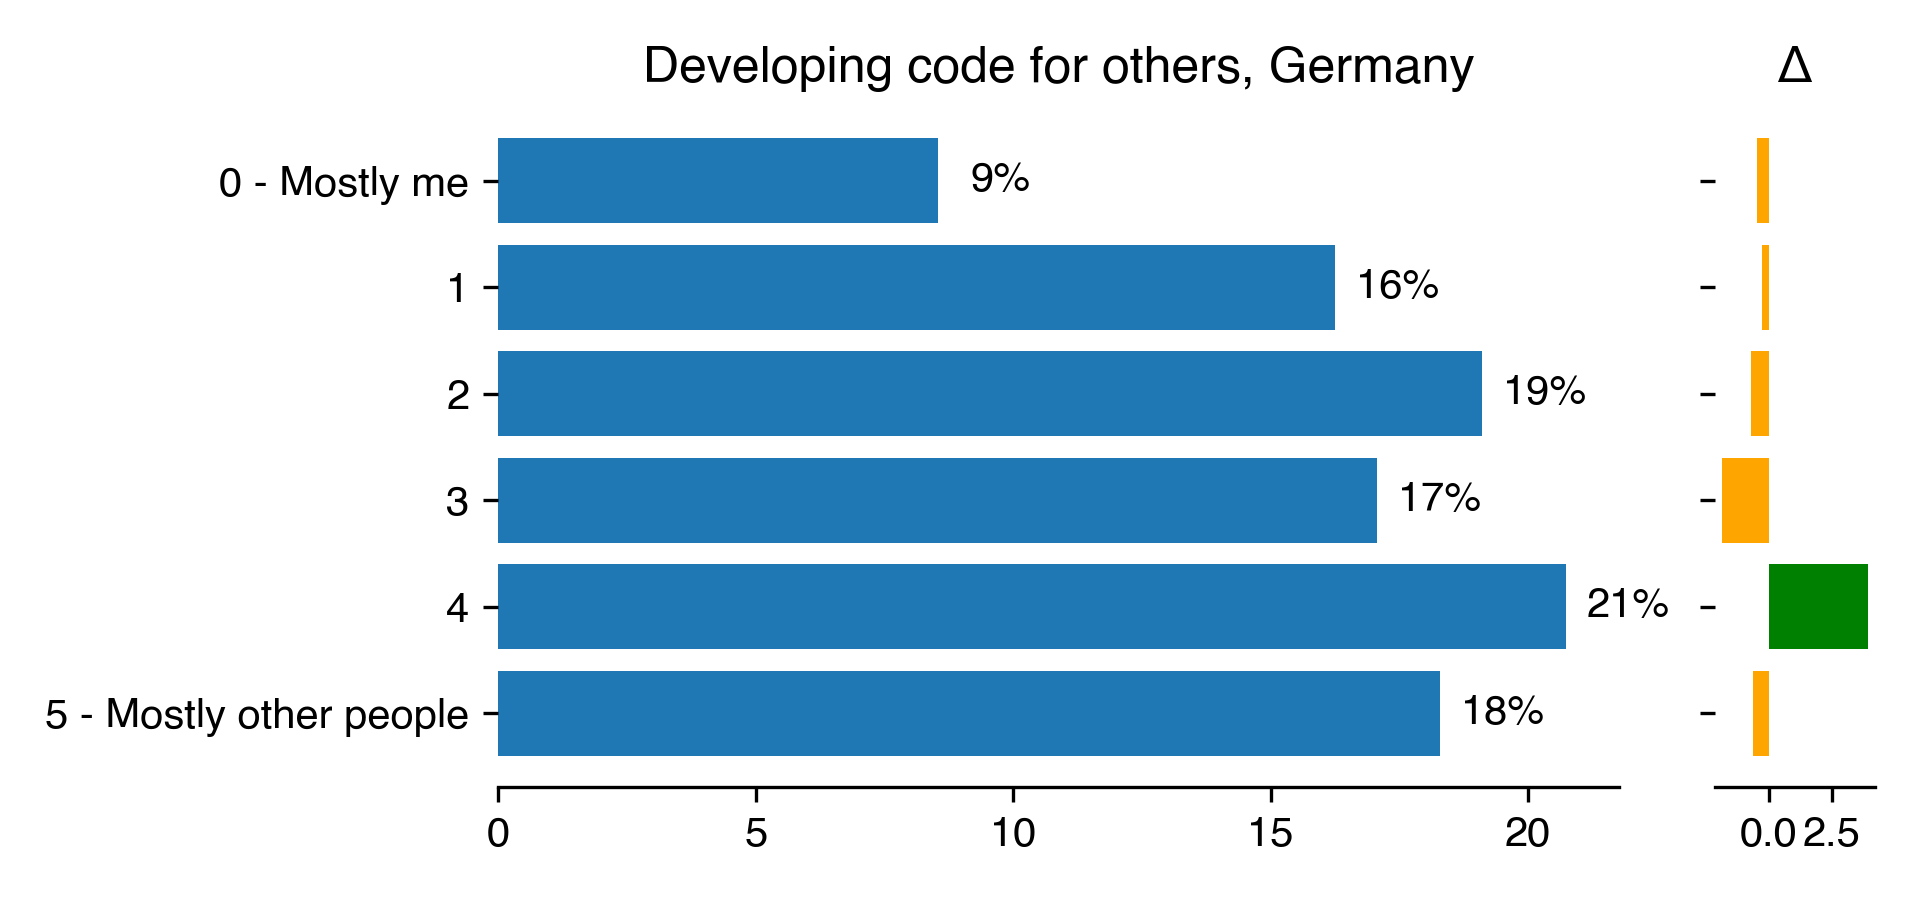
| Developing code for others for Germany |
Count |
Percentage |
Percentage in 2018 |
Difference with previous year |
| 0 - Mostly me |
21 |
8.54 |
9.01 |
-0.47 |
| 1 |
40 |
16.26 |
16.52 |
-0.26 |
| 2 |
47 |
19.11 |
19.82 |
-0.71 |
| 3 |
42 |
17.07 |
18.92 |
-1.85 |
| 4 |
51 |
20.73 |
16.82 |
3.91 |
| 5 - Mostly other people |
45 |
18.29 |
18.92 |
-0.63 |
Download CSV
PNG SVG
Working with same researchers
| Working with same researchers for Germany |
Count |
Percentage |
Percentage in 2018 |
Difference with previous year |
| Different researchers, same research group |
34 |
15.67 |
17.97 |
-2.3 |
| Regularly change researcher(s) |
89 |
41.01 |
33.22 |
7.79 |
| Same researcher(s) |
94 |
43.32 |
48.81 |
-5.5 |
Download CSV
PNG SVG
Part of dedicated group
| Member of a dedicated group for Germany |
Count |
Percentage |
Percentage in 2018 |
Difference with previous year |
| No |
53 |
24.42 |
38.85 |
-14.43 |
| Yes |
164 |
75.58 |
61.15 |
14.43 |
Download CSV
PNG SVG
Number of projects
| Number of software projects for Germany |
Count |
Percentage |
Percentage in 2018 |
Difference with previous year |
| 0 |
3 |
1.4 |
1.43 |
-0.03 |
| 1 |
39 |
18.22 |
17.14 |
1.08 |
| 2 |
60 |
28.04 |
30 |
-1.96 |
| 3 |
54 |
25.23 |
27.5 |
-2.27 |
| 4 |
19 |
8.88 |
11.43 |
-2.55 |
| 5 |
22 |
10.28 |
7.14 |
3.14 |
| 6 |
3 |
1.4 |
2.5 |
-1.1 |
| 7 |
2 |
0.93 |
0.36 |
0.58 |
| 8 |
1 |
0.47 |
1.07 |
-0.6 |
| 10 |
4 |
1.87 |
0.71 |
1.15 |
| 15 |
7 |
3.27 |
nan |
nan |
Download CSV
PNG SVG
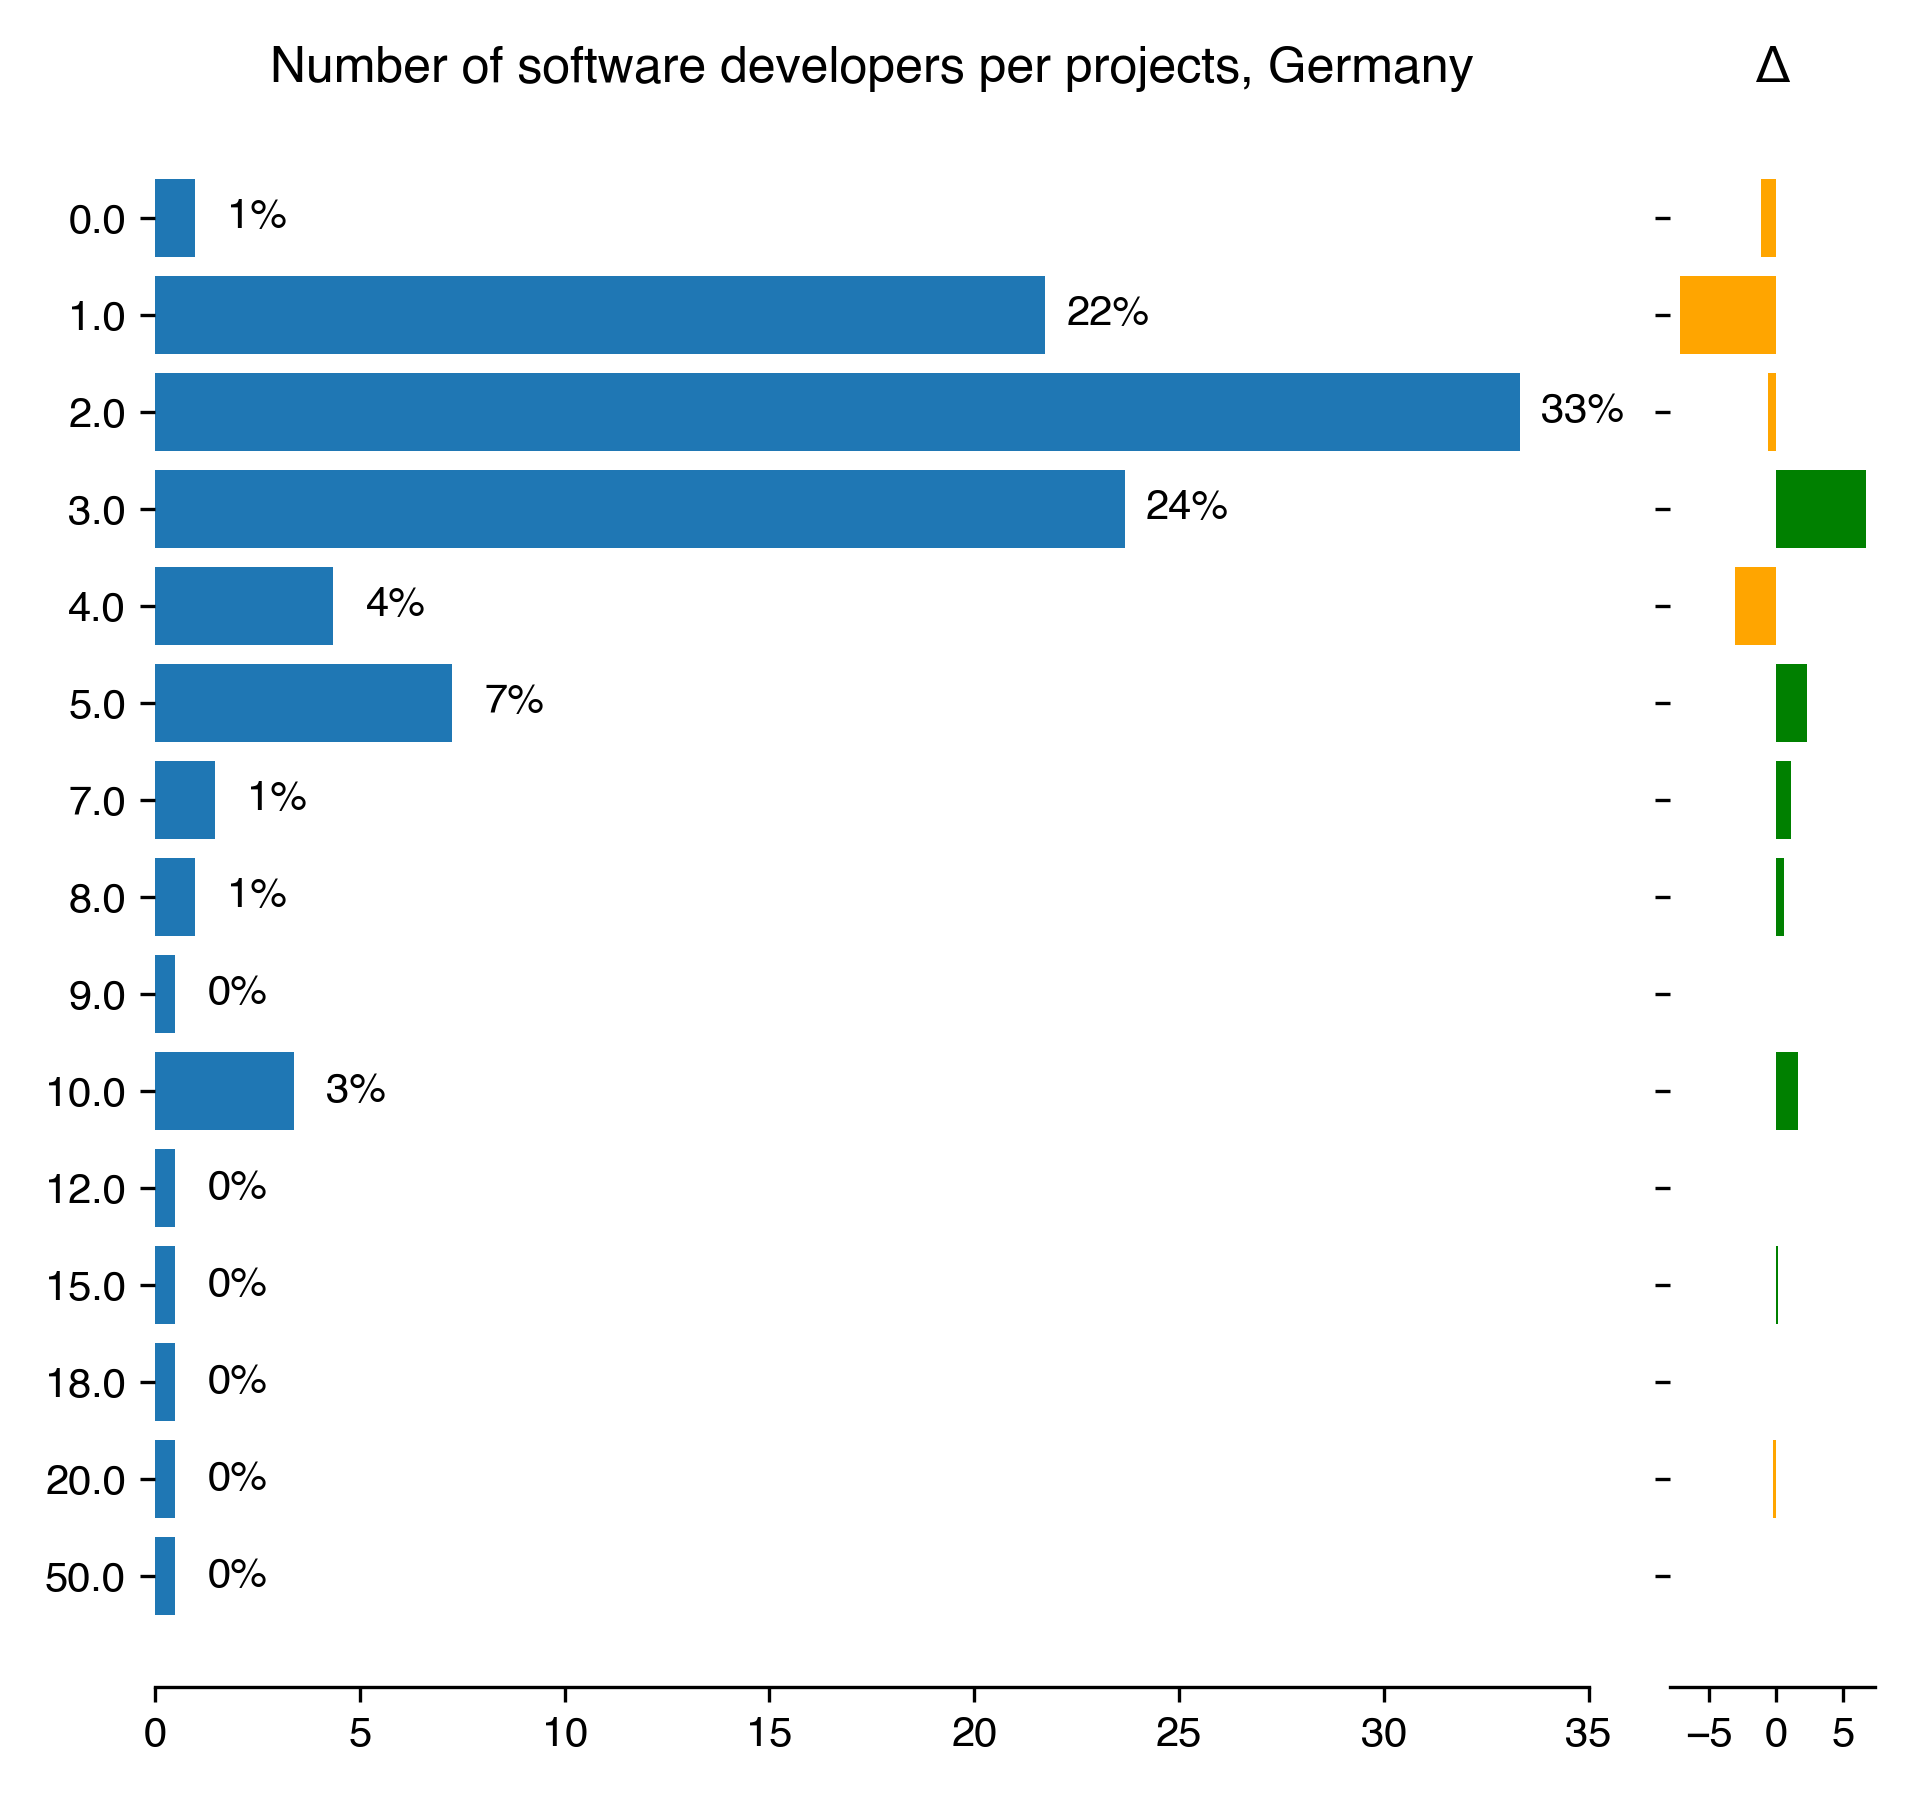
| Number of software developers per projects for Germany |
Count |
Percentage |
Percentage in 2018 |
Difference with previous year |
| 0 |
2 |
0.97 |
2.12 |
-1.15 |
| 1 |
45 |
21.74 |
28.98 |
-7.24 |
| 2 |
69 |
33.33 |
33.92 |
-0.59 |
| 3 |
49 |
23.67 |
16.96 |
6.71 |
| 4 |
9 |
4.35 |
7.42 |
-3.07 |
| 5 |
15 |
7.25 |
4.95 |
2.3 |
| 7 |
3 |
1.45 |
0.35 |
1.1 |
| 8 |
2 |
0.97 |
0.35 |
0.61 |
| 9 |
1 |
0.48 |
nan |
nan |
| 10 |
7 |
3.38 |
1.77 |
1.61 |
| 12 |
1 |
0.48 |
nan |
nan |
| 15 |
1 |
0.48 |
0.35 |
0.13 |
| 18 |
1 |
0.48 |
nan |
nan |
| 20 |
1 |
0.48 |
0.71 |
-0.22 |
| 50 |
1 |
0.48 |
nan |
nan |
Download CSV
PNG SVG
Training
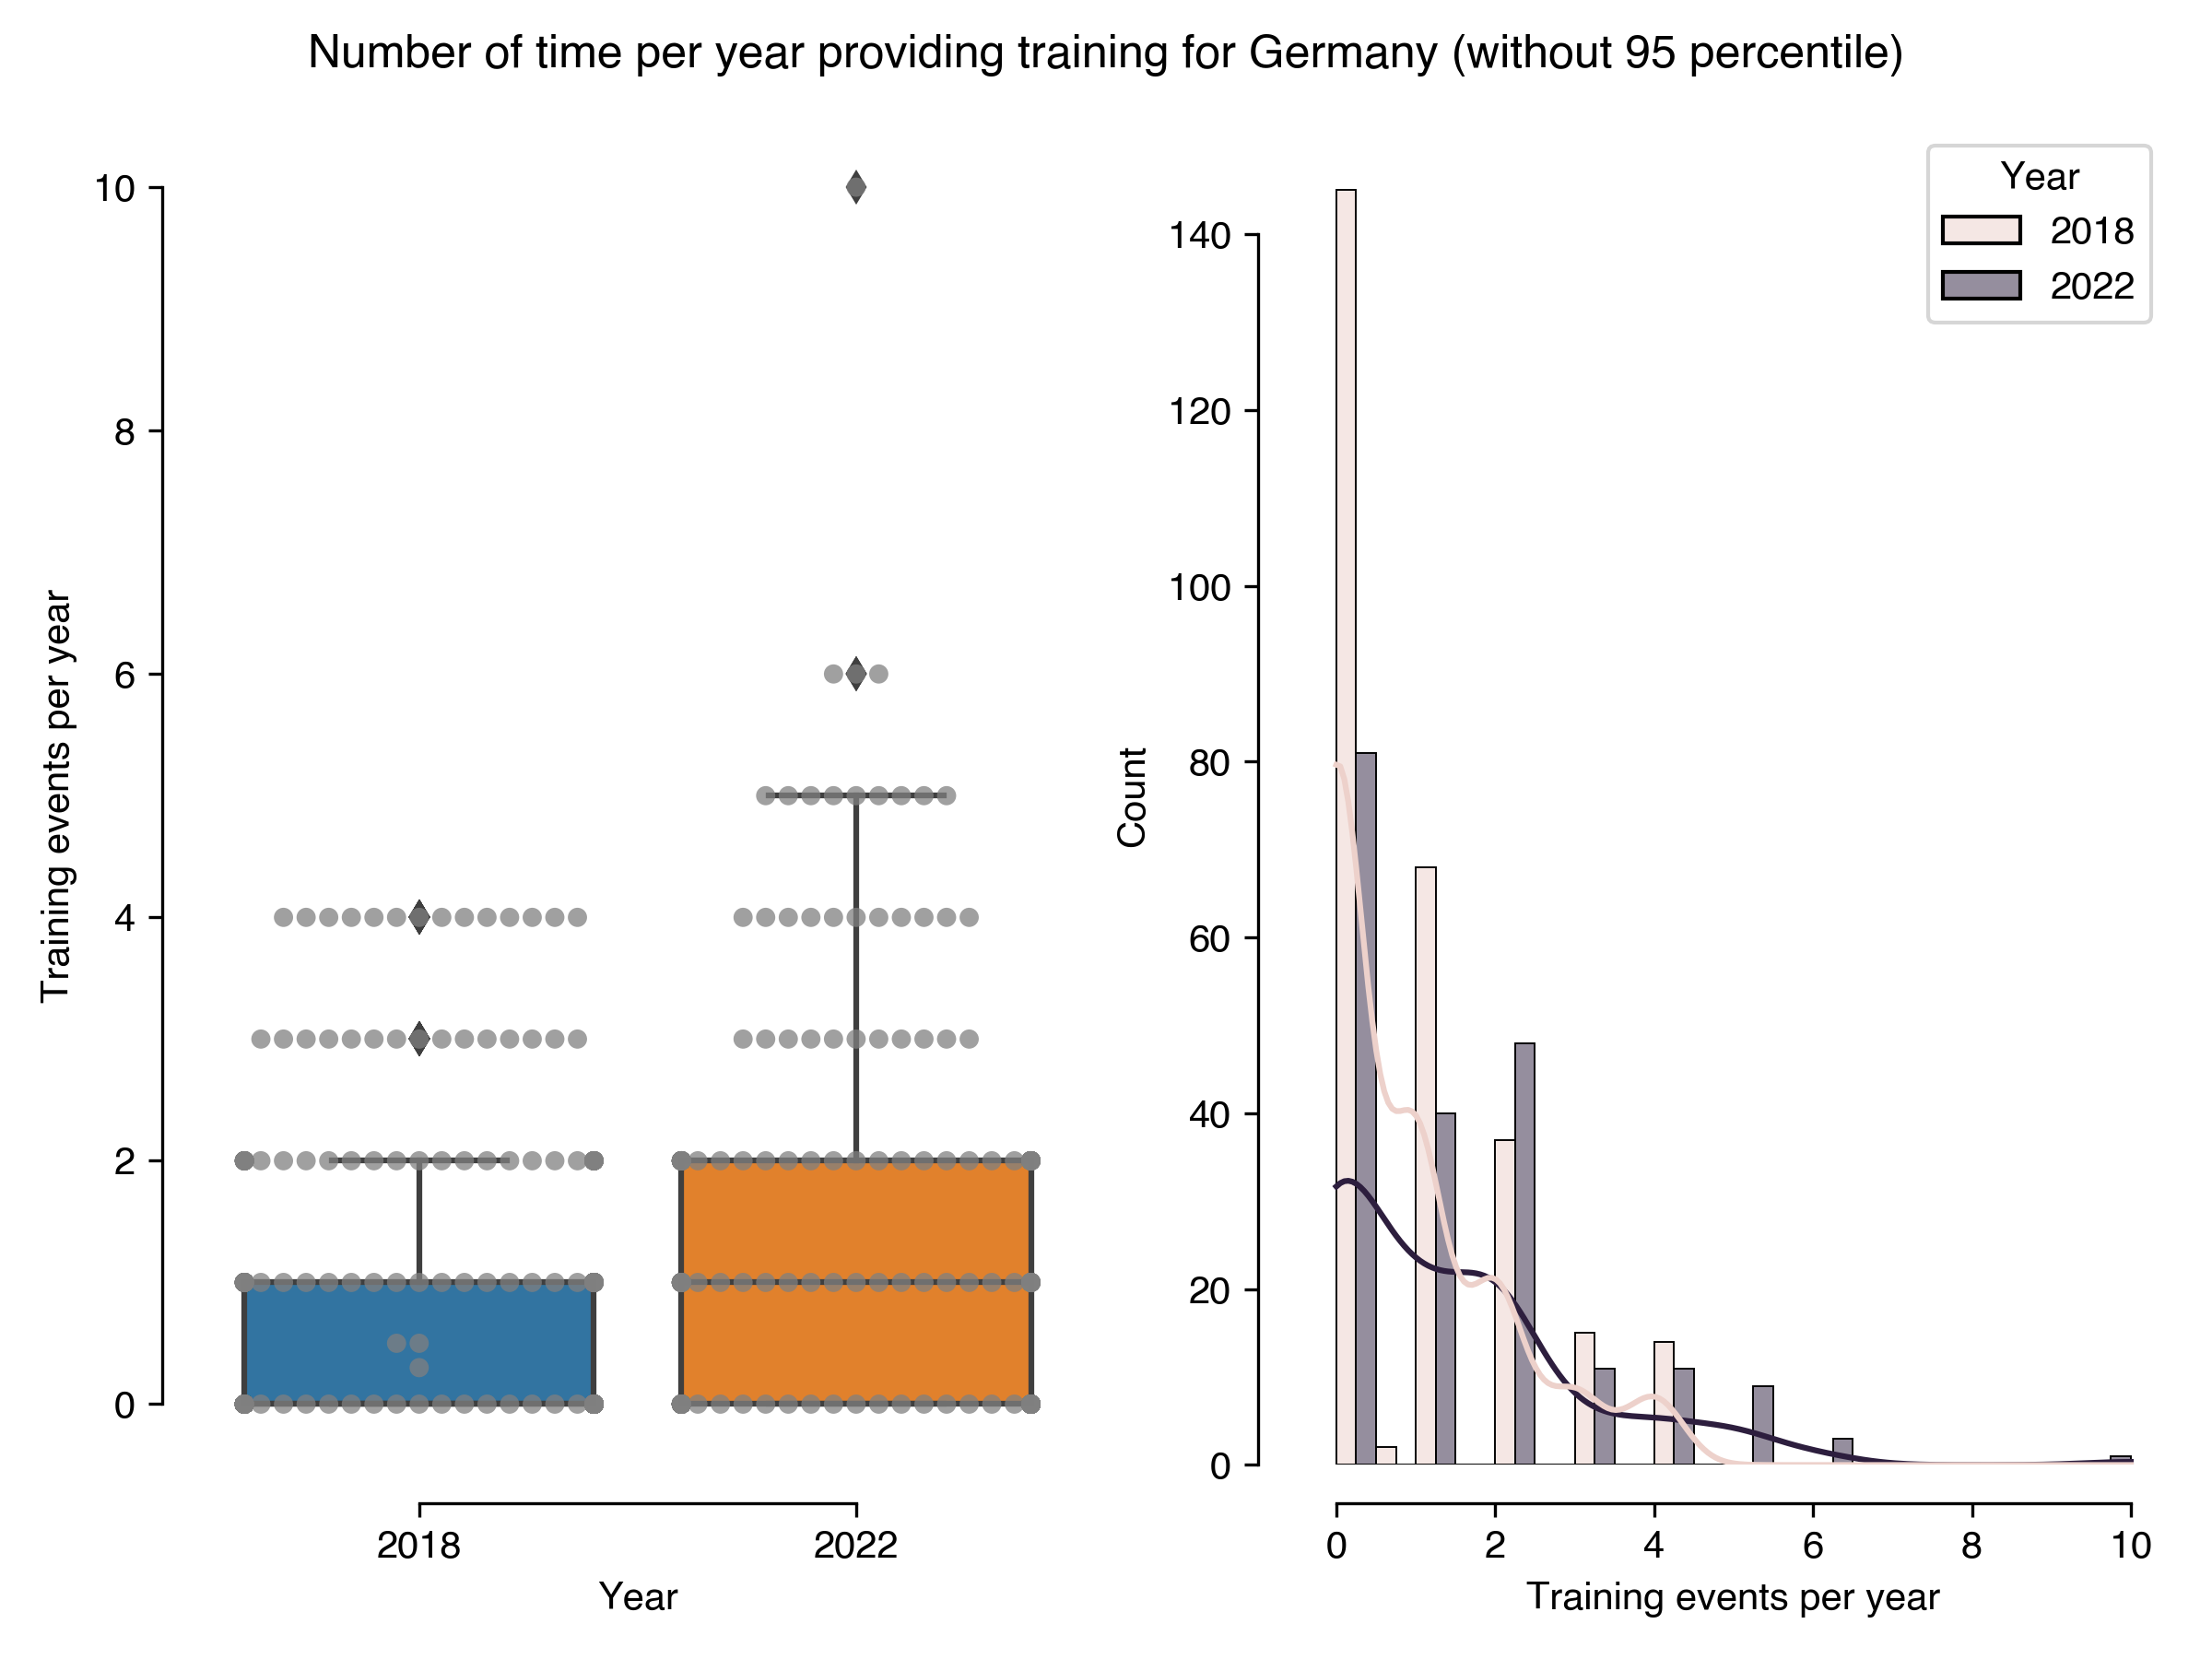
| Number of time per year providing training for Germany (without 95 percentile) |
Results in 2022 |
Results in 2018 |
| count |
204 |
281 |
| mean |
1.4 |
0.87 |
| std |
1.63 |
1.14 |
| min |
0 |
0 |
| 25% |
0 |
0 |
| 50% |
1 |
0 |
| 75% |
2 |
1 |
| max |
10 |
4 |
Download CSV
PNG SVG
PNG SVG
Netherlands
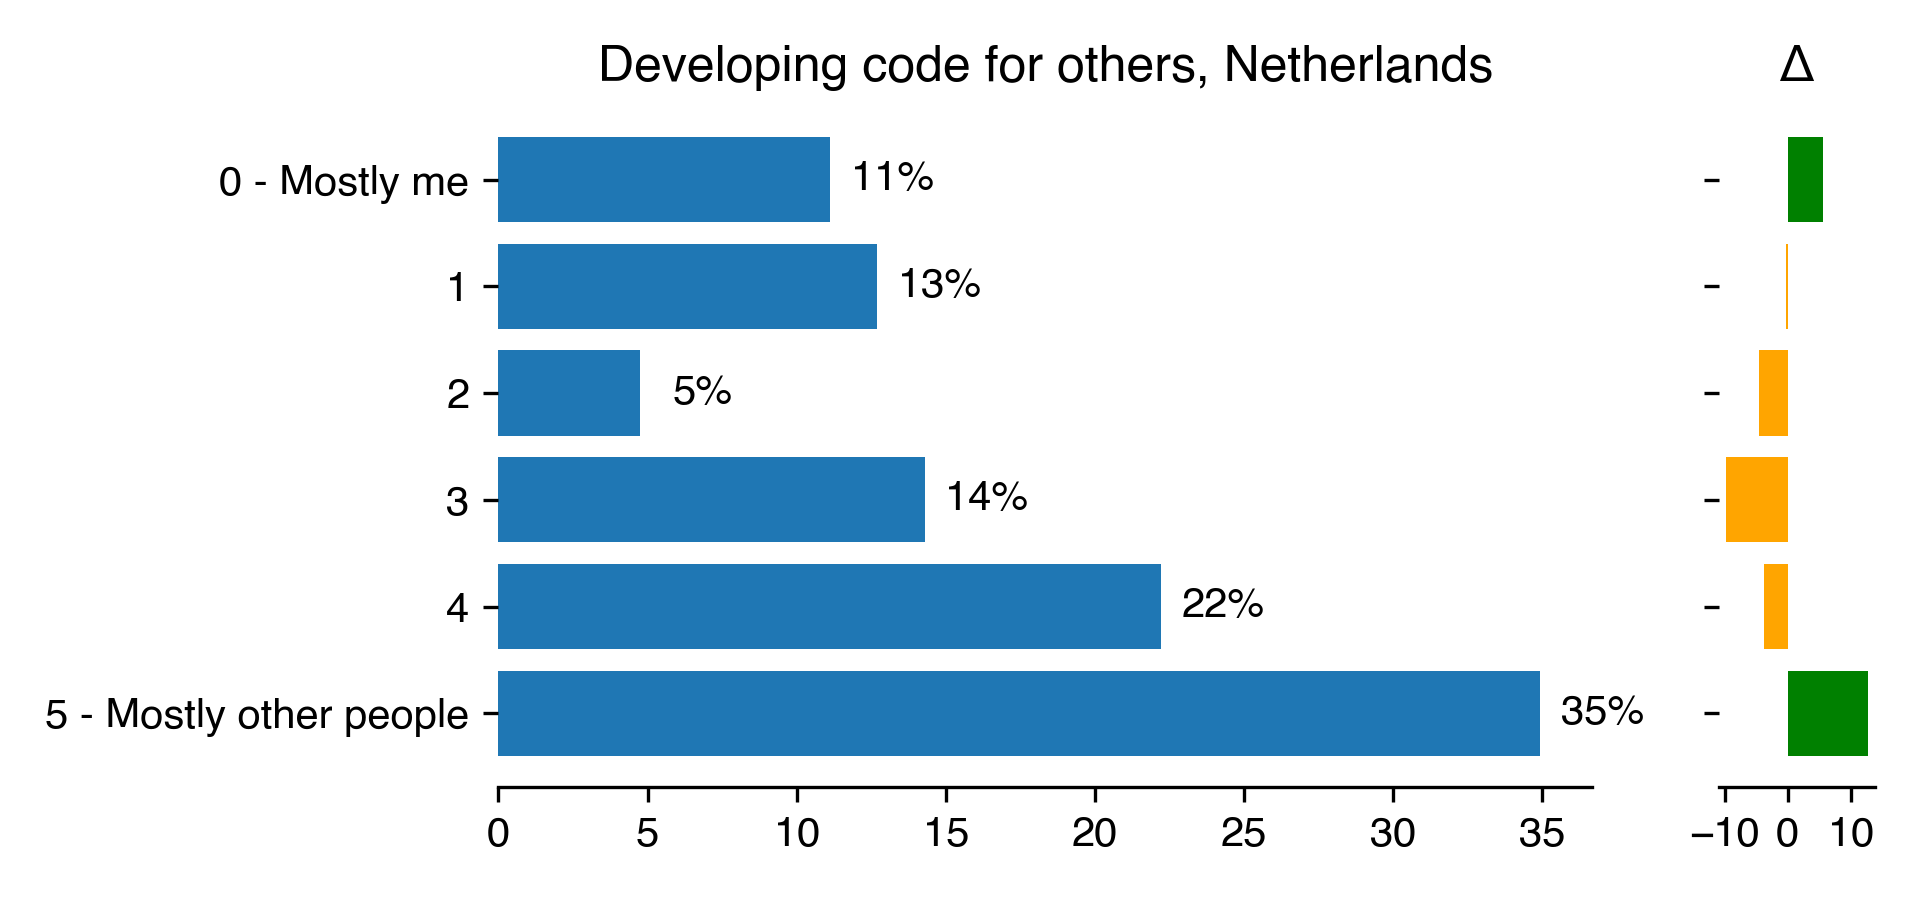
Developing code for others
| Developing code for others for Netherlands |
Count |
Percentage |
Percentage in 2018 |
Difference with previous year |
| 0 - Mostly me |
7 |
11.11 |
5.56 |
5.56 |
| 1 |
8 |
12.7 |
12.96 |
-0.26 |
| 2 |
3 |
4.76 |
9.26 |
-4.5 |
| 3 |
9 |
14.29 |
24.07 |
-9.79 |
| 4 |
14 |
22.22 |
25.93 |
-3.7 |
| 5 - Mostly other people |
22 |
34.92 |
22.22 |
12.7 |
Download CSV
PNG SVG
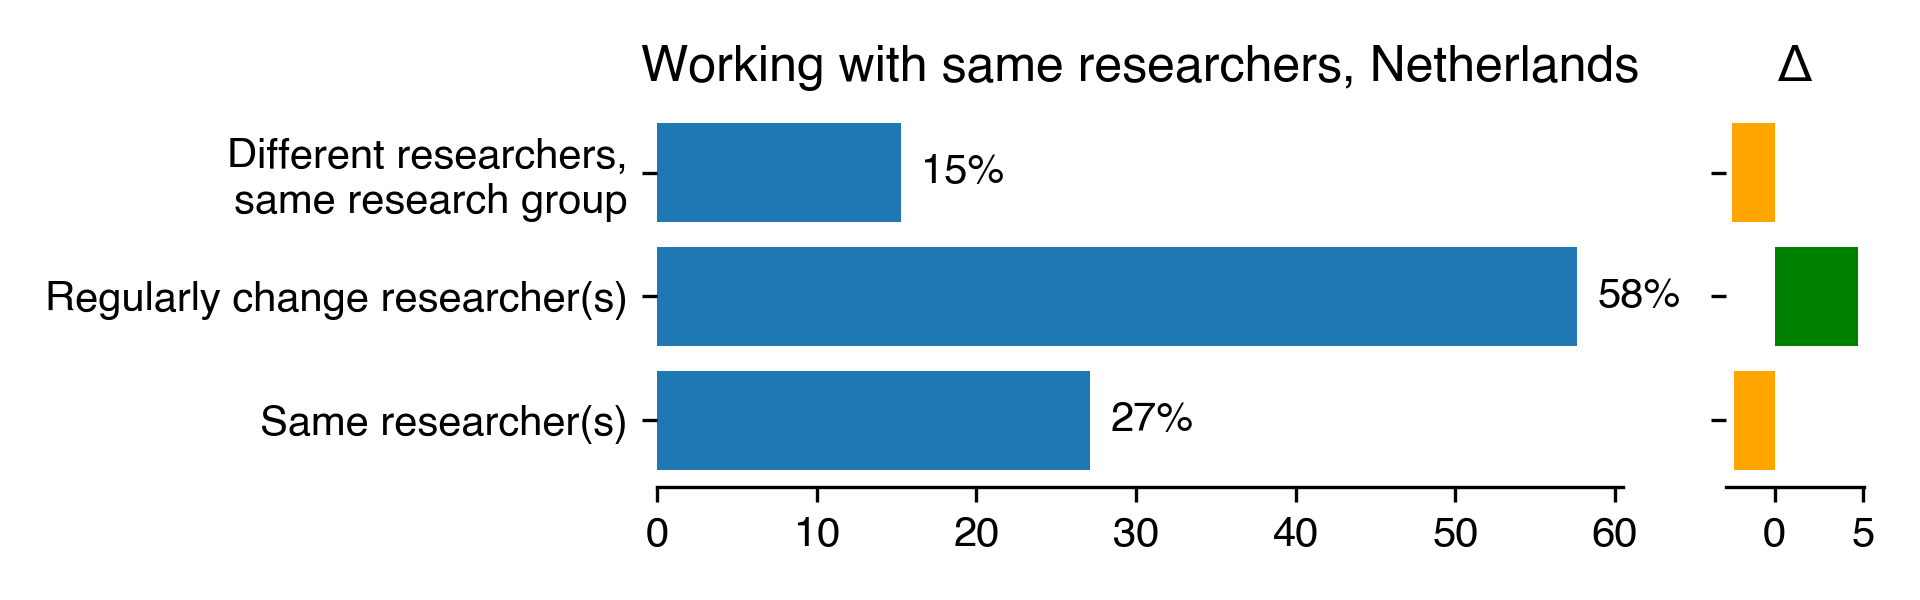
Working with same researchers
| Working with same researchers for Netherlands |
Count |
Percentage |
Percentage in 2018 |
Difference with previous year |
| Different researchers, same research group |
9 |
15.25 |
17.65 |
-2.39 |
| Regularly change researcher(s) |
34 |
57.63 |
52.94 |
4.69 |
| Same researcher(s) |
16 |
27.12 |
29.41 |
-2.29 |
Download CSV
PNG SVG
Part of dedicated group
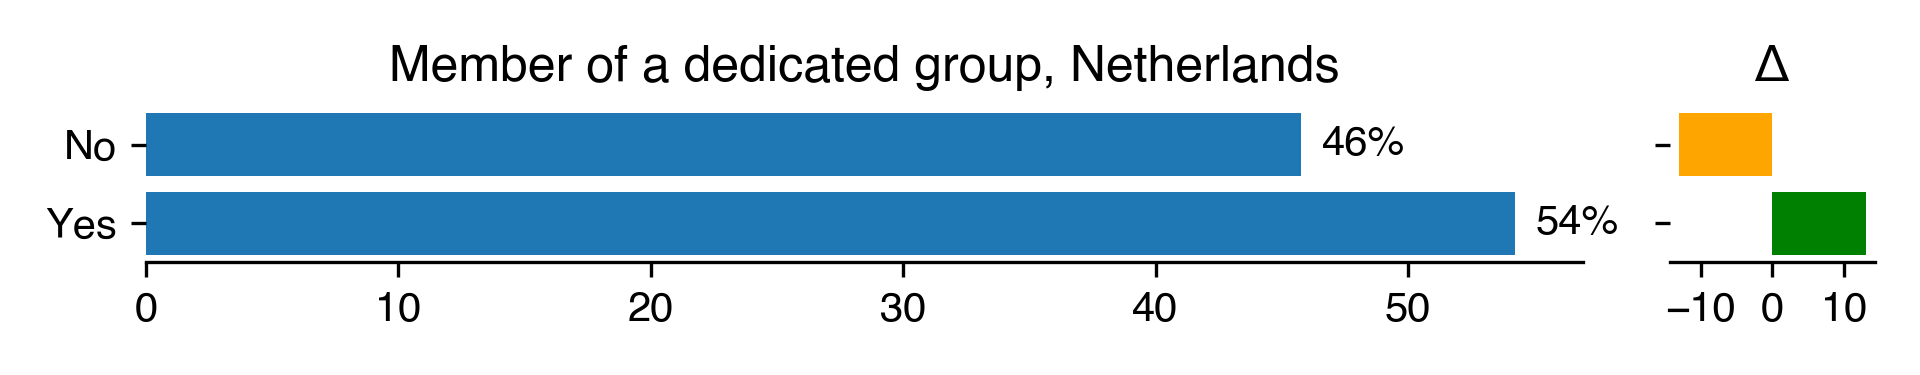
| Member of a dedicated group for Netherlands |
Count |
Percentage |
Percentage in 2018 |
Difference with previous year |
| No |
27 |
45.76 |
58.82 |
-13.06 |
| Yes |
32 |
54.24 |
41.18 |
13.06 |
Download CSV
PNG SVG
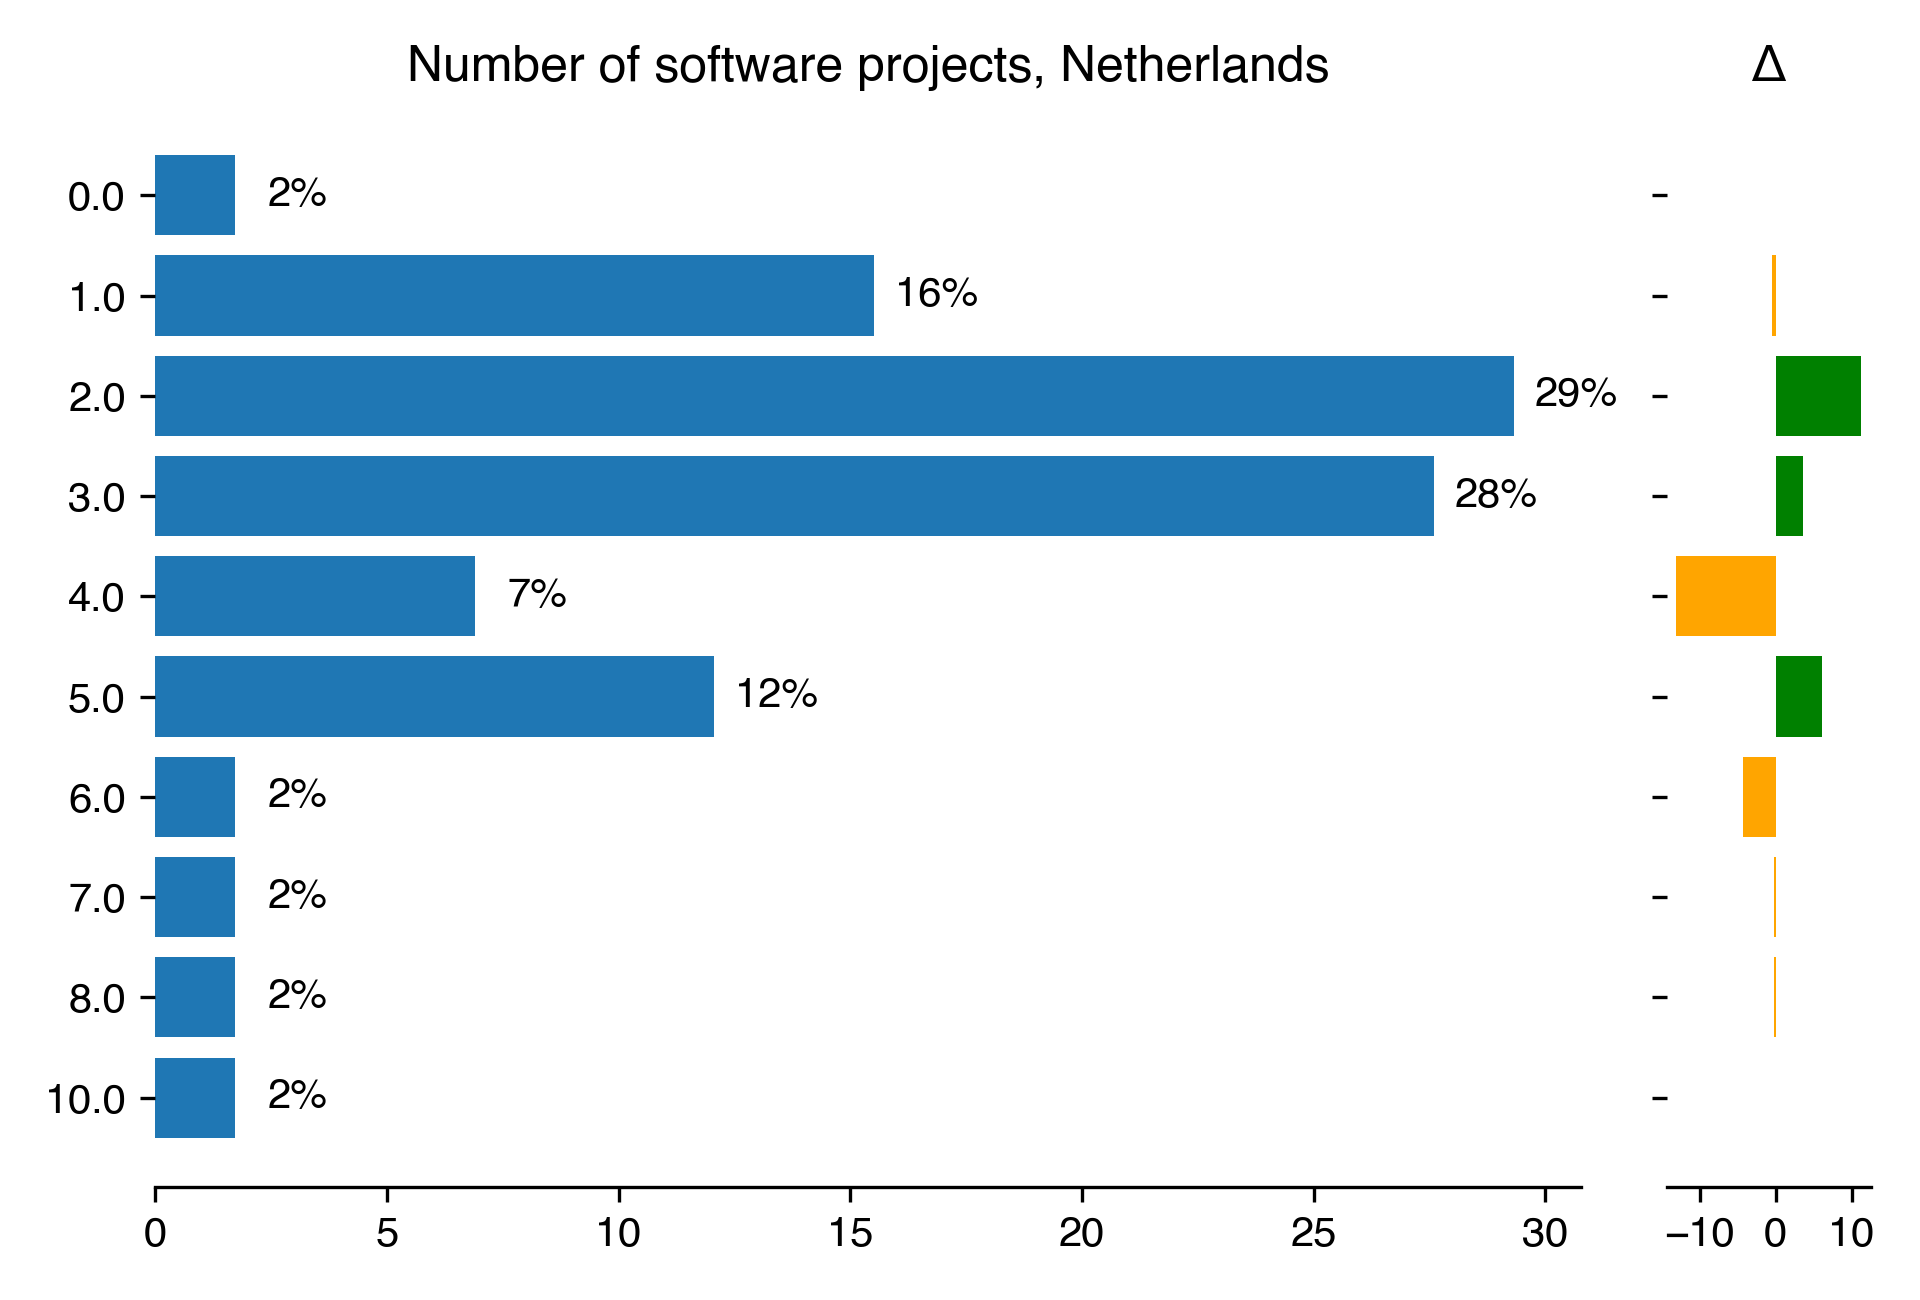
Number of projects
| Number of software projects for Netherlands |
Count |
Percentage |
Percentage in 2018 |
Difference with previous year |
| 0 |
1 |
1.72 |
nan |
nan |
| 1 |
9 |
15.52 |
16 |
-0.48 |
| 2 |
17 |
29.31 |
18 |
11.31 |
| 3 |
16 |
27.59 |
24 |
3.59 |
| 4 |
4 |
6.9 |
20 |
-13.1 |
| 5 |
7 |
12.07 |
6 |
6.07 |
| 6 |
1 |
1.72 |
6 |
-4.28 |
| 7 |
1 |
1.72 |
2 |
-0.28 |
| 8 |
1 |
1.72 |
2 |
-0.28 |
| 10 |
1 |
1.72 |
nan |
nan |
Download CSV
PNG SVG
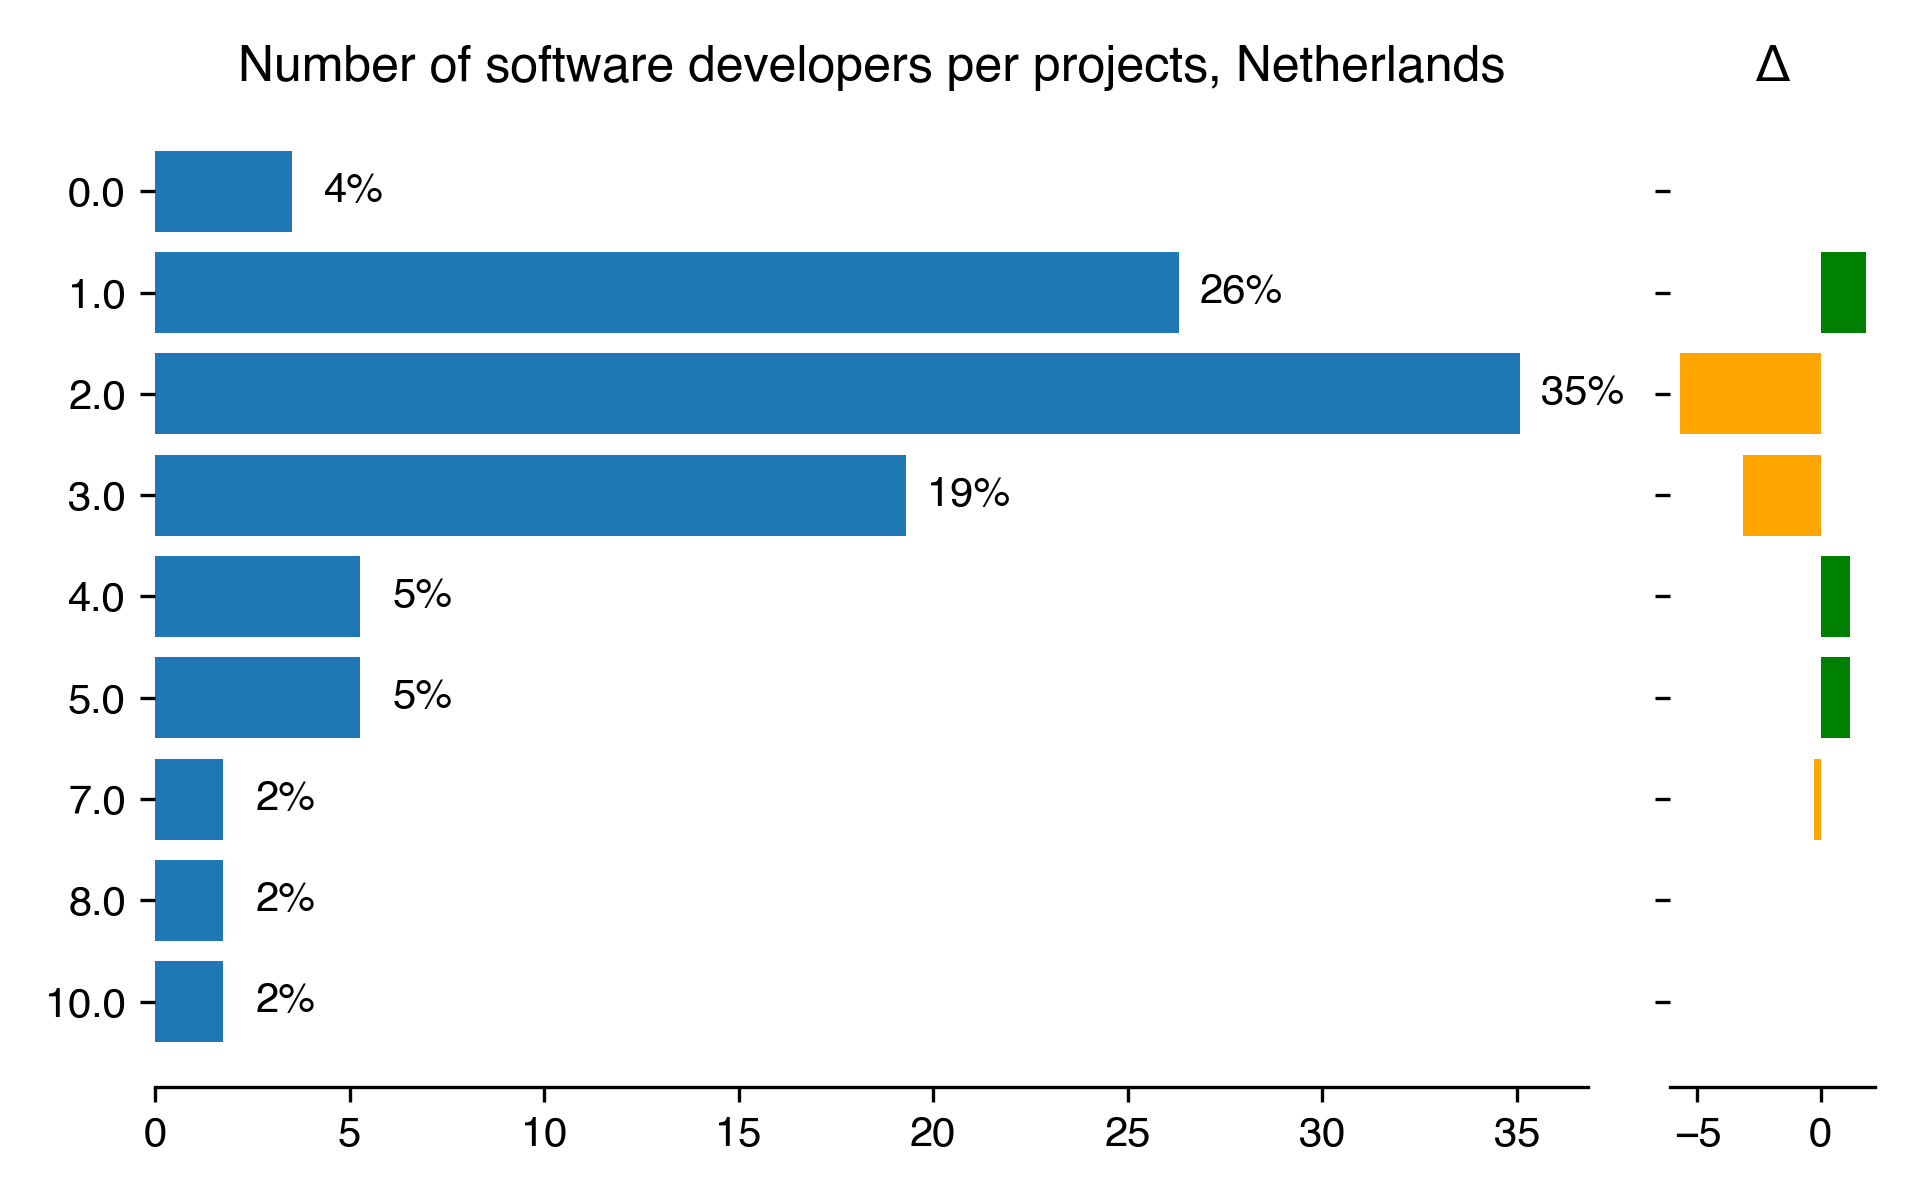
| Number of software developers per projects for Netherlands |
Count |
Percentage |
Percentage in 2018 |
Difference with previous year |
| 0 |
2 |
3.51 |
nan |
nan |
| 1 |
15 |
26.32 |
24.49 |
1.83 |
| 2 |
20 |
35.09 |
40.82 |
-5.73 |
| 3 |
11 |
19.3 |
22.45 |
-3.15 |
| 4 |
3 |
5.26 |
4.08 |
1.18 |
| 5 |
3 |
5.26 |
4.08 |
1.18 |
| 7 |
1 |
1.75 |
2.04 |
-0.29 |
| 8 |
1 |
1.75 |
nan |
nan |
| 10 |
1 |
1.75 |
nan |
nan |
Download CSV
PNG SVG
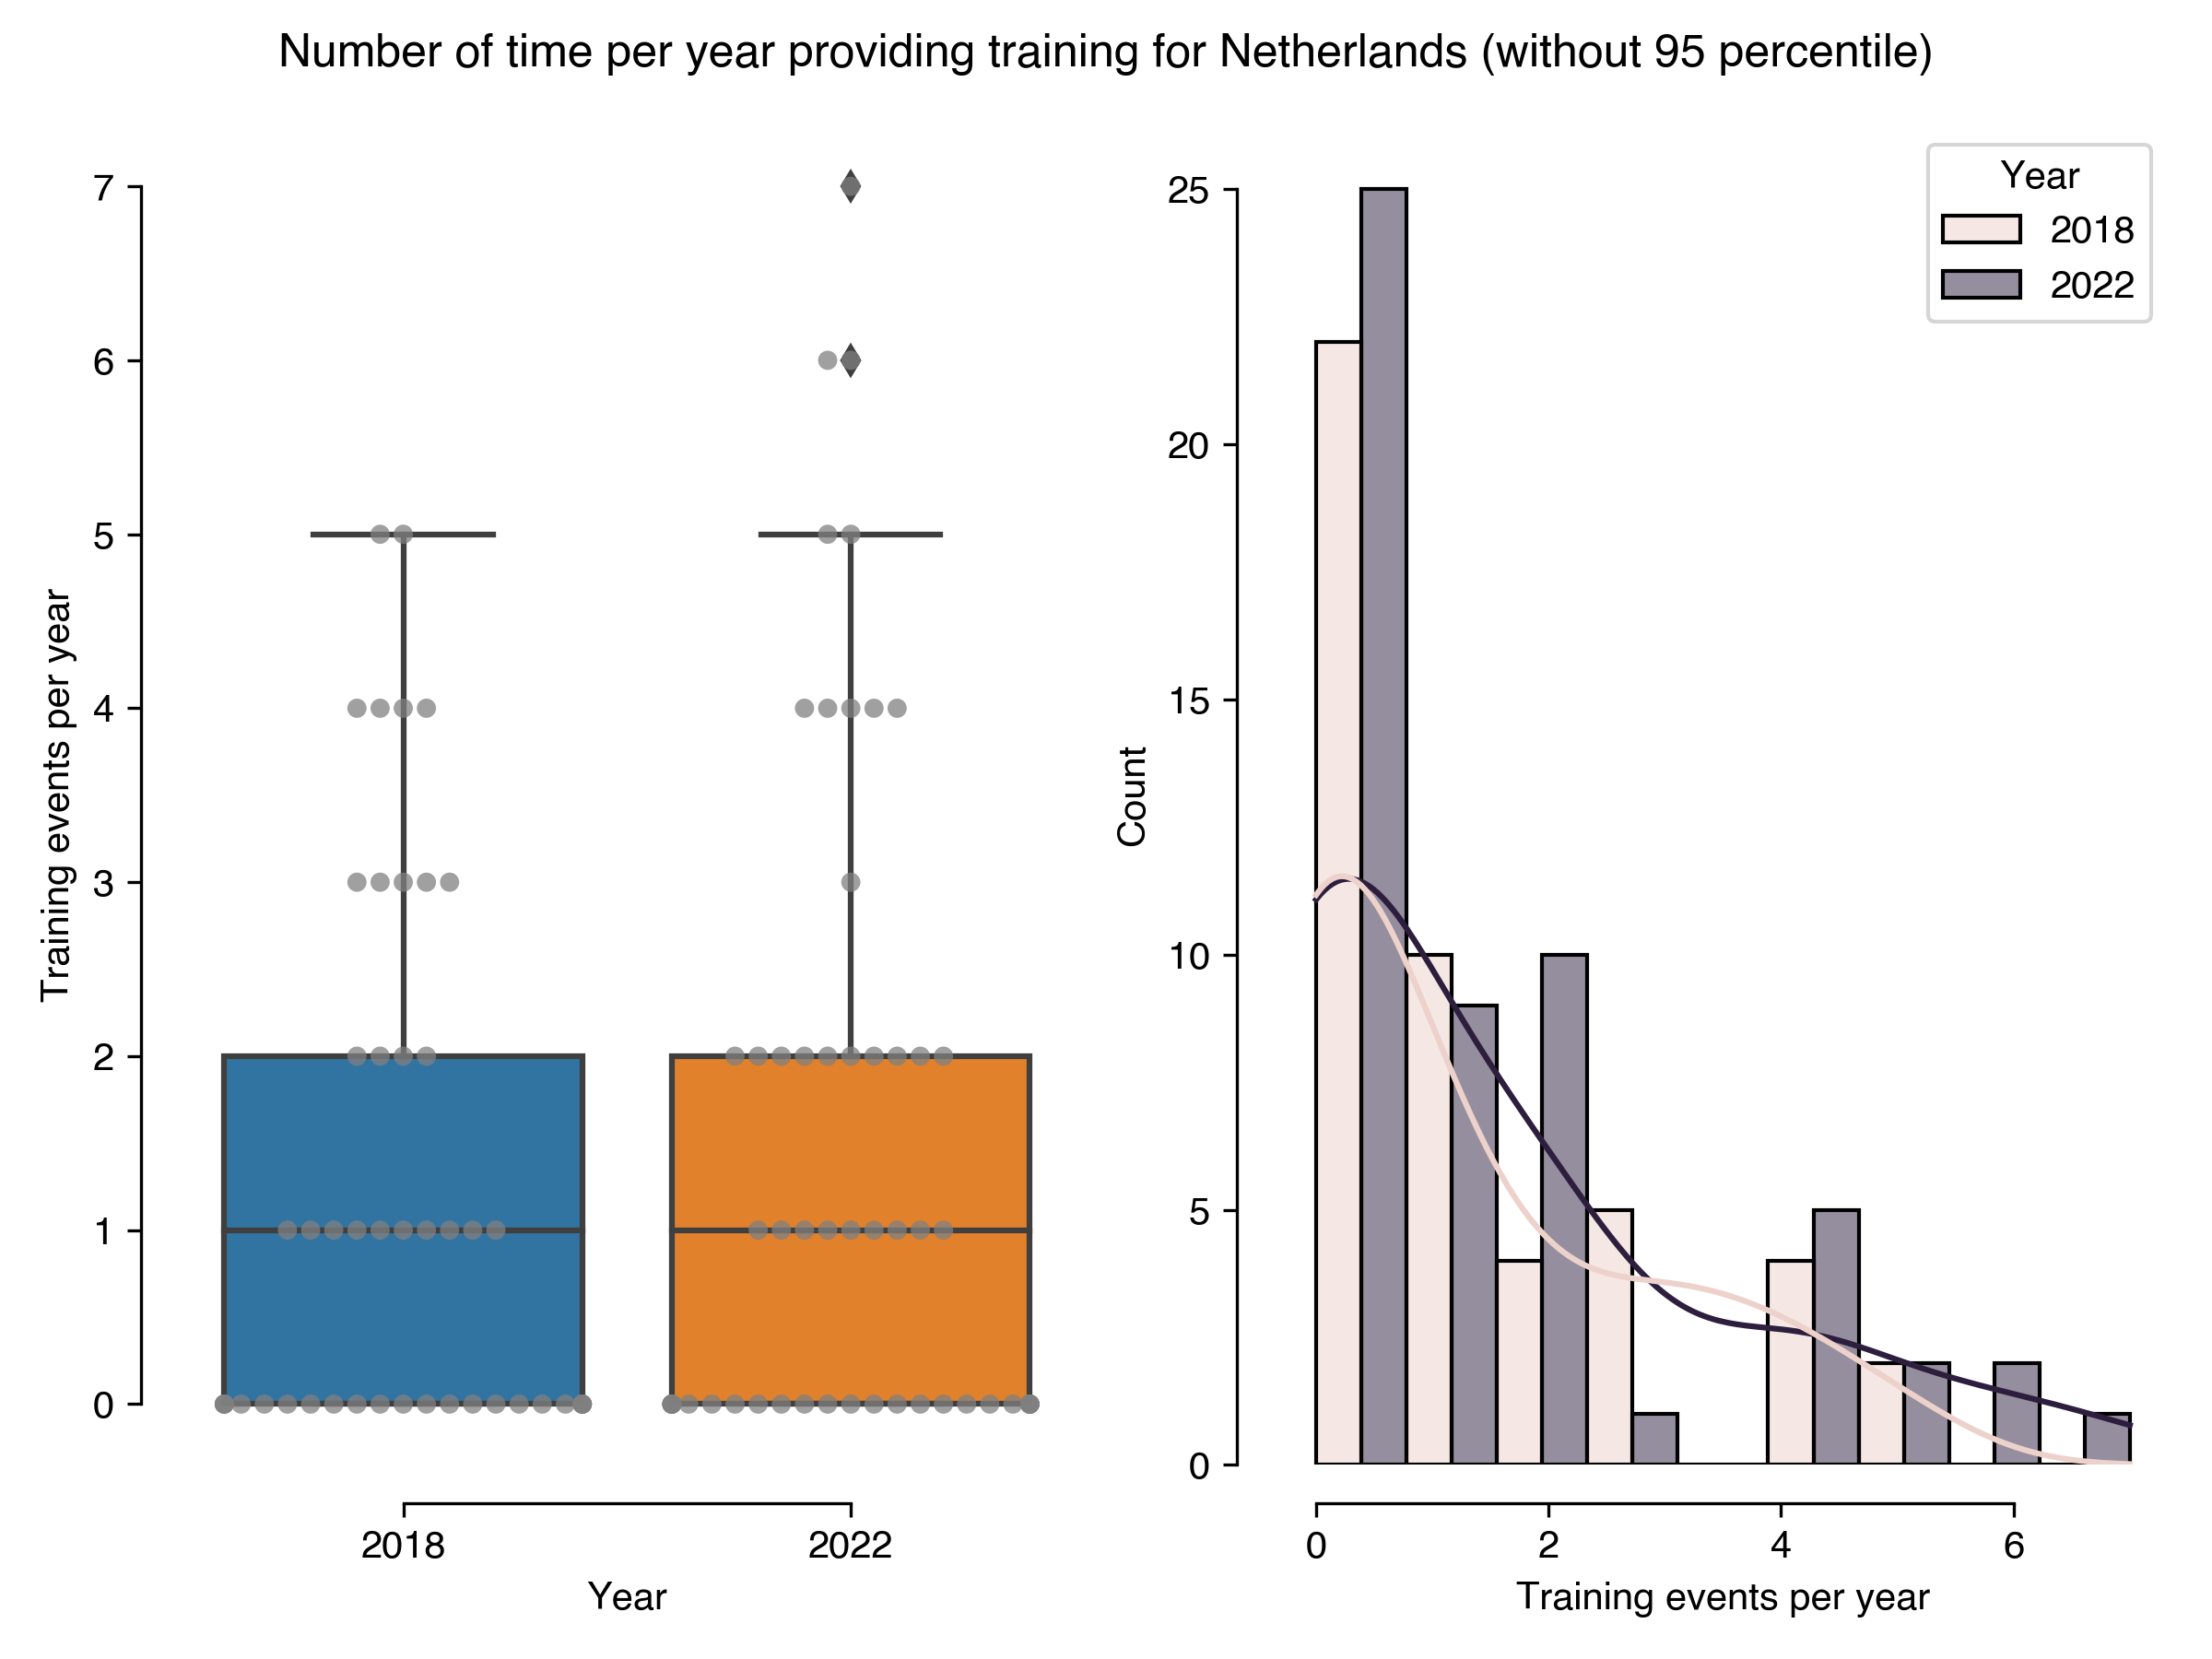
Training
| Number of time per year providing training for Netherlands (without 95 percentile) |
Results in 2022 |
Results in 2018 |
| count |
55 |
47 |
| mean |
1.47 |
1.26 |
| std |
1.87 |
1.55 |
| min |
0 |
0 |
| 25% |
0 |
0 |
| 50% |
1 |
1 |
| 75% |
2 |
2 |
| max |
7 |
5 |
Download CSV
PNG SVG
PNG SVG
New Zealand
Developing code for others
| Developing code for others for New Zealand |
Count |
Percentage |
Percentage in 2018 |
Difference with previous year |
| 0 - Mostly me |
2 |
7.69 |
2.7 |
4.99 |
| 1 |
1 |
3.85 |
8.11 |
-4.26 |
| 2 |
4 |
15.38 |
16.22 |
-0.83 |
| 3 |
6 |
23.08 |
24.32 |
-1.25 |
| 4 |
5 |
19.23 |
16.22 |
3.01 |
| 5 - Mostly other people |
8 |
30.77 |
32.43 |
-1.66 |
Download CSV
PNG SVG
Working with same researchers
| Working with same researchers for New Zealand |
Count |
Percentage |
Percentage in 2018 |
Difference with previous year |
| Different researchers, same research group |
6 |
23.08 |
8.82 |
14.25 |
| Regularly change researcher(s) |
13 |
50 |
41.18 |
8.82 |
| Same researcher(s) |
7 |
26.92 |
50 |
-23.08 |
Download CSV
PNG SVG
Part of dedicated group
| Member of a dedicated group for New Zealand |
Count |
Percentage |
Percentage in 2018 |
Difference with previous year |
| No |
19 |
73.08 |
58.82 |
14.25 |
| Yes |
7 |
26.92 |
41.18 |
-14.25 |
Download CSV
PNG SVG
Number of projects
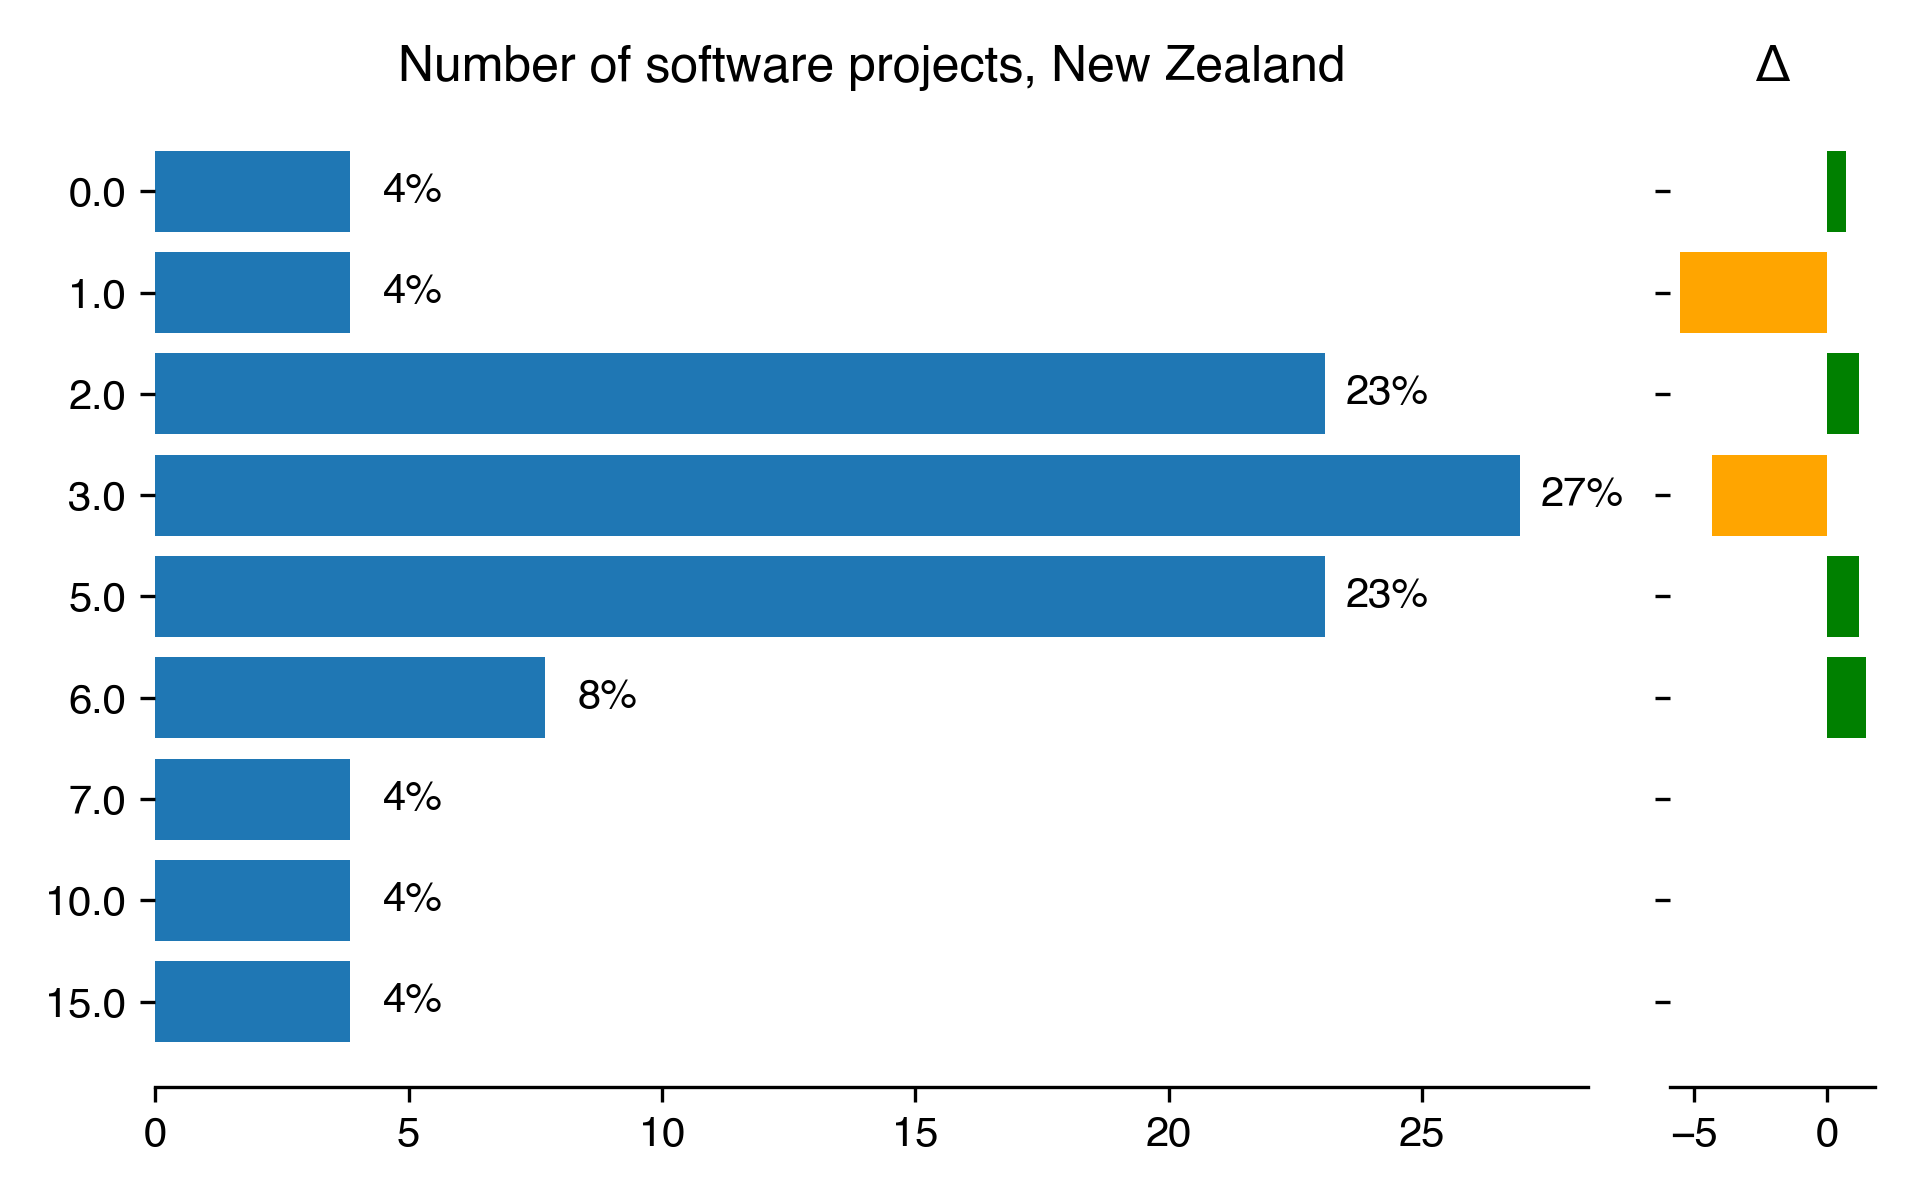
| Number of software projects for New Zealand |
Count |
Percentage |
Percentage in 2018 |
Difference with previous year |
| 0 |
1 |
3.85 |
3.12 |
0.72 |
| 1 |
1 |
3.85 |
9.38 |
-5.53 |
| 2 |
6 |
23.08 |
21.88 |
1.2 |
| 3 |
7 |
26.92 |
31.25 |
-4.33 |
| 5 |
6 |
23.08 |
21.88 |
1.2 |
| 6 |
2 |
7.69 |
6.25 |
1.44 |
| 7 |
1 |
3.85 |
nan |
nan |
| 10 |
1 |
3.85 |
nan |
nan |
| 15 |
1 |
3.85 |
nan |
nan |
Download CSV
PNG SVG
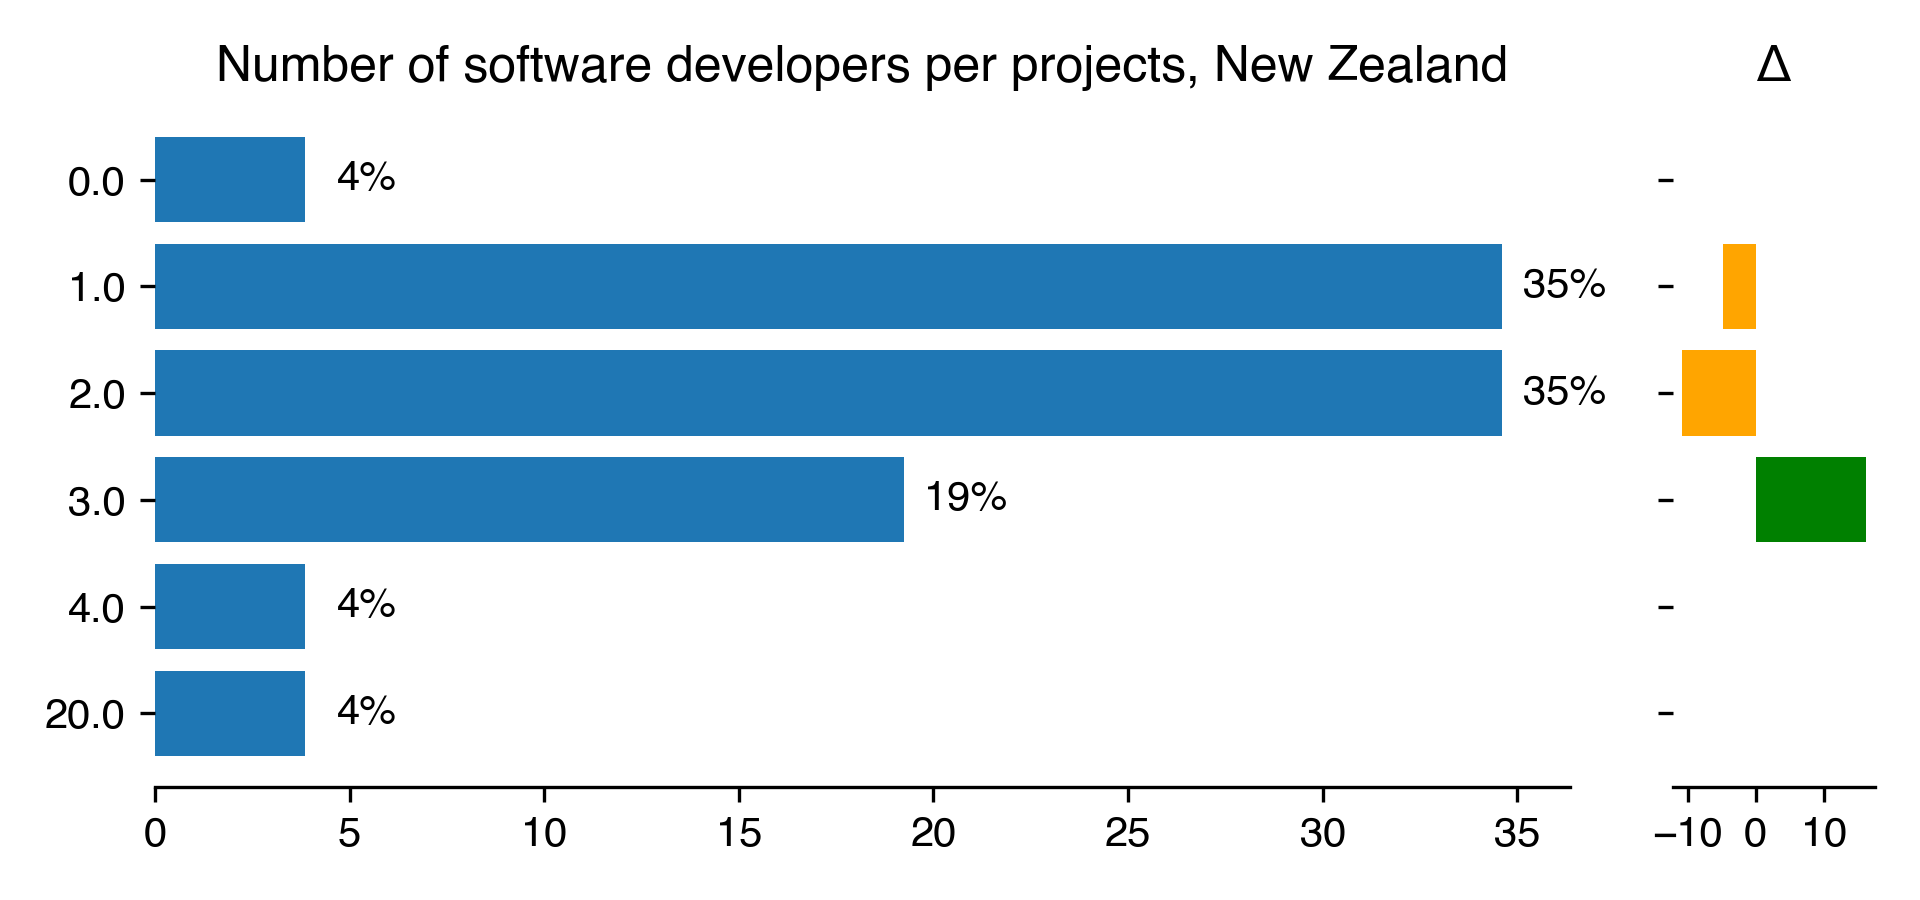
| Number of software developers per projects for New Zealand |
Count |
Percentage |
Percentage in 2018 |
Difference with previous year |
| 0 |
1 |
3.85 |
nan |
nan |
| 1 |
9 |
34.62 |
39.39 |
-4.78 |
| 2 |
9 |
34.62 |
45.45 |
-10.84 |
| 3 |
5 |
19.23 |
3.03 |
16.2 |
| 4 |
1 |
3.85 |
nan |
nan |
| 20 |
1 |
3.85 |
nan |
nan |
Download CSV
PNG SVG
Training
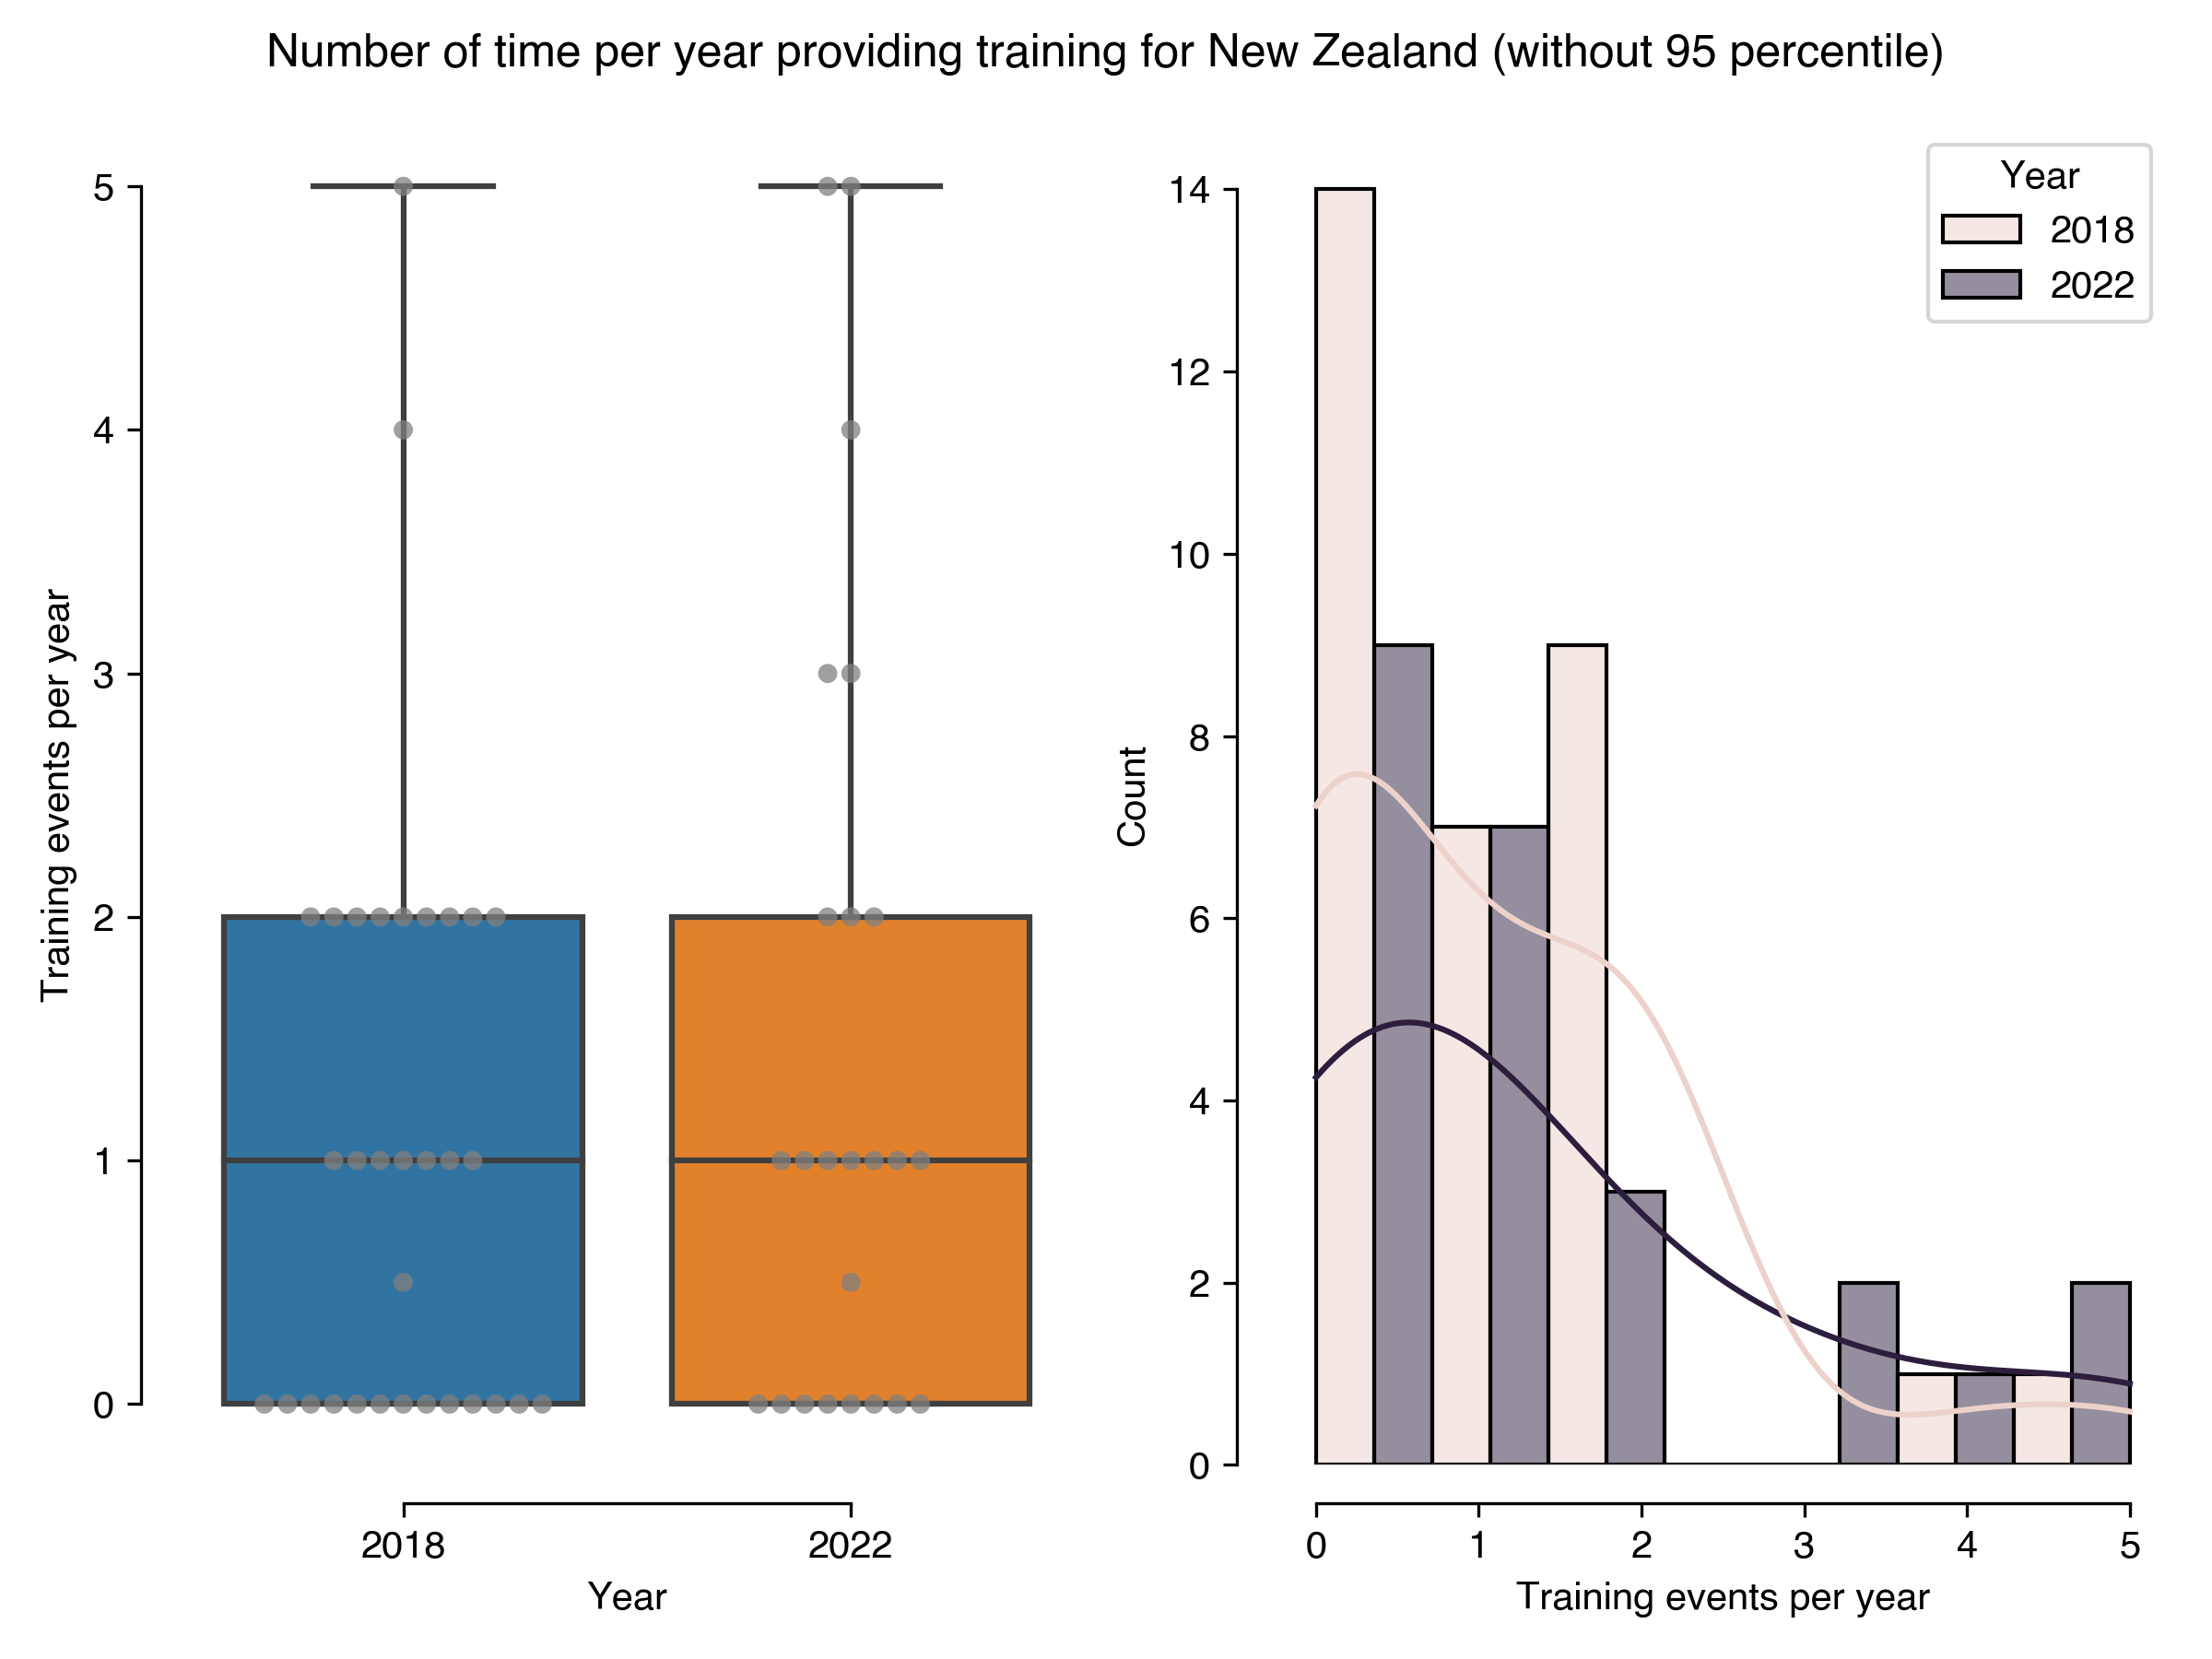
| Number of time per year providing training for New Zealand (without 95 percentile) |
Results in 2022 |
Results in 2018 |
| count |
24 |
32 |
| mean |
1.4 |
1.08 |
| std |
1.57 |
1.23 |
| min |
0 |
0 |
| 25% |
0 |
0 |
| 50% |
1 |
1 |
| 75% |
2 |
2 |
| max |
5 |
5 |
Download CSV
PNG SVG
PNG SVG
South Africa
Developing code for others
| Developing code for others for South Africa |
Count |
Percentage |
Percentage in 2018 |
Difference with previous year |
| 2 |
1 |
50 |
17.39 |
32.61 |
| 3 |
1 |
50 |
26.09 |
23.91 |
Download CSV
PNG SVG
Working with same researchers
| Working with same researchers for South Africa |
Count |
Percentage |
Percentage in 2018 |
Difference with previous year |
| Different researchers, same research group |
1 |
50 |
14.29 |
35.71 |
| Regularly change researcher(s) |
1 |
50 |
42.86 |
7.14 |
Download CSV
PNG SVG
Part of dedicated group
| Member of a dedicated group for South Africa |
Count |
Percentage |
Percentage in 2018 |
Difference with previous year |
| No |
2 |
100 |
57.14 |
42.86 |
Download CSV
PNG SVG
Number of projects
| Number of software projects for South Africa |
Count |
Percentage |
Percentage in 2018 |
Difference with previous year |
| 3 |
1 |
50 |
40 |
10 |
| 4 |
1 |
50 |
5 |
45 |
Download CSV
PNG SVG
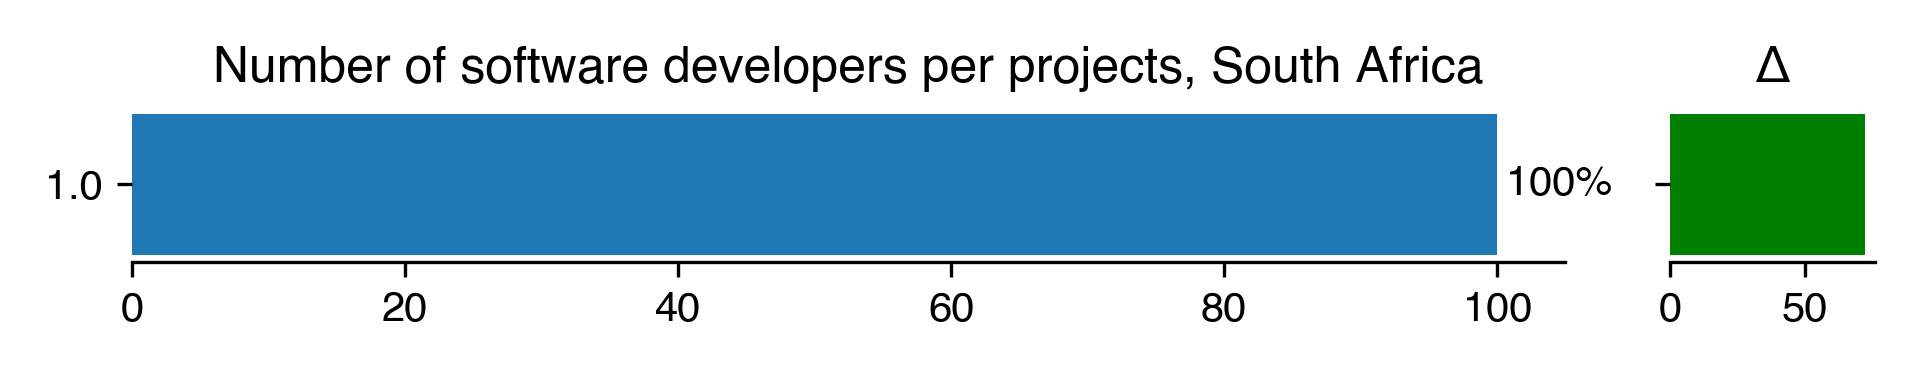
| Number of software developers per projects for South Africa |
Count |
Percentage |
Percentage in 2018 |
Difference with previous year |
| 1 |
2 |
100 |
27.78 |
72.22 |
Download CSV
PNG SVG
Training
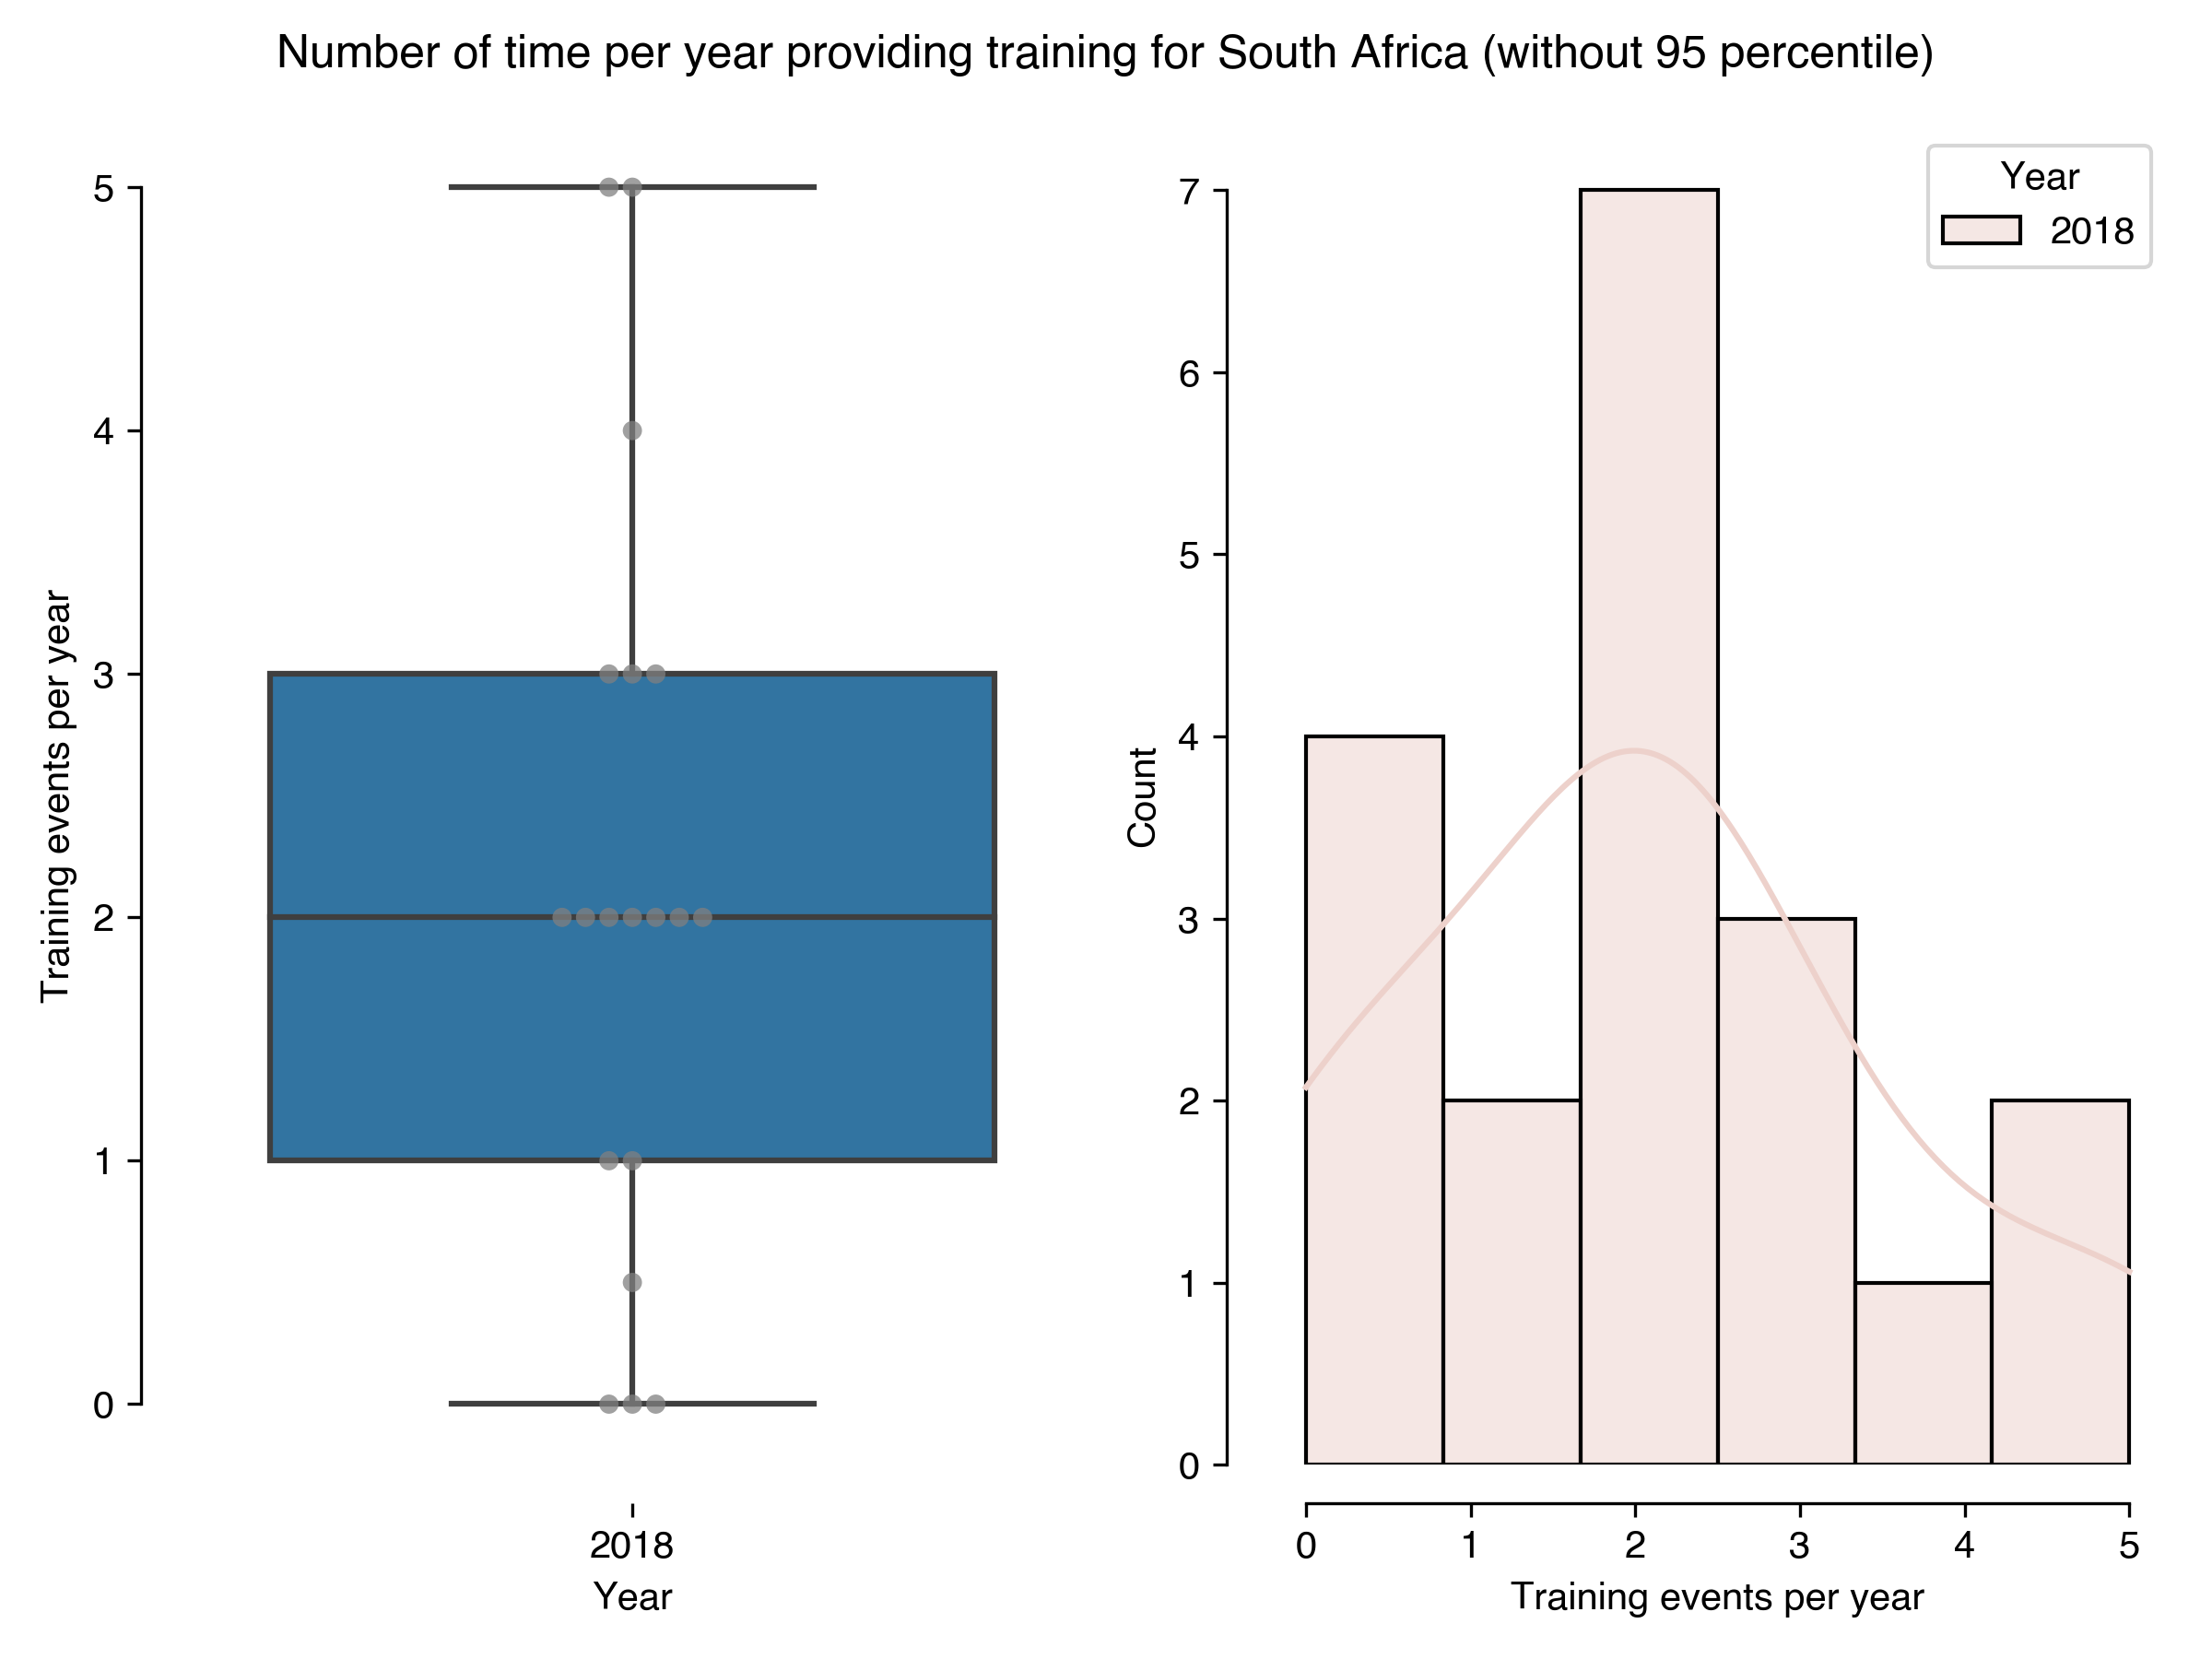
| Number of time per year providing training for South Africa (without 95 percentile) |
Results in 2022 |
Results in 2018 |
| count |
0 |
19 |
| mean |
nan |
2.08 |
| std |
nan |
1.51 |
| min |
nan |
0 |
| 25% |
nan |
1 |
| 50% |
nan |
2 |
| 75% |
nan |
3 |
| max |
nan |
5 |
Download CSV
PNG SVG
PNG SVG
United Kingdom
Developing code for others
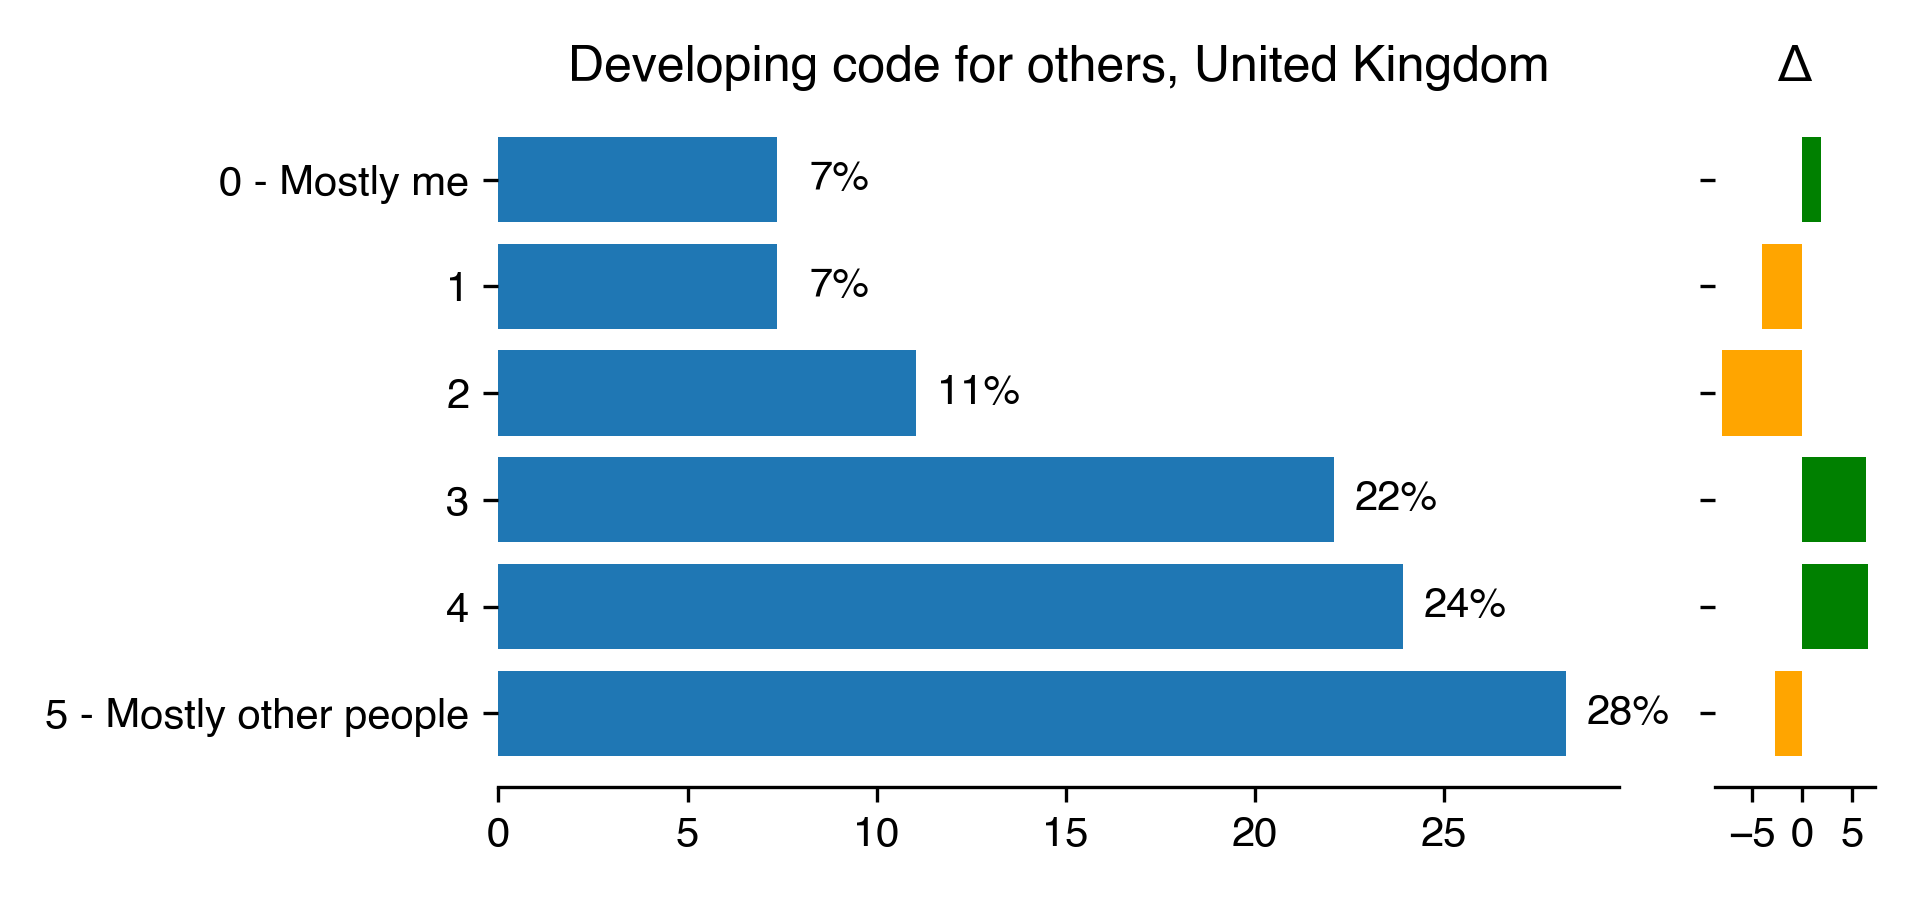
| Developing code for others for United Kingdom |
Count |
Percentage |
Percentage in 2018 |
Difference with previous year |
| 0 - Mostly me |
12 |
7.36 |
5.51 |
1.85 |
| 1 |
12 |
7.36 |
11.44 |
-4.08 |
| 2 |
18 |
11.04 |
19.07 |
-8.02 |
| 3 |
36 |
22.09 |
15.68 |
6.41 |
| 4 |
39 |
23.93 |
17.37 |
6.55 |
| 5 - Mostly other people |
46 |
28.22 |
30.93 |
-2.71 |
Download CSV
PNG SVG
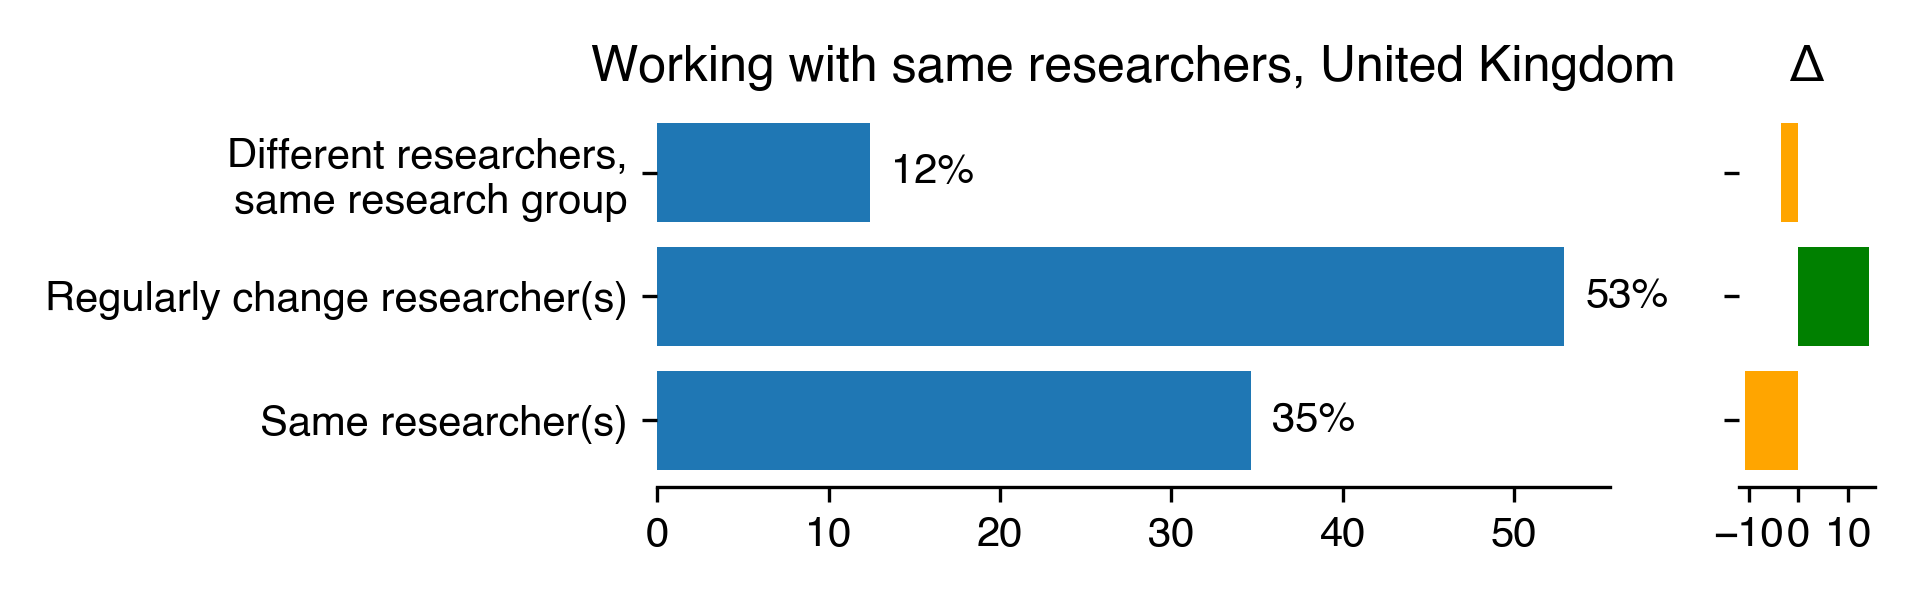
Working with same researchers
| Working with same researchers for United Kingdom |
Count |
Percentage |
Percentage in 2018 |
Difference with previous year |
| Different researchers, same research group |
19 |
12.42 |
15.89 |
-3.47 |
| Regularly change researcher(s) |
81 |
52.94 |
38.79 |
14.16 |
| Same researcher(s) |
53 |
34.64 |
45.33 |
-10.69 |
Download CSV
PNG SVG
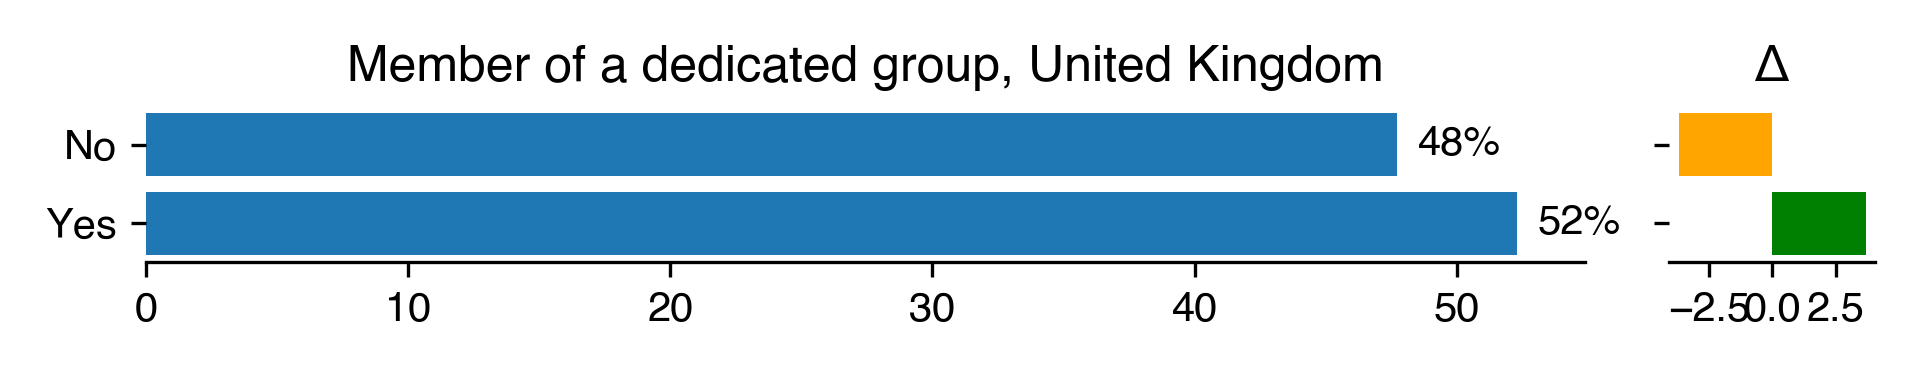
Part of dedicated group
| Member of a dedicated group for United Kingdom |
Count |
Percentage |
Percentage in 2018 |
Difference with previous year |
| No |
73 |
47.71 |
51.4 |
-3.69 |
| Yes |
80 |
52.29 |
48.6 |
3.69 |
Download CSV
PNG SVG
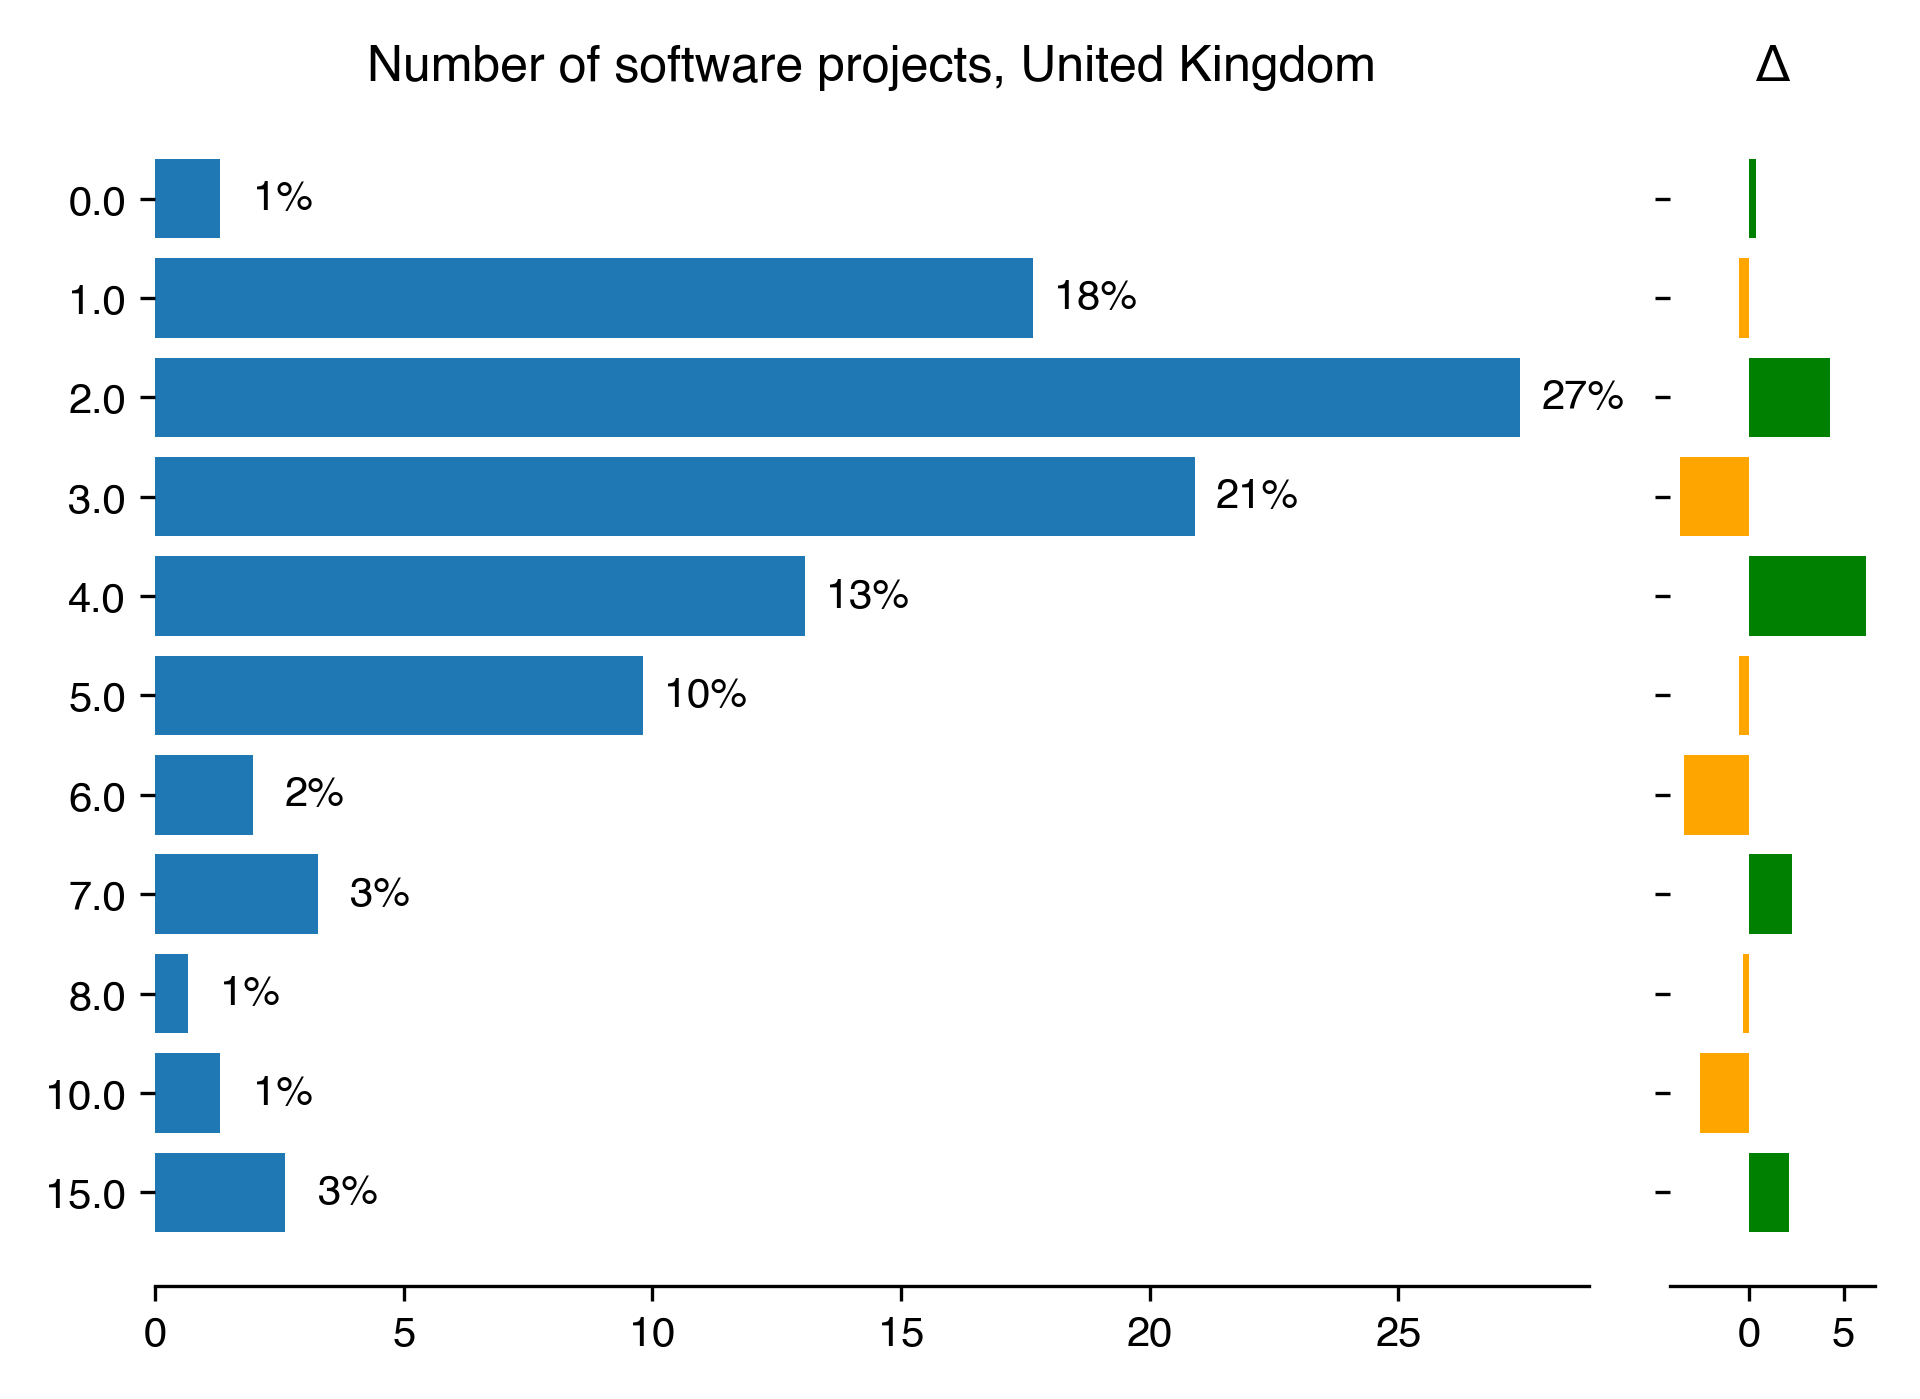
Number of projects
| Number of software projects for United Kingdom |
Count |
Percentage |
Percentage in 2018 |
Difference with previous year |
| 0 |
2 |
1.31 |
0.99 |
0.32 |
| 1 |
27 |
17.65 |
18.23 |
-0.58 |
| 2 |
42 |
27.45 |
23.15 |
4.3 |
| 3 |
32 |
20.92 |
24.63 |
-3.72 |
| 4 |
20 |
13.07 |
6.9 |
6.18 |
| 5 |
15 |
9.8 |
10.34 |
-0.54 |
| 6 |
3 |
1.96 |
5.42 |
-3.46 |
| 7 |
5 |
3.27 |
0.99 |
2.28 |
| 8 |
1 |
0.65 |
0.99 |
-0.33 |
| 10 |
2 |
1.31 |
3.94 |
-2.63 |
| 15 |
4 |
2.61 |
0.49 |
2.12 |
Download CSV
PNG SVG
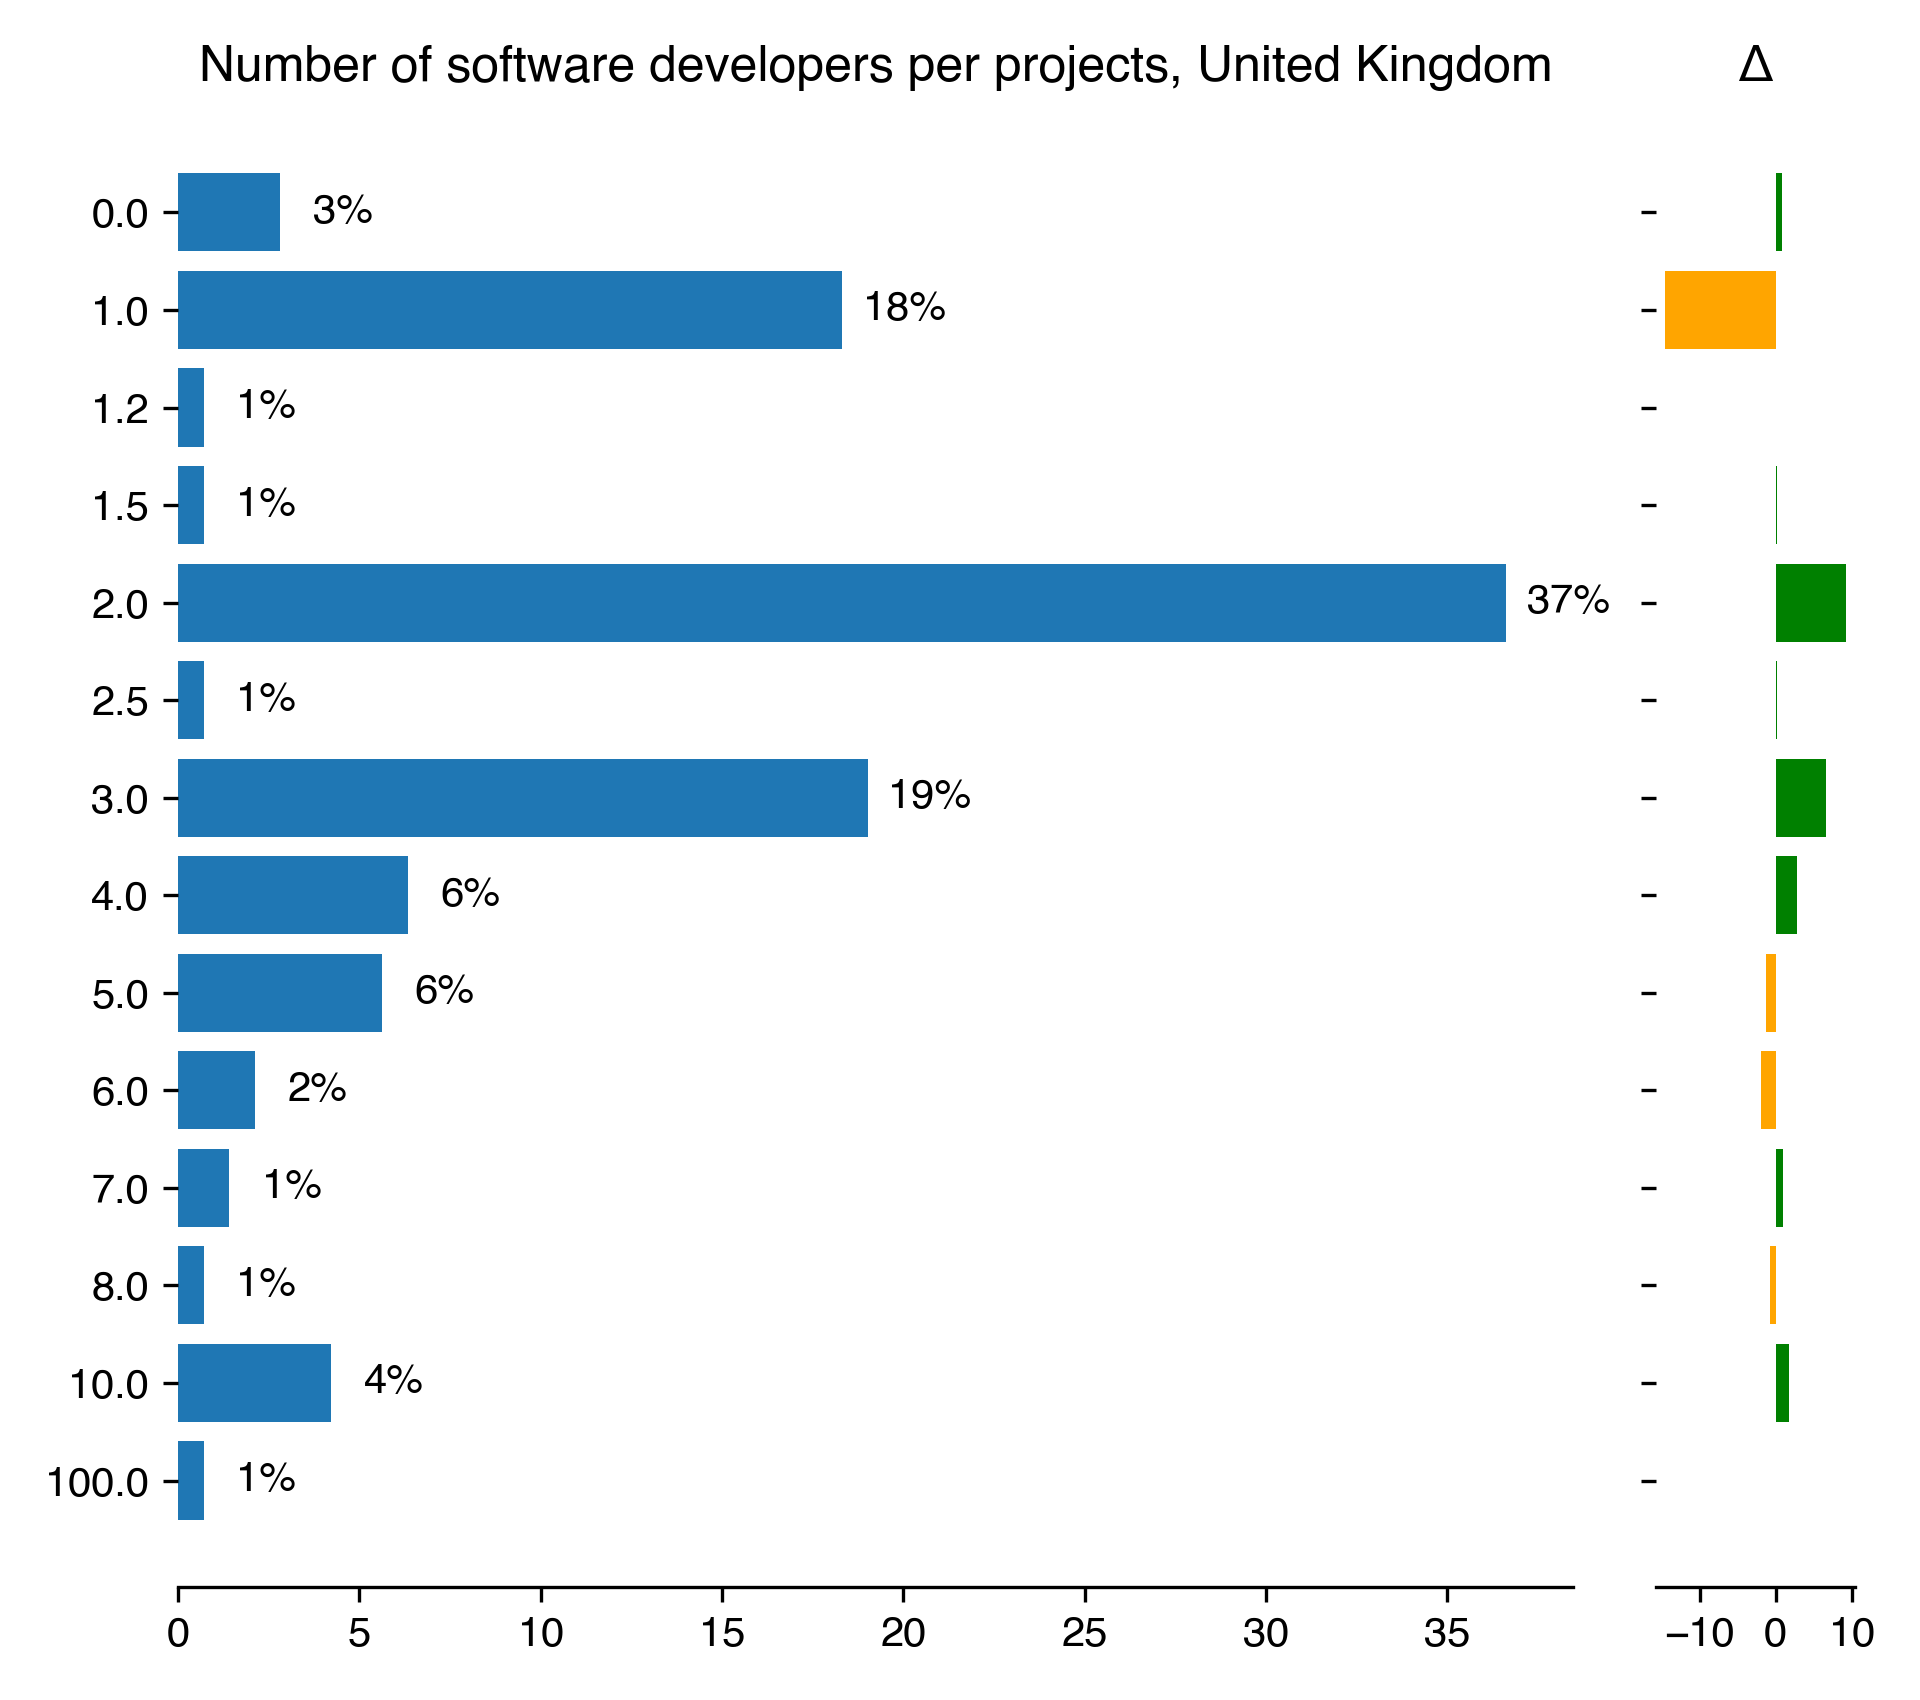
| Number of software developers per projects for United Kingdom |
Count |
Percentage |
Percentage in 2018 |
Difference with previous year |
| 0 |
4 |
2.82 |
1.99 |
0.83 |
| 1 |
26 |
18.31 |
32.84 |
-14.53 |
| 1.2 |
1 |
0.7 |
nan |
nan |
| 1.5 |
1 |
0.7 |
0.5 |
0.21 |
| 2 |
52 |
36.62 |
27.36 |
9.26 |
| 2.5 |
1 |
0.7 |
0.5 |
0.21 |
| 3 |
27 |
19.01 |
12.44 |
6.58 |
| 4 |
9 |
6.34 |
3.48 |
2.86 |
| 5 |
8 |
5.63 |
6.97 |
-1.33 |
| 6 |
3 |
2.11 |
3.98 |
-1.87 |
| 7 |
2 |
1.41 |
0.5 |
0.91 |
| 8 |
1 |
0.7 |
1.49 |
-0.79 |
| 10 |
6 |
4.23 |
2.49 |
1.74 |
| 100 |
1 |
0.7 |
nan |
nan |
Download CSV
PNG SVG
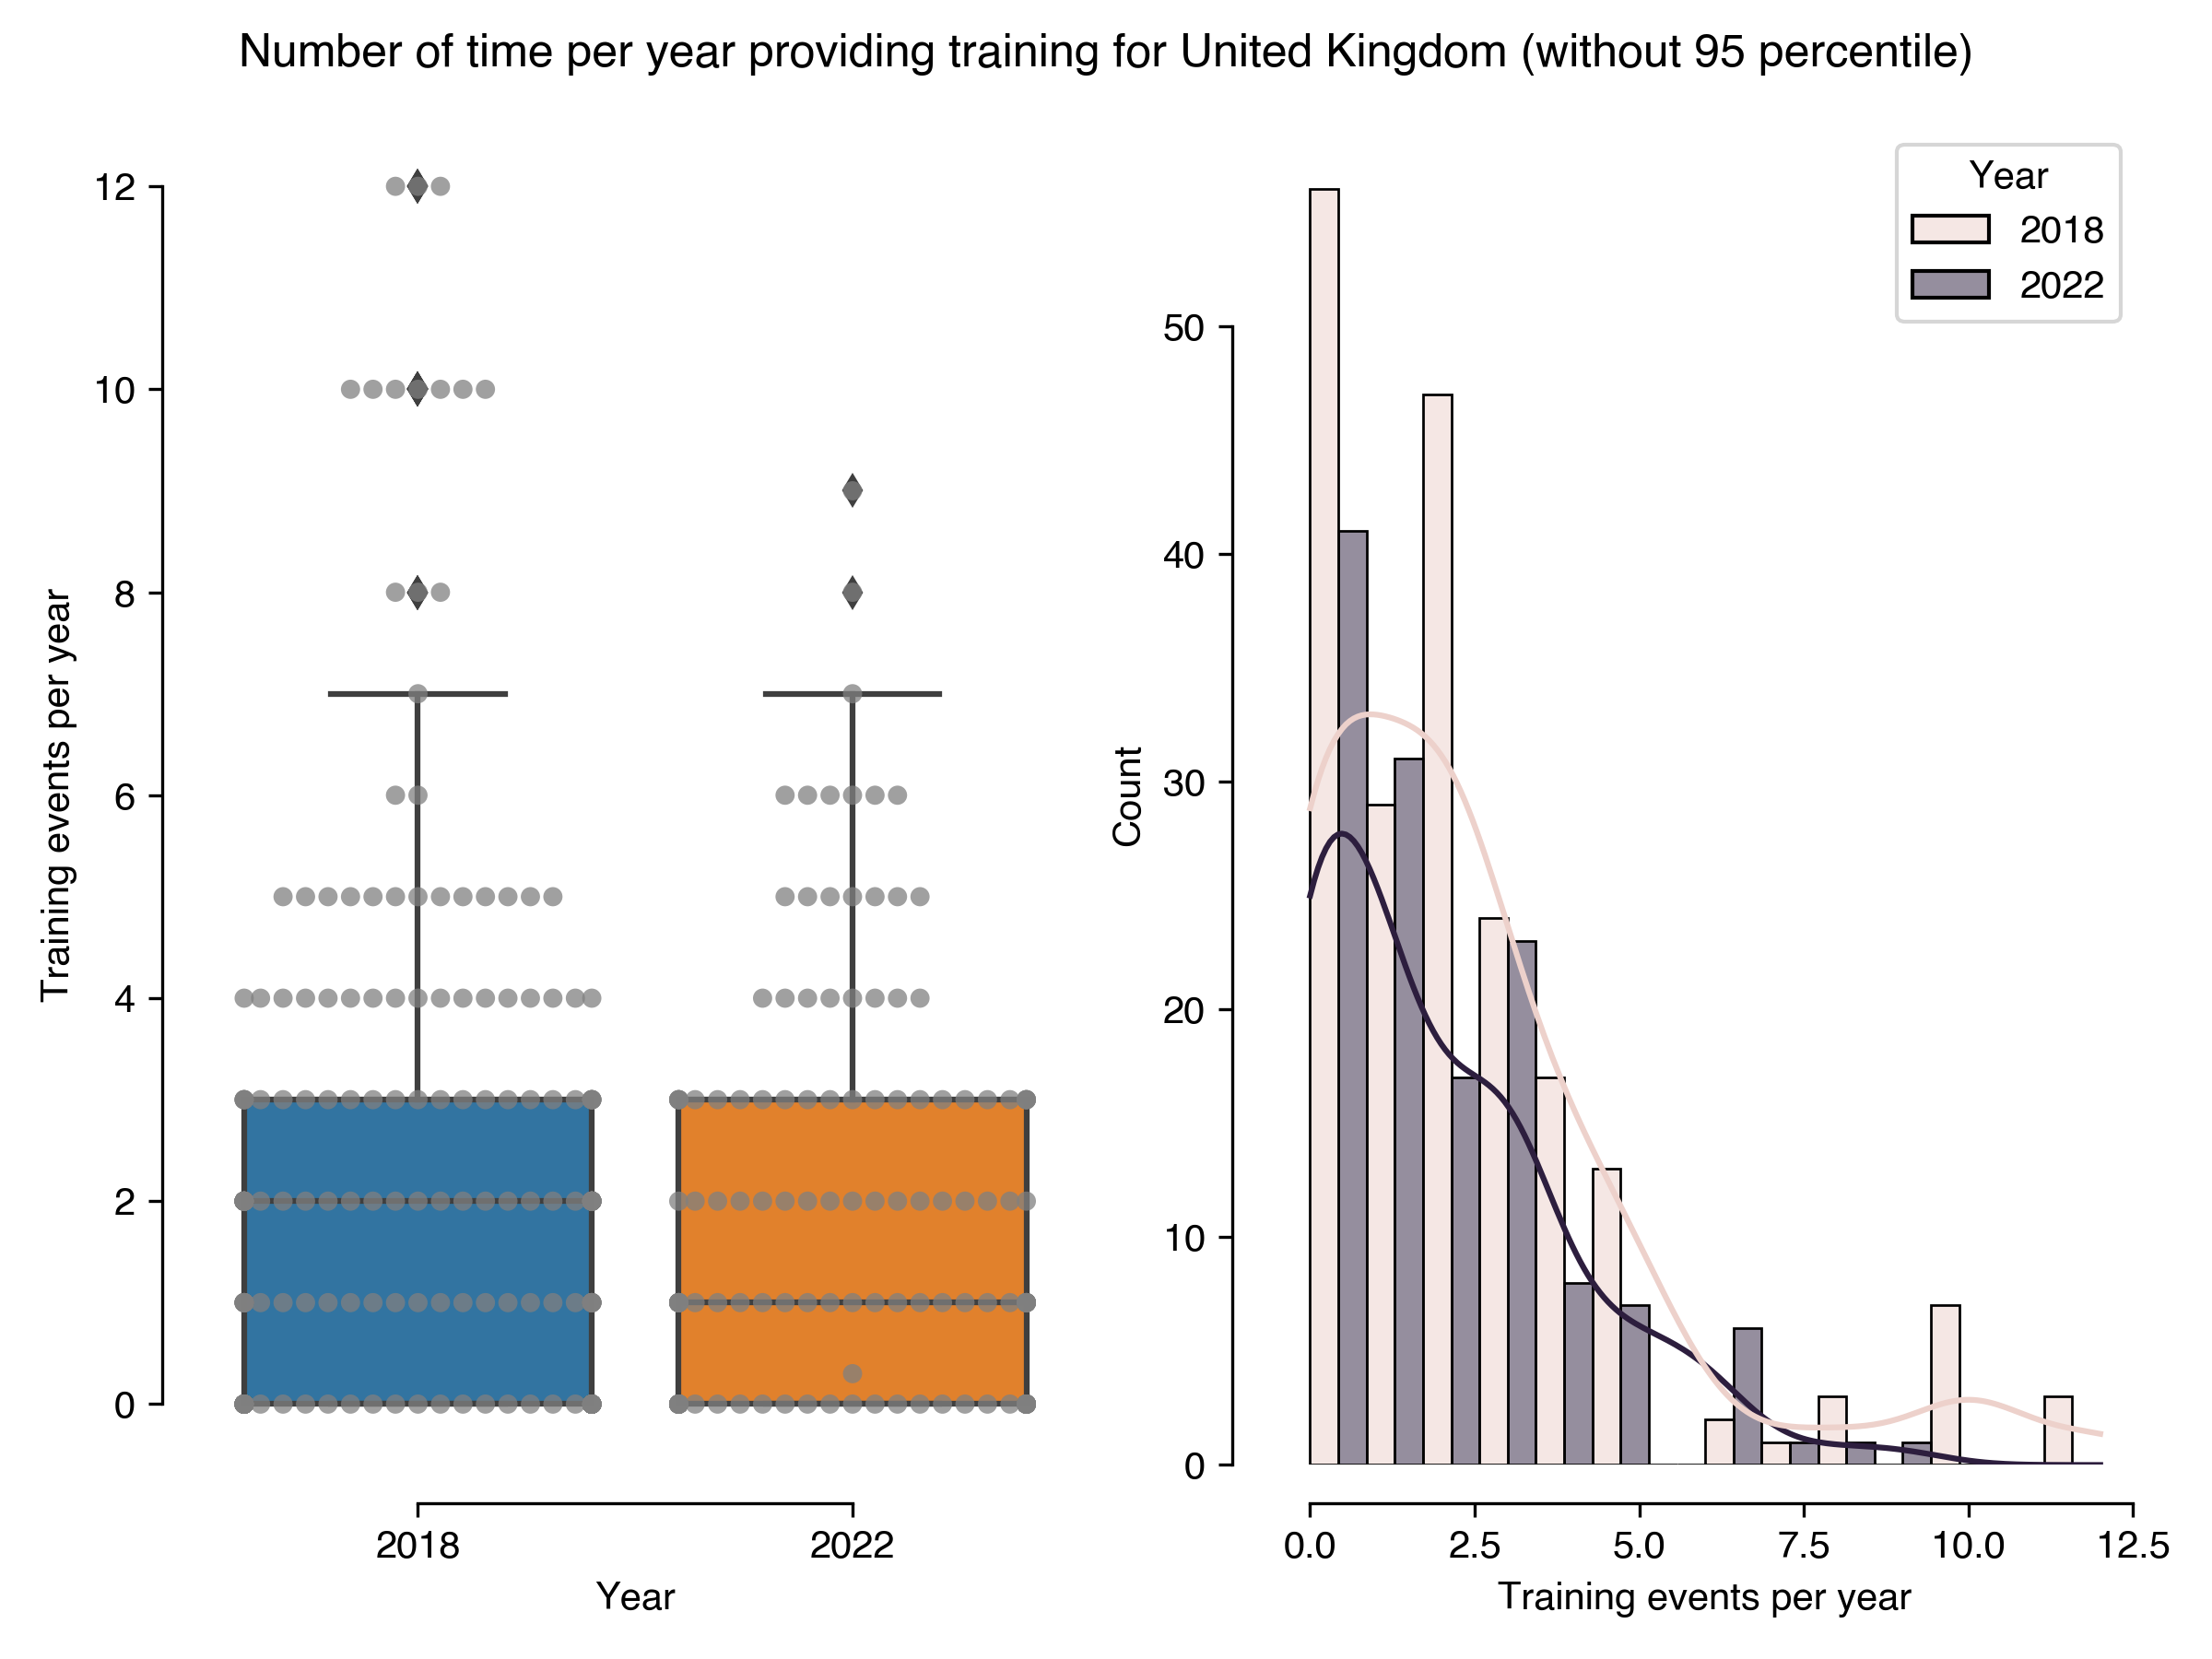
Training
| Number of time per year providing training for United Kingdom (without 95 percentile) |
Results in 2022 |
Results in 2018 |
| count |
136 |
202 |
| mean |
1.92 |
2.36 |
| std |
1.96 |
2.59 |
| min |
0 |
0 |
| 25% |
0 |
0 |
| 50% |
1 |
2 |
| 75% |
3 |
3 |
| max |
9 |
12 |
Download CSV
PNG SVG
PNG SVG
United States
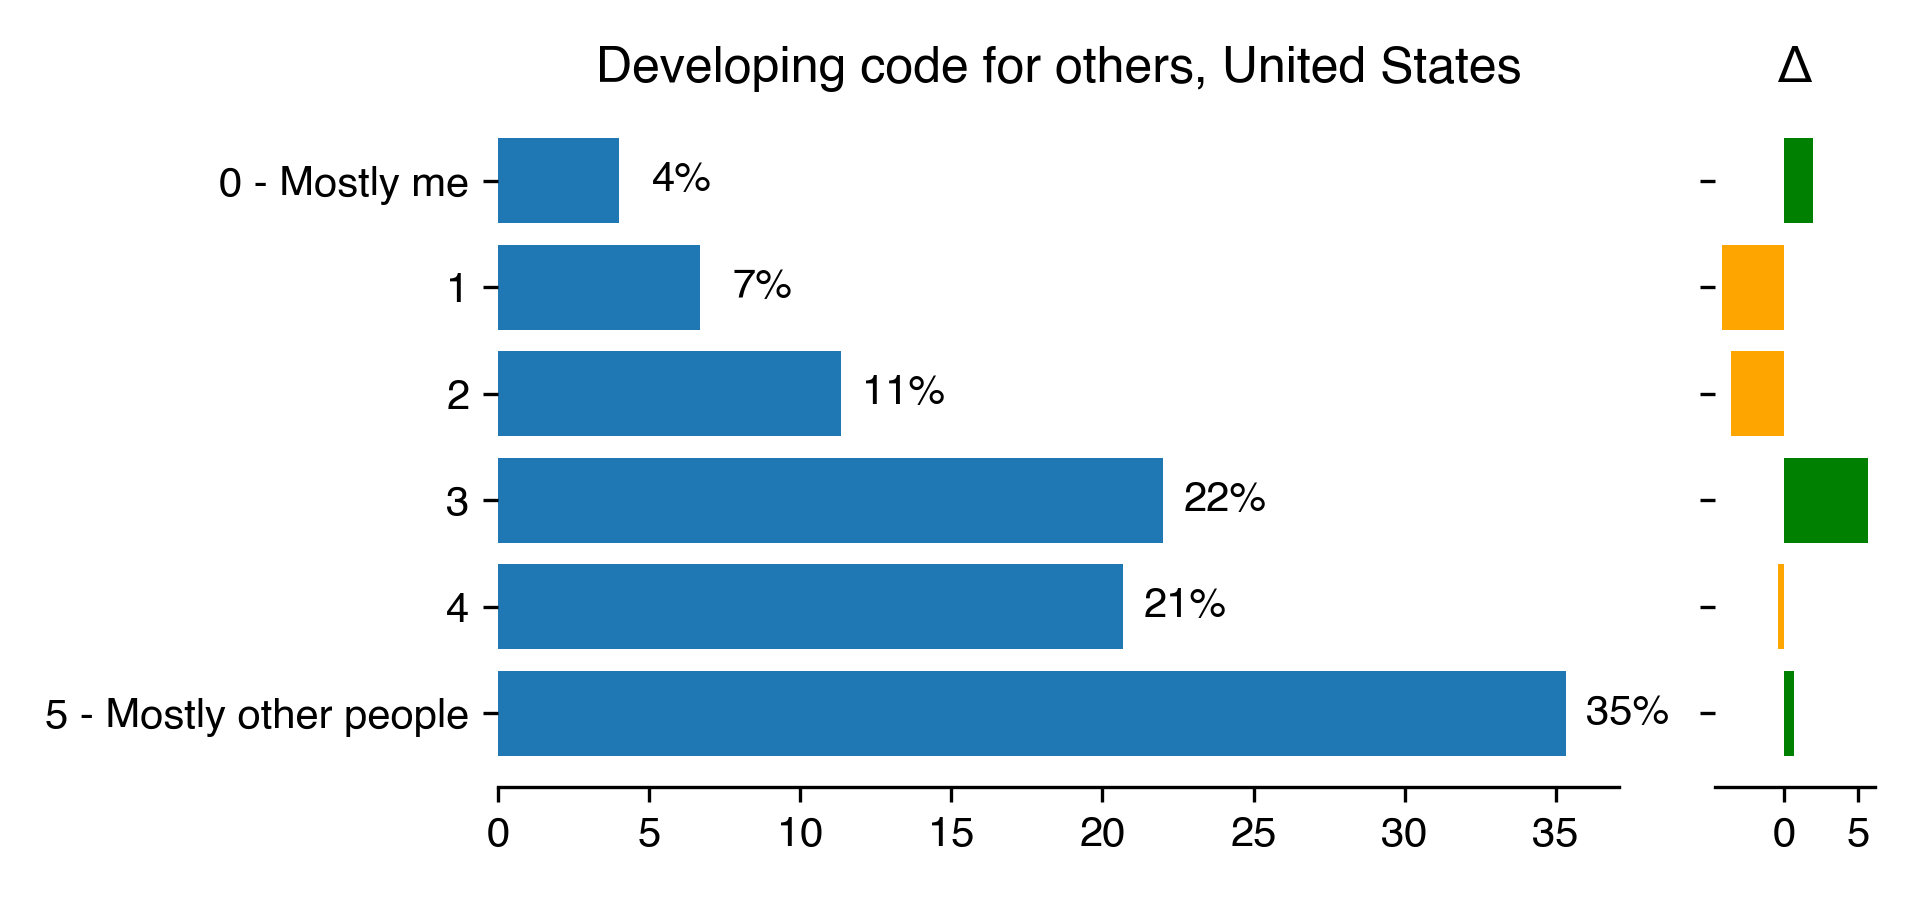
Developing code for others
| Developing code for others for United States |
Count |
Percentage |
Percentage in 2018 |
Difference with previous year |
| 0 - Mostly me |
6 |
4 |
2.04 |
1.96 |
| 1 |
10 |
6.67 |
10.88 |
-4.22 |
| 2 |
17 |
11.33 |
14.97 |
-3.63 |
| 3 |
33 |
22 |
16.33 |
5.67 |
| 4 |
31 |
20.67 |
21.09 |
-0.42 |
| 5 - Mostly other people |
53 |
35.33 |
34.69 |
0.64 |
Download CSV
PNG SVG
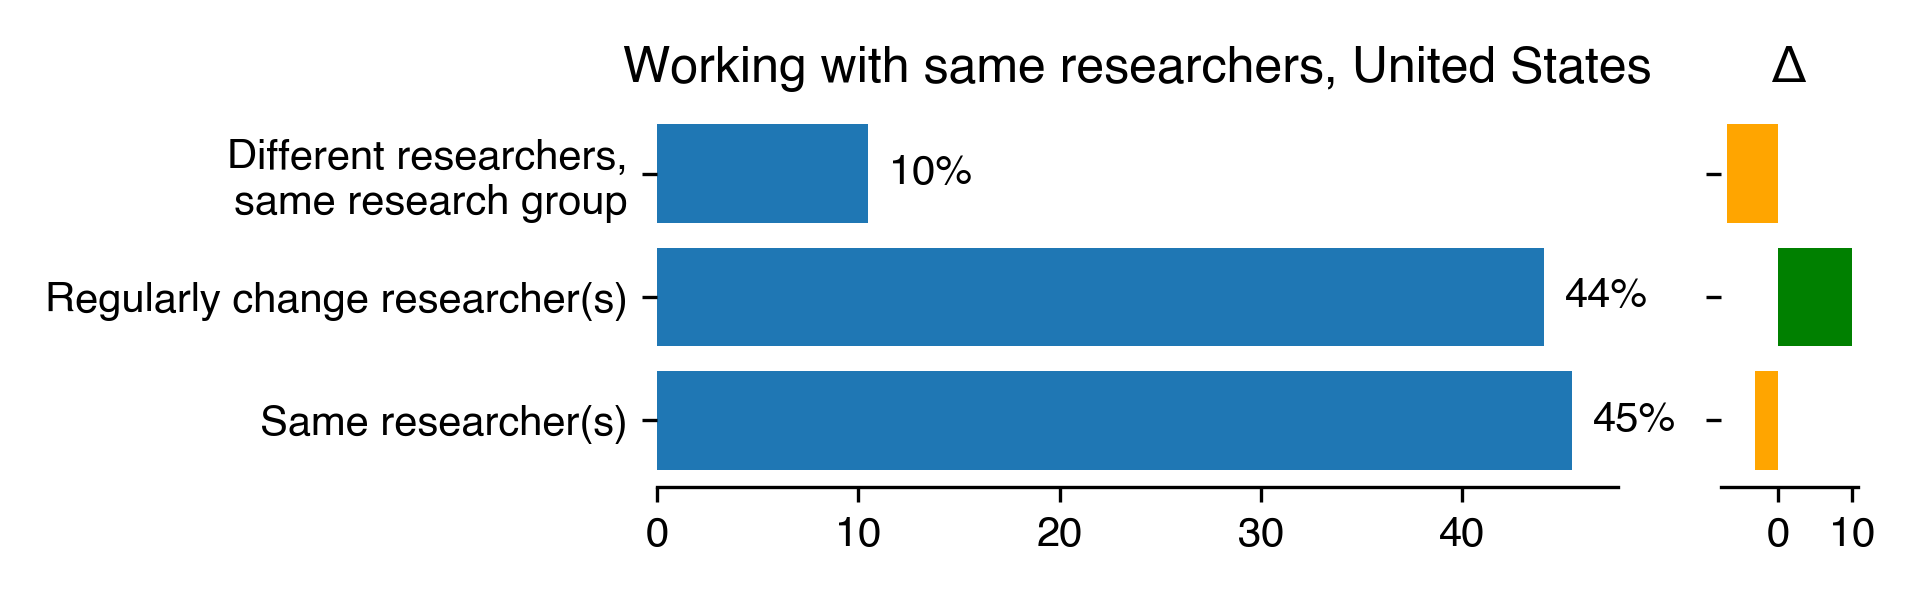
Working with same researchers
| Working with same researchers for United States |
Count |
Percentage |
Percentage in 2018 |
Difference with previous year |
| Different researchers, same research group |
15 |
10.49 |
17.39 |
-6.9 |
| Regularly change researcher(s) |
63 |
44.06 |
34.06 |
10 |
| Same researcher(s) |
65 |
45.45 |
48.55 |
-3.1 |
Download CSV
PNG SVG
Part of dedicated group
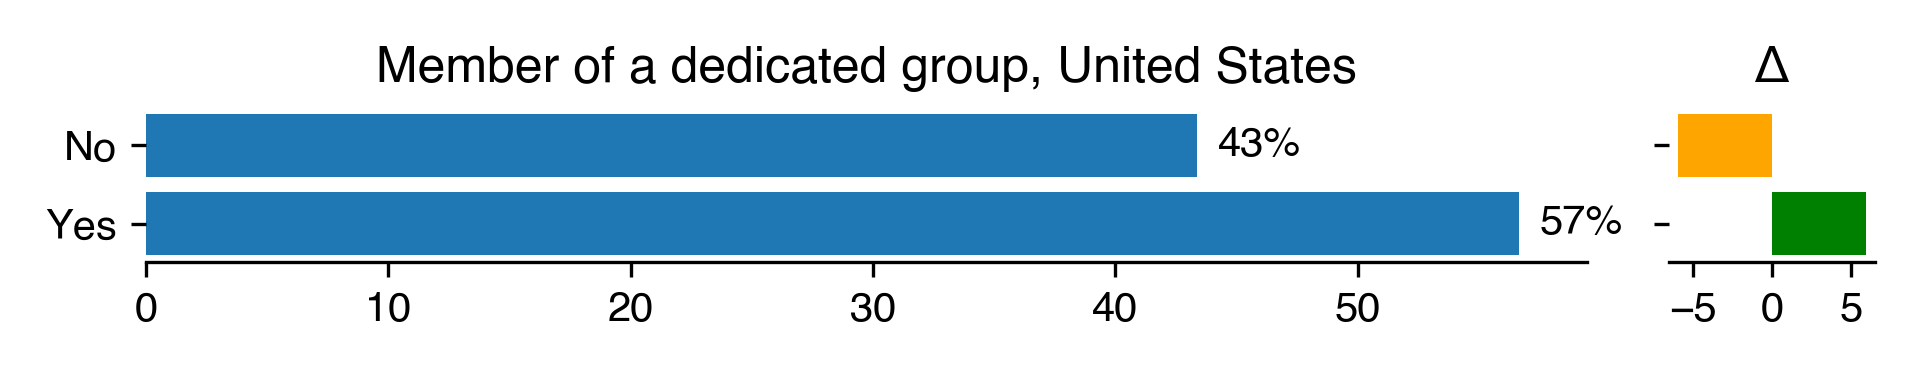
| Member of a dedicated group for United States |
Count |
Percentage |
Percentage in 2018 |
Difference with previous year |
| No |
62 |
43.36 |
49.28 |
-5.92 |
| Yes |
81 |
56.64 |
50.72 |
5.92 |
Download CSV
PNG SVG
Number of projects
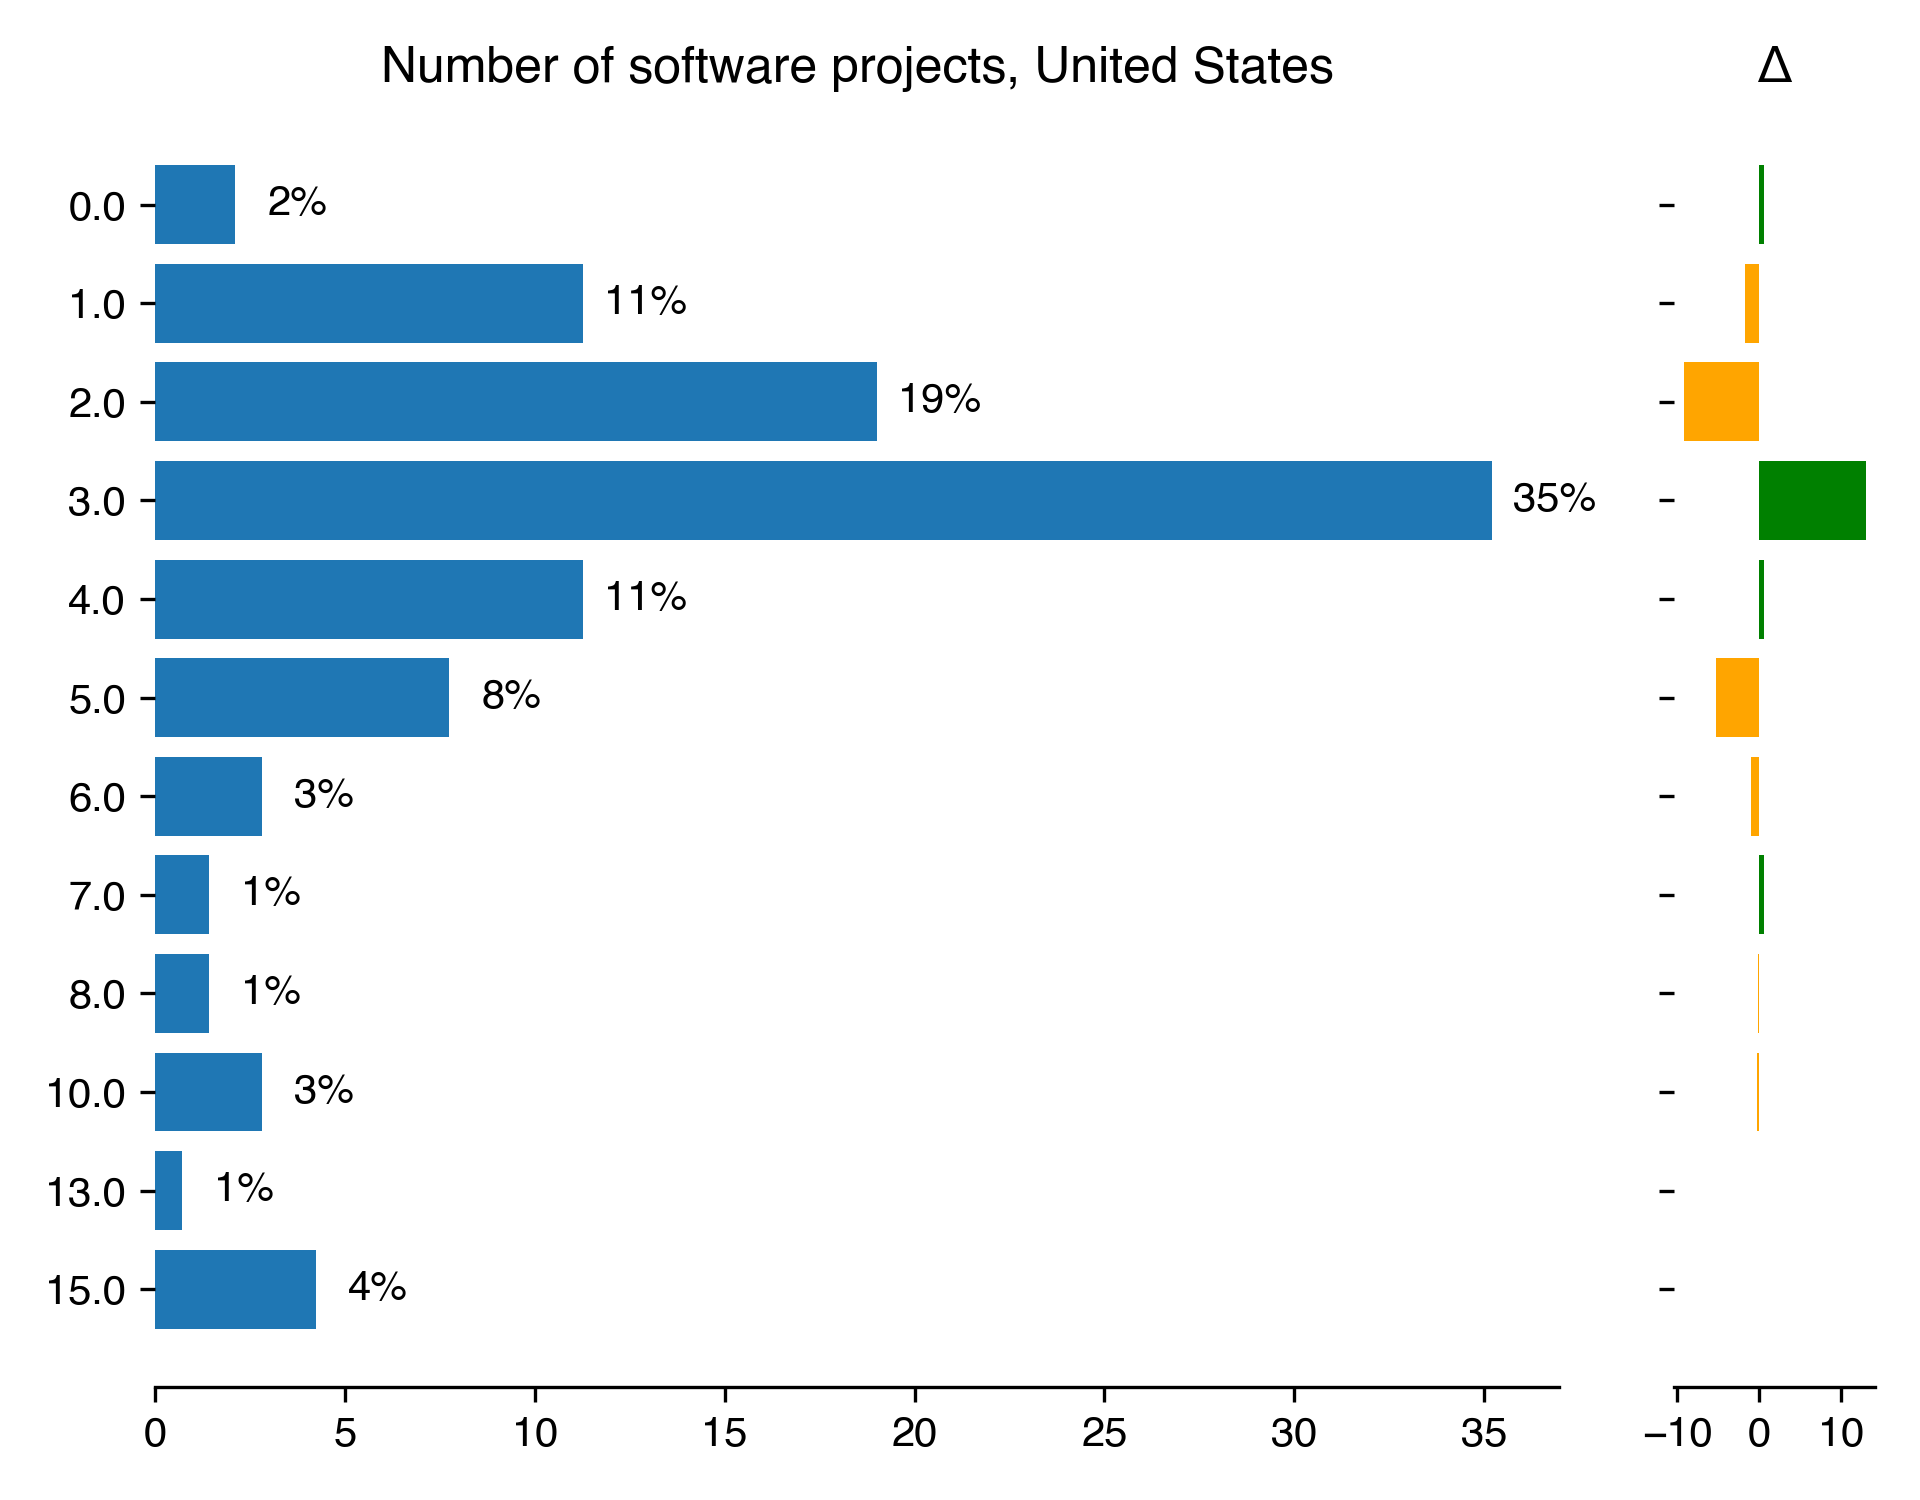
| Number of software projects for United States |
Count |
Percentage |
Percentage in 2018 |
Difference with previous year |
| 0 |
3 |
2.11 |
1.53 |
0.59 |
| 1 |
16 |
11.27 |
12.98 |
-1.71 |
| 2 |
27 |
19.01 |
28.24 |
-9.23 |
| 3 |
50 |
35.21 |
22.14 |
13.07 |
| 4 |
16 |
11.27 |
10.69 |
0.58 |
| 5 |
11 |
7.75 |
12.98 |
-5.23 |
| 6 |
4 |
2.82 |
3.82 |
-1 |
| 7 |
2 |
1.41 |
0.76 |
0.65 |
| 8 |
2 |
1.41 |
1.53 |
-0.12 |
| 10 |
4 |
2.82 |
3.05 |
-0.24 |
| 13 |
1 |
0.7 |
nan |
nan |
| 15 |
6 |
4.23 |
nan |
nan |
Download CSV
PNG SVG
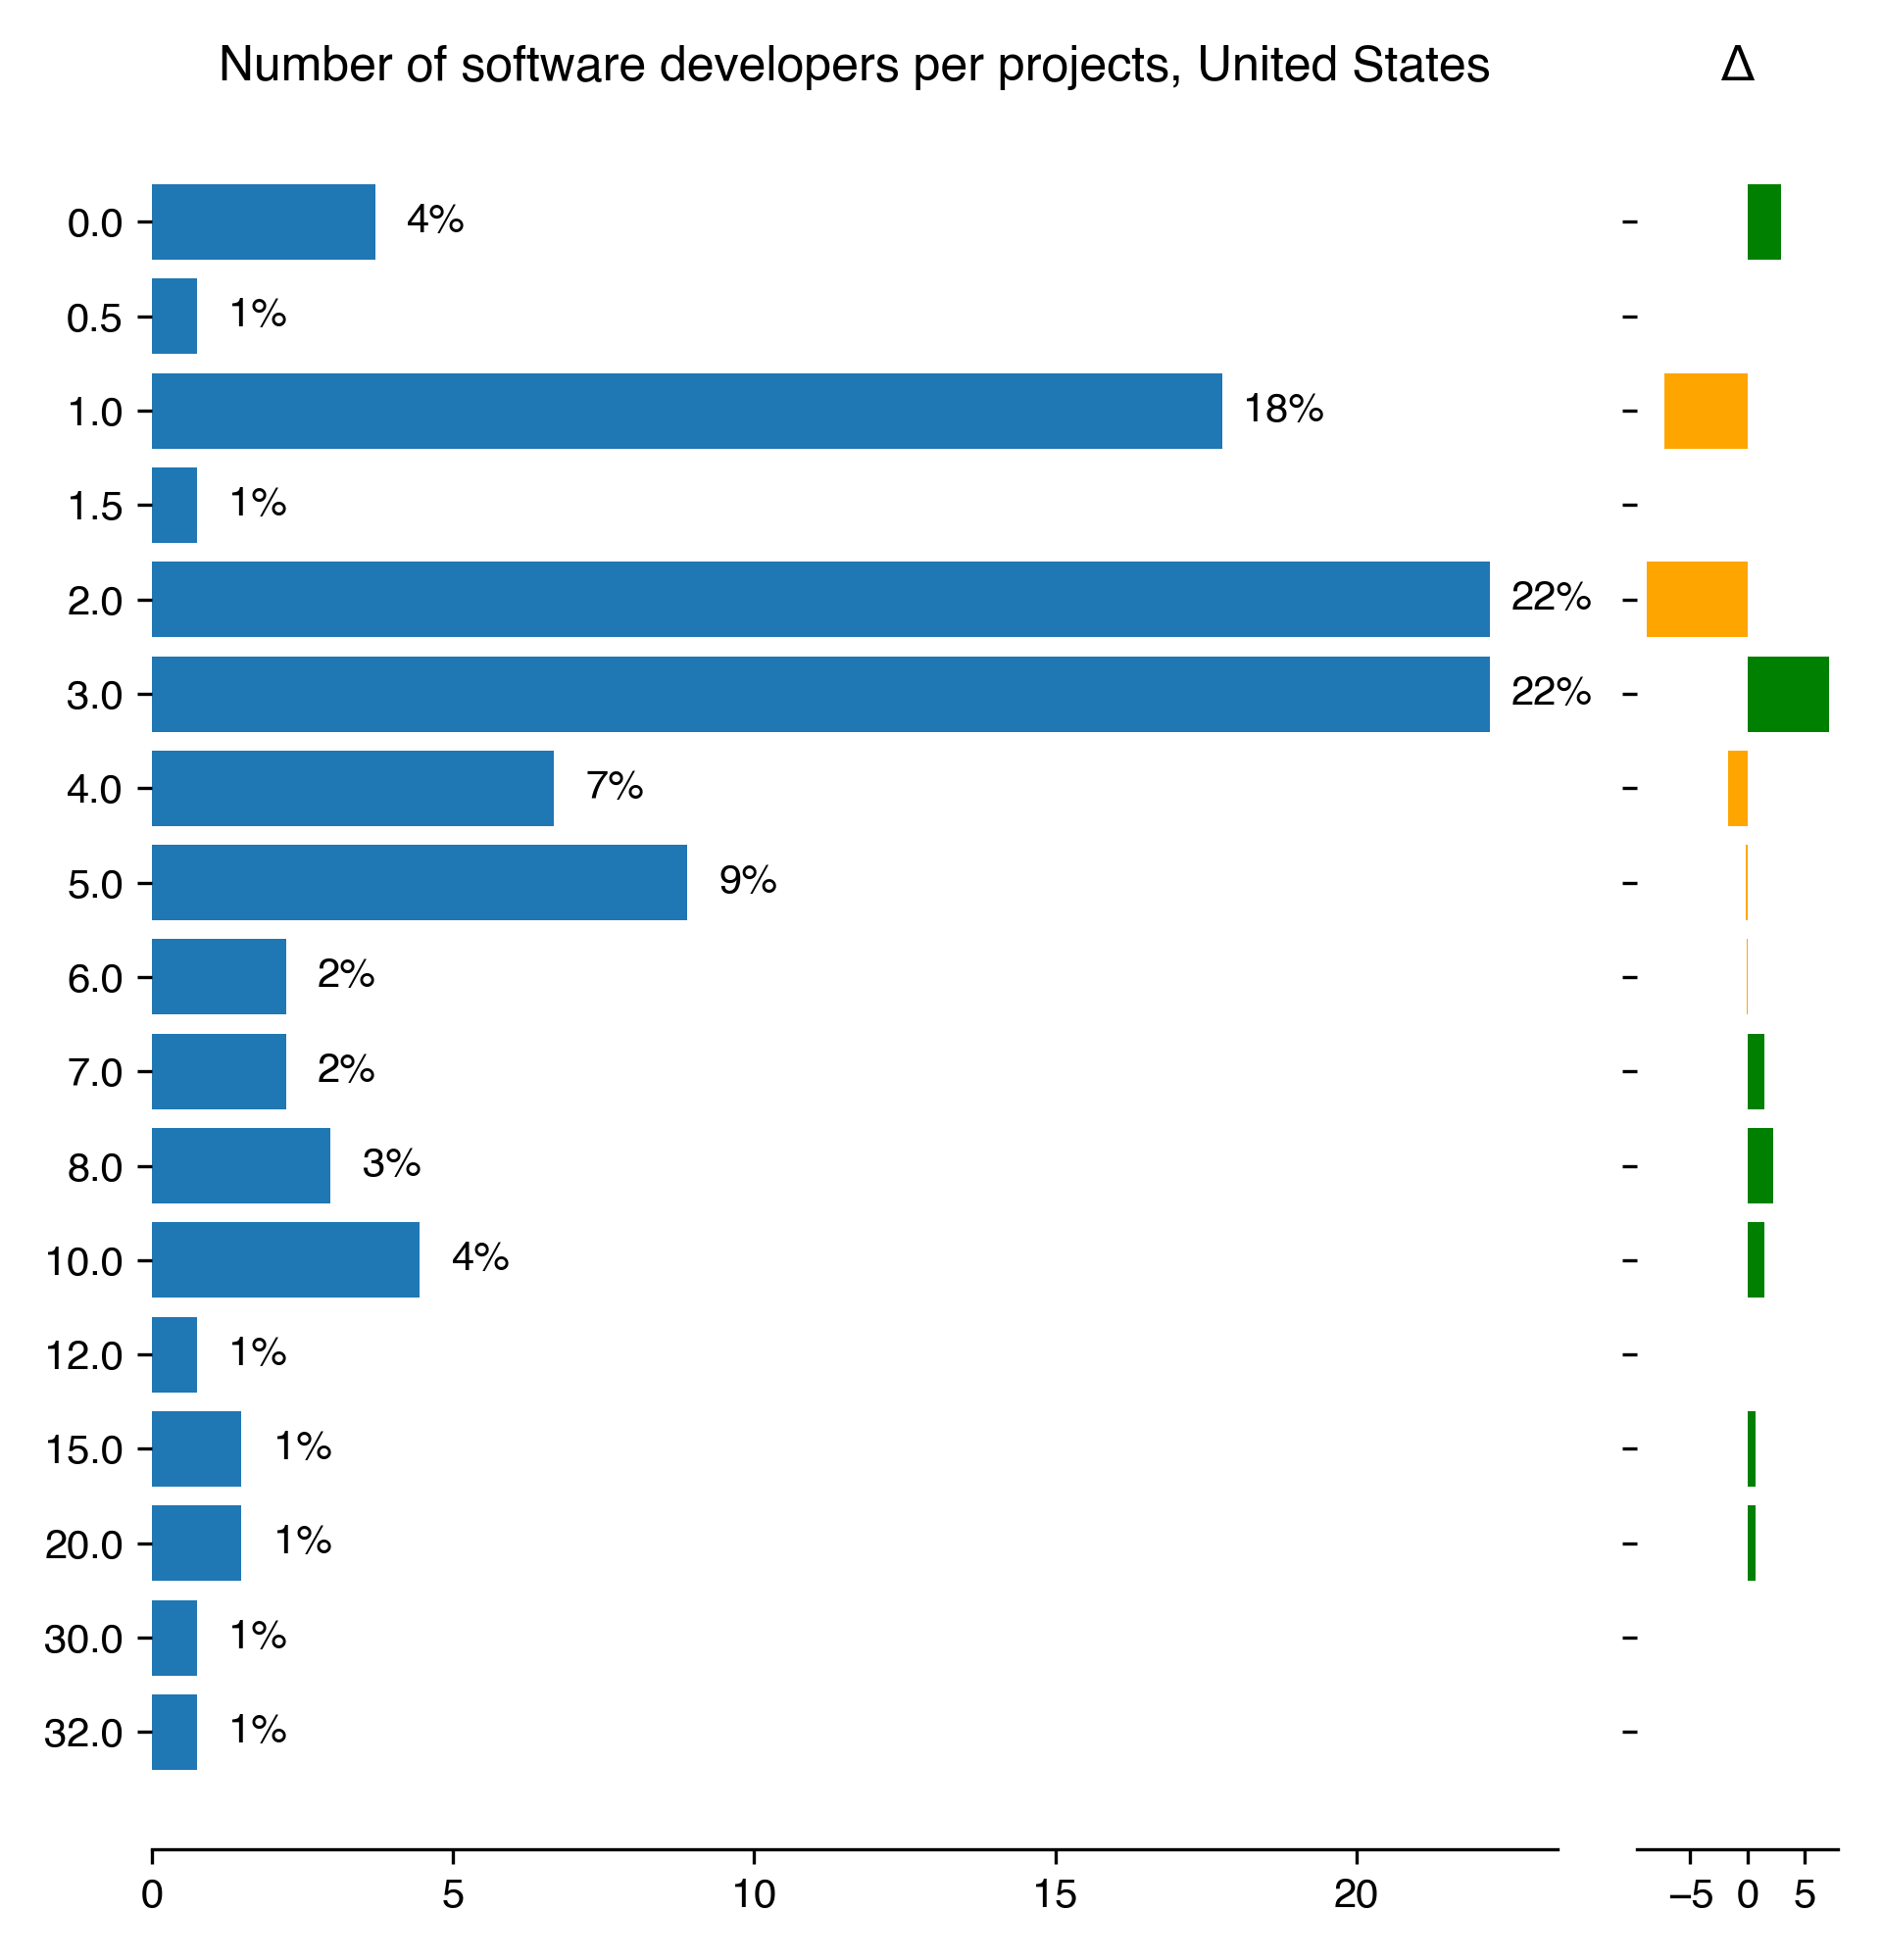
| Number of software developers per projects for United States |
Count |
Percentage |
Percentage in 2018 |
Difference with previous year |
| 0 |
5 |
3.7 |
0.76 |
2.95 |
| 0.5 |
1 |
0.74 |
nan |
nan |
| 1 |
24 |
17.78 |
25 |
-7.22 |
| 1.5 |
1 |
0.74 |
nan |
nan |
| 2 |
30 |
22.22 |
31.06 |
-8.84 |
| 3 |
30 |
22.22 |
15.15 |
7.07 |
| 4 |
9 |
6.67 |
8.33 |
-1.67 |
| 5 |
12 |
8.89 |
9.09 |
-0.2 |
| 6 |
3 |
2.22 |
2.27 |
-0.05 |
| 7 |
3 |
2.22 |
0.76 |
1.46 |
| 8 |
4 |
2.96 |
0.76 |
2.21 |
| 10 |
6 |
4.44 |
3.03 |
1.41 |
| 12 |
1 |
0.74 |
0.76 |
-0.02 |
| 15 |
2 |
1.48 |
0.76 |
0.72 |
| 20 |
2 |
1.48 |
0.76 |
0.72 |
| 30 |
1 |
0.74 |
0.76 |
-0.02 |
| 32 |
1 |
0.74 |
nan |
nan |
Download CSV
PNG SVG
Training
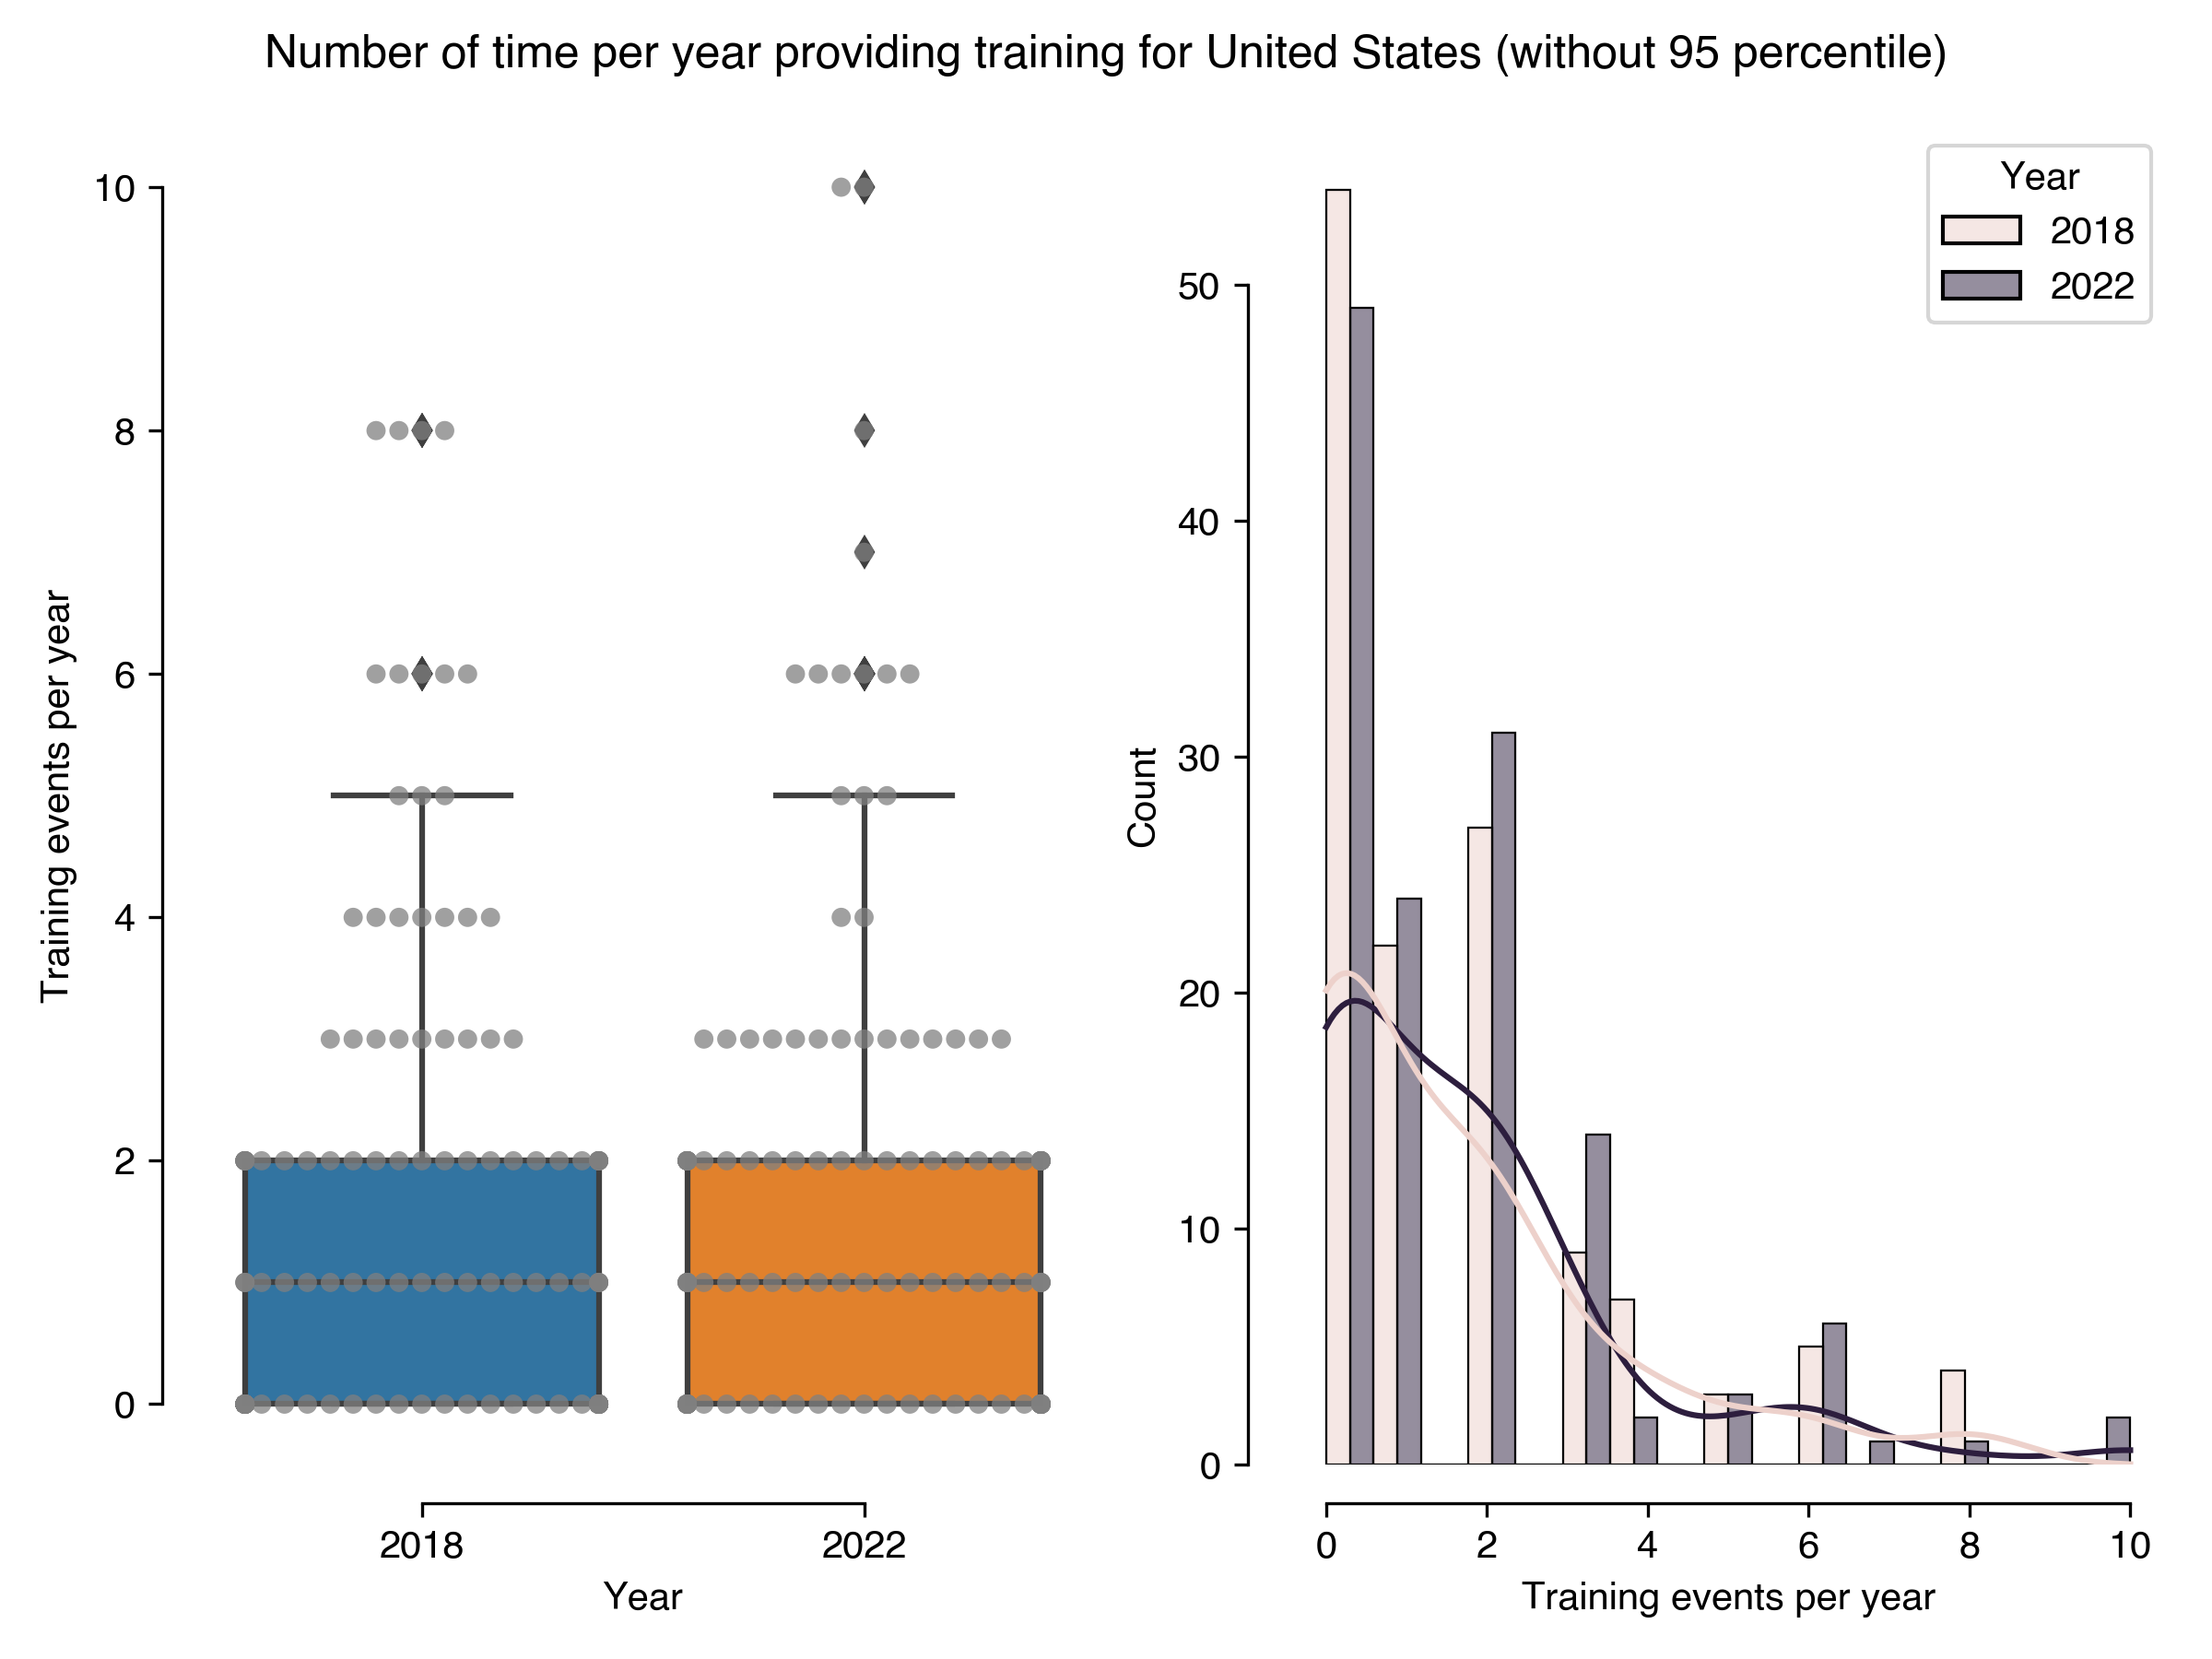
| Number of time per year providing training for United States (without 95 percentile) |
Results in 2022 |
Results in 2018 |
| count |
133 |
131 |
| mean |
1.67 |
1.59 |
| std |
2.02 |
1.97 |
| min |
0 |
0 |
| 25% |
0 |
0 |
| 50% |
1 |
1 |
| 75% |
2 |
2 |
| max |
10 |
8 |
Download CSV
PNG SVG
PNG SVG
World
Developing code for others
| Developing code for others for World |
Count |
Percentage |
Percentage in 2018 |
Difference with previous year |
| 0 - Mostly me |
72 |
7.67 |
6.83 |
0.83 |
| 1 |
105 |
11.18 |
13.47 |
-2.29 |
| 2 |
141 |
15.02 |
17.69 |
-2.67 |
| 3 |
187 |
19.91 |
18.19 |
1.72 |
| 4 |
187 |
19.91 |
17.89 |
2.03 |
| 5 - Mostly other people |
247 |
26.3 |
25.93 |
0.37 |
Download CSV
PNG SVG
Working with same researchers
| Working with same researchers for World |
Count |
Percentage |
Percentage in 2018 |
Difference with previous year |
| Different researchers, same research group |
133 |
15.63 |
17.13 |
-1.5 |
| Regularly change researcher(s) |
390 |
45.83 |
38.3 |
7.53 |
| Same researcher(s) |
328 |
38.54 |
44.57 |
-6.03 |
Download CSV
PNG SVG
Part of dedicated group
| Member of a dedicated group for World |
Count |
Percentage |
Percentage in 2018 |
Difference with previous year |
| No |
402 |
47.24 |
49.78 |
-2.54 |
| Yes |
449 |
52.76 |
50.22 |
2.54 |
Download CSV
PNG SVG
Number of projects
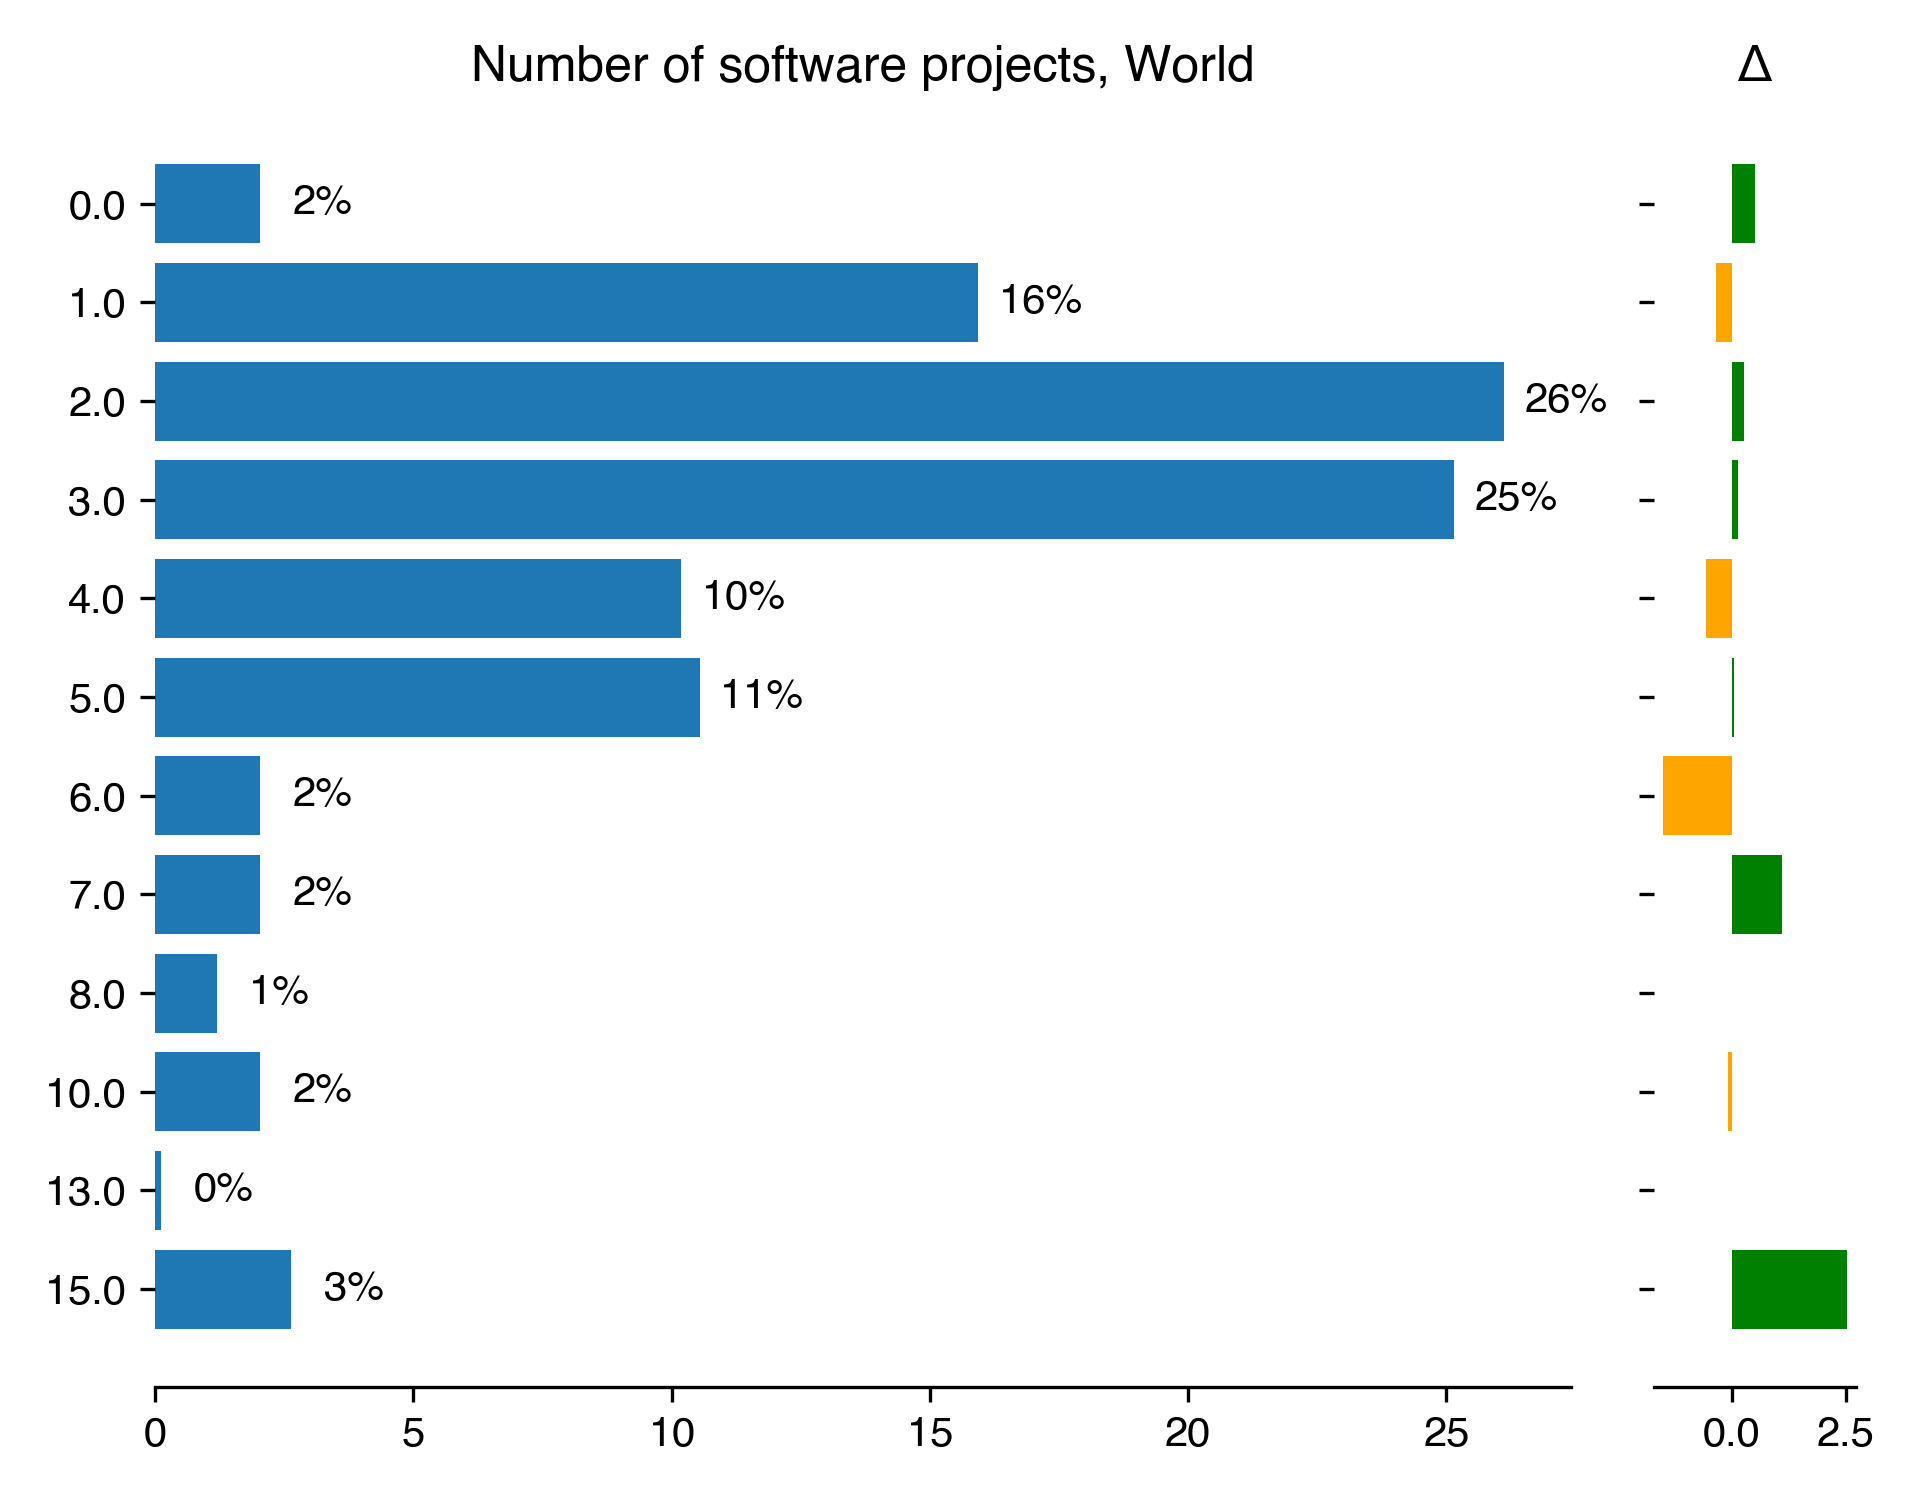
| Number of software projects for World |
Count |
Percentage |
Percentage in 2018 |
Difference with previous year |
| 0 |
17 |
2.04 |
1.53 |
0.5 |
| 1 |
133 |
15.93 |
16.27 |
-0.35 |
| 2 |
218 |
26.11 |
25.83 |
0.28 |
| 3 |
210 |
25.15 |
25 |
0.15 |
| 4 |
85 |
10.18 |
10.73 |
-0.55 |
| 5 |
88 |
10.54 |
10.5 |
0.04 |
| 6 |
17 |
2.04 |
3.54 |
-1.5 |
| 7 |
17 |
2.04 |
0.94 |
1.09 |
| 8 |
10 |
1.2 |
1.18 |
0.02 |
| 10 |
17 |
2.04 |
2.12 |
-0.09 |
| 13 |
1 |
0.12 |
nan |
nan |
| 15 |
22 |
2.63 |
0.12 |
2.52 |
Download CSV
PNG SVG
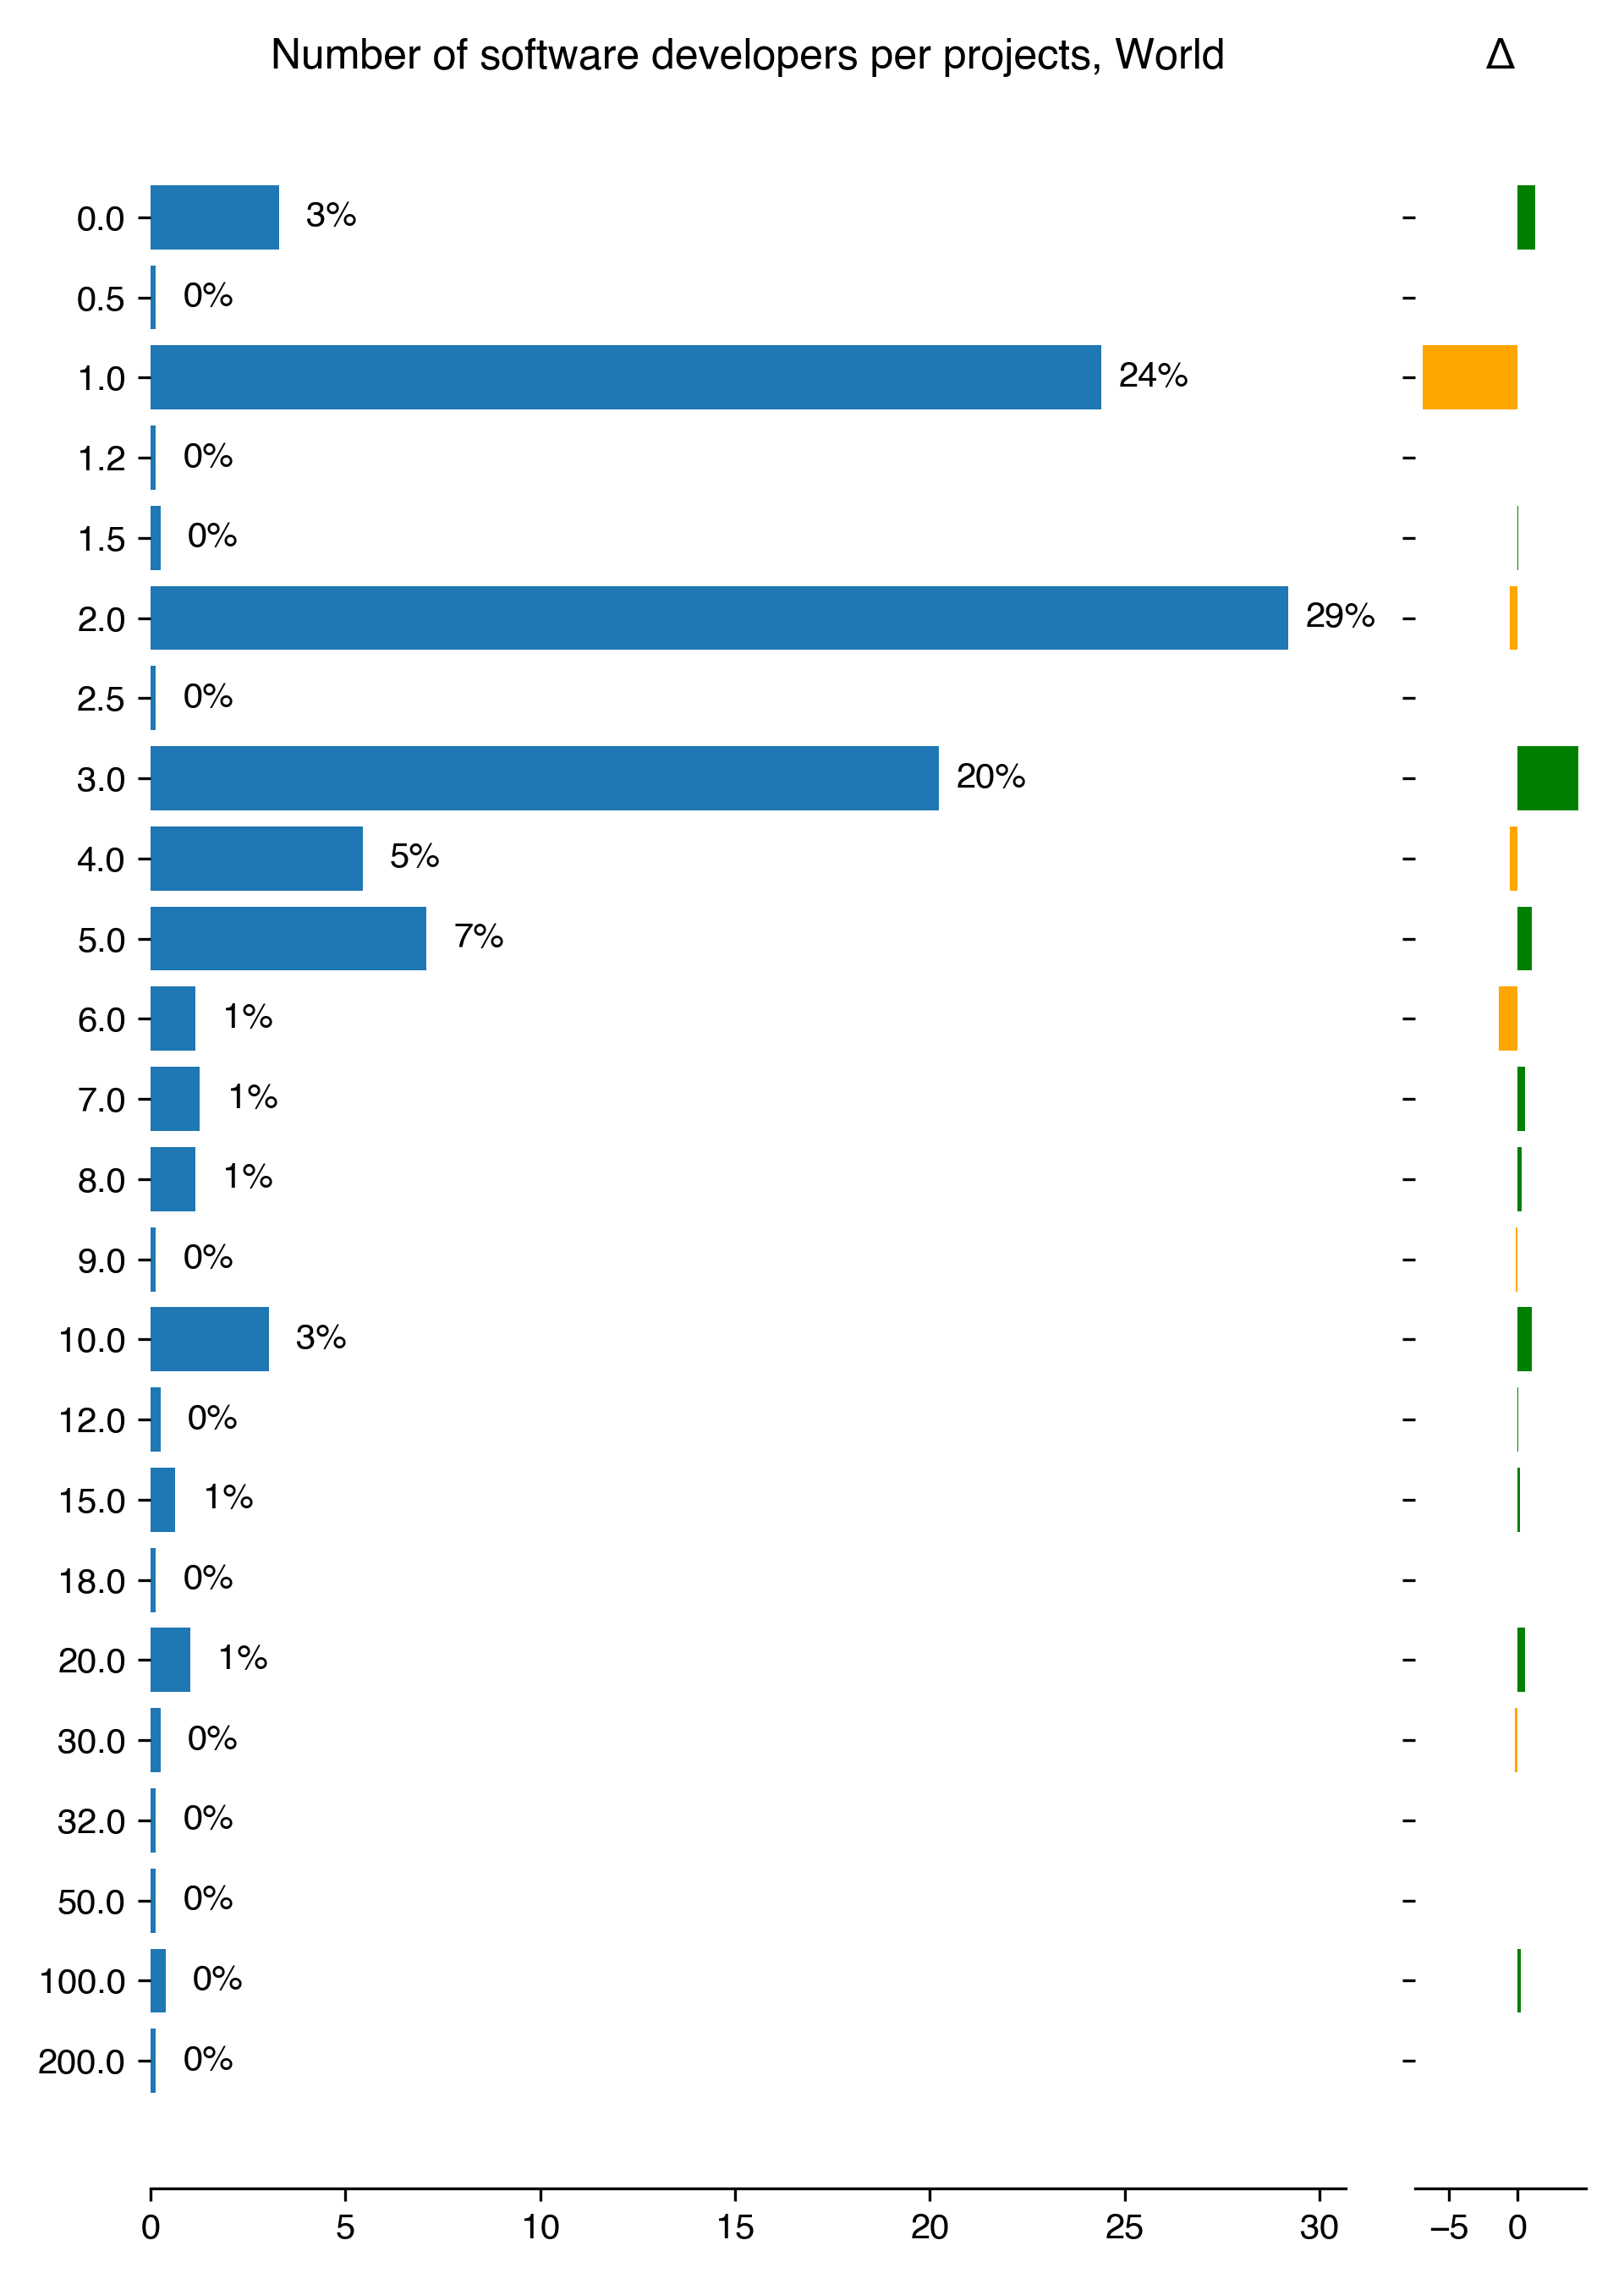
| Number of software developers per projects for World |
Count |
Percentage |
Percentage in 2018 |
Difference with previous year |
| 0 |
26 |
3.29 |
2.01 |
1.28 |
| 0.5 |
1 |
0.13 |
nan |
nan |
| 1 |
193 |
24.4 |
31.29 |
-6.89 |
| 1.2 |
1 |
0.13 |
nan |
nan |
| 1.5 |
2 |
0.25 |
0.24 |
0.02 |
| 2 |
231 |
29.2 |
29.75 |
-0.55 |
| 2.5 |
1 |
0.13 |
0.12 |
0.01 |
| 3 |
160 |
20.23 |
15.82 |
4.41 |
| 4 |
43 |
5.44 |
6.02 |
-0.59 |
| 5 |
56 |
7.08 |
6.02 |
1.06 |
| 6 |
9 |
1.14 |
2.48 |
-1.34 |
| 7 |
10 |
1.26 |
0.71 |
0.56 |
| 8 |
9 |
1.14 |
0.83 |
0.31 |
| 9 |
1 |
0.13 |
0.24 |
-0.11 |
| 10 |
24 |
3.03 |
2.01 |
1.03 |
| 12 |
2 |
0.25 |
0.24 |
0.02 |
| 15 |
5 |
0.63 |
0.47 |
0.16 |
| 18 |
1 |
0.13 |
nan |
nan |
| 20 |
8 |
1.01 |
0.47 |
0.54 |
| 30 |
2 |
0.25 |
0.47 |
-0.22 |
| 32 |
1 |
0.13 |
nan |
nan |
| 50 |
1 |
0.13 |
0.12 |
0.01 |
| 100 |
3 |
0.38 |
0.12 |
0.26 |
| 200 |
1 |
0.13 |
nan |
nan |
Download CSV
PNG SVG
Training
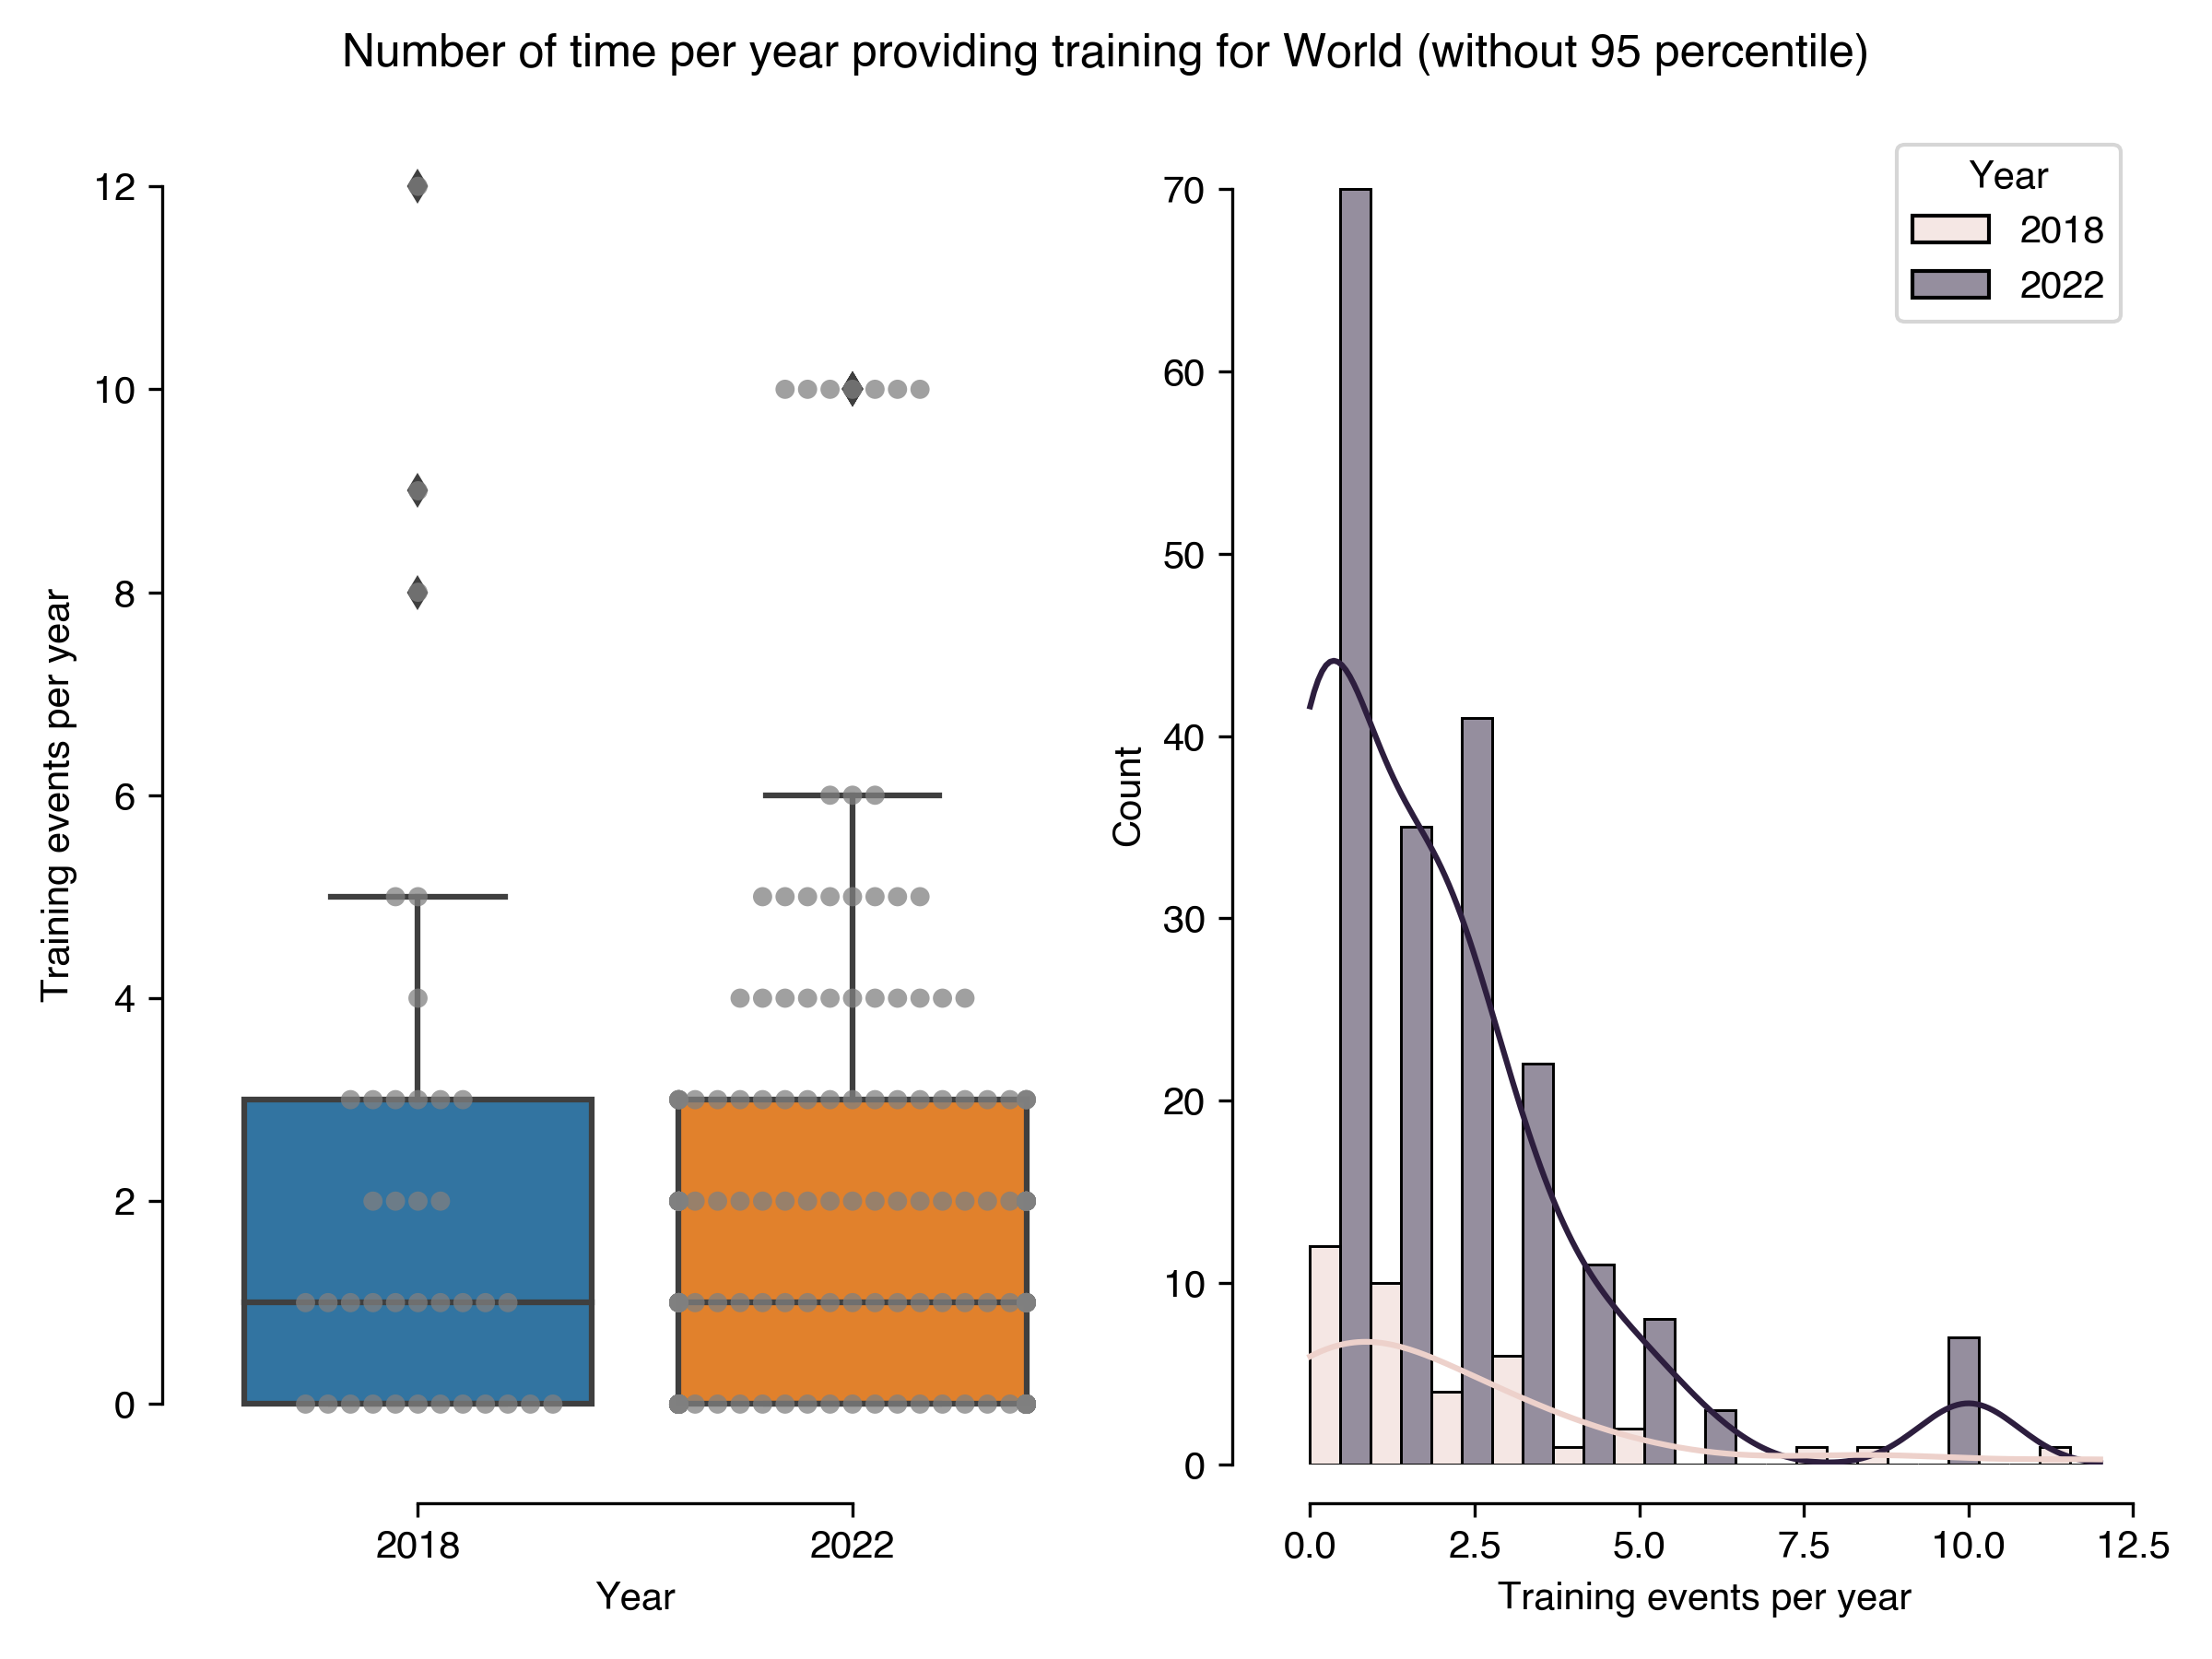
| Number of time per year providing training for World (without 95 percentile) |
Results in 2022 |
Results in 2018 |
| count |
197 |
38 |
| mean |
1.8 |
2.08 |
| std |
2.19 |
2.71 |
| min |
0 |
0 |
| 25% |
0 |
0 |
| 50% |
1 |
1 |
| 75% |
3 |
3 |
| max |
10 |
12 |
Download CSV
PNG SVG
PNG SVG