Australia Canada Germany Netherlands New Zealand South Africa United Kingdom United States World
This section comprises sections that focus on the technical and development
aspects of the RSEs’ work. They aim to understand good practices in developing
software.
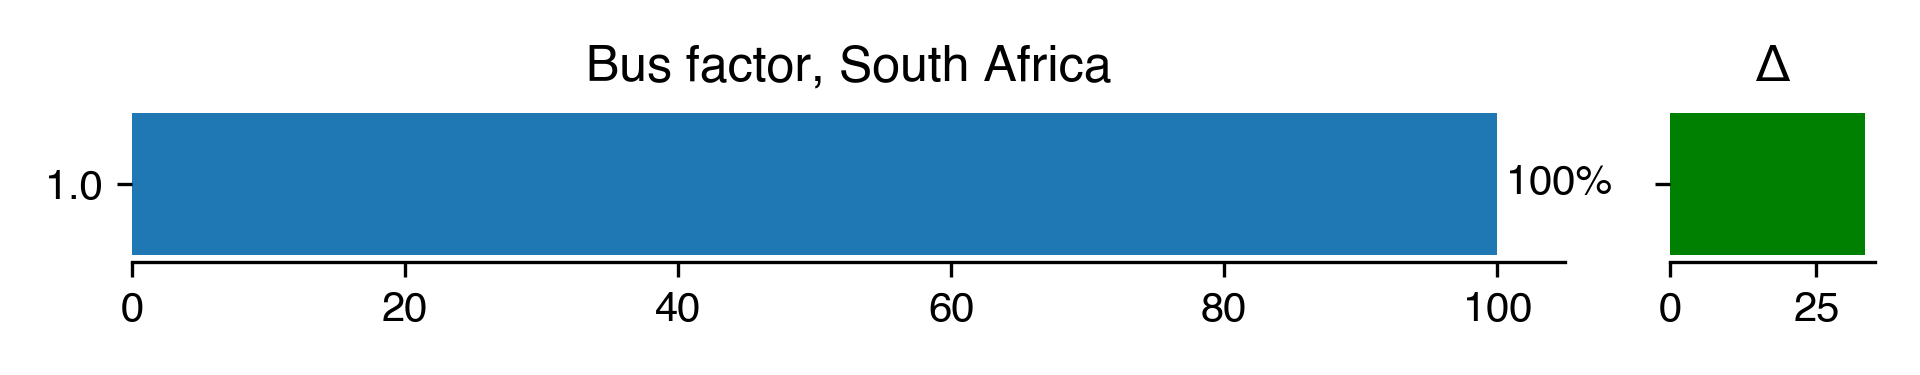
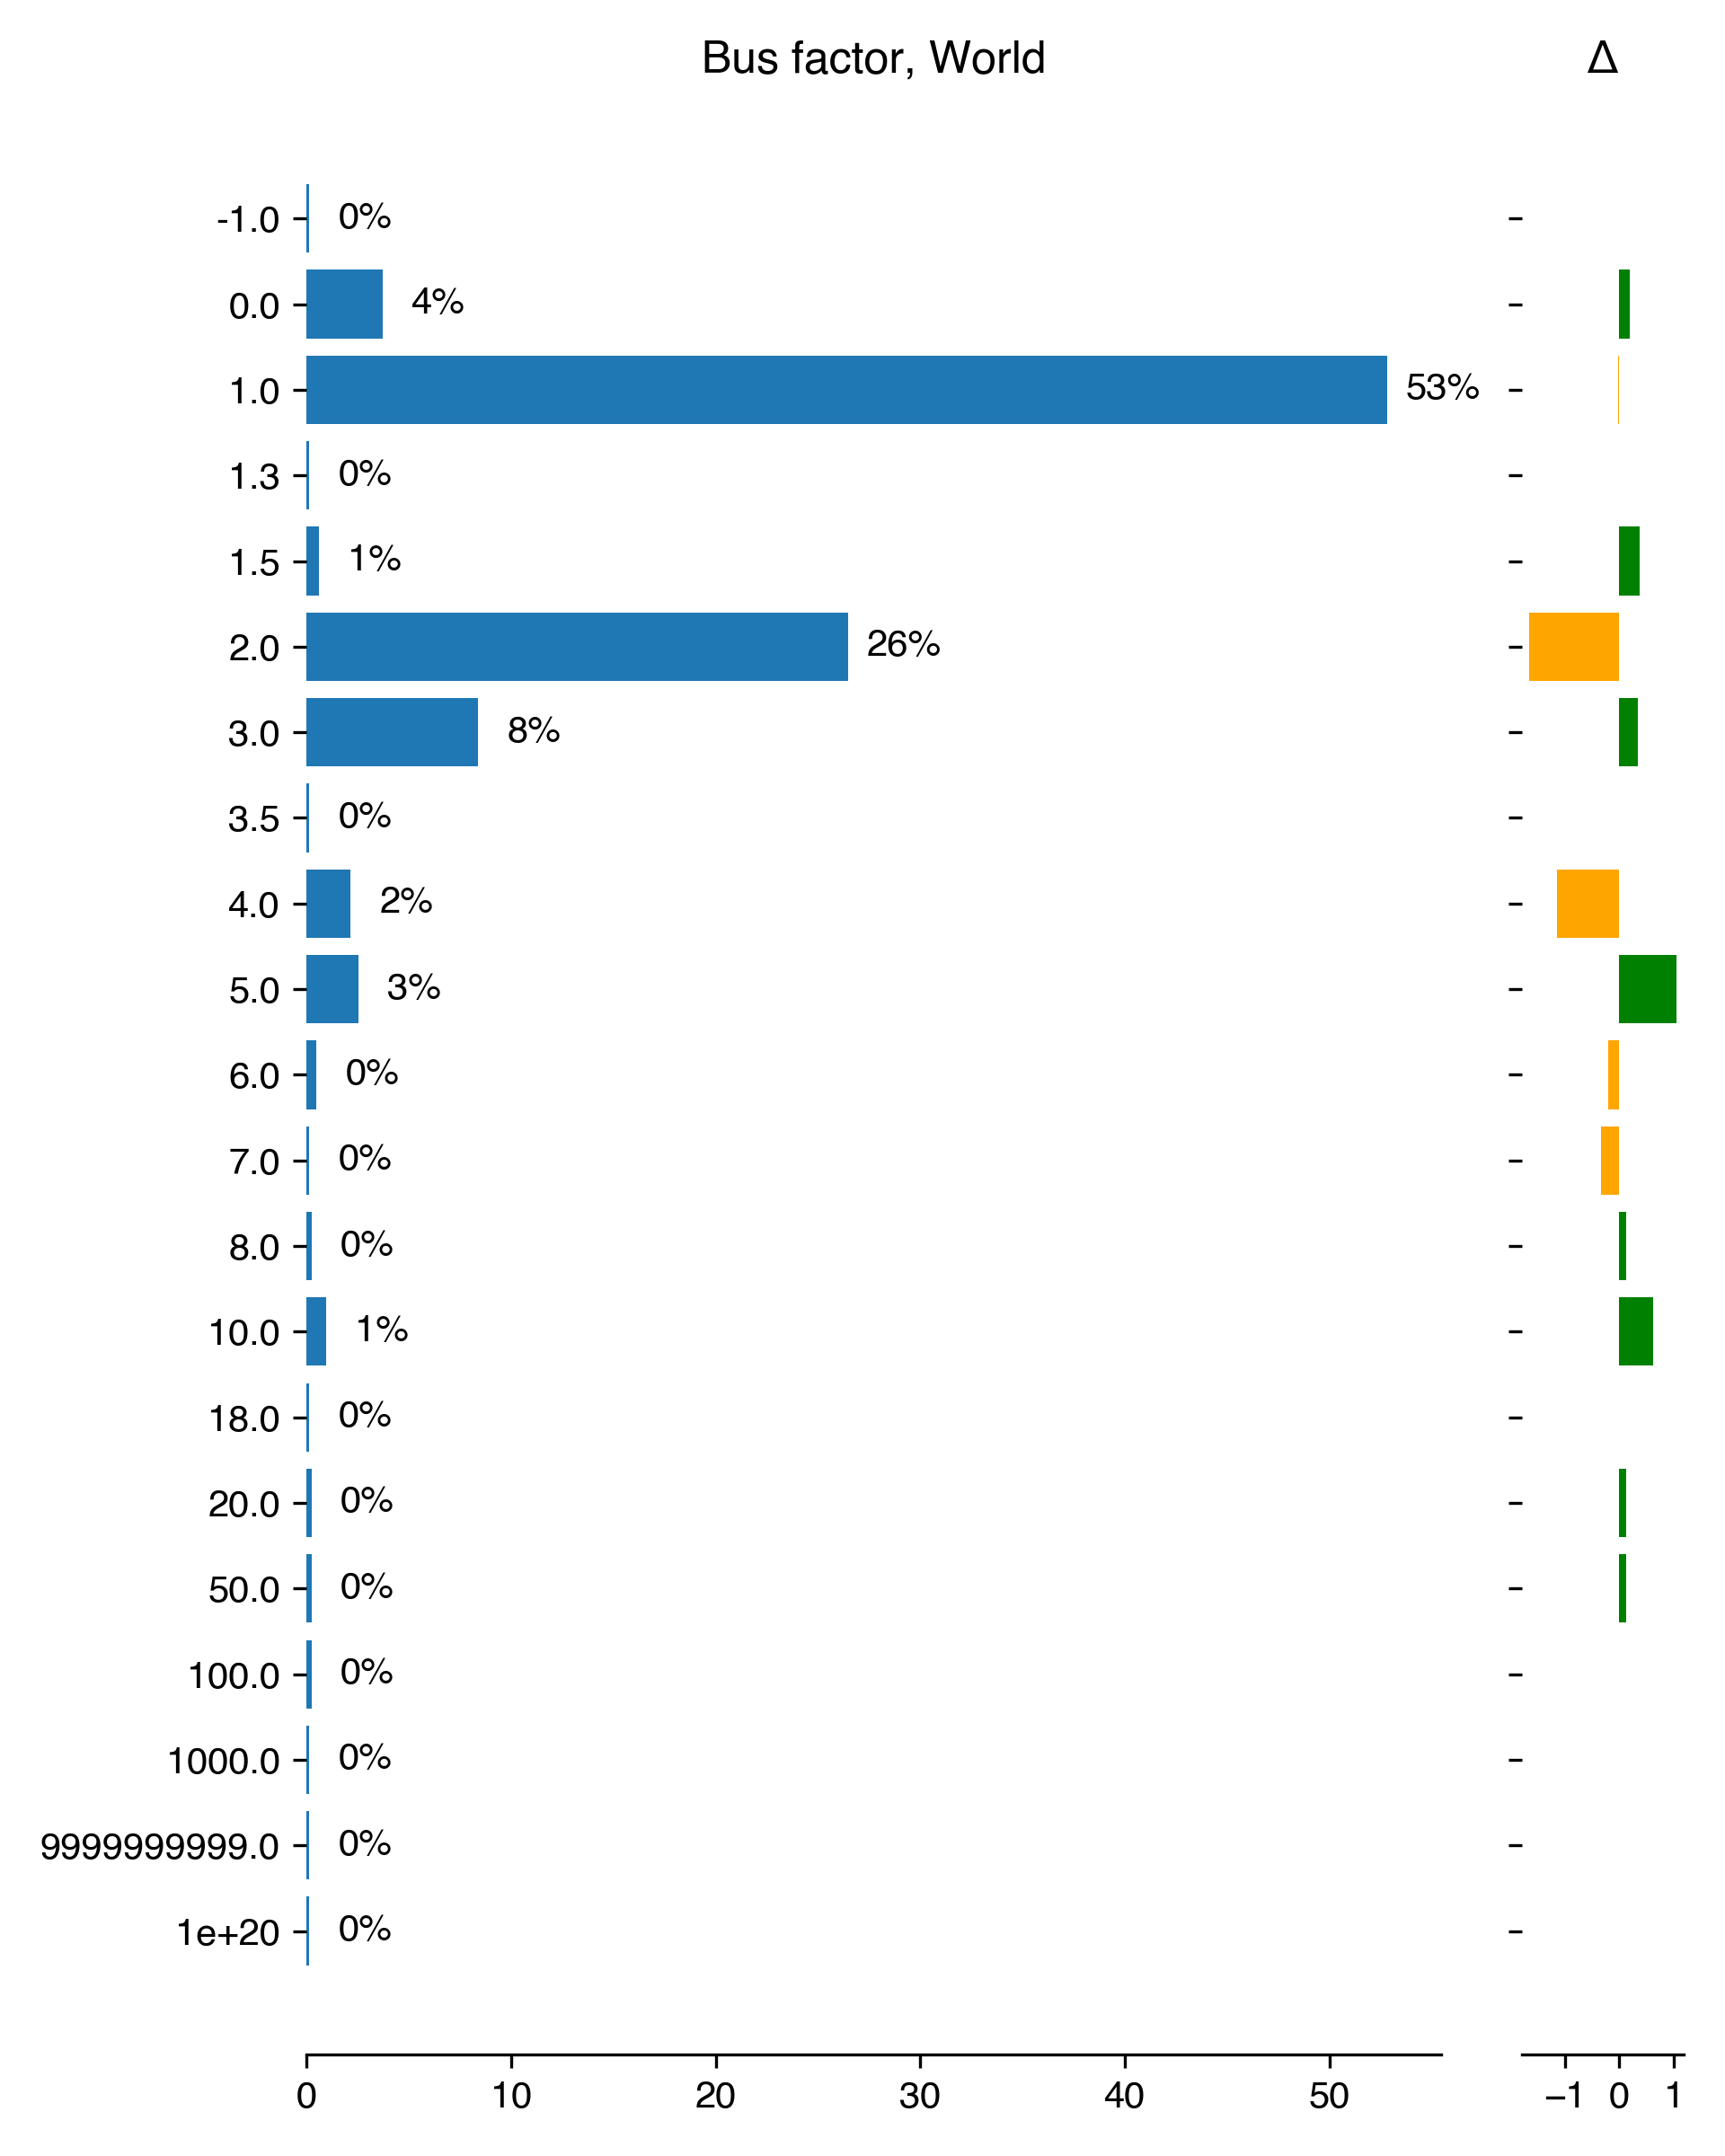
We chose two broad measures to provide an insight into sustainability: the
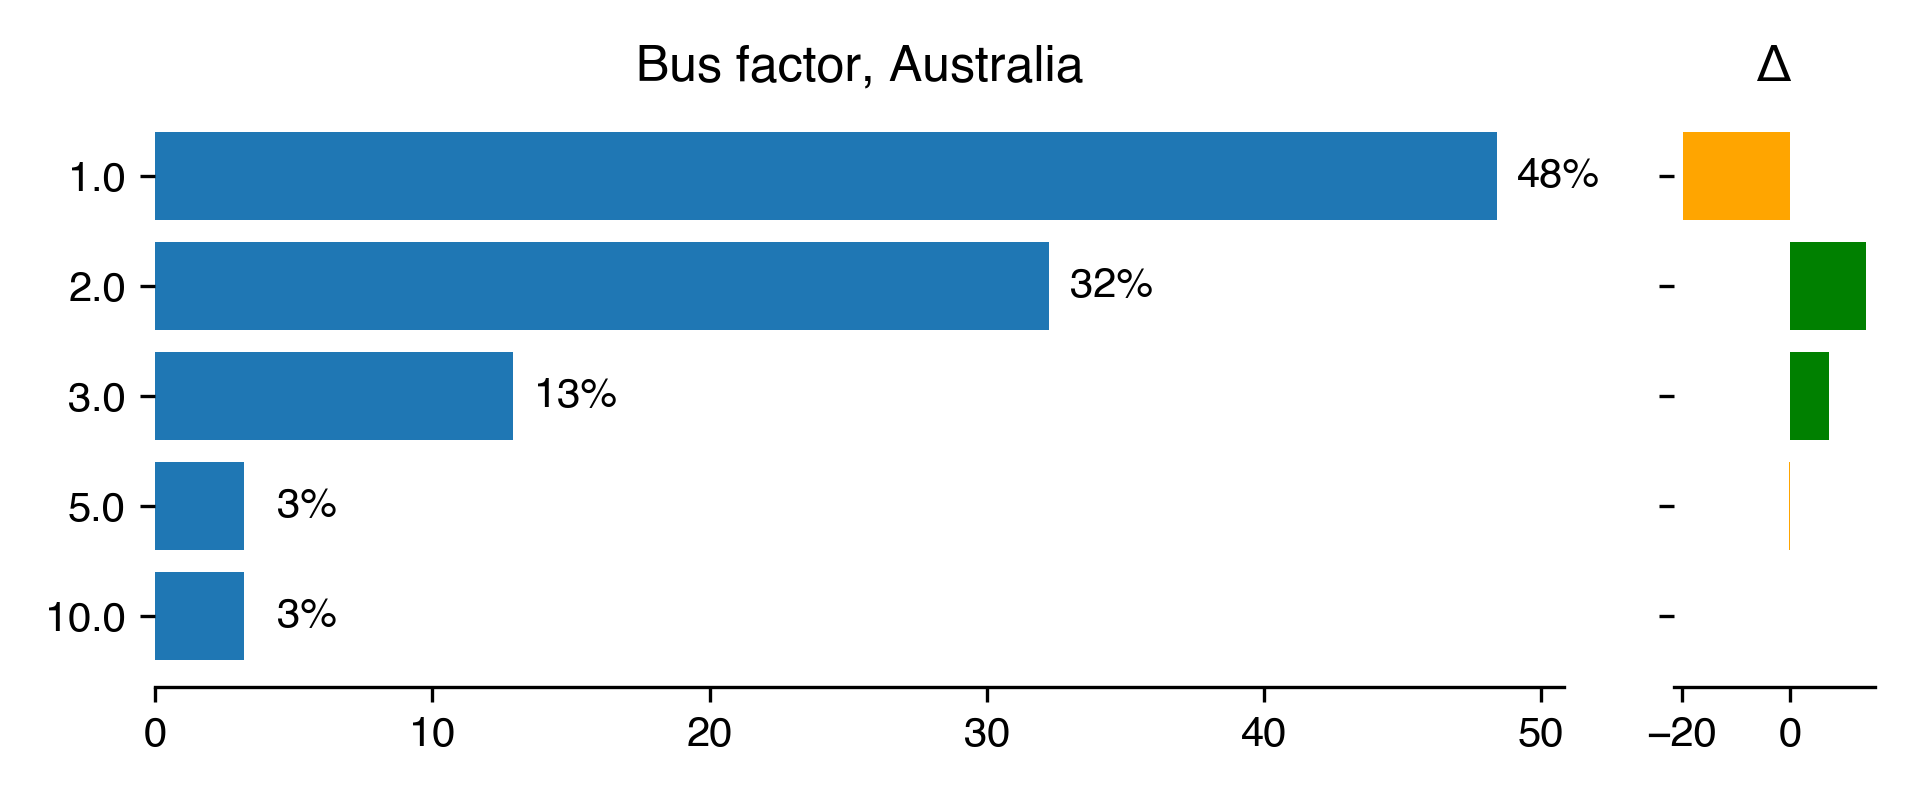
bus factor and technical hand over planning .
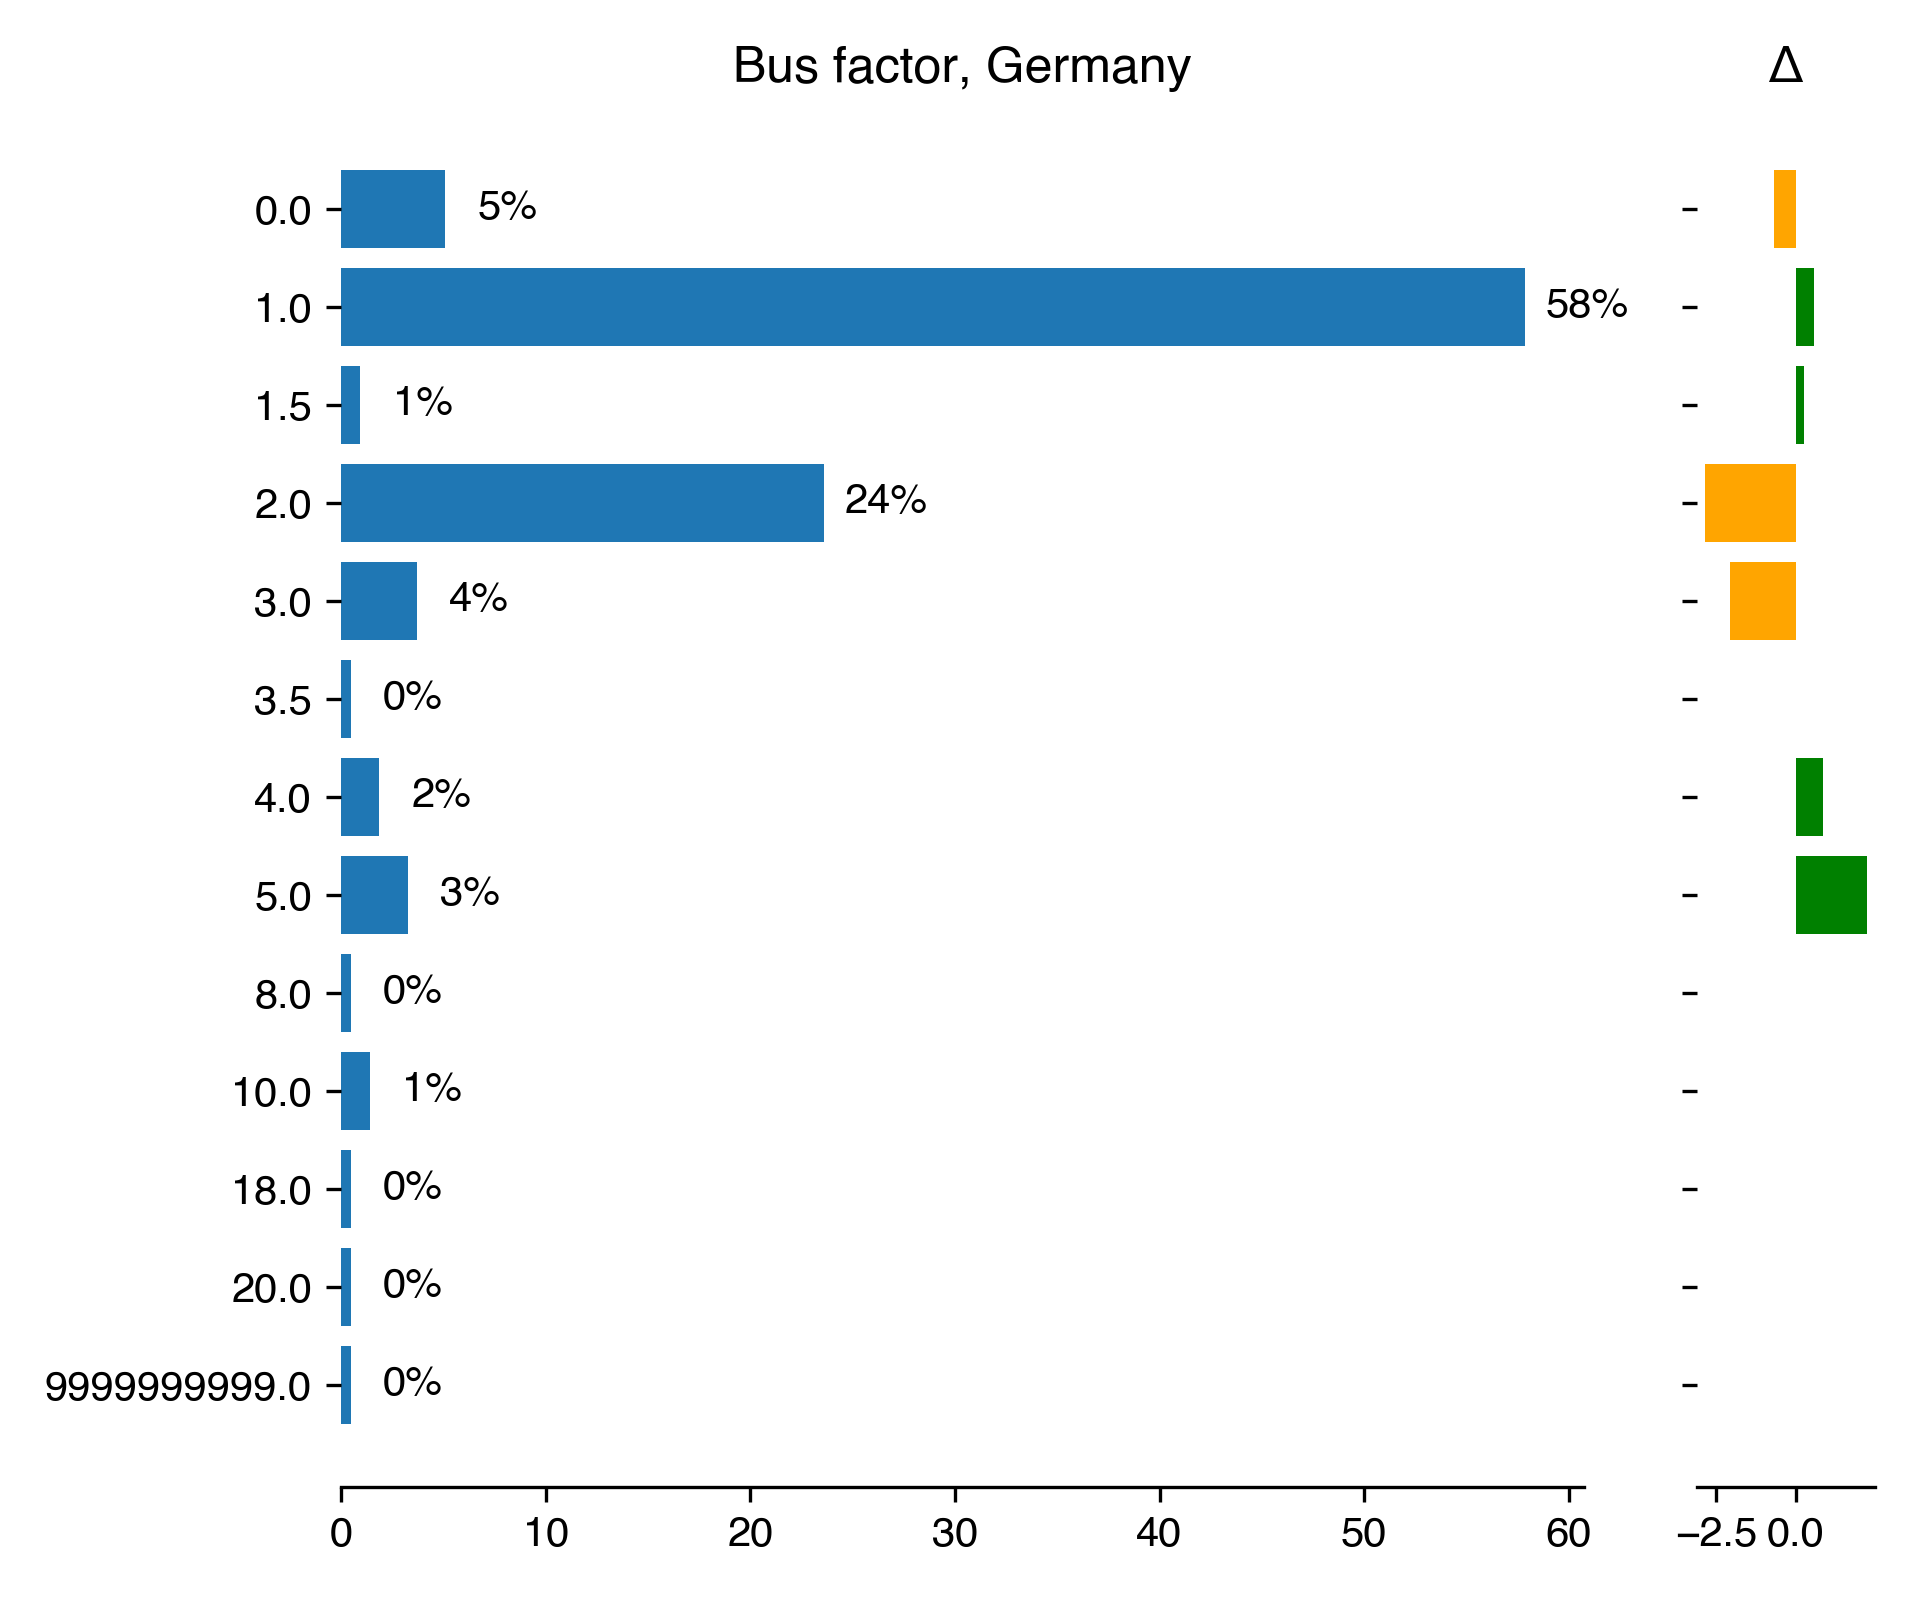
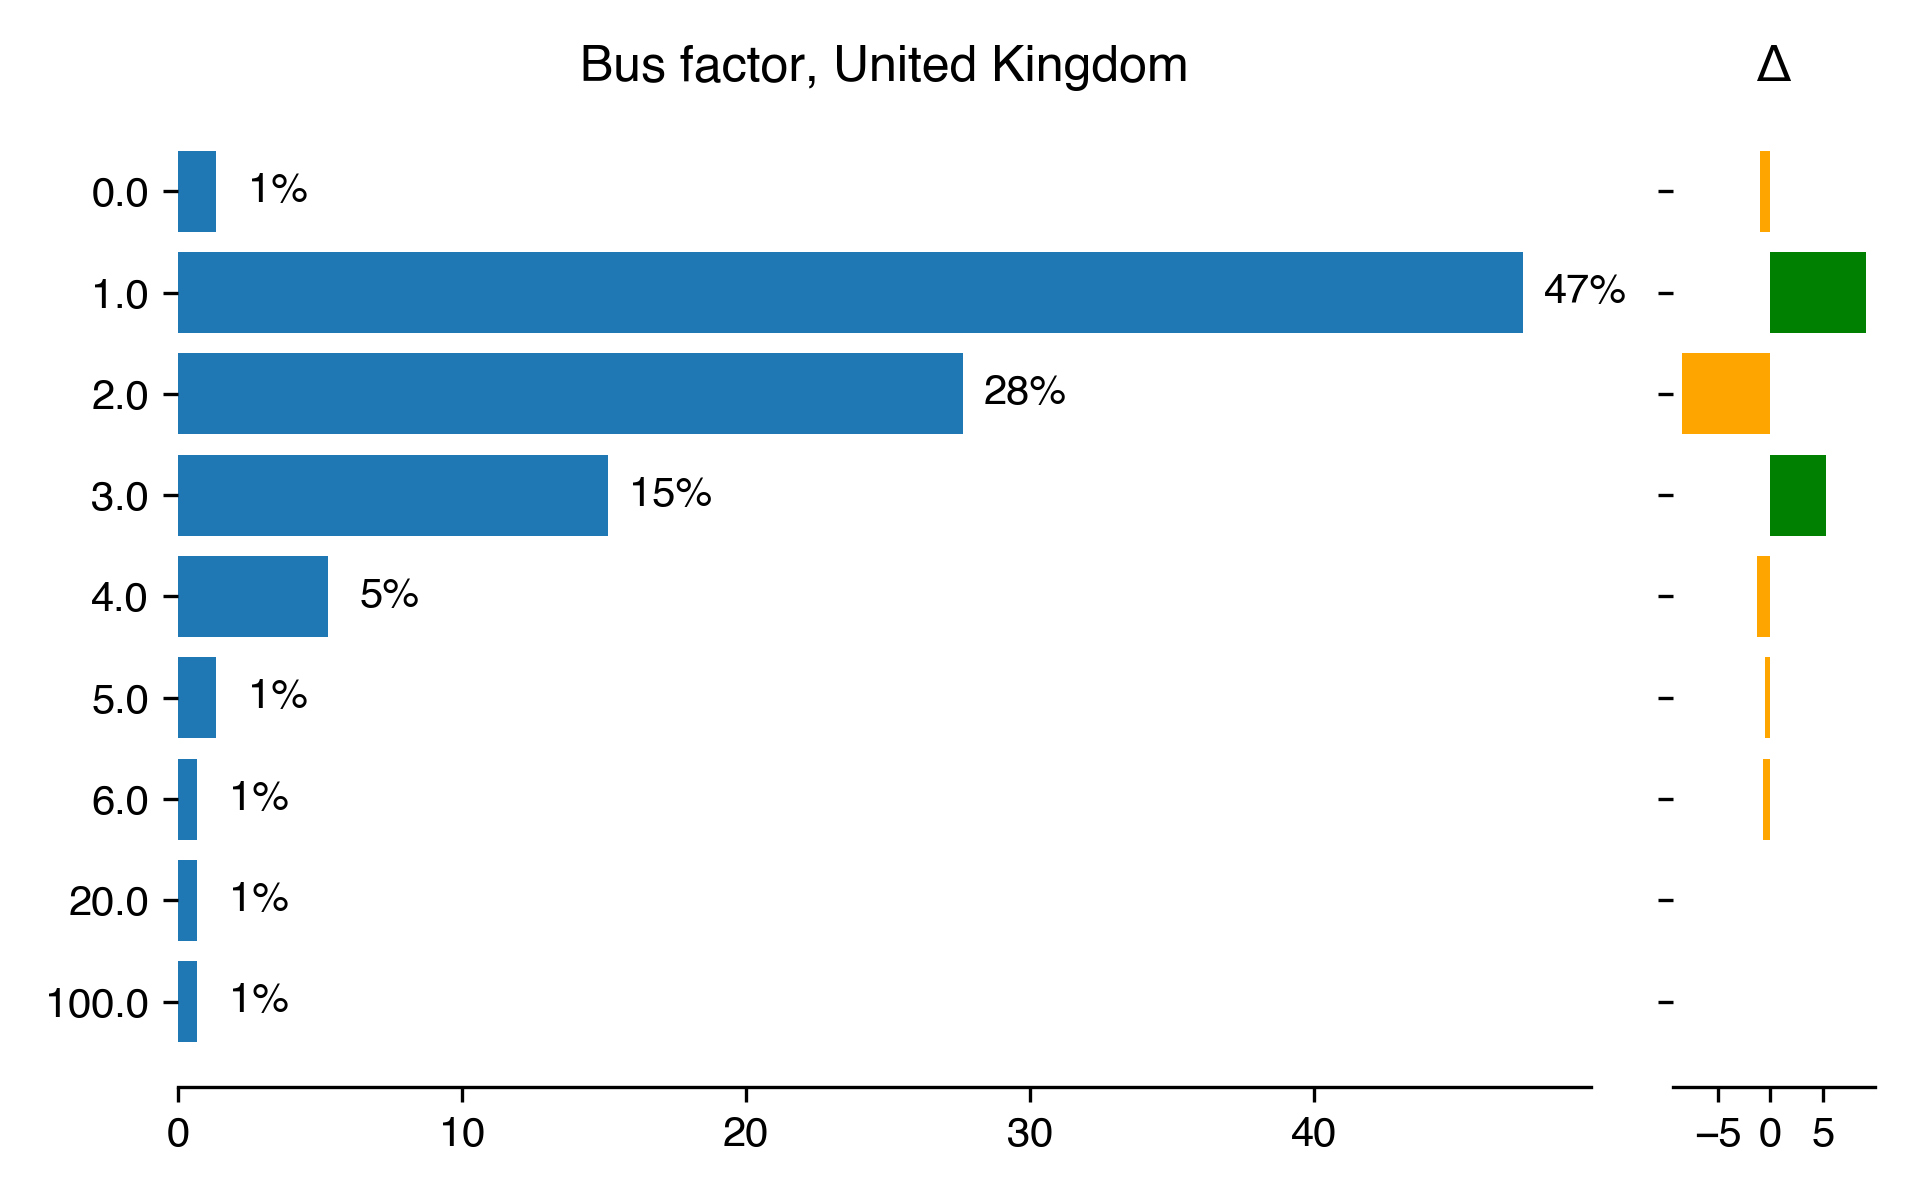
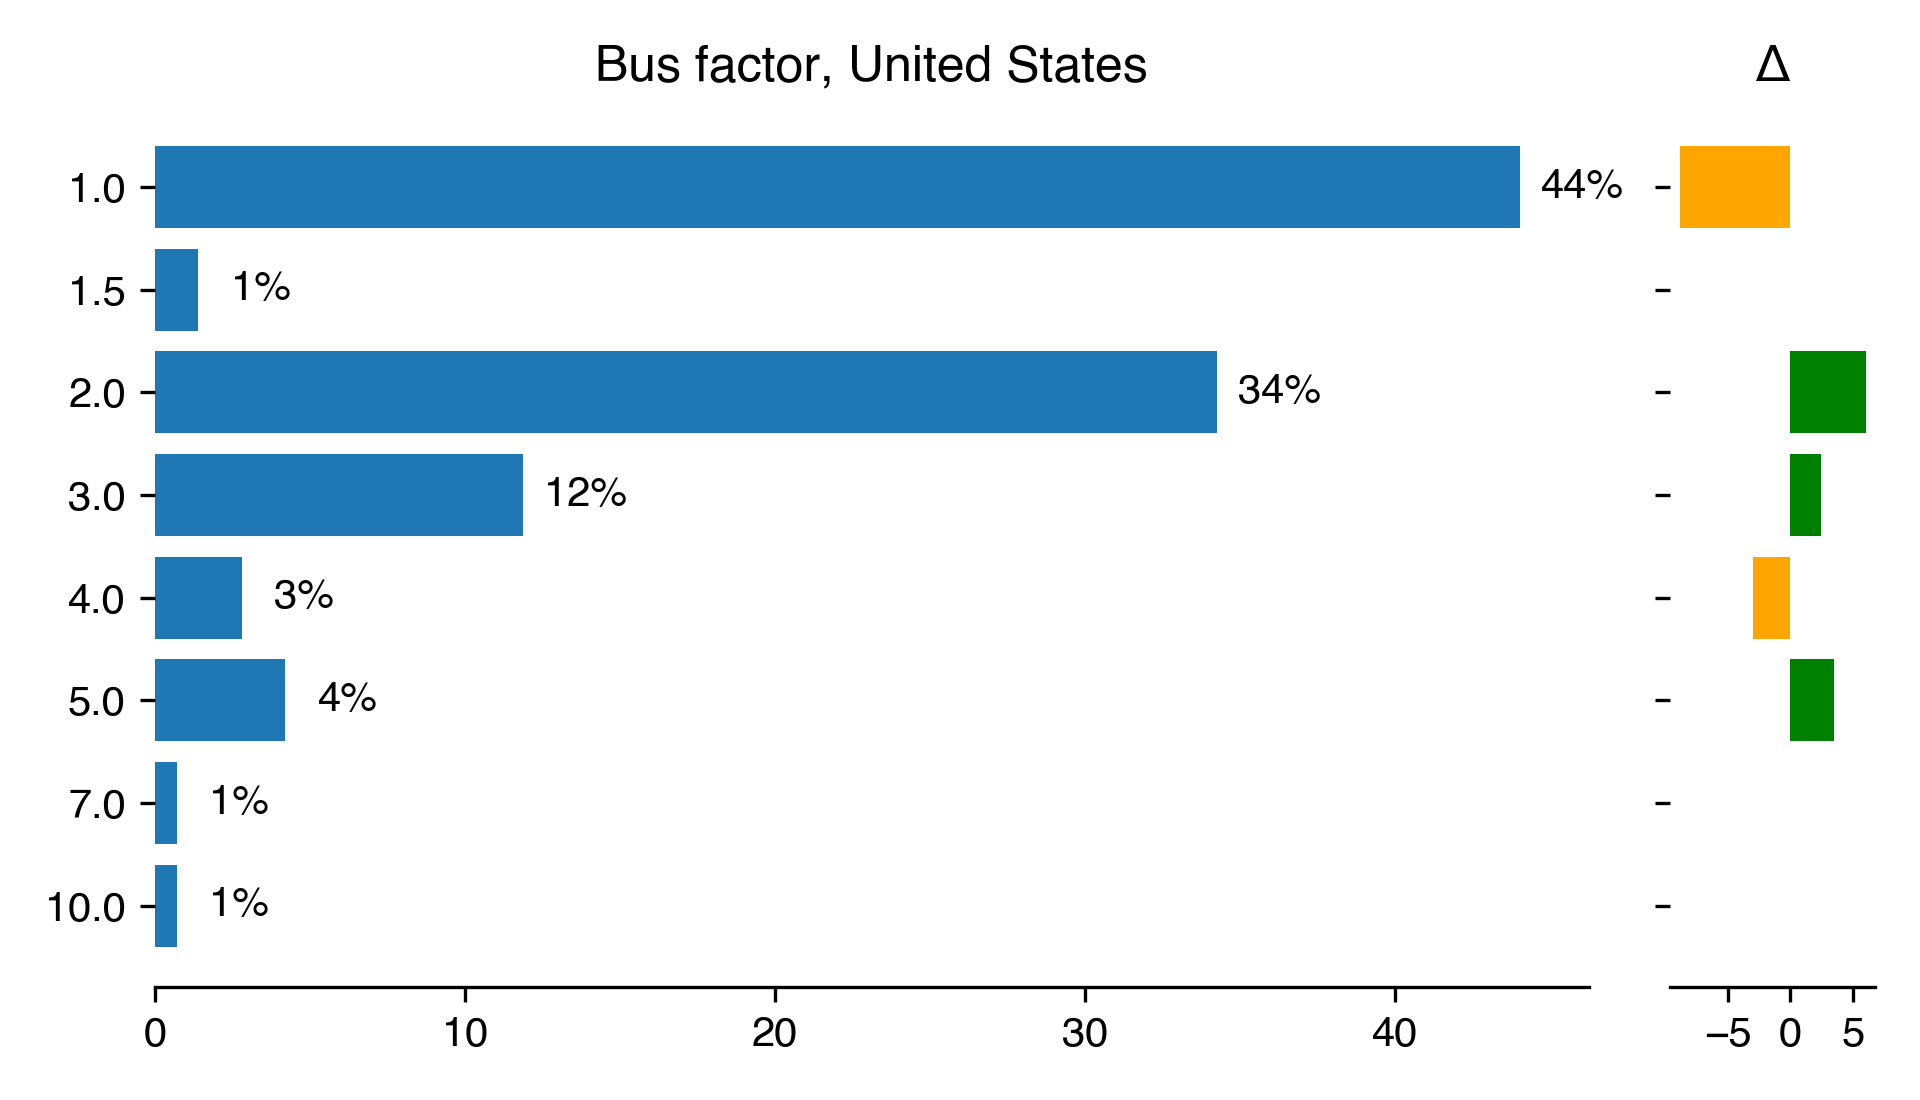
The bus factor is a measure of the number of developers who understand
a specific software project and could, with only a cursory review of the
project, maintain or extend the code. A project with a bus factor of 1 is
completely reliant on only one developer. If this developer finds new
employment, becomes ill or is hit by the titular bus, then the project will
fail. A high bus factor provides some confidence that the project can be
sustained even if a developer leaves.
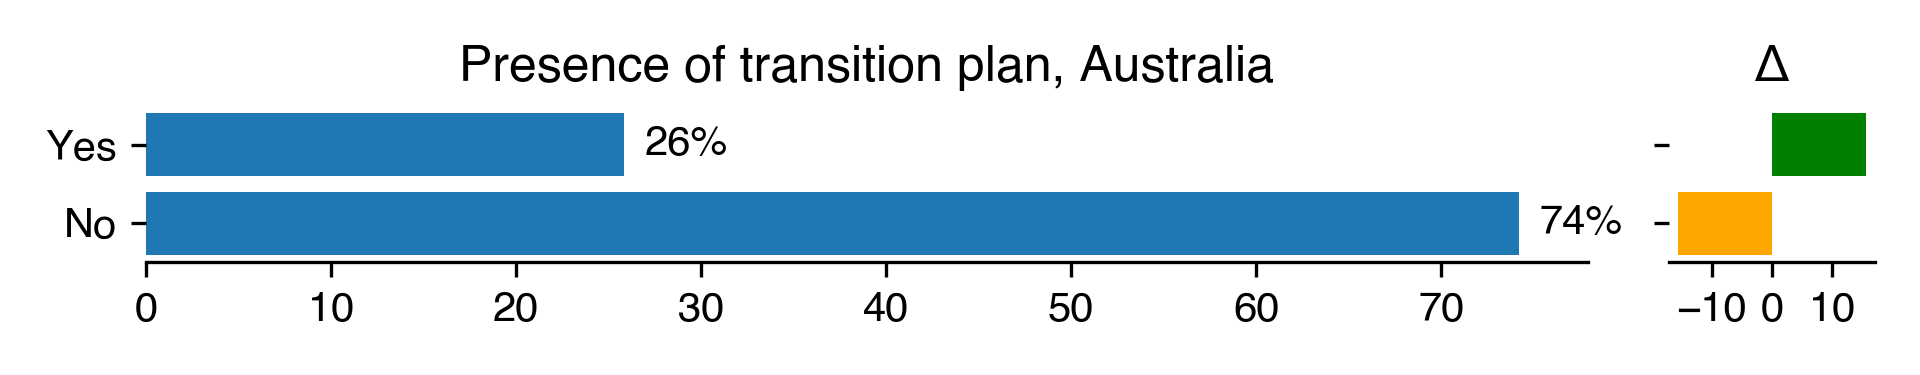
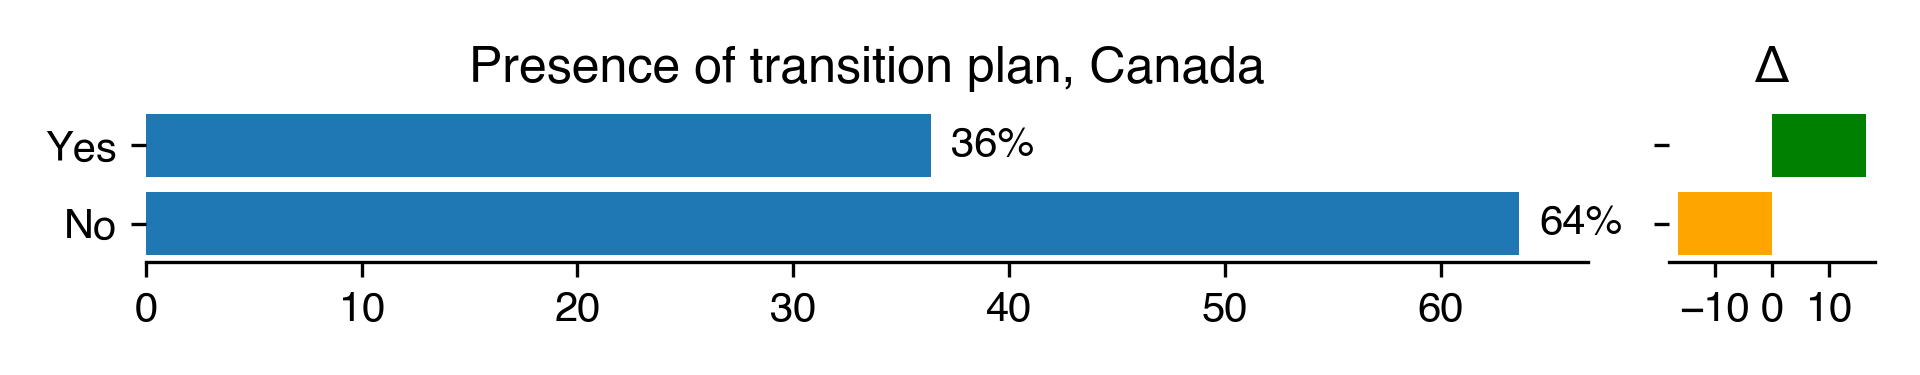
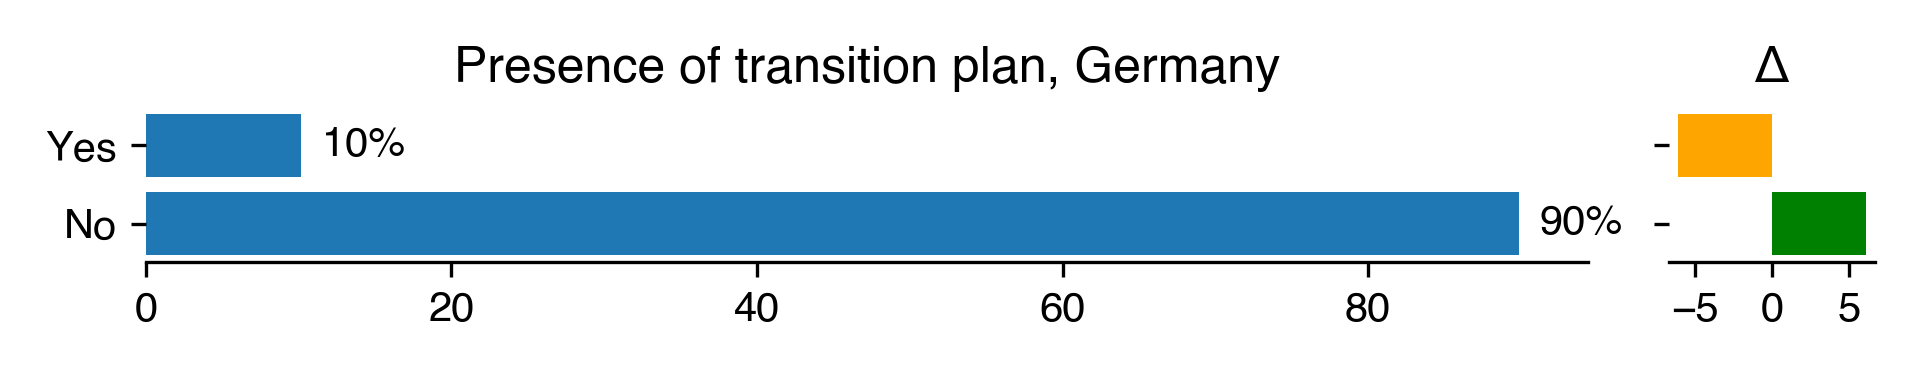
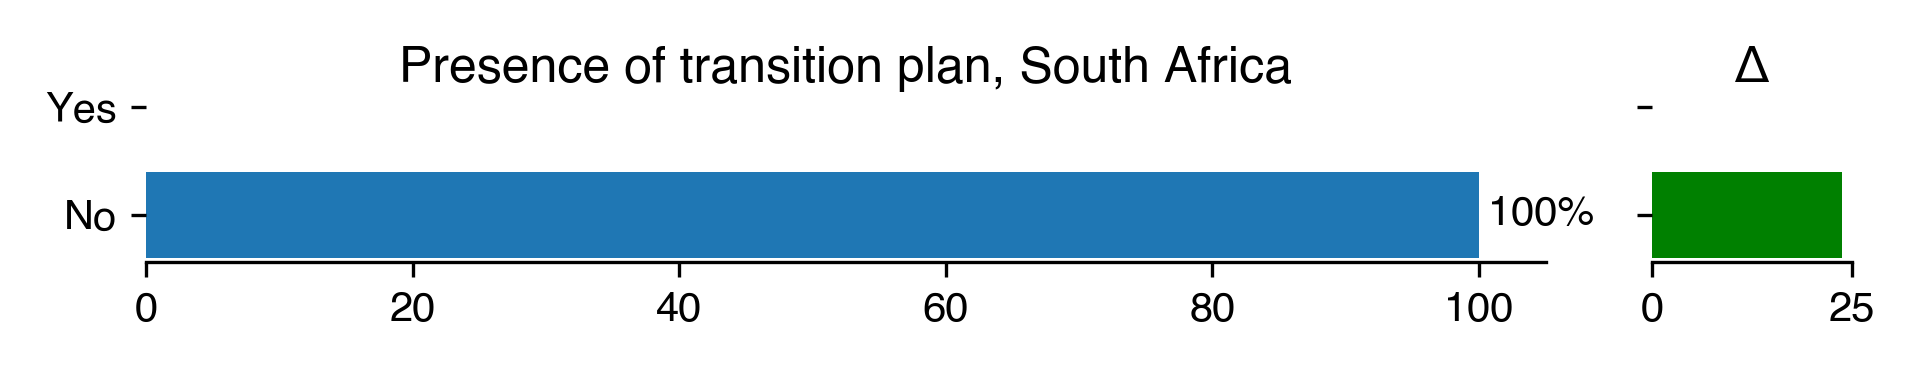
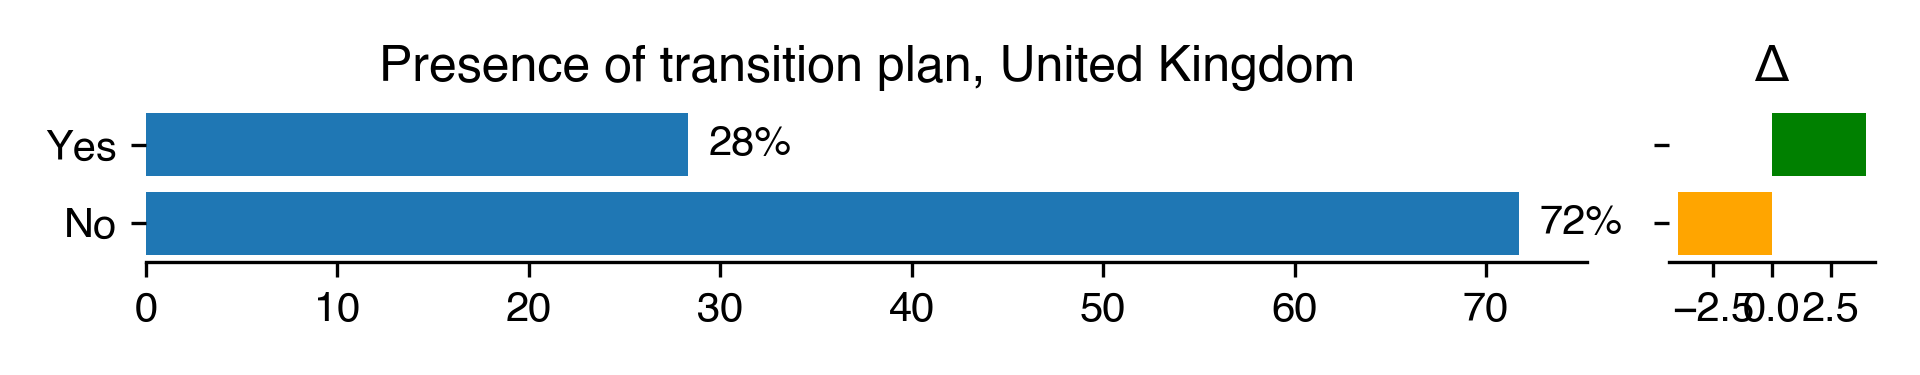
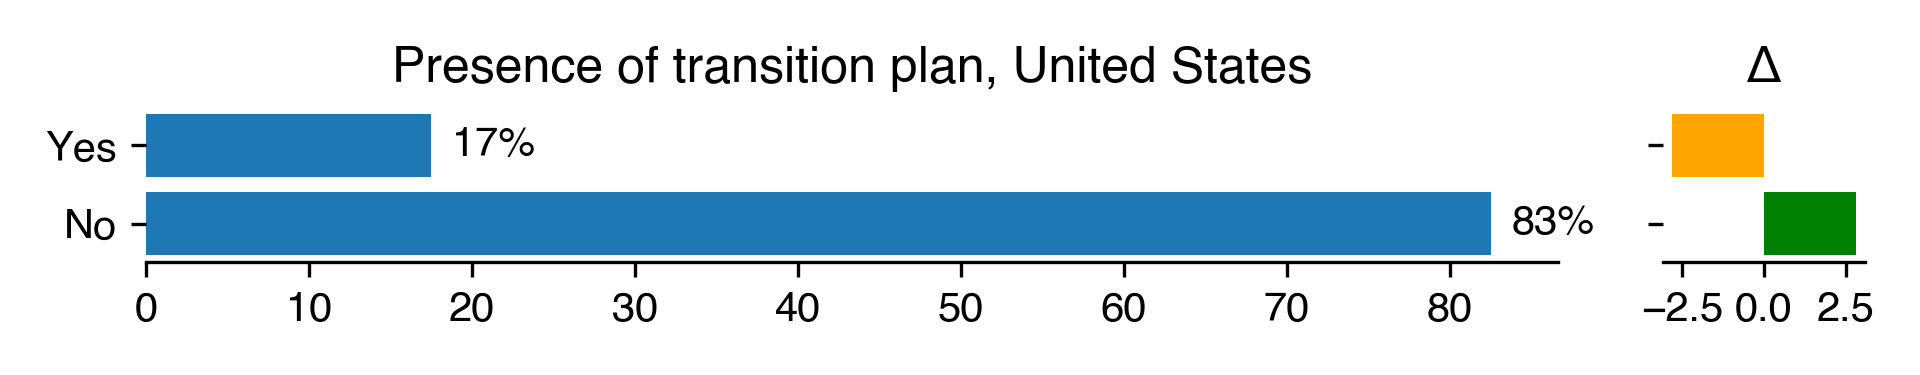
A technical hand over plan is used to introduce a new developer to
a software project. These plans cover basic information, such as the license
and location of the software, a repository, a description of the software
architecture, a summary of development plans and any other information that
a new developer would need to understand the software. A project that has
written (and maintained) a technical hand over plan can withstand the
departure of a developer, even a key developer, significantly better than
one without such a plan.
Developing software requires a set of good practices to ensure the quality of
the subsequent analysis as well as the robustness of the developed software, to
name a few of important aspects. We wanted to see if the implementation of some
simple but essential good practices were a reality beside the bus factor and
technical hand over planning.
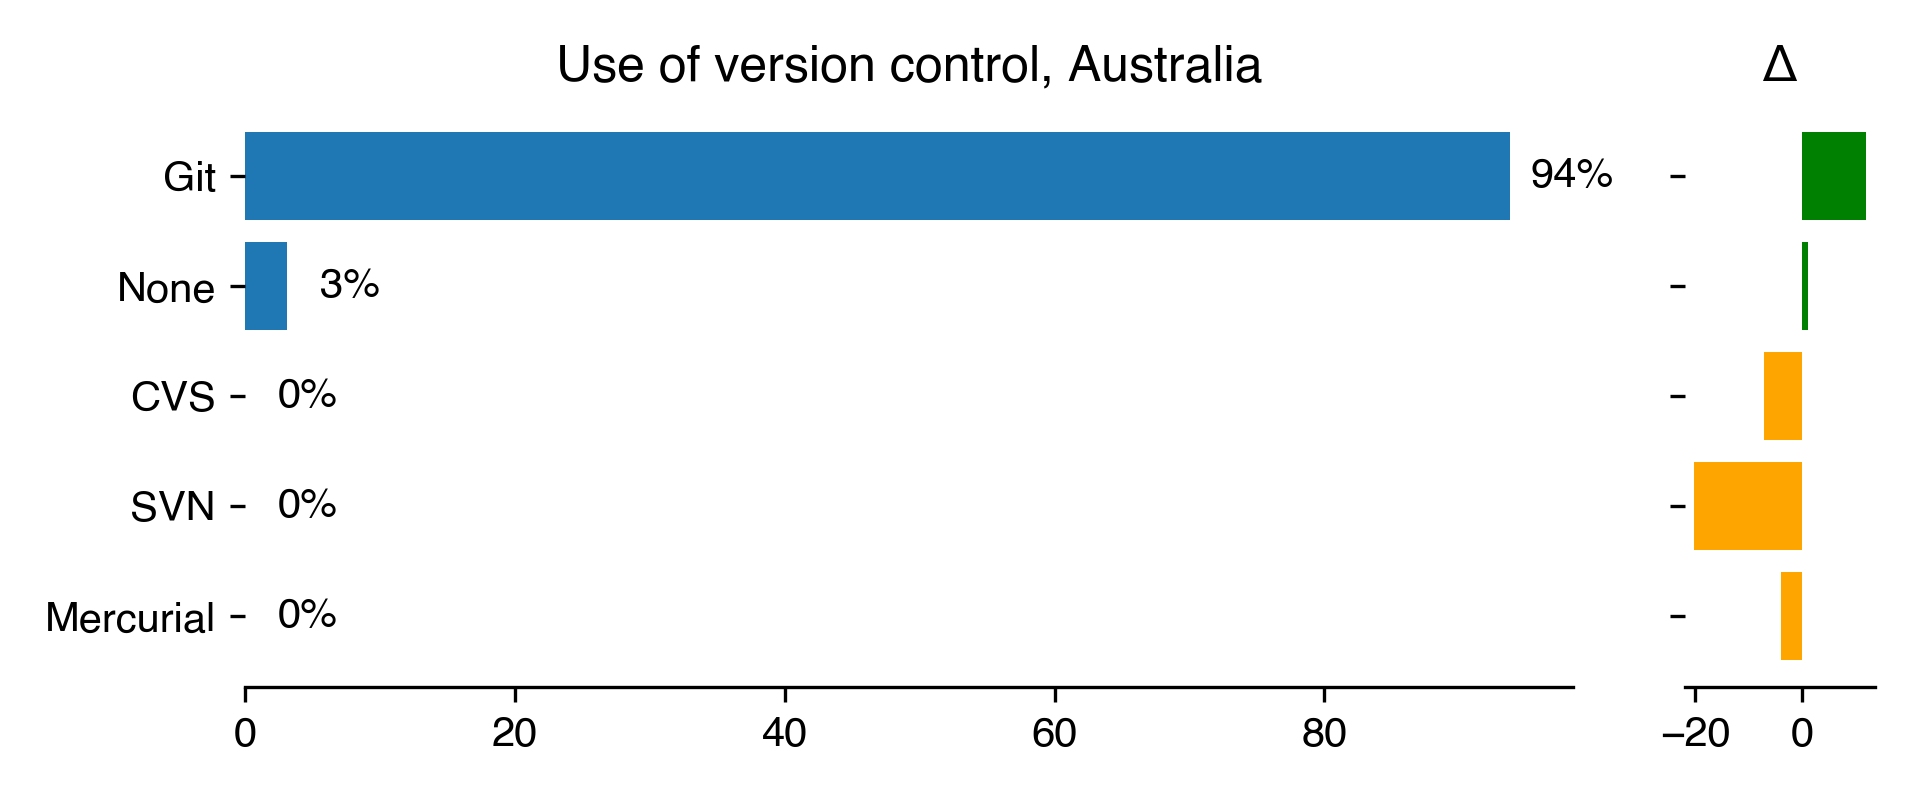
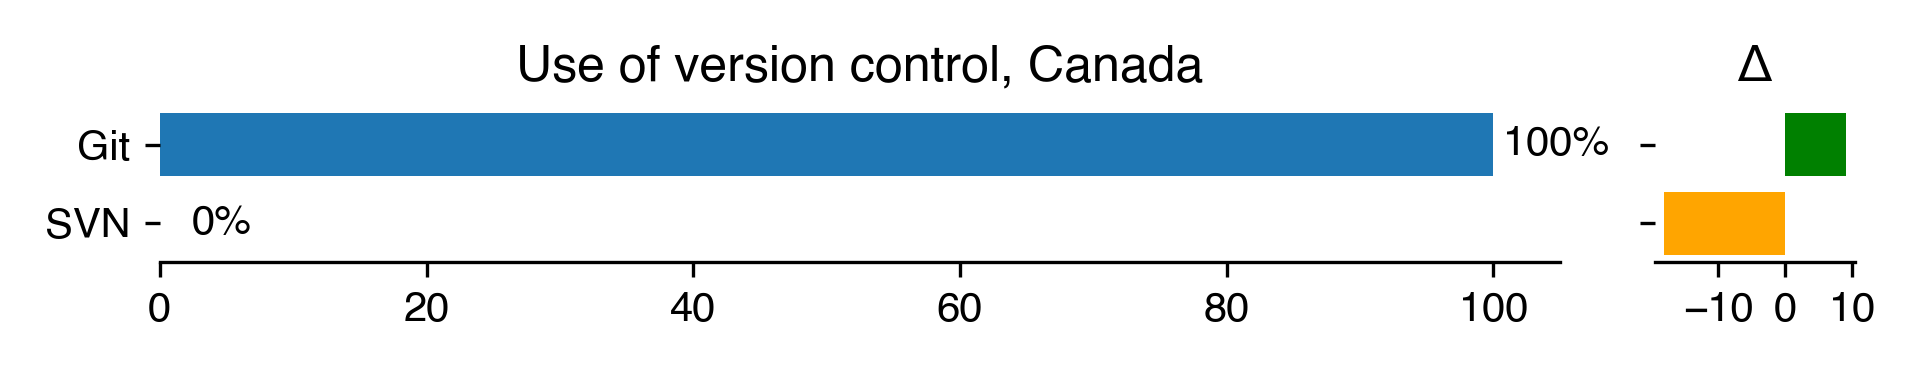
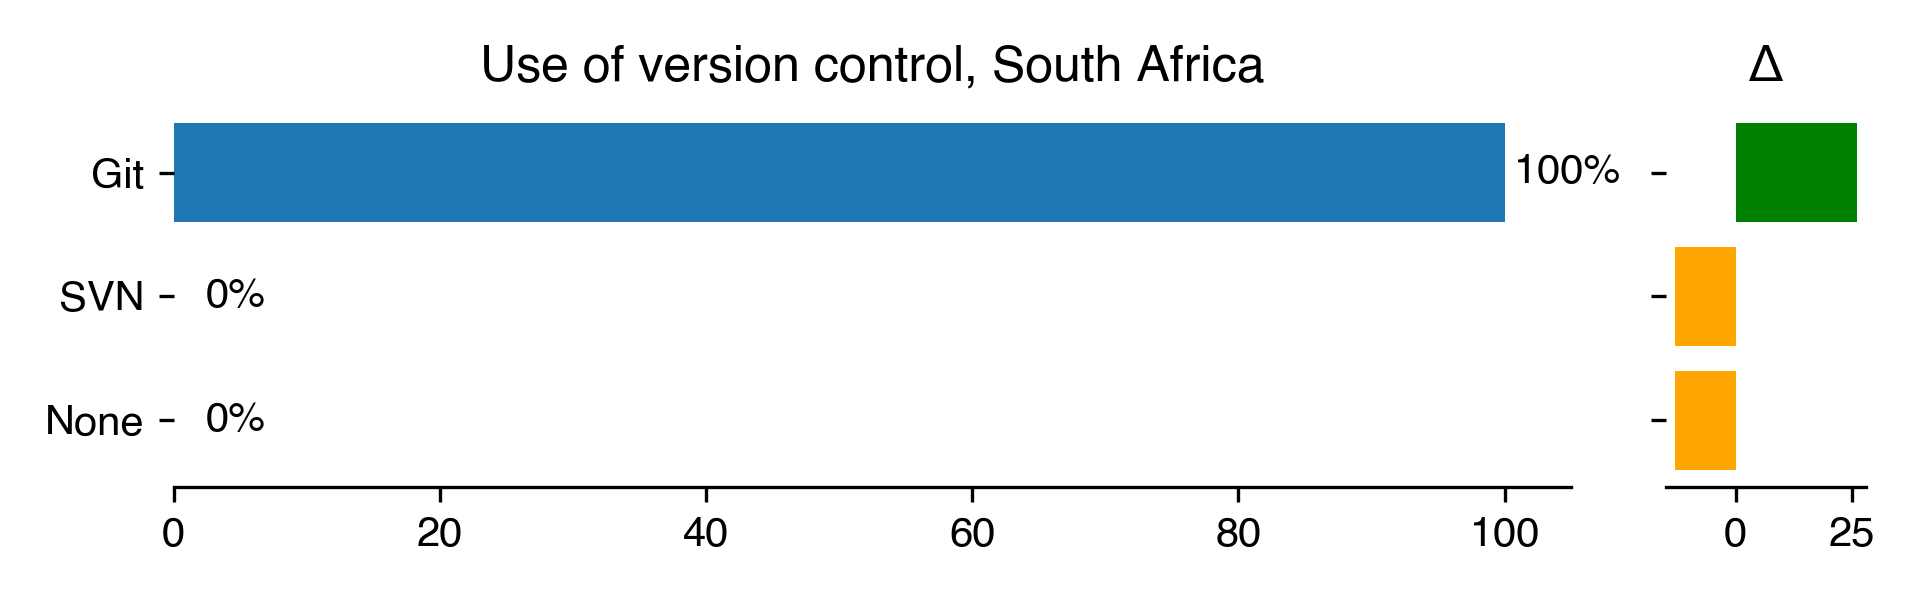
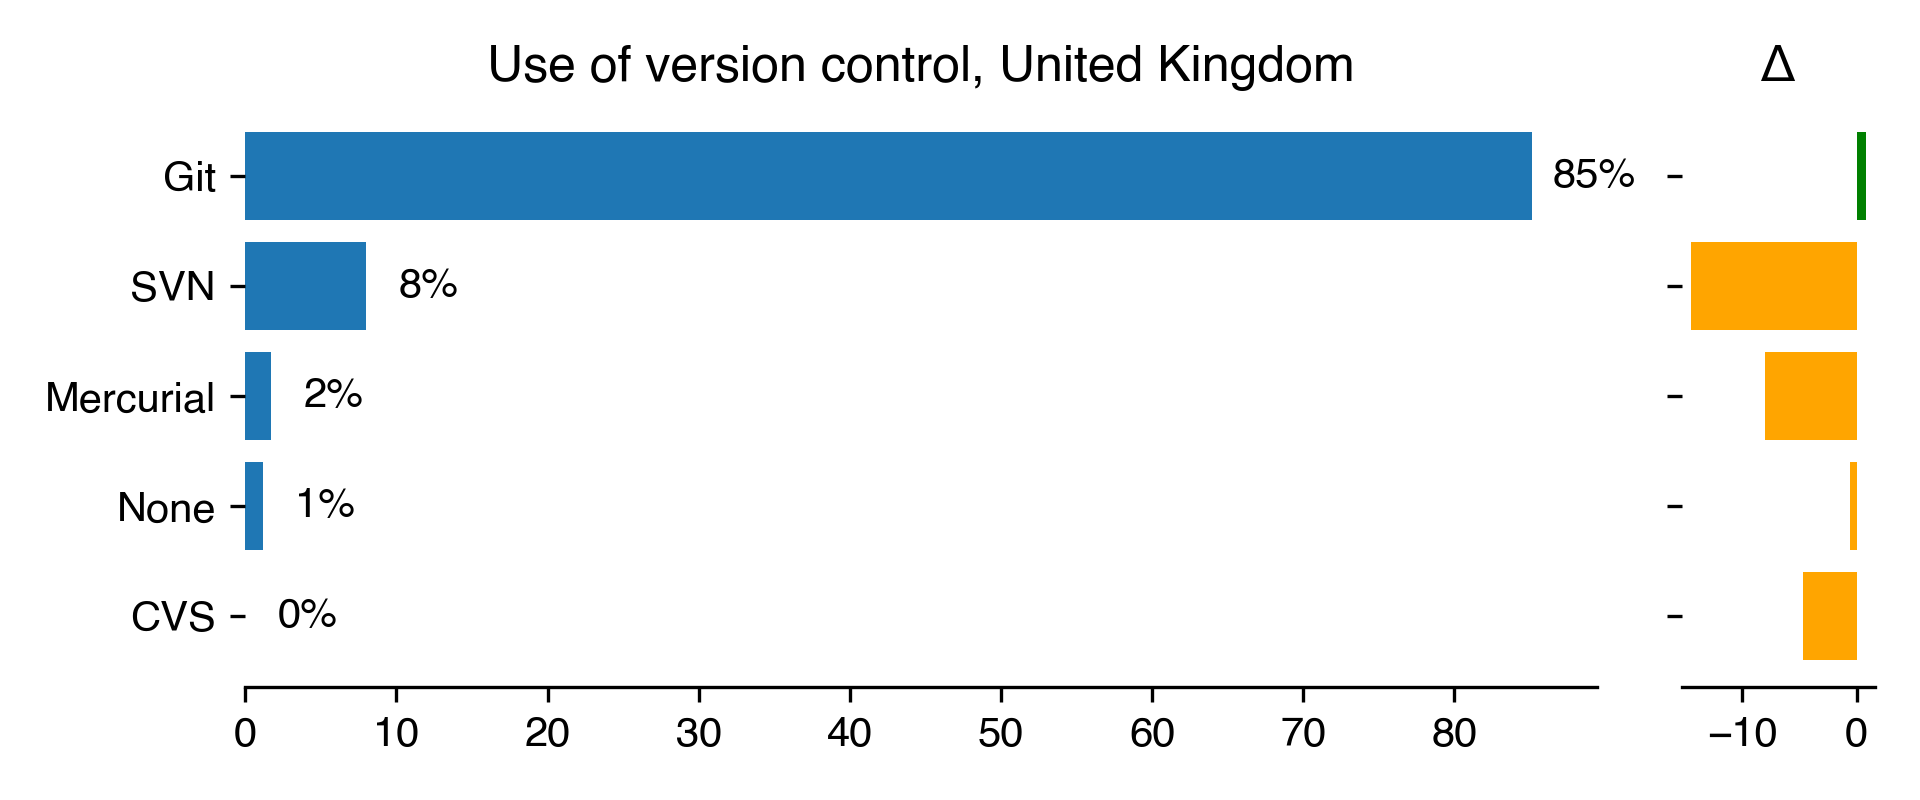
When developing software, version control and testing can be seen as
tool to enhance the quality of the developed software, especially considering
the importance of code review and sharing in public funded places such as
academia.
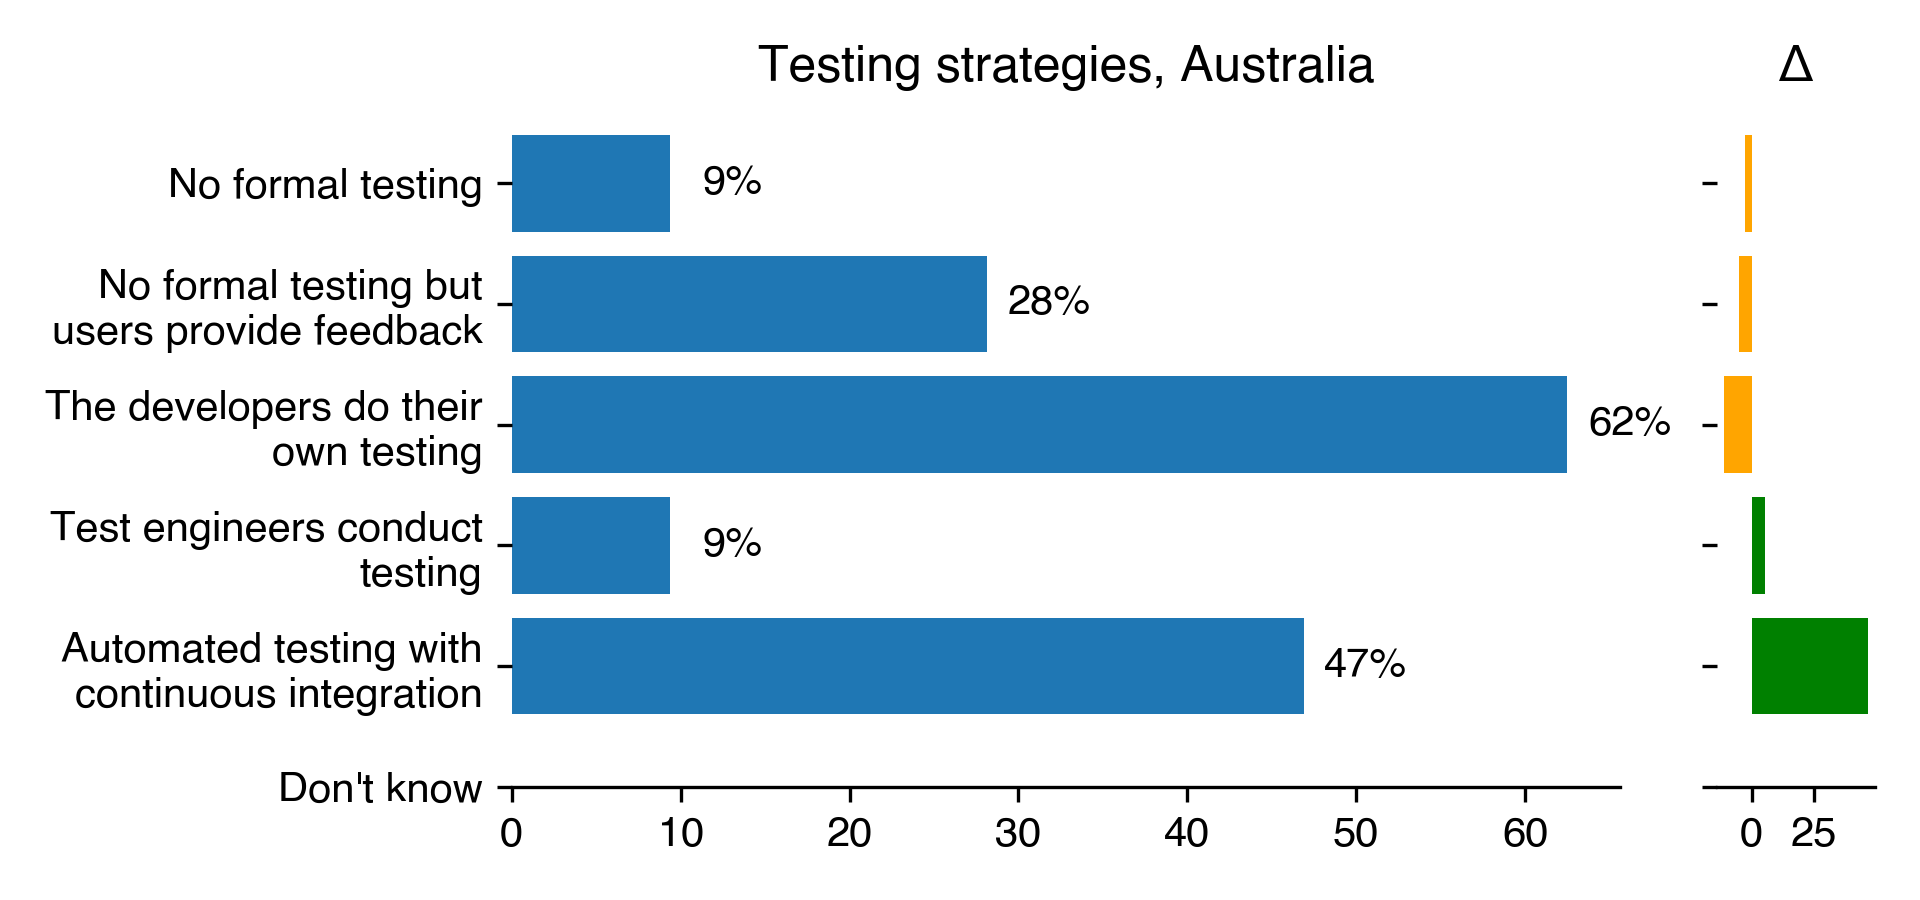
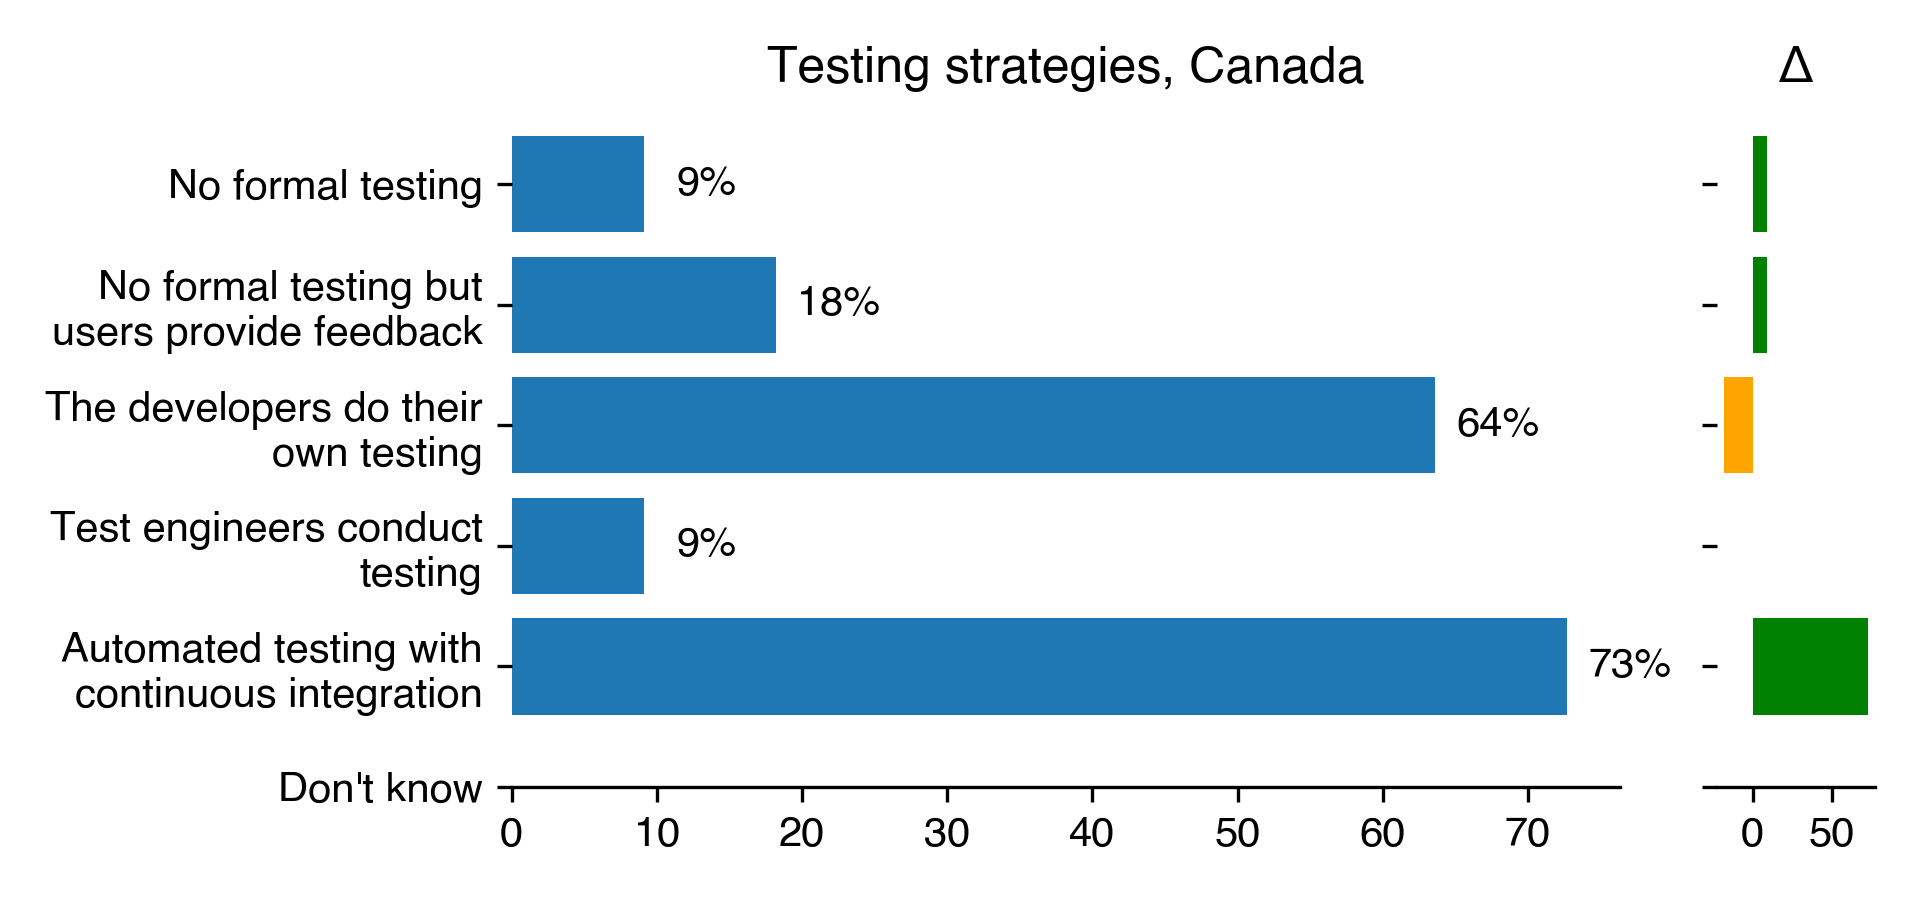
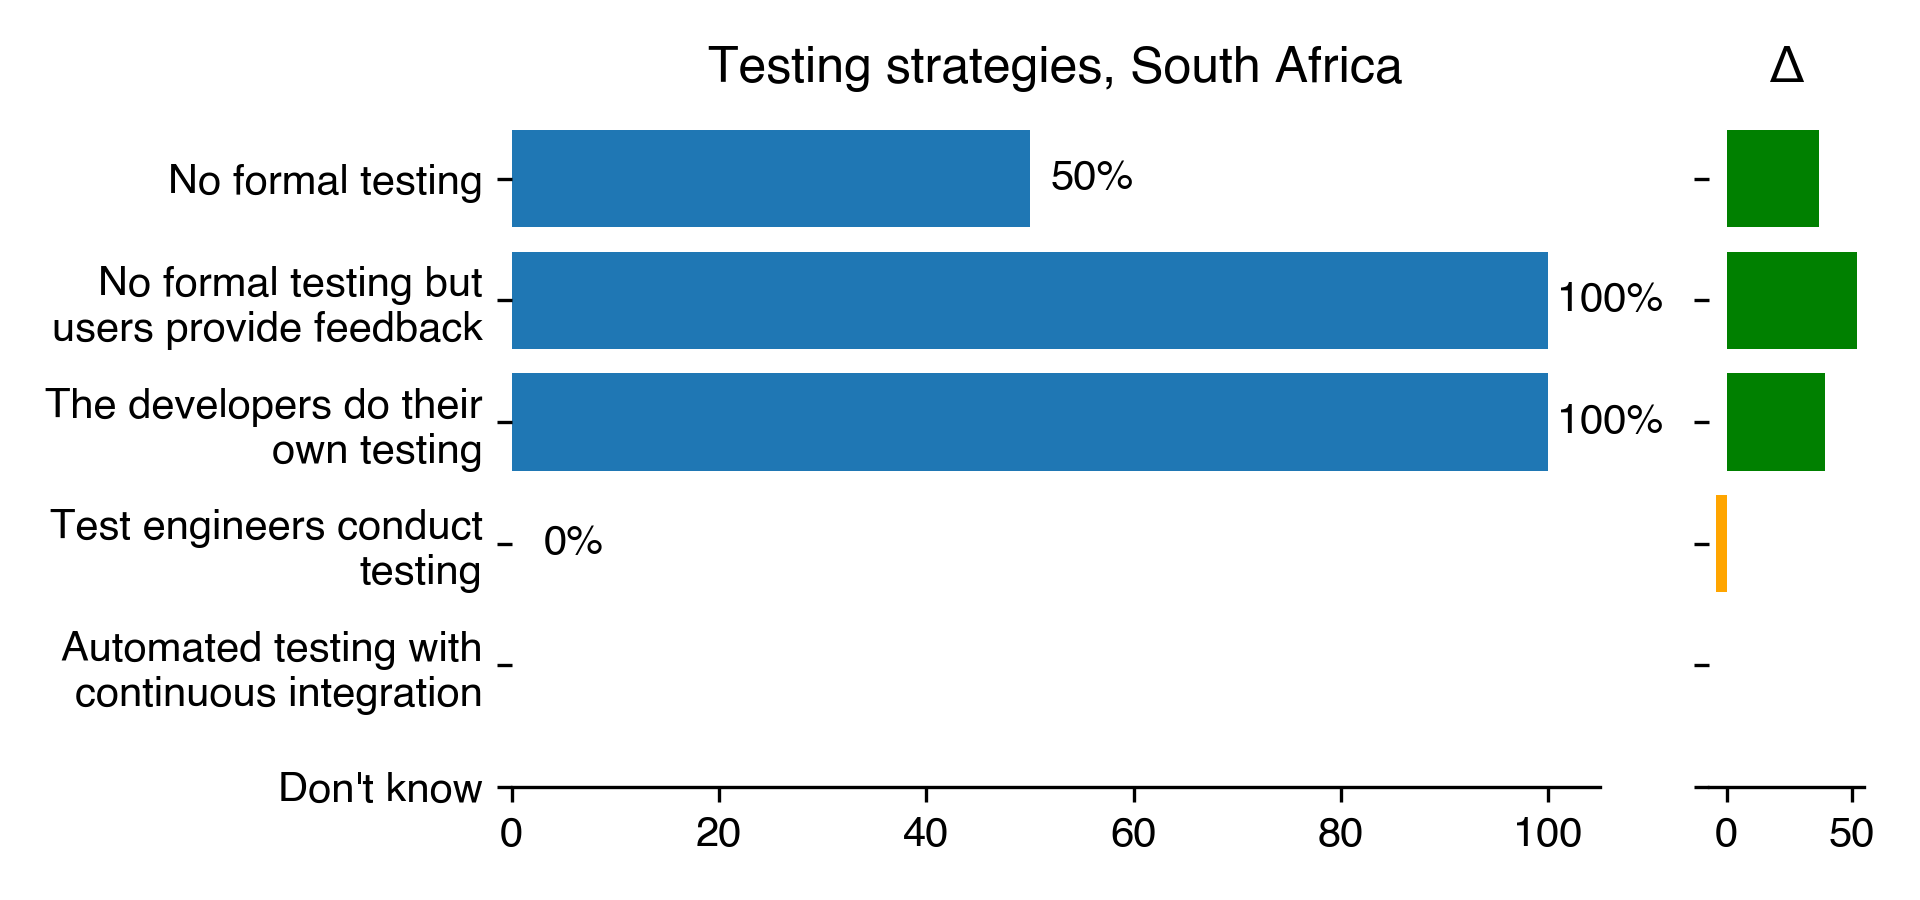
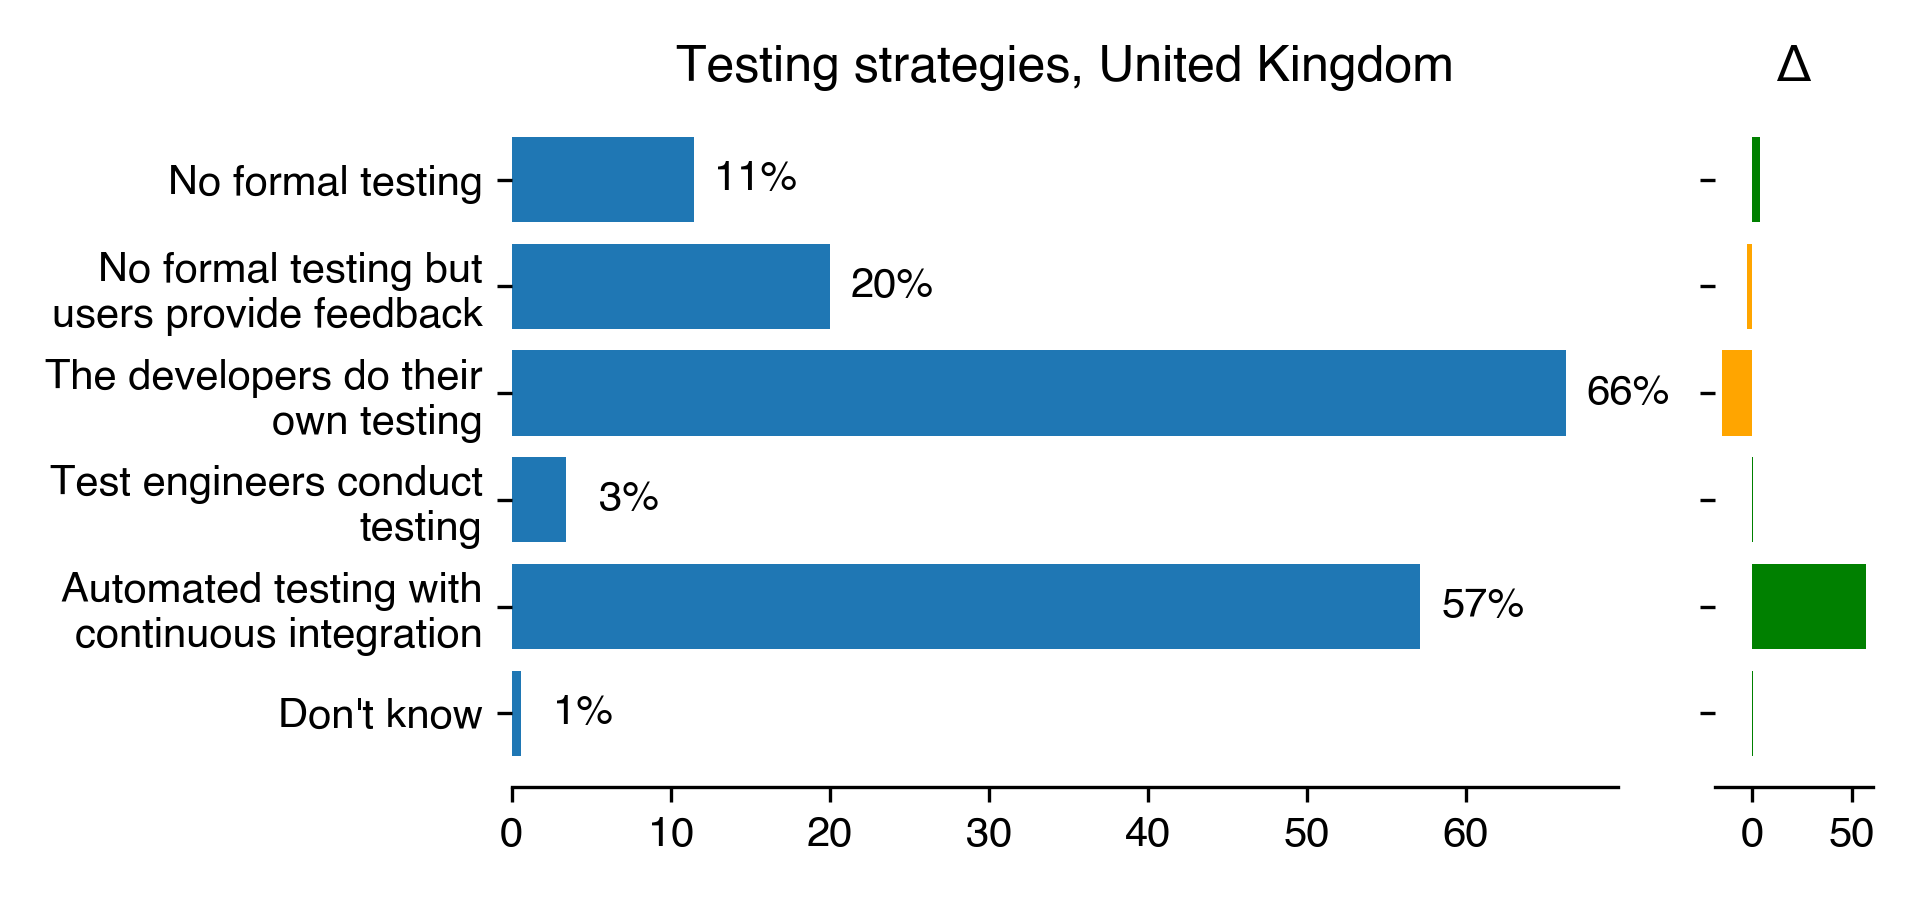
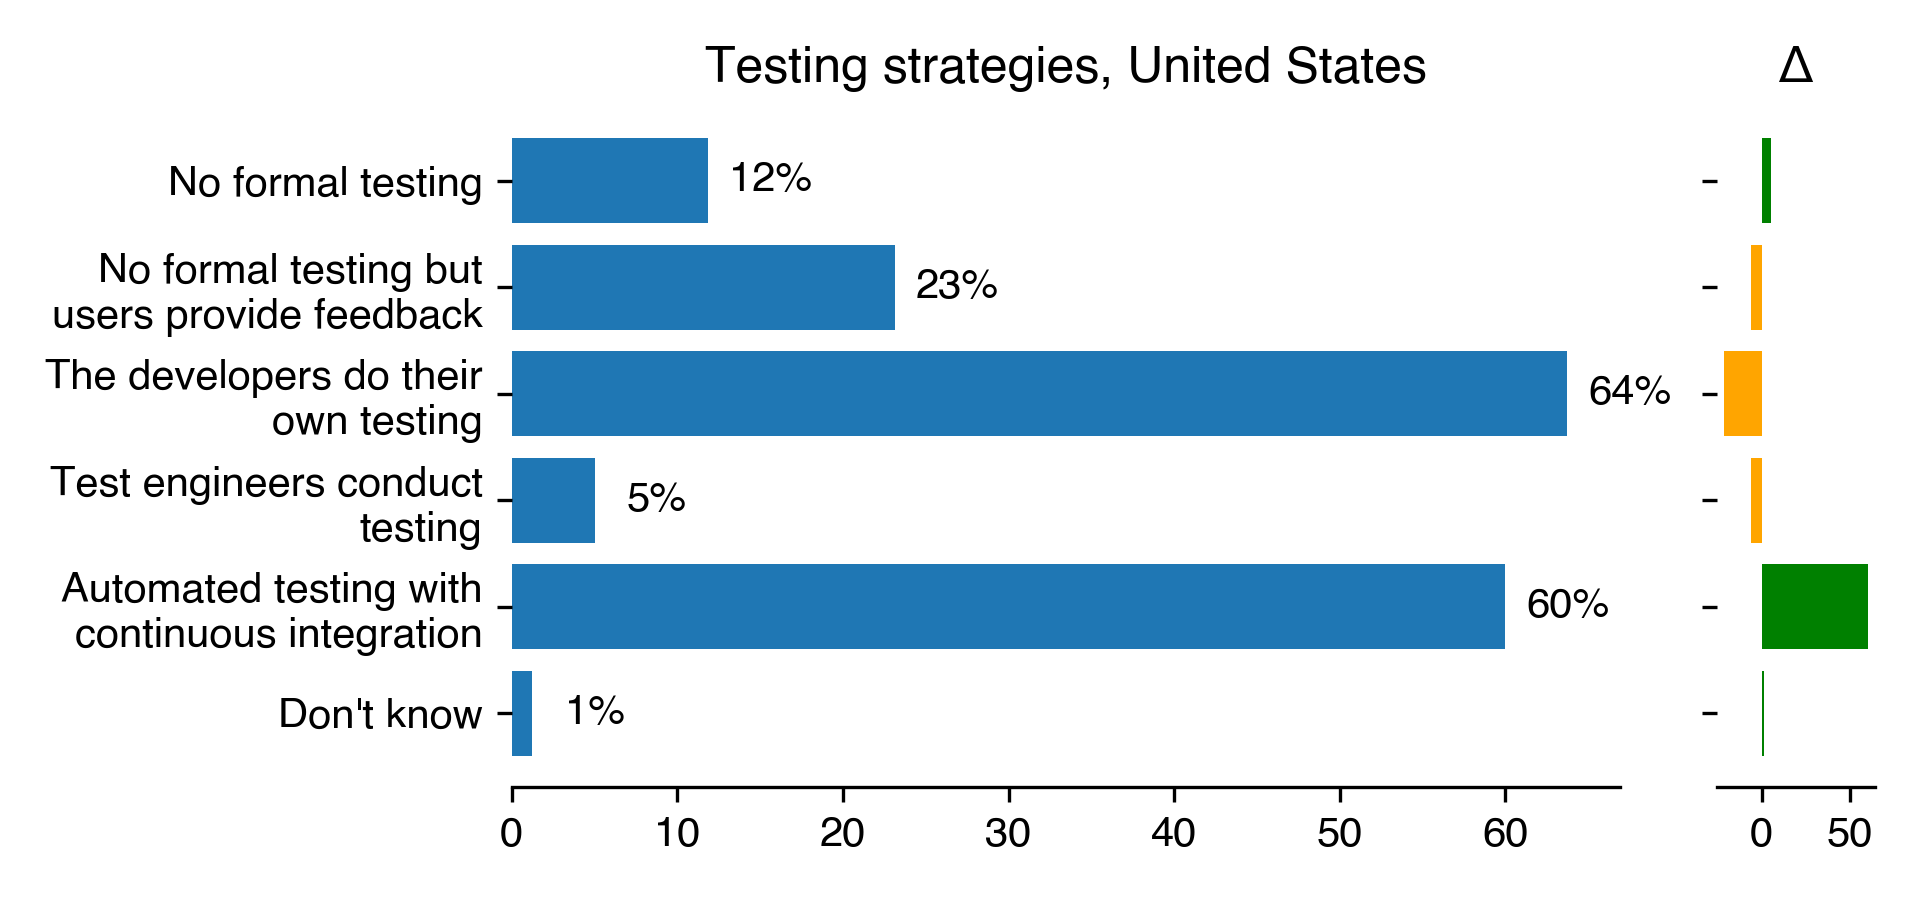
For testing, we asked the participants to choose any of the following testing
methods:
Automated testing with continuous integration
Test engineers conduct testing
Developers conduct own testing
No formal testing but users provide feedback
No formal testing
Test engineers conducting testing is the most robust testing method
but may not be possible in smaller projects while no formal testing should not
occur in any ideal scenario, regardless of the size of the project.
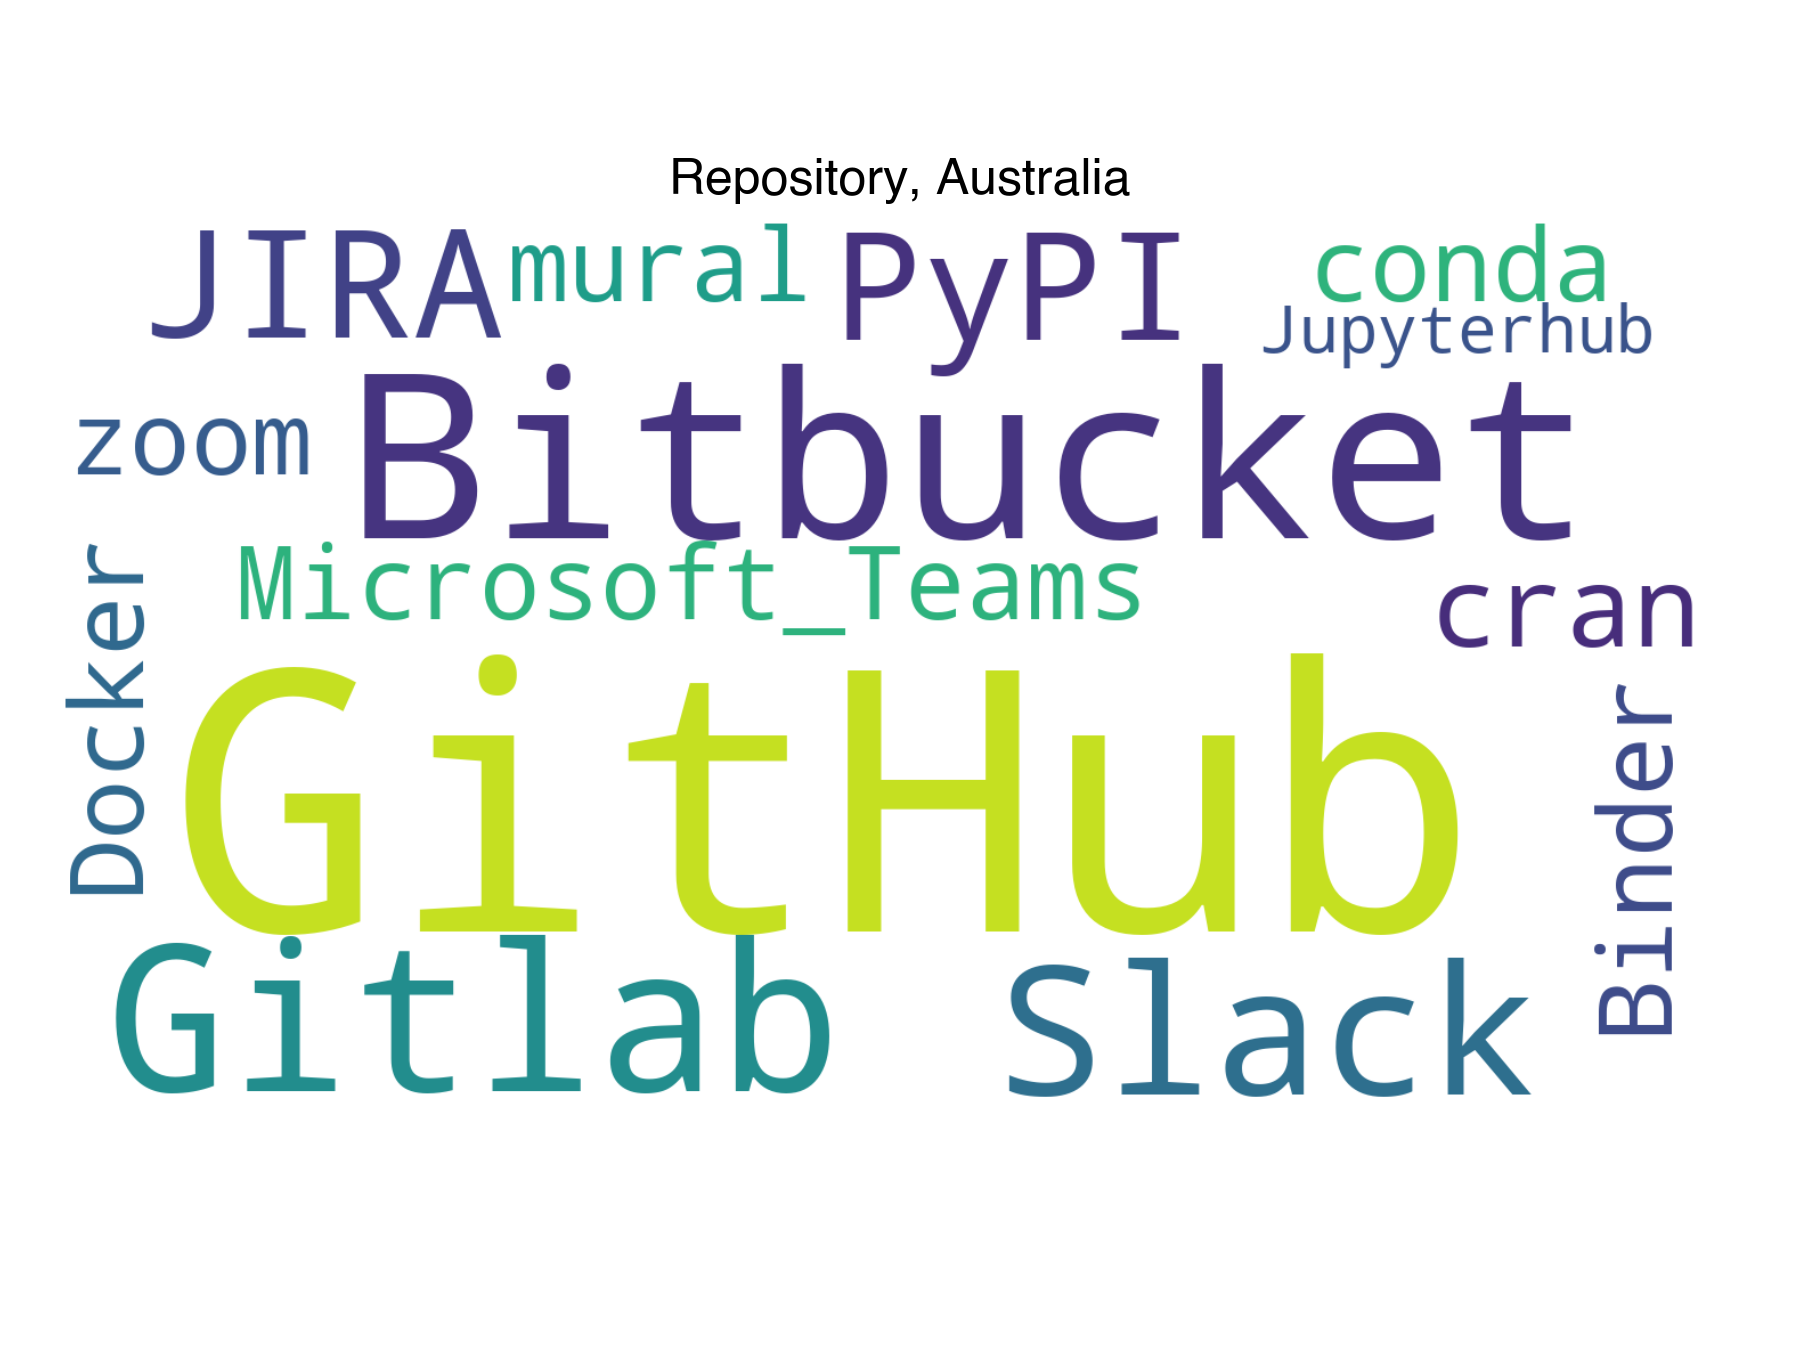
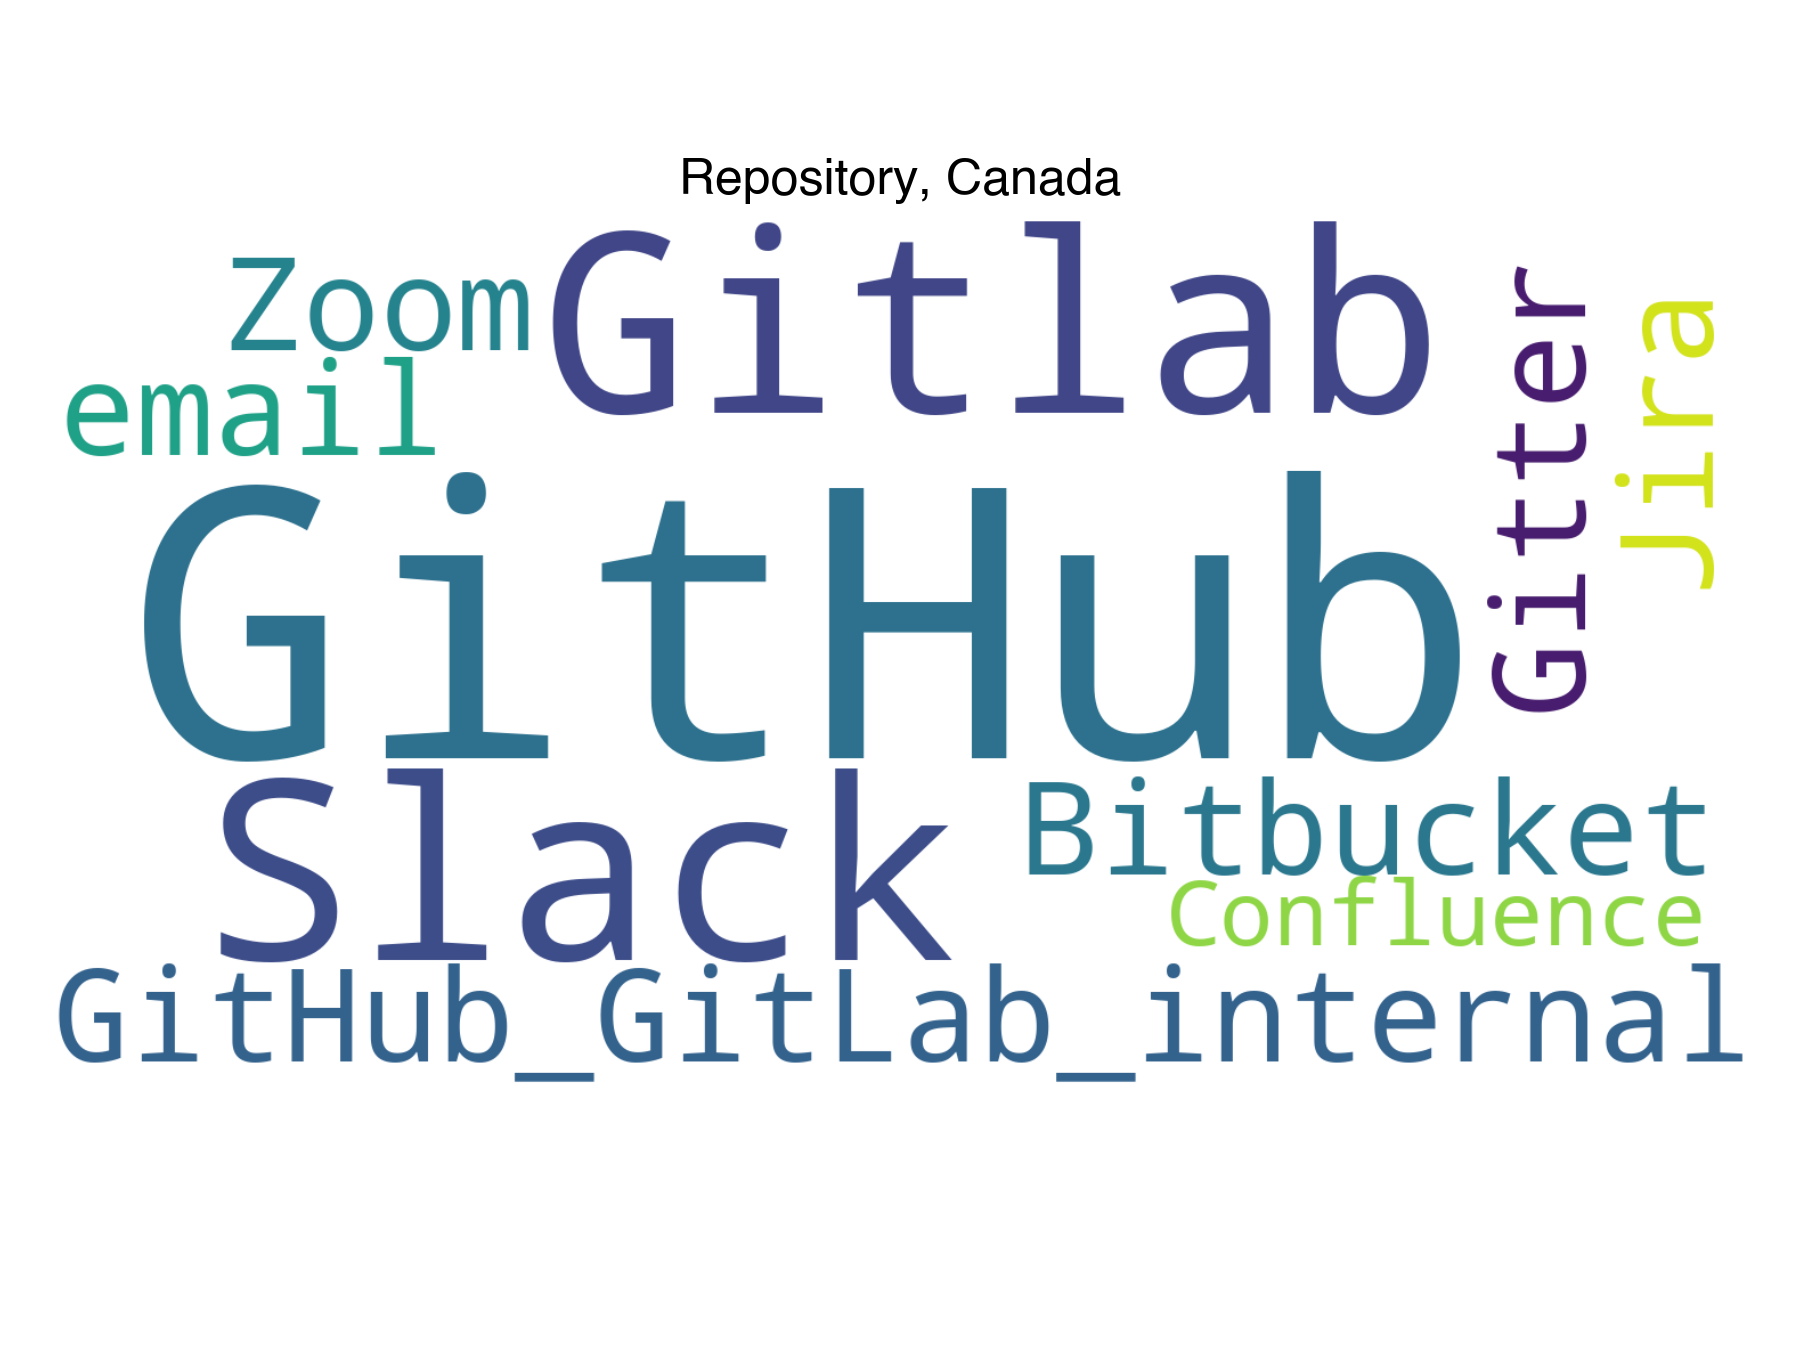
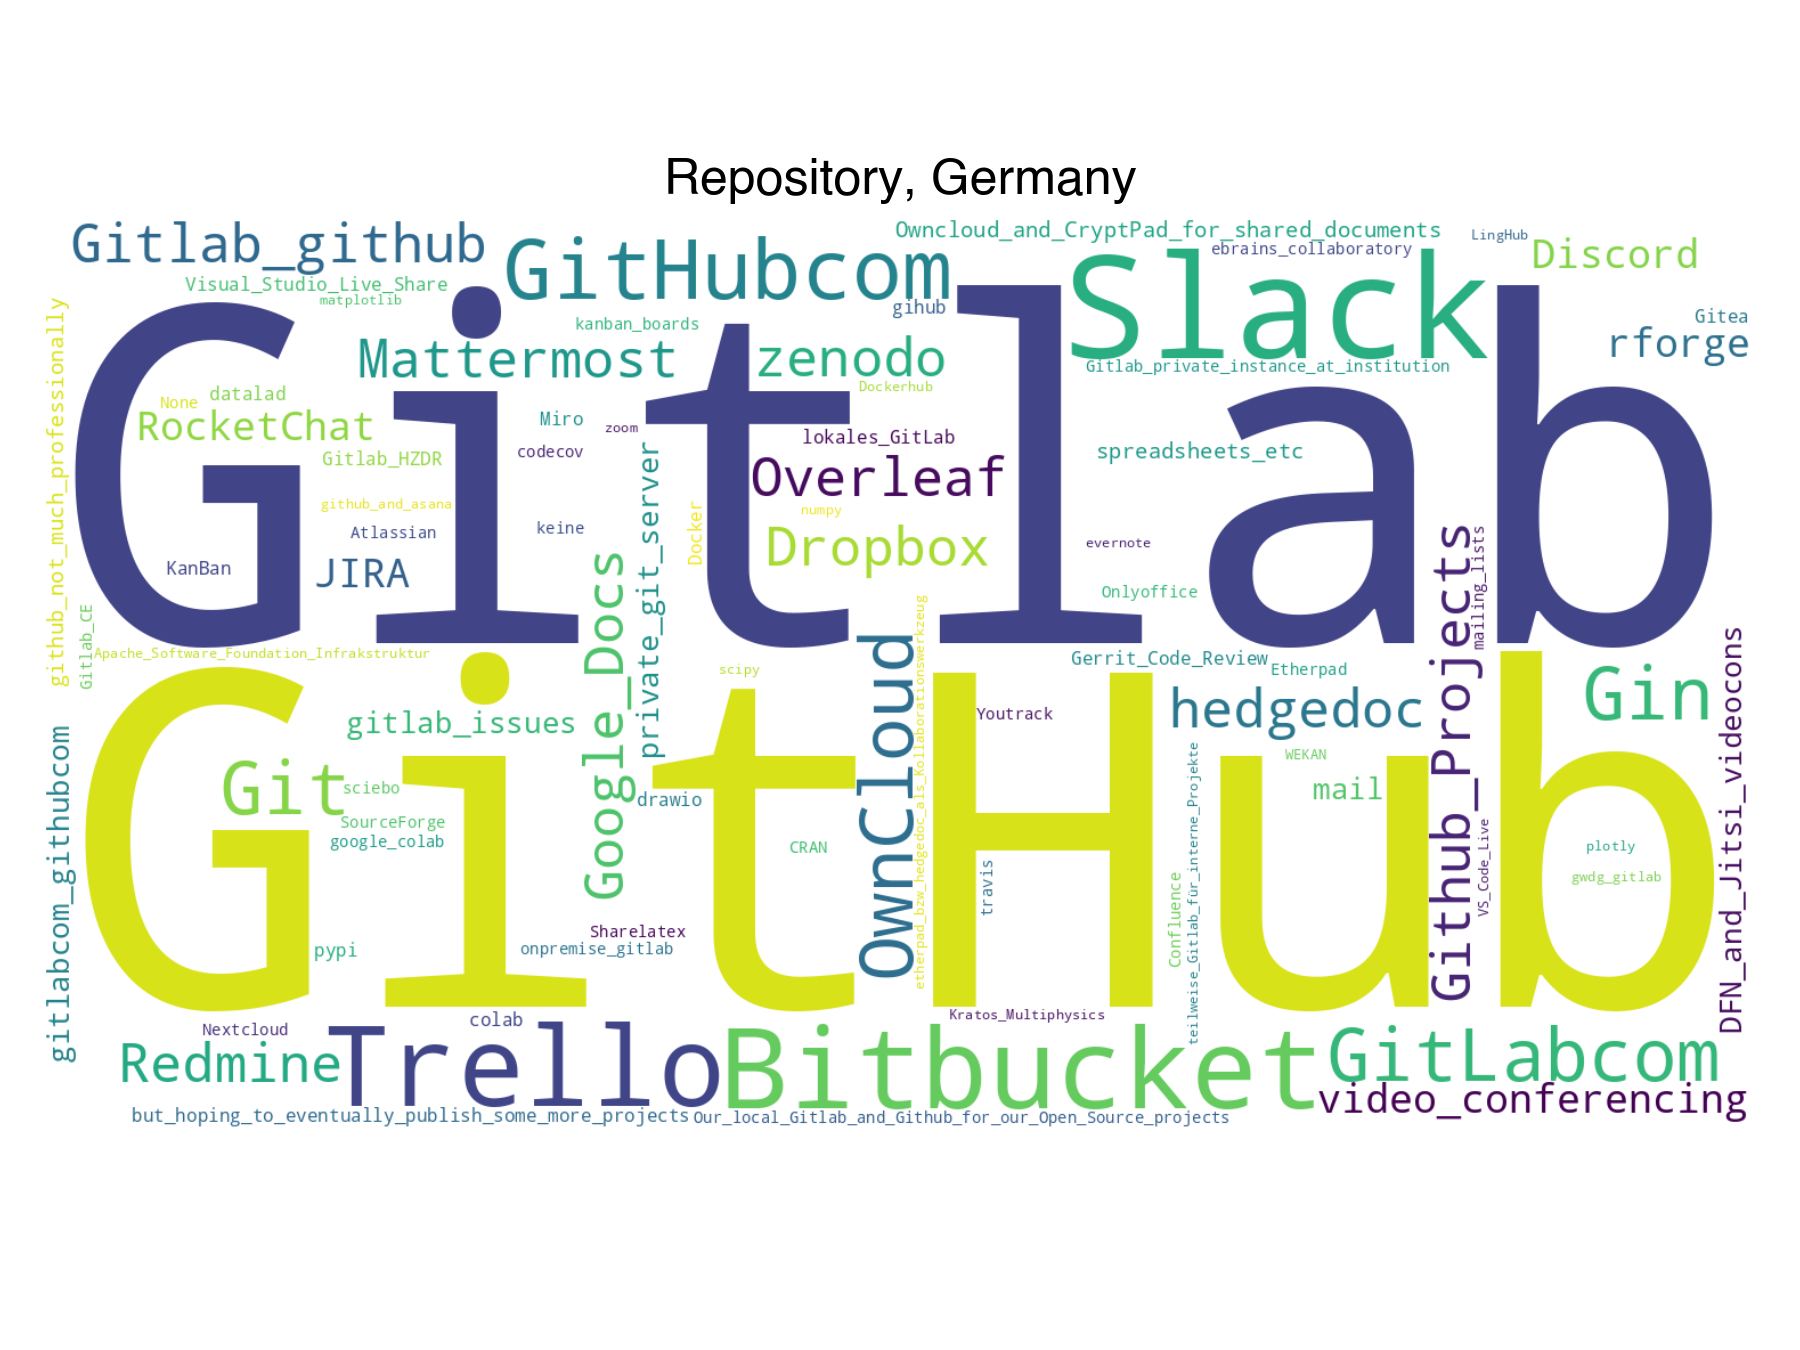
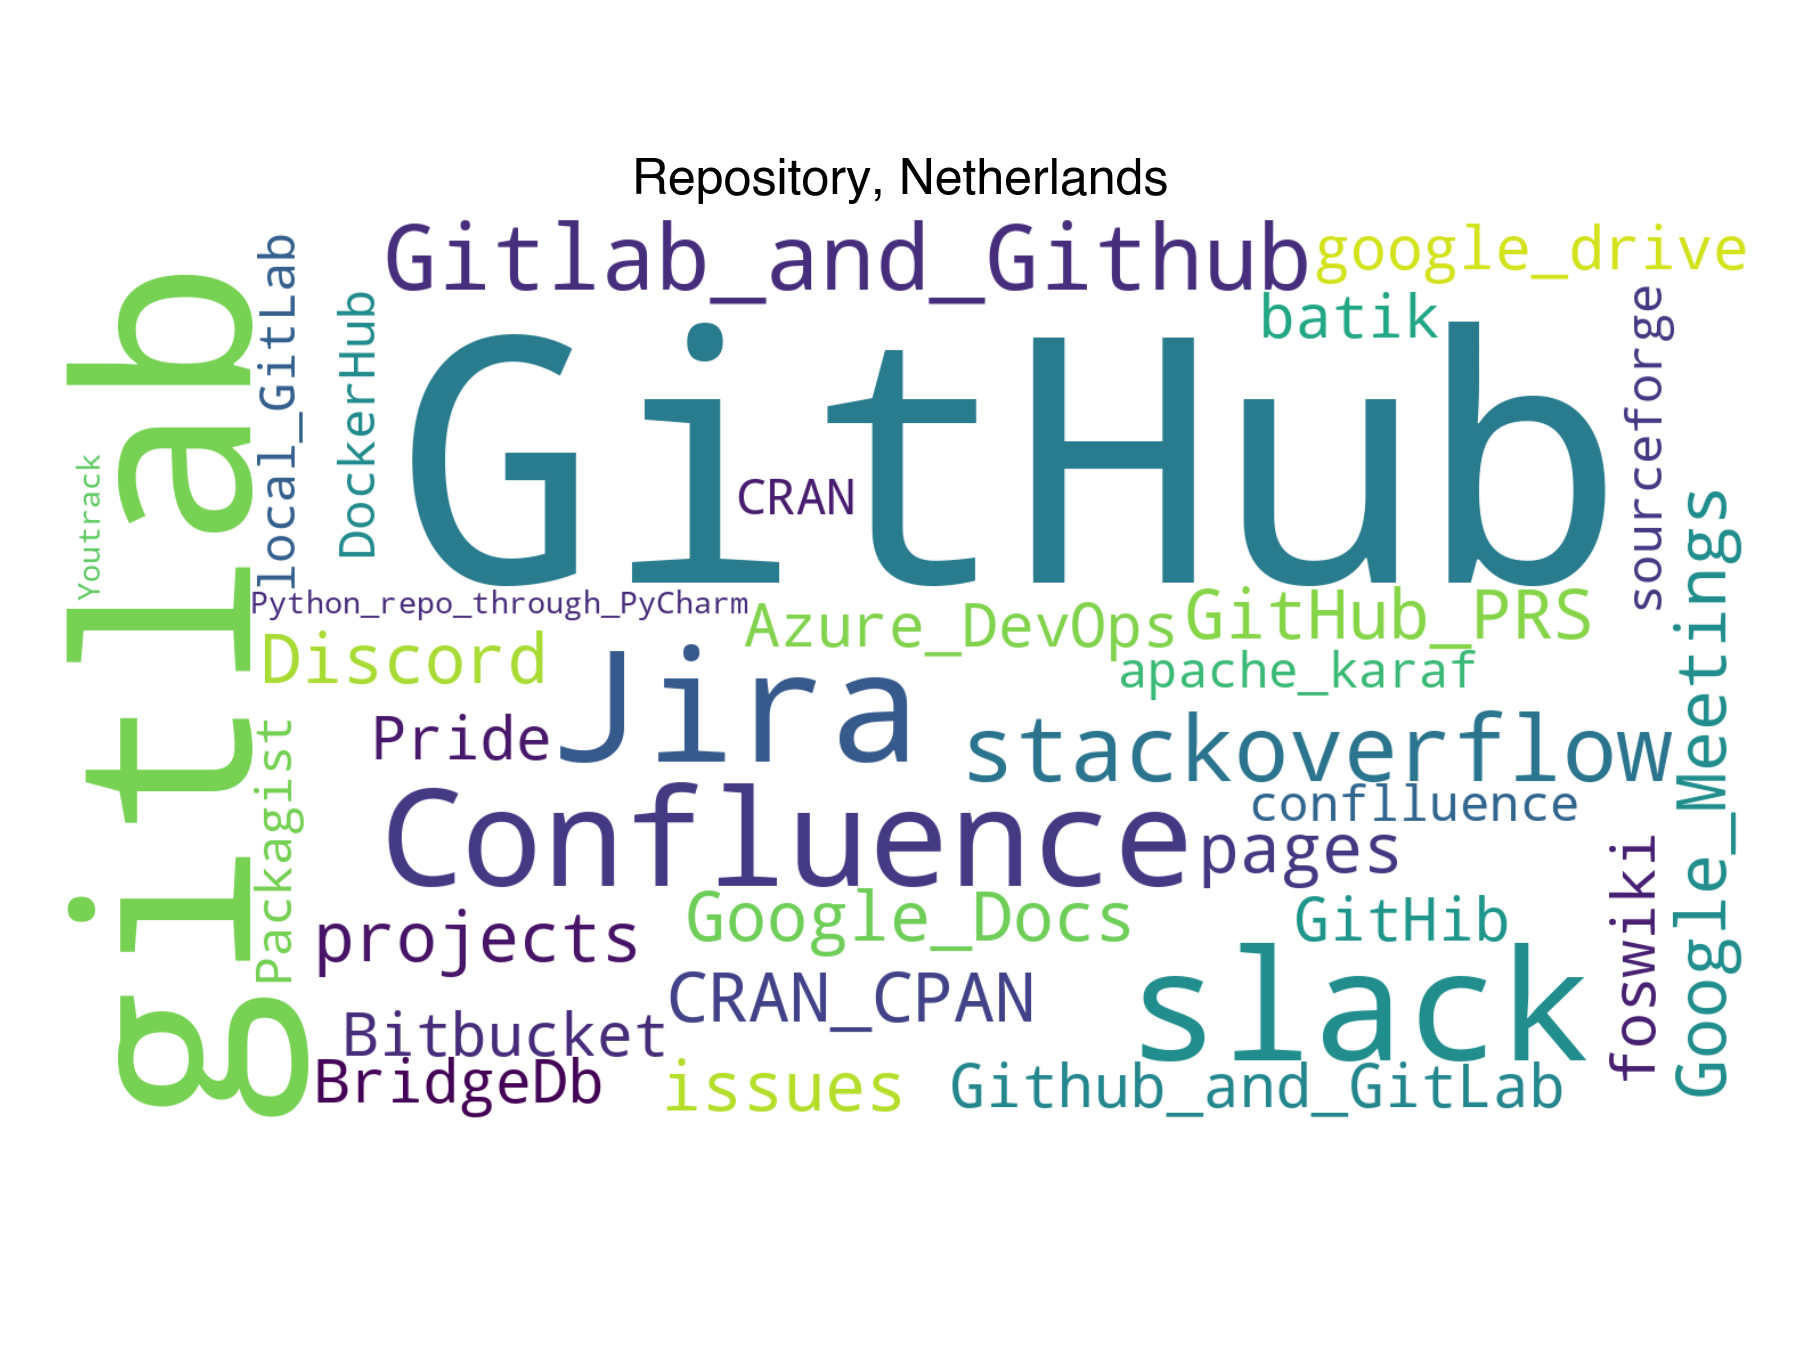
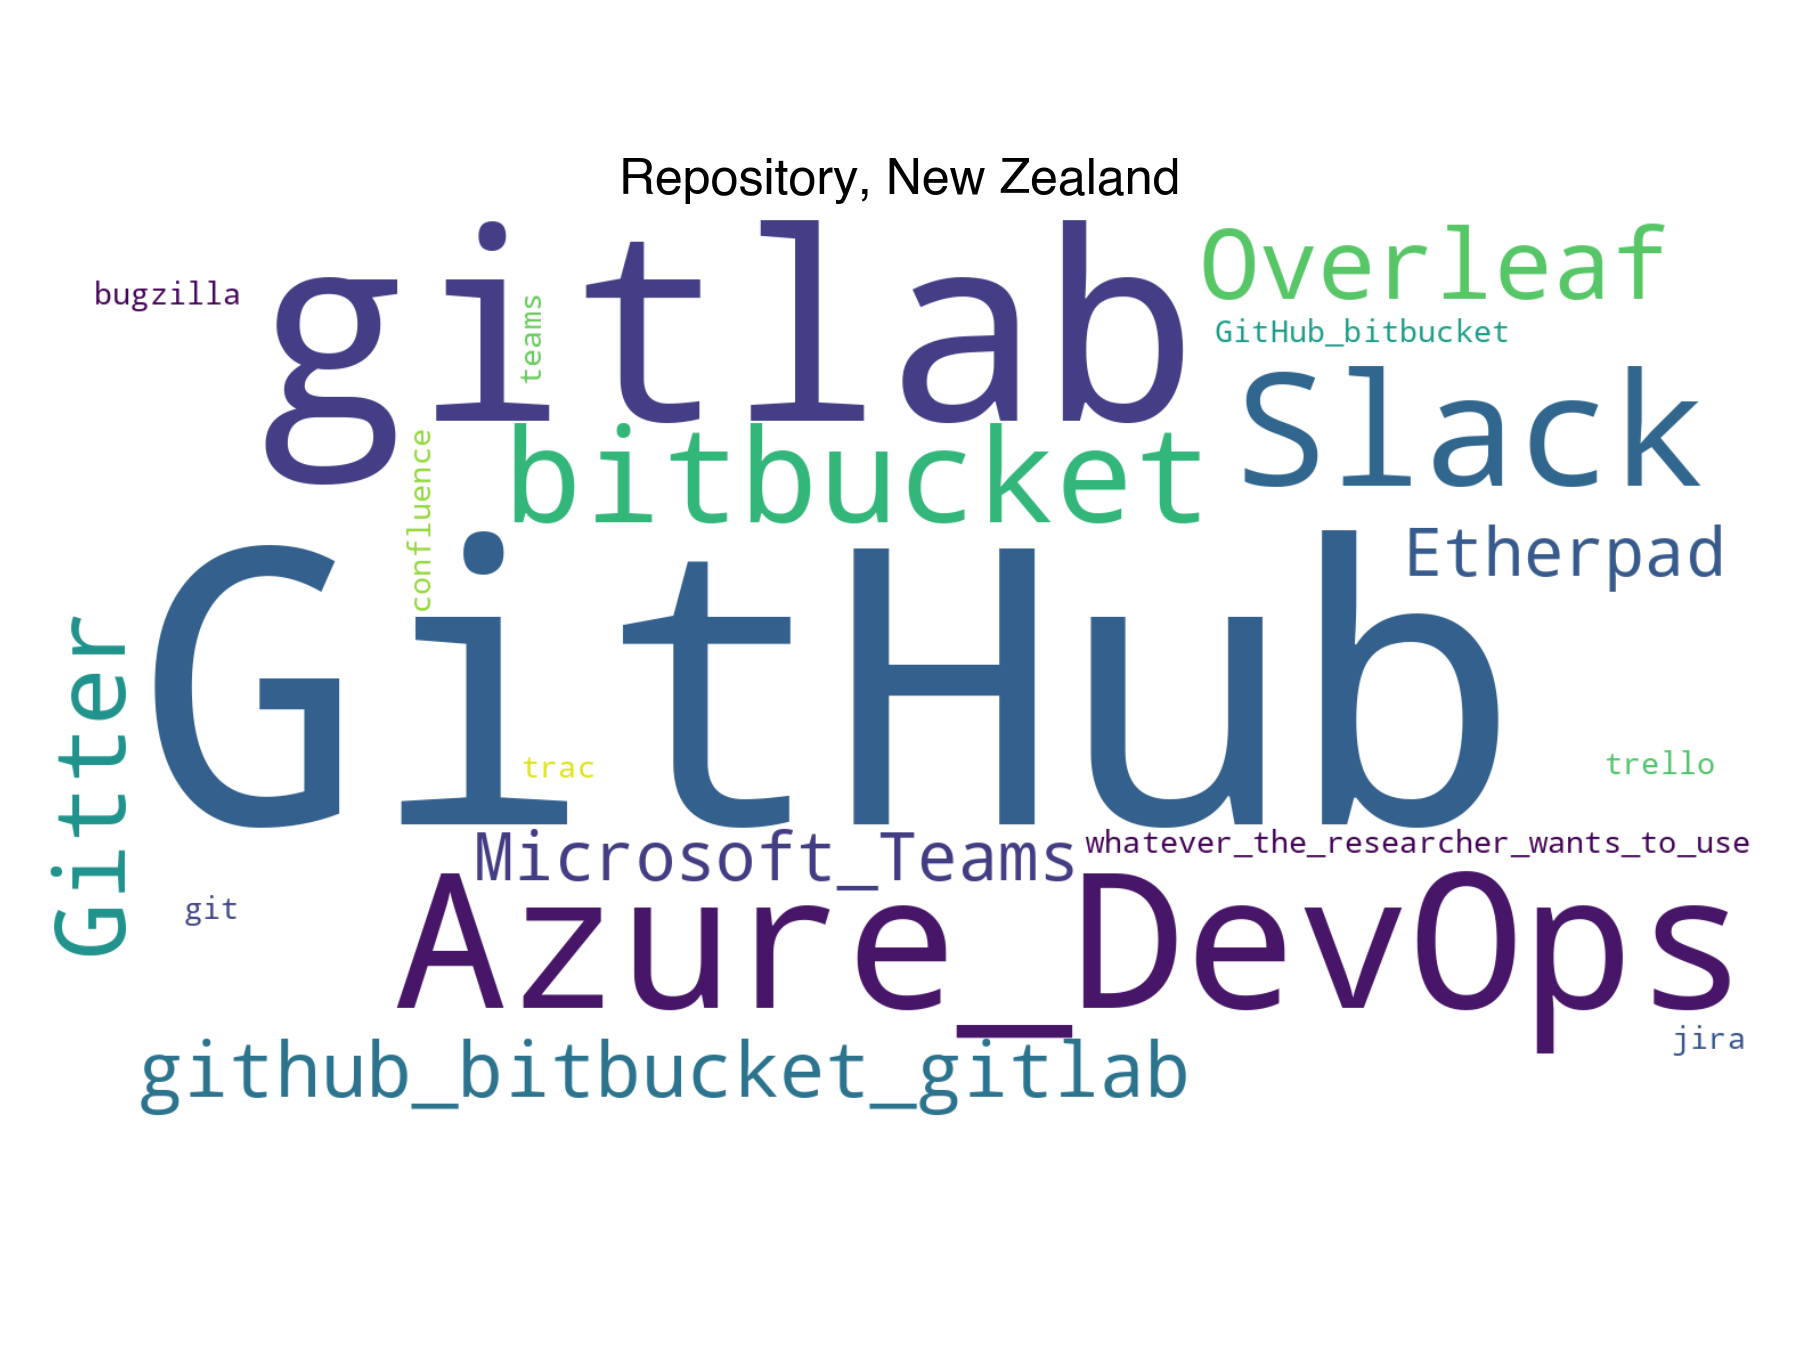
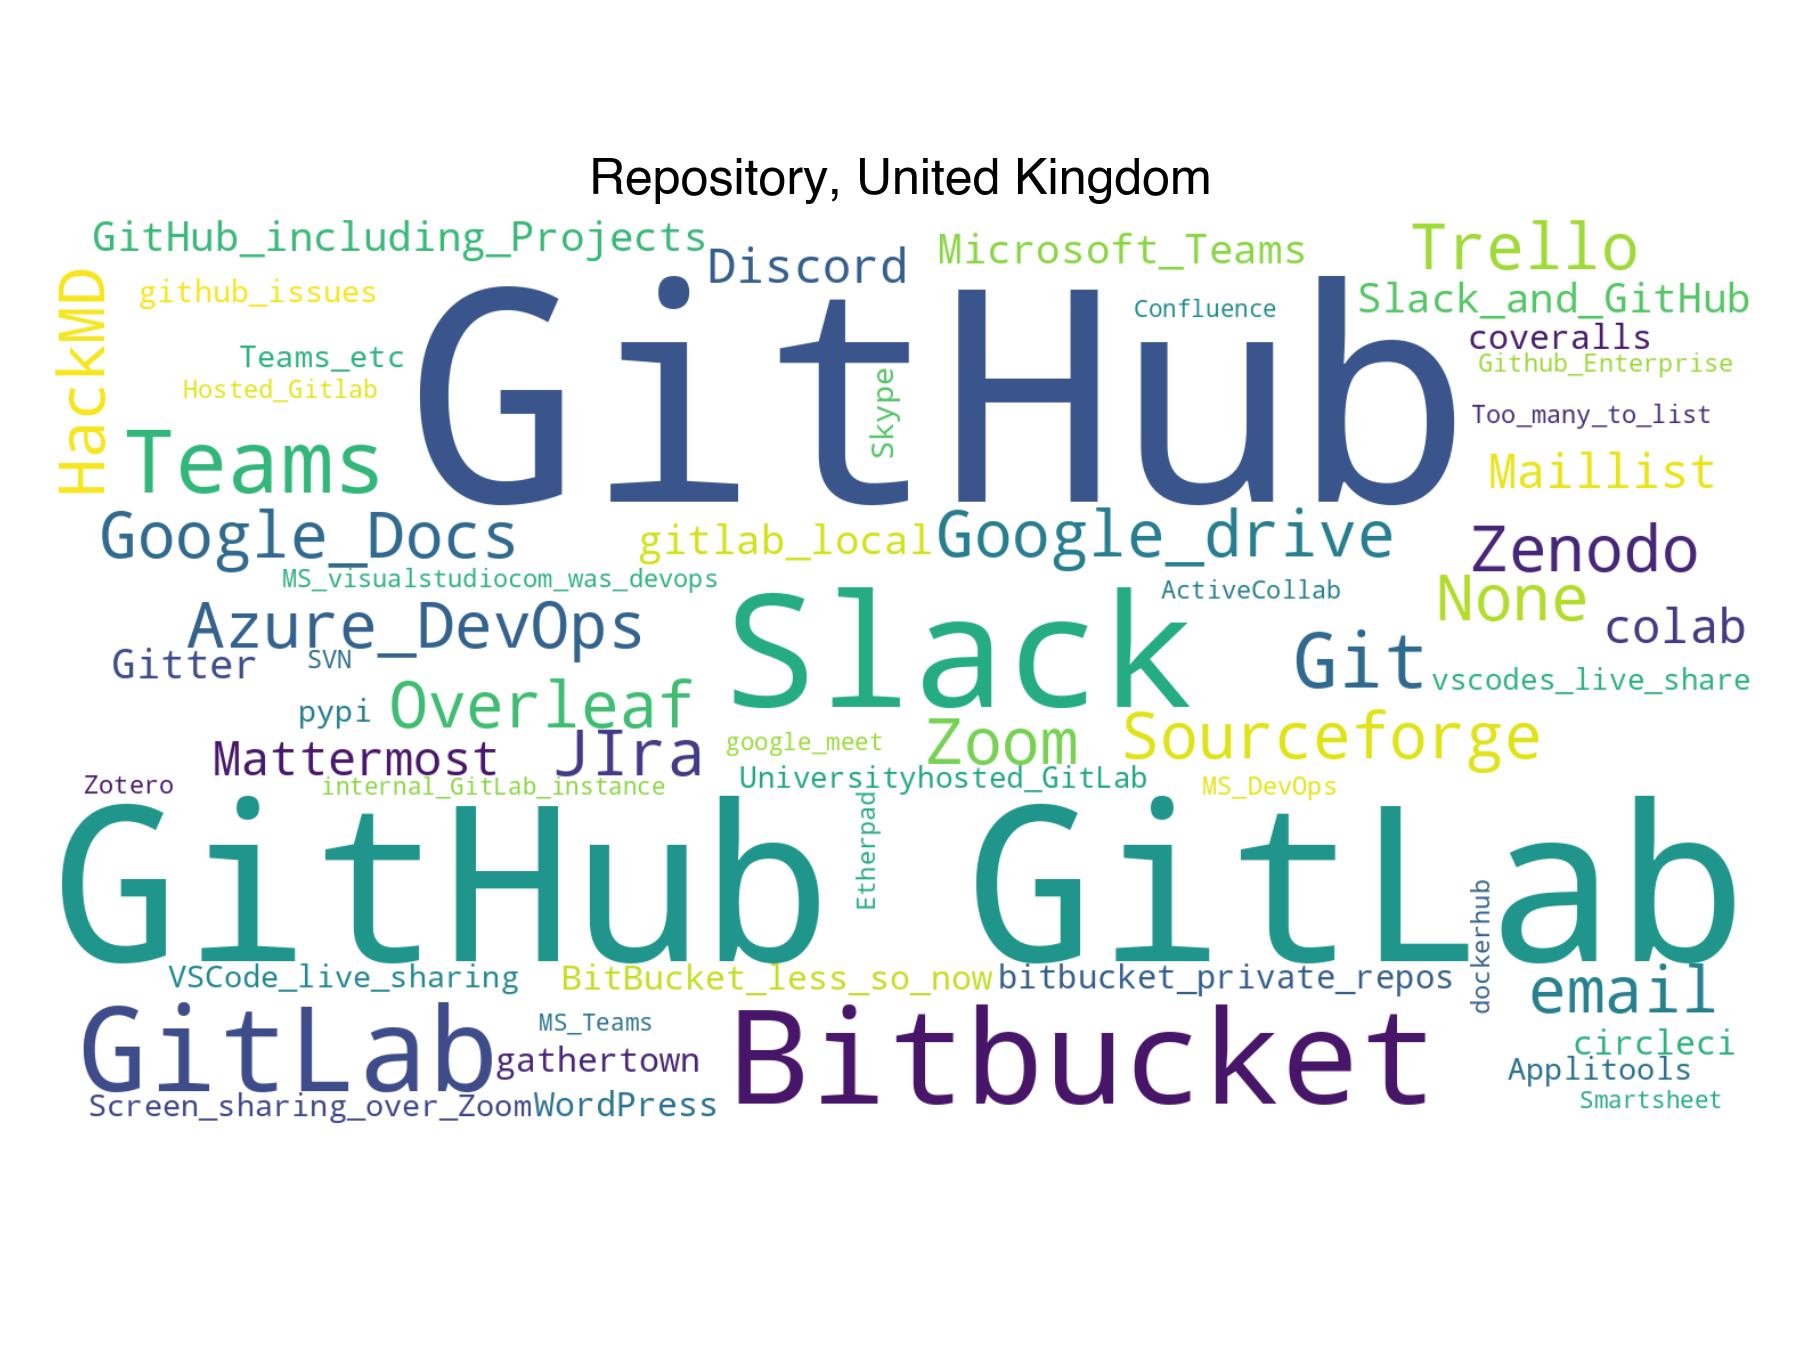
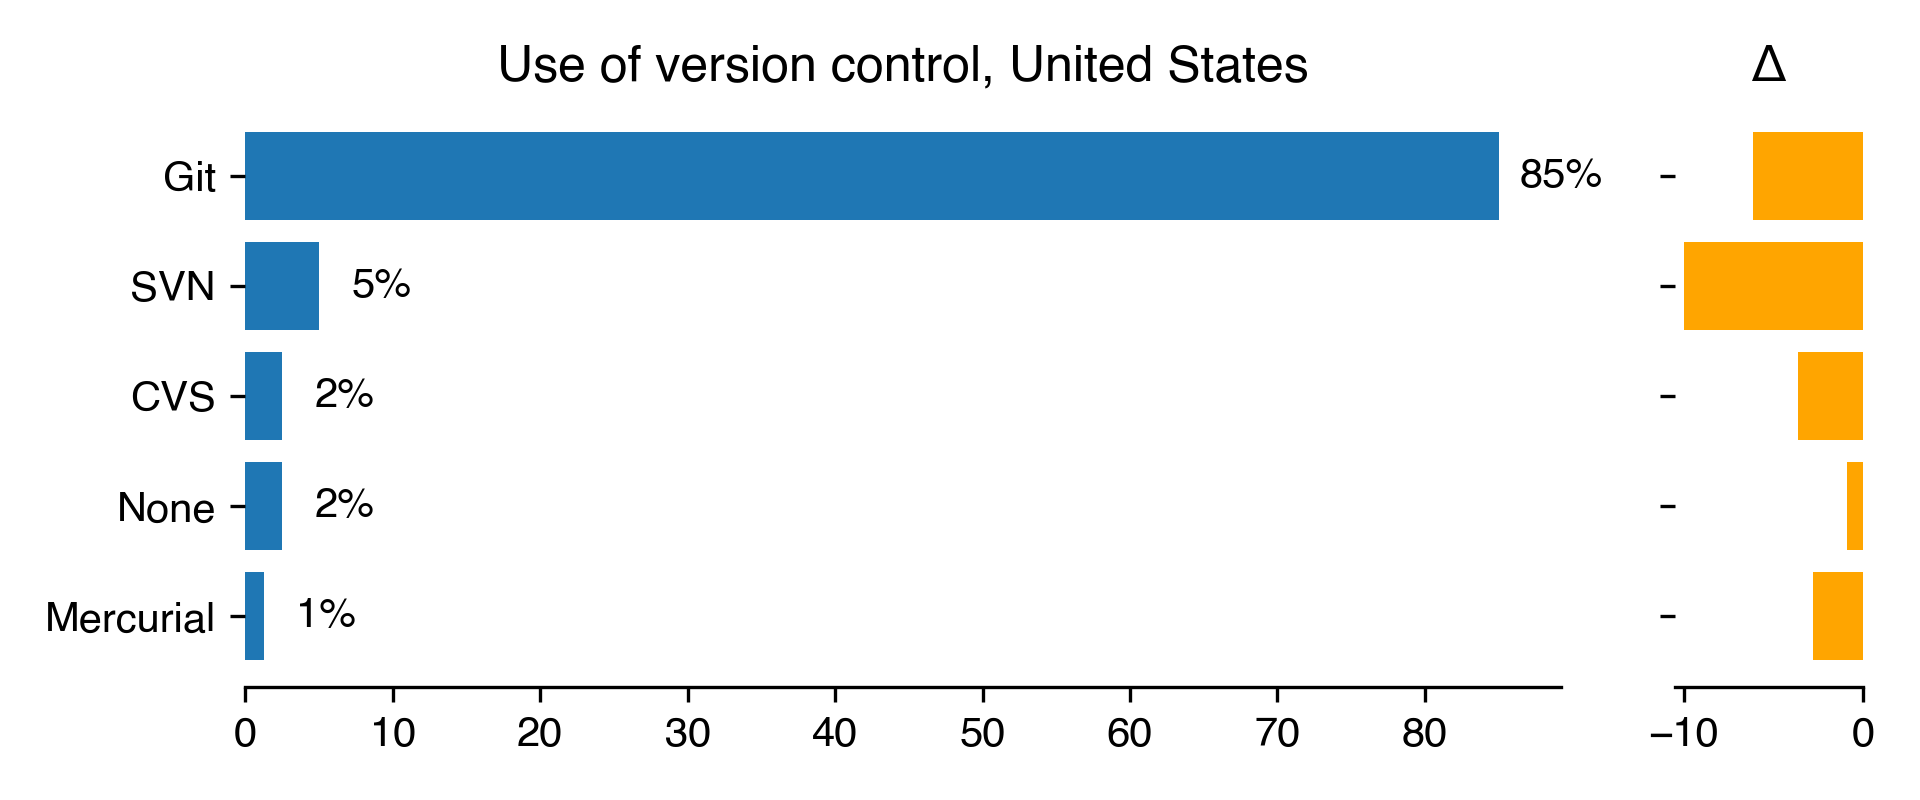
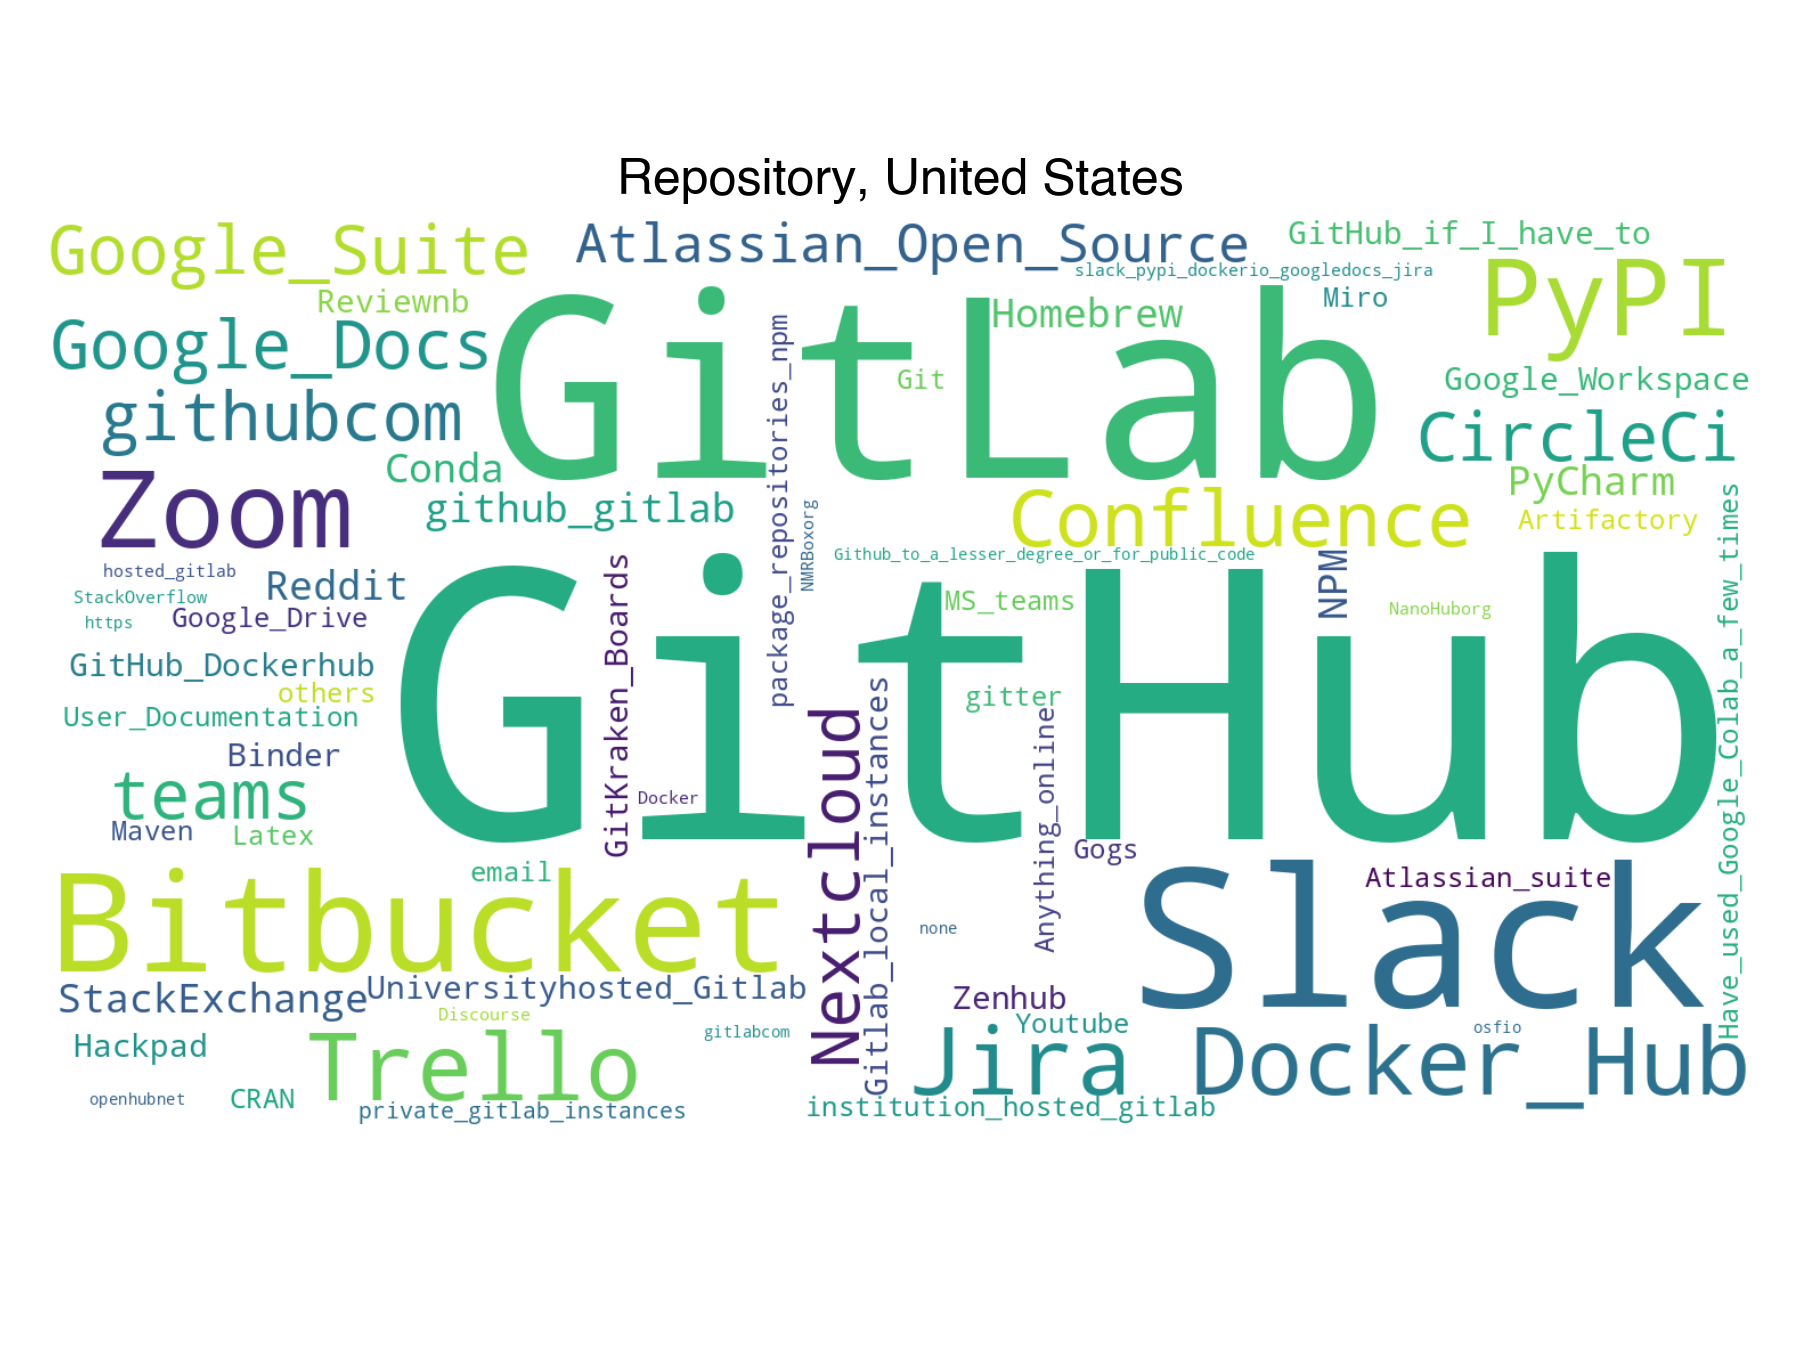
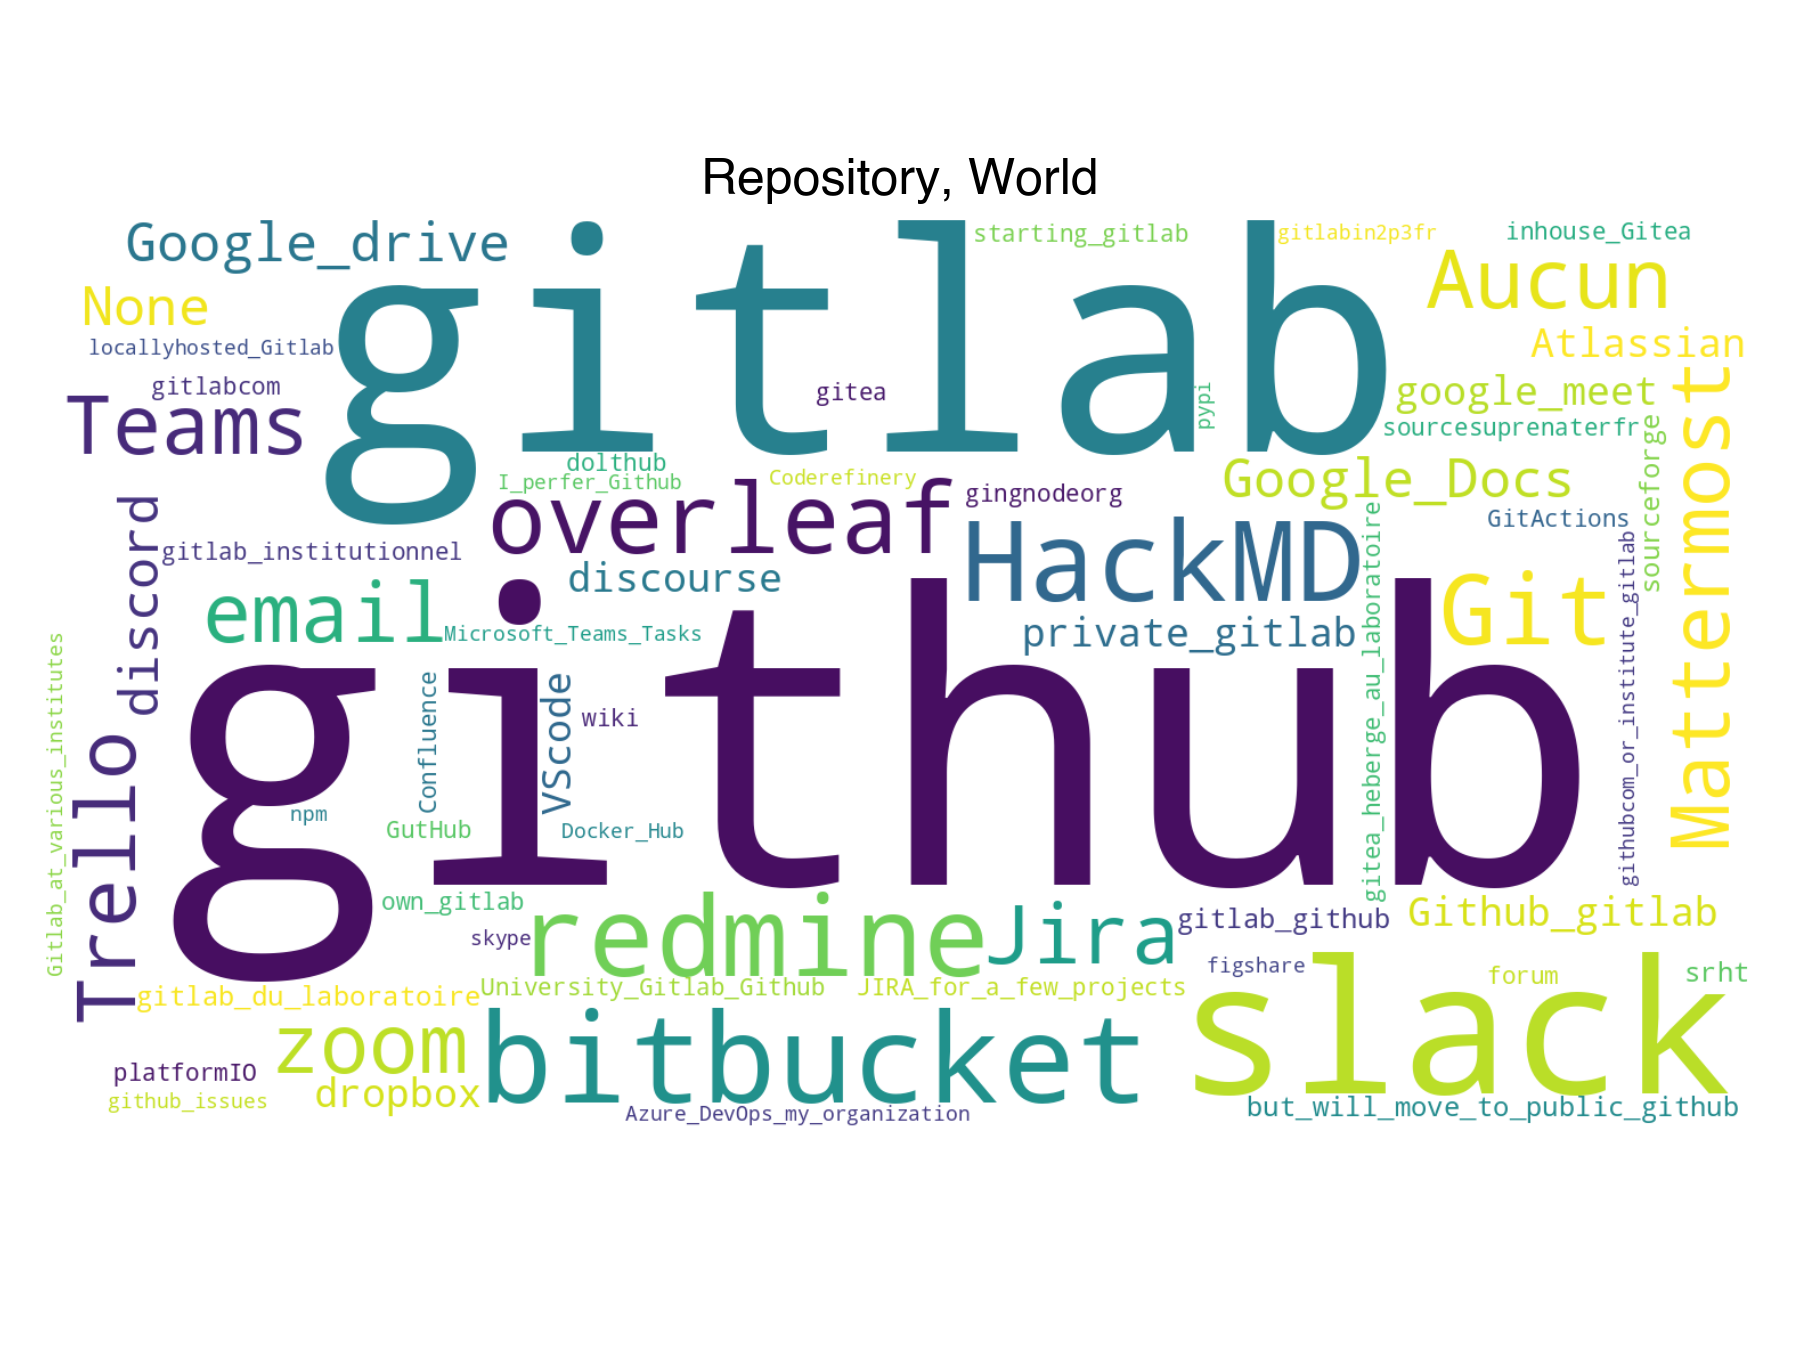
We also asked the participants if they use any version control tools through
a list of choice. And finally we asked them which repository they are currently
using for their most important project.
Bus factor for Australia
Count
Percentage
Percentage in 2018
Difference with previous year
1
15
48.39
68.18
-19.79
2
10
32.26
18.18
14.08
3
4
12.9
5.68
7.22
5
1
3.23
3.41
-0.18
10
1
3.23
nan
nan
Download CSV
2022-08-22T11:22:37.626999
image/svg+xml
Matplotlib v3.5.2, https://matplotlib.org/
PNG SVG
Presence of transition plan for Australia
Count
Percentage
Percentage in 2018
Difference with previous year
Yes
8
25.81
10.23
15.58
No
23
74.19
89.77
-15.58
Download CSV
2022-08-22T11:22:37.921621
image/svg+xml
Matplotlib v3.5.2, https://matplotlib.org/
PNG SVG
Use of version control for Australia
Count
Percentage
Percentage in 2018
Difference with previous year
Git
30
93.75
81.82
11.93
None
1
3.12
2.02
1.1
CVS
0
0
7.07
-7.07
SVN
0
0
20.2
-20.2
Mercurial
0
0
4.04
-4.04
Download CSV
2022-08-22T11:22:38.290359
image/svg+xml
Matplotlib v3.5.2, https://matplotlib.org/
PNG SVG
Testing strategies for Australia
Count
Percentage
Percentage in 2018
Difference with previous year
No formal testing
3
9.38
12.12
-2.75
No formal testing but users provide feedback
9
28.12
33.33
-5.21
The developers do their own testing
20
62.5
73.74
-11.24
Test engineers conduct testing
3
9.38
4.04
5.33
Automated testing with continuous integration
15
46.88
0
46.88
Don’t know
nan
nan
nan
nan
Download CSV
2022-08-22T11:22:38.713476
image/svg+xml
Matplotlib v3.5.2, https://matplotlib.org/
PNG SVG
2022-08-22T11:22:39.741061
image/svg+xml
Matplotlib v3.5.2, https://matplotlib.org/
PNG SVG
No data found in survey.
2022-08-22T11:22:40.224633
image/svg+xml
Matplotlib v3.5.2, https://matplotlib.org/
PNG SVG
Presence of transition plan for Canada
Count
Percentage
Percentage in 2018
Difference with previous year
Yes
4
36.36
20
16.36
No
7
63.64
80
-16.36
Download CSV
2022-08-22T11:22:40.443429
image/svg+xml
Matplotlib v3.5.2, https://matplotlib.org/
PNG SVG
Use of version control for Canada
Count
Percentage
Percentage in 2018
Difference with previous year
Git
11
100
90.91
9.09
SVN
0
0
18.18
-18.18
Download CSV
2022-08-22T11:22:40.700613
image/svg+xml
Matplotlib v3.5.2, https://matplotlib.org/
PNG SVG
Testing strategies for Canada
Count
Percentage
Percentage in 2018
Difference with previous year
No formal testing
1
9.09
0
9.09
No formal testing but users provide feedback
2
18.18
9.09
9.09
The developers do their own testing
7
63.64
81.82
-18.18
Test engineers conduct testing
1
9.09
9.09
0
Automated testing with continuous integration
8
72.73
0
72.73
Don’t know
nan
nan
nan
nan
Download CSV
2022-08-22T11:22:41.106065
image/svg+xml
Matplotlib v3.5.2, https://matplotlib.org/
PNG SVG
2022-08-22T11:22:41.970464
image/svg+xml
Matplotlib v3.5.2, https://matplotlib.org/
PNG SVG
Bus factor for Germany
Count
Percentage
Percentage in 2018
Difference with previous year
0
11
5.09
5.76
-0.67
1
125
57.87
57.29
0.58
1.5
2
0.93
0.68
0.25
2
51
23.61
26.44
-2.83
3
8
3.7
5.76
-2.06
3.5
1
0.46
nan
nan
4
4
1.85
1.02
0.83
5
7
3.24
1.02
2.22
8
1
0.46
nan
nan
10
3
1.39
nan
nan
18
1
0.46
nan
nan
20
1
0.46
nan
nan
1e+10
1
0.46
nan
nan
Download CSV
2022-08-22T11:22:42.803976
image/svg+xml
Matplotlib v3.5.2, https://matplotlib.org/
PNG SVG
Presence of transition plan for Germany
Count
Percentage
Percentage in 2018
Difference with previous year
Yes
22
10.14
16.22
-6.08
No
195
89.86
83.78
6.08
Download CSV
2022-08-22T11:22:43.114520
image/svg+xml
Matplotlib v3.5.2, https://matplotlib.org/
PNG SVG
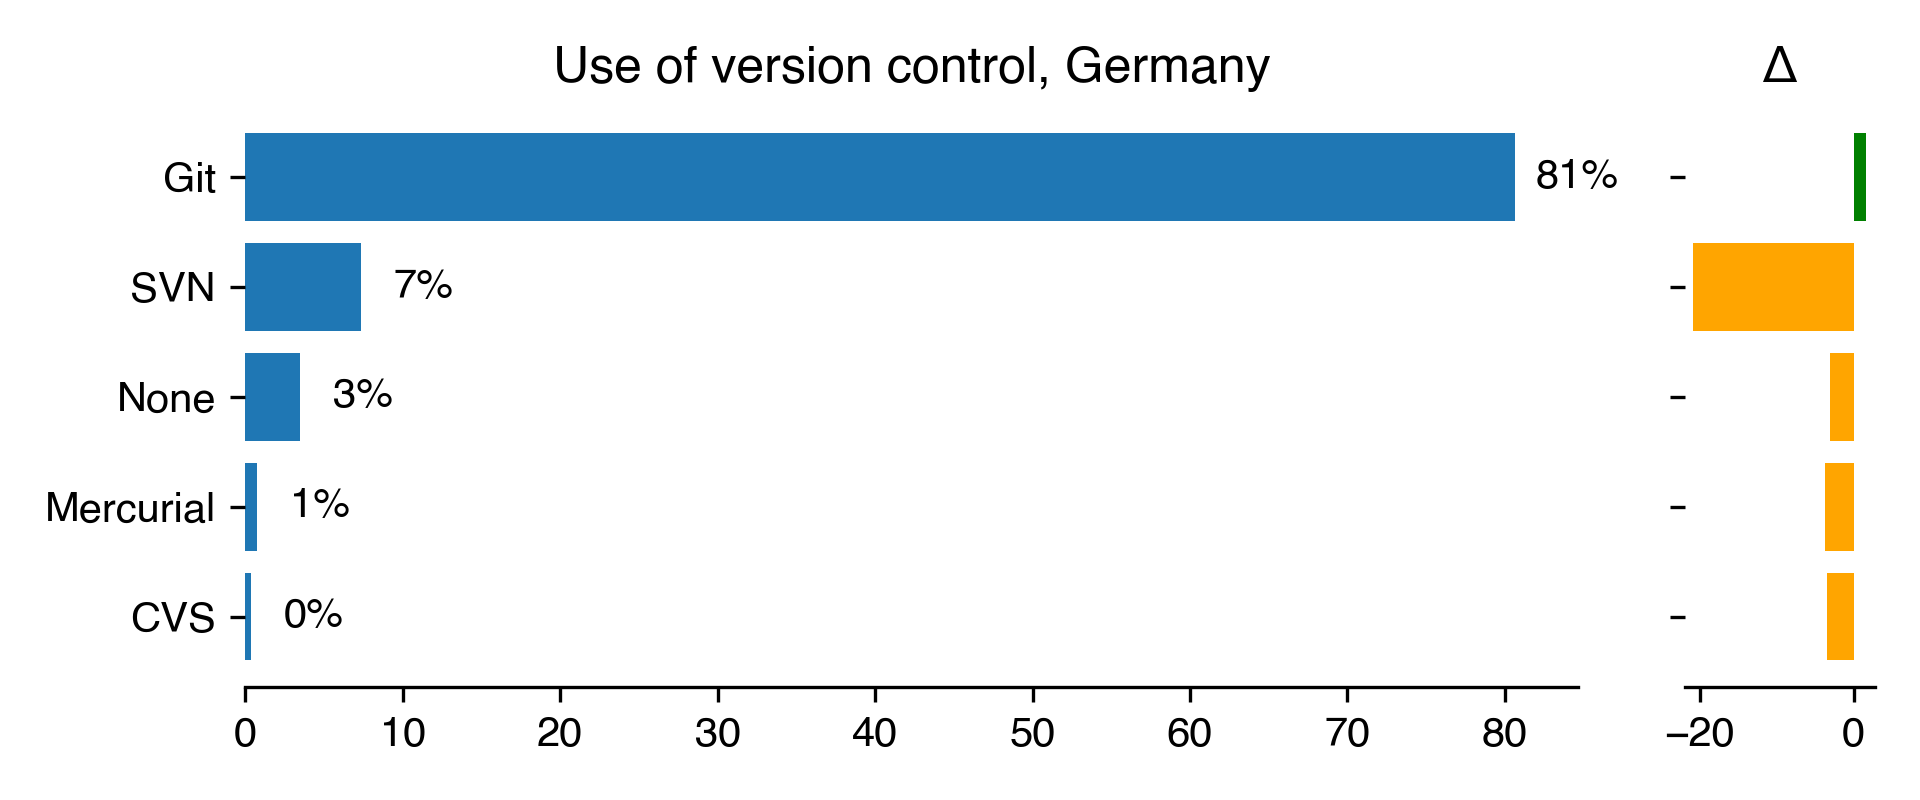
Use of version control for Germany
Count
Percentage
Percentage in 2018
Difference with previous year
Git
208
80.62
78.98
1.64
SVN
19
7.36
28.23
-20.86
None
9
3.49
6.61
-3.12
Mercurial
2
0.78
4.5
-3.73
CVS
1
0.39
3.9
-3.52
Download CSV
2022-08-22T11:22:43.471270
image/svg+xml
Matplotlib v3.5.2, https://matplotlib.org/
PNG SVG
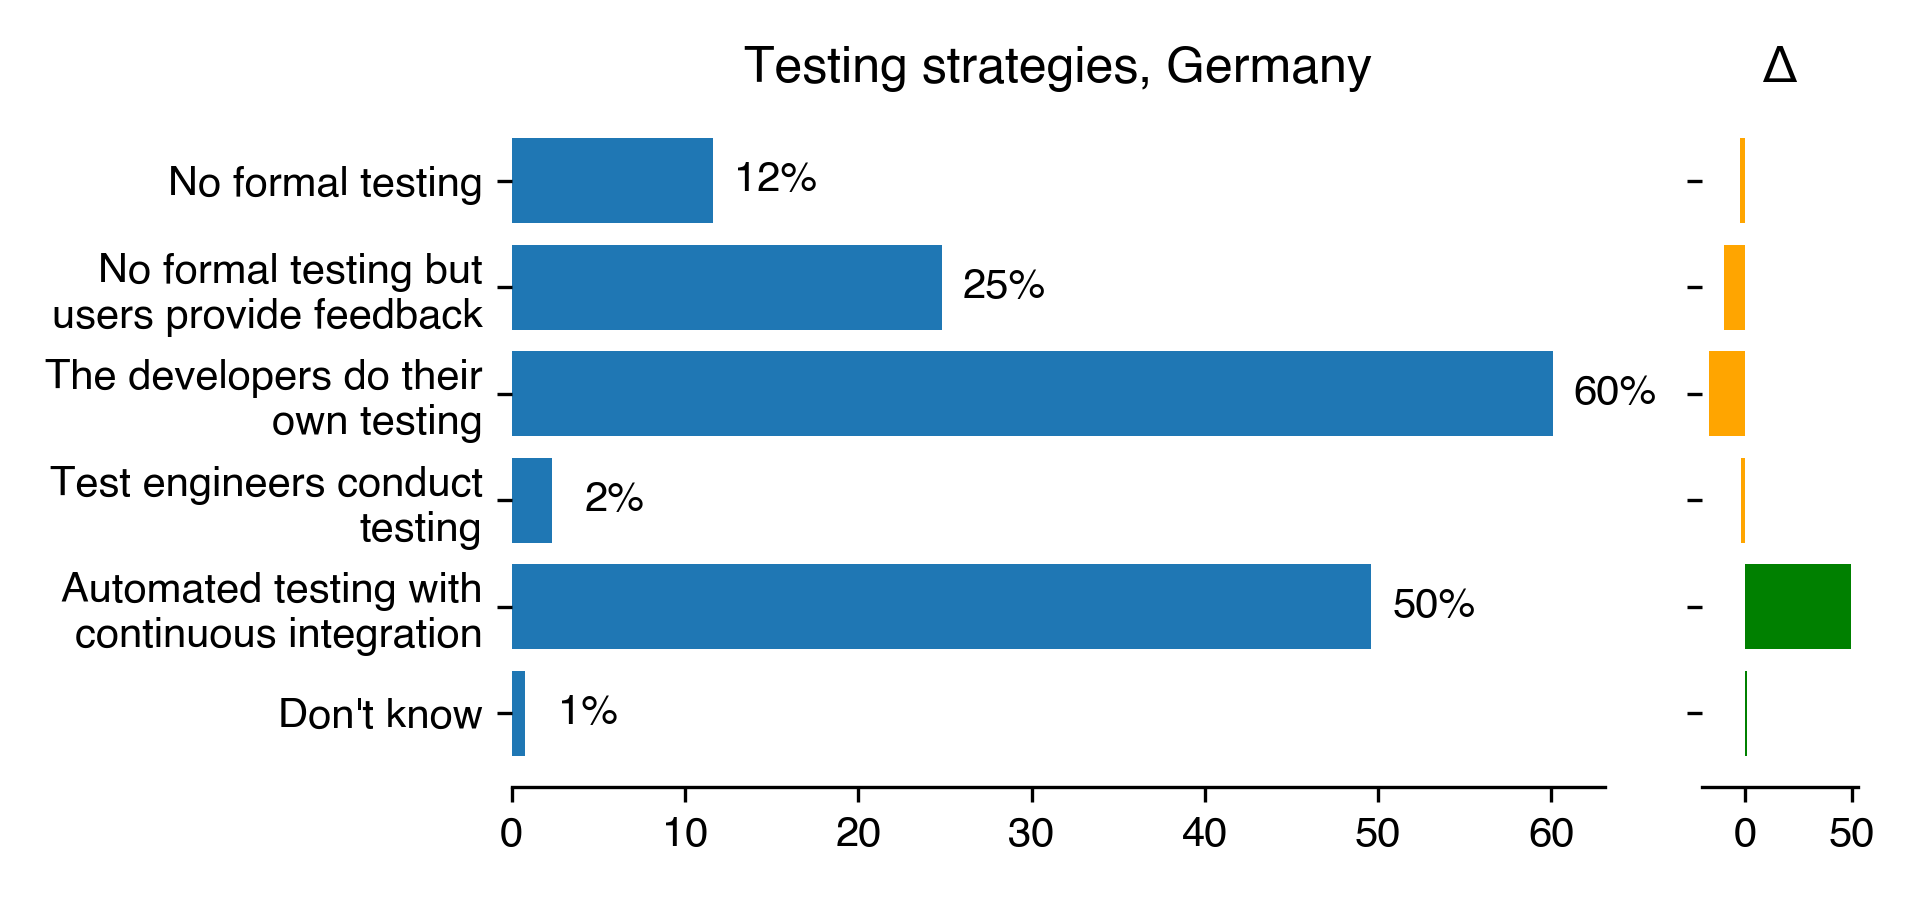
Testing strategies for Germany
Count
Percentage
Percentage in 2018
Difference with previous year
No formal testing
30
11.63
14.11
-2.49
No formal testing but users provide feedback
64
24.81
34.83
-10.03
The developers do their own testing
155
60.08
77.18
-17.1
Test engineers conduct testing
6
2.33
4.2
-1.88
Automated testing with continuous integration
128
49.61
0
49.61
Don’t know
2
0.78
0
0.78
Download CSV
2022-08-22T11:22:44.014109
image/svg+xml
Matplotlib v3.5.2, https://matplotlib.org/
PNG SVG
2022-08-22T11:22:45.790954
image/svg+xml
Matplotlib v3.5.2, https://matplotlib.org/
PNG SVG
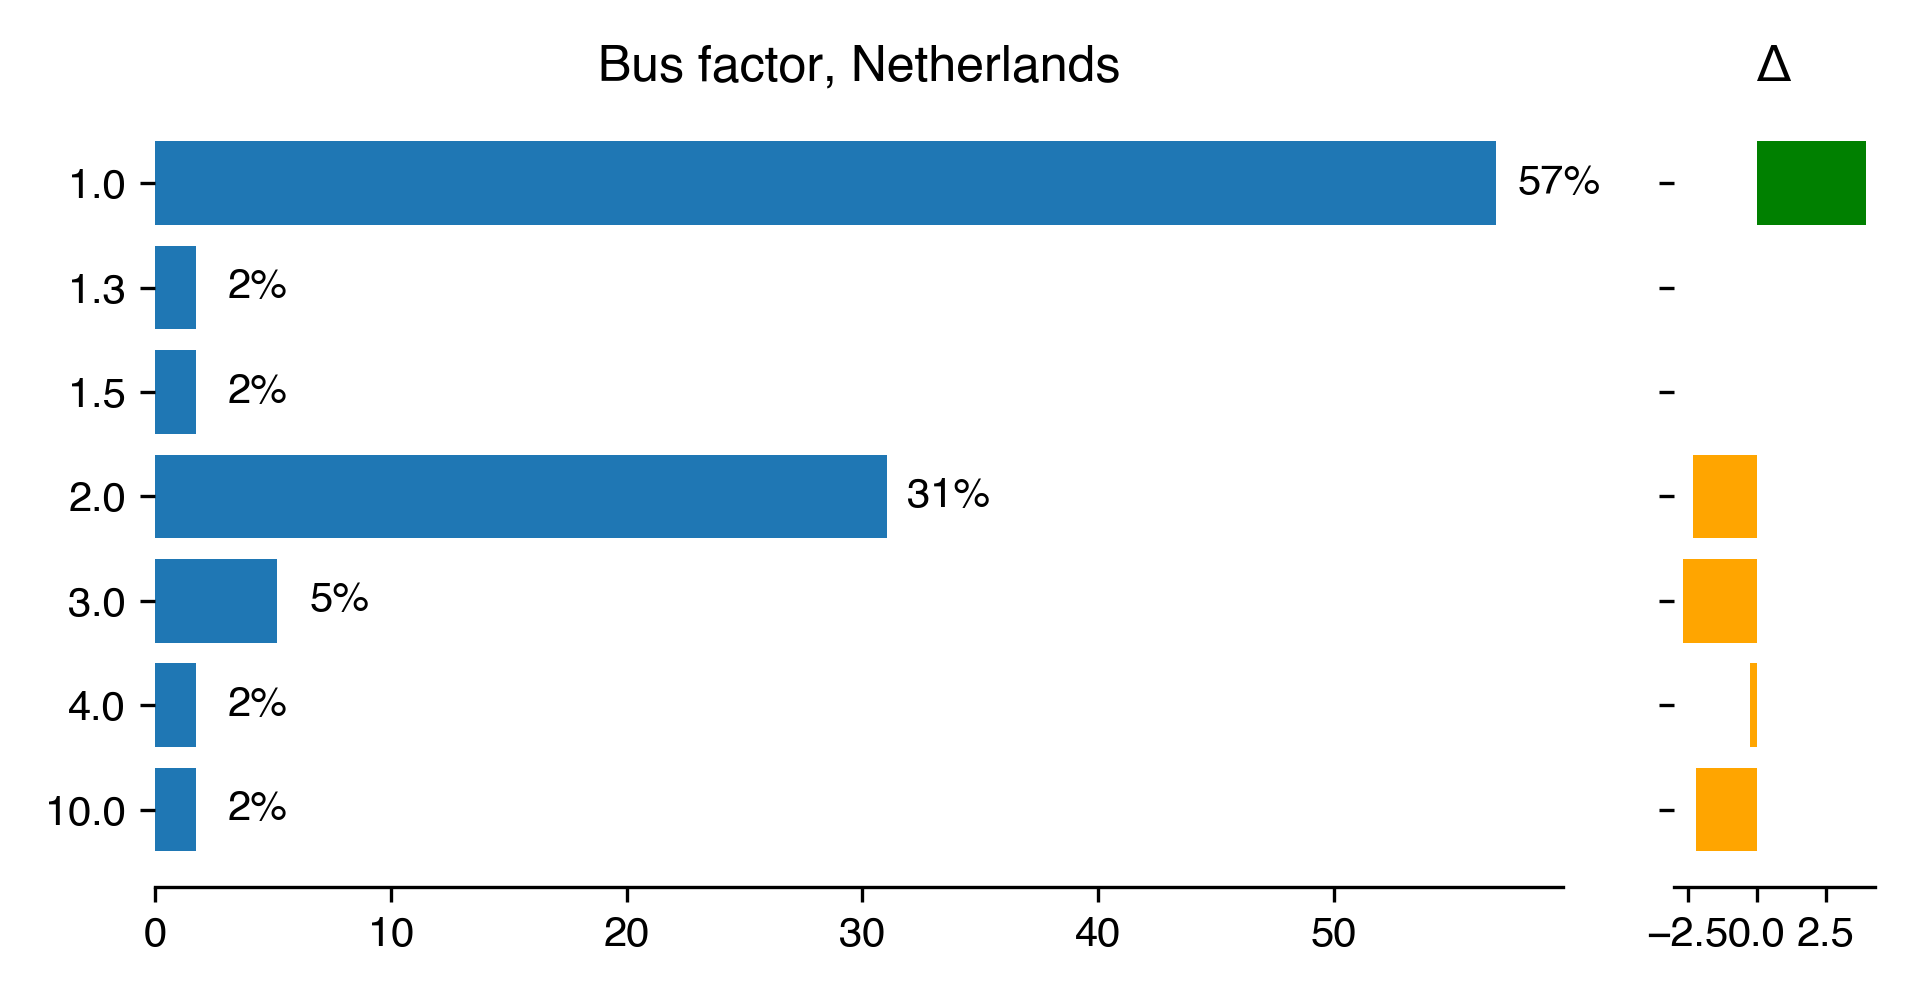
Bus factor for Netherlands
Count
Percentage
Percentage in 2018
Difference with previous year
1
33
56.9
52.94
3.96
1.3
1
1.72
nan
nan
1.5
1
1.72
nan
nan
2
18
31.03
33.33
-2.3
3
3
5.17
7.84
-2.67
4
1
1.72
1.96
-0.24
10
1
1.72
3.92
-2.2
Download CSV
2022-08-22T11:22:46.517963
image/svg+xml
Matplotlib v3.5.2, https://matplotlib.org/
PNG SVG
Presence of transition plan for Netherlands
Count
Percentage
Percentage in 2018
Difference with previous year
Yes
7
12.07
19.61
-7.54
No
51
87.93
80.39
7.54
Download CSV
2022-08-22T11:22:46.787684
image/svg+xml
Matplotlib v3.5.2, https://matplotlib.org/
PNG SVG
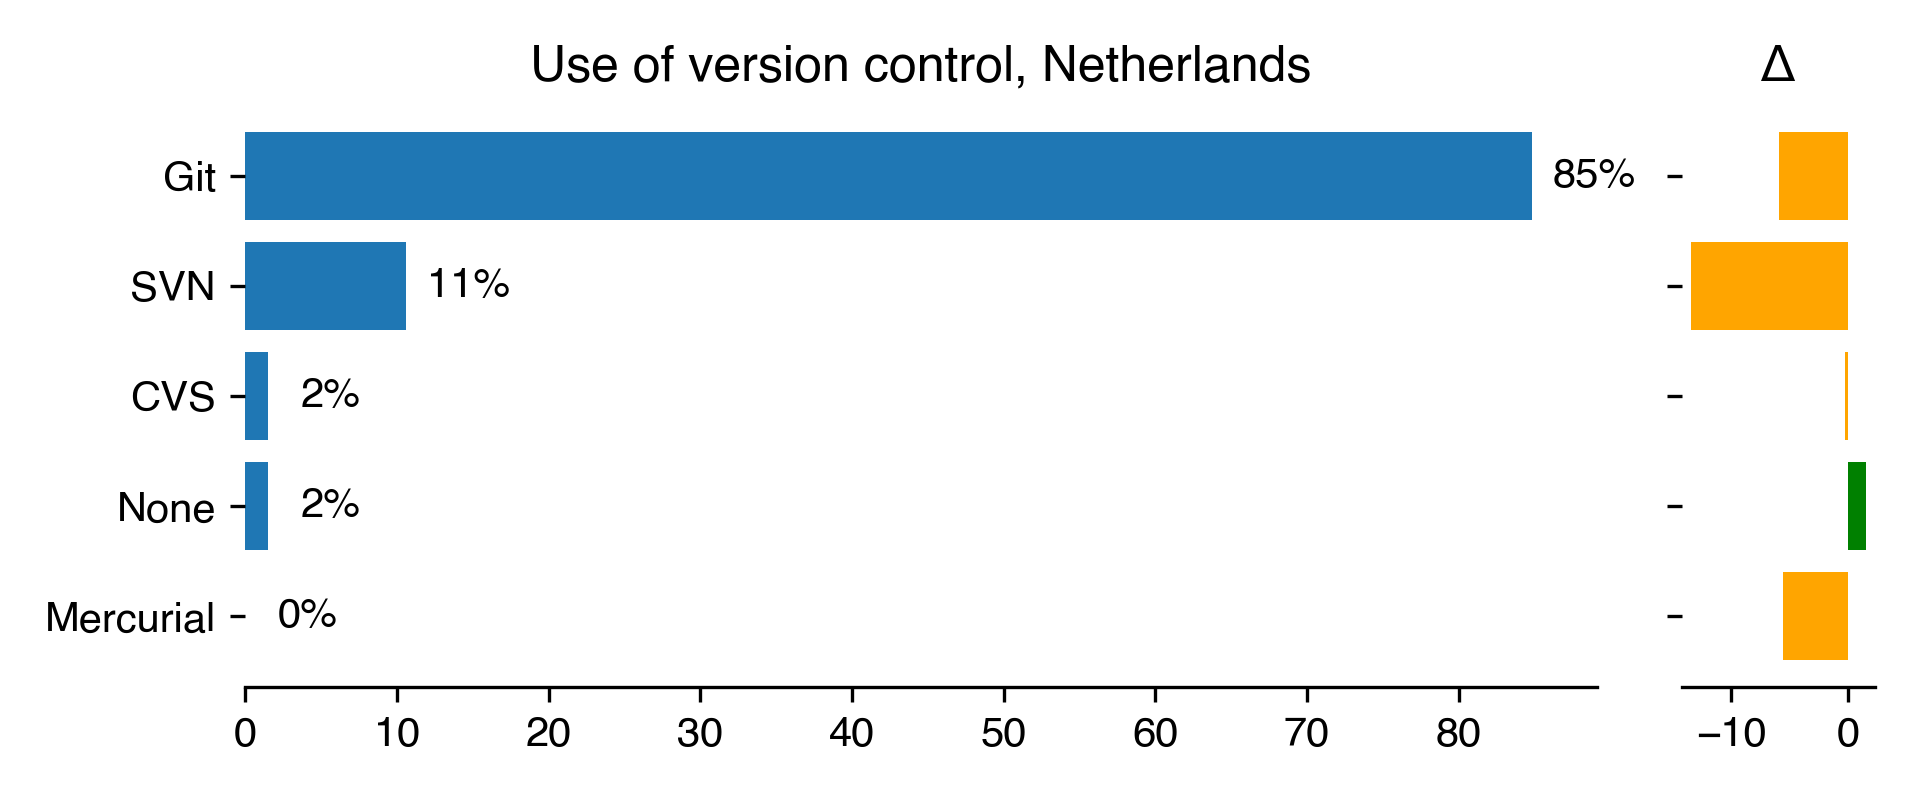
Use of version control for Netherlands
Count
Percentage
Percentage in 2018
Difference with previous year
Git
56
84.85
90.74
-5.89
SVN
7
10.61
24.07
-13.47
CVS
1
1.52
1.85
-0.34
None
1
1.52
0
1.52
Mercurial
0
0
5.56
-5.56
Download CSV
2022-08-22T11:22:47.149616
image/svg+xml
Matplotlib v3.5.2, https://matplotlib.org/
PNG SVG
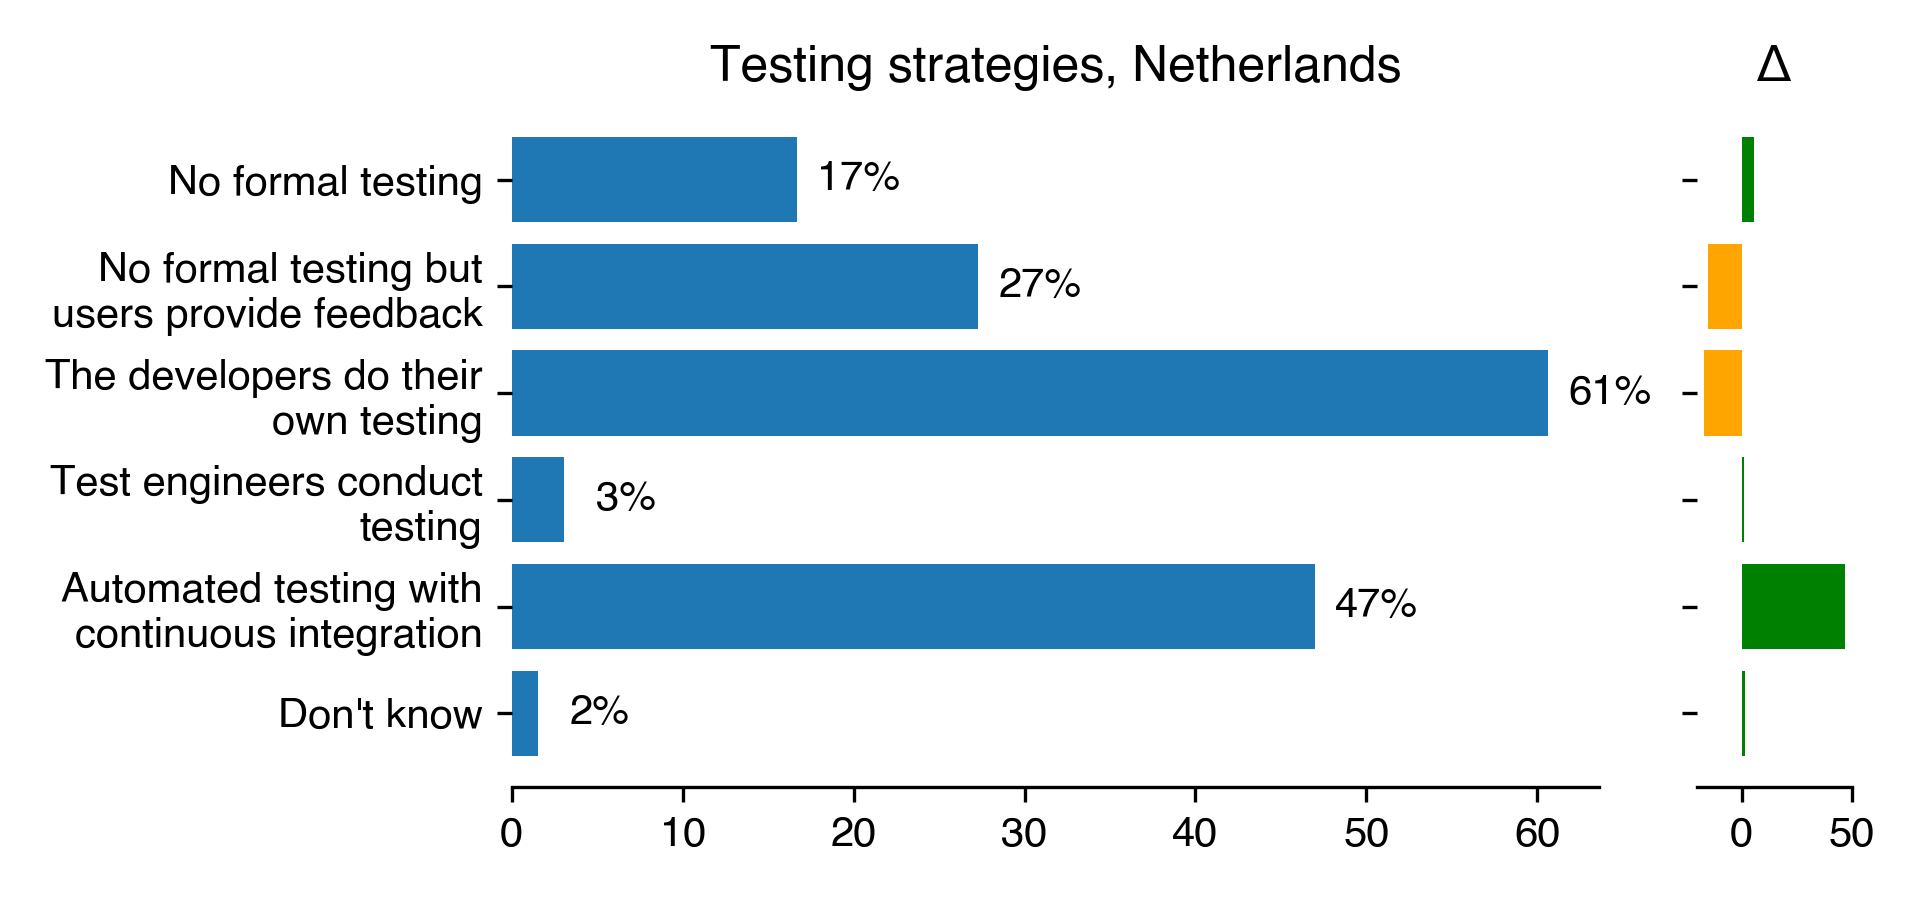
Testing strategies for Netherlands
Count
Percentage
Percentage in 2018
Difference with previous year
No formal testing
11
16.67
11.11
5.56
No formal testing but users provide feedback
18
27.27
42.59
-15.32
The developers do their own testing
40
60.61
77.78
-17.17
Test engineers conduct testing
2
3.03
1.85
1.18
Automated testing with continuous integration
31
46.97
0
46.97
Don’t know
1
1.52
0
1.52
Download CSV
2022-08-22T11:22:47.577650
image/svg+xml
Matplotlib v3.5.2, https://matplotlib.org/
PNG SVG
2022-08-22T11:22:48.761323
image/svg+xml
Matplotlib v3.5.2, https://matplotlib.org/
PNG SVG
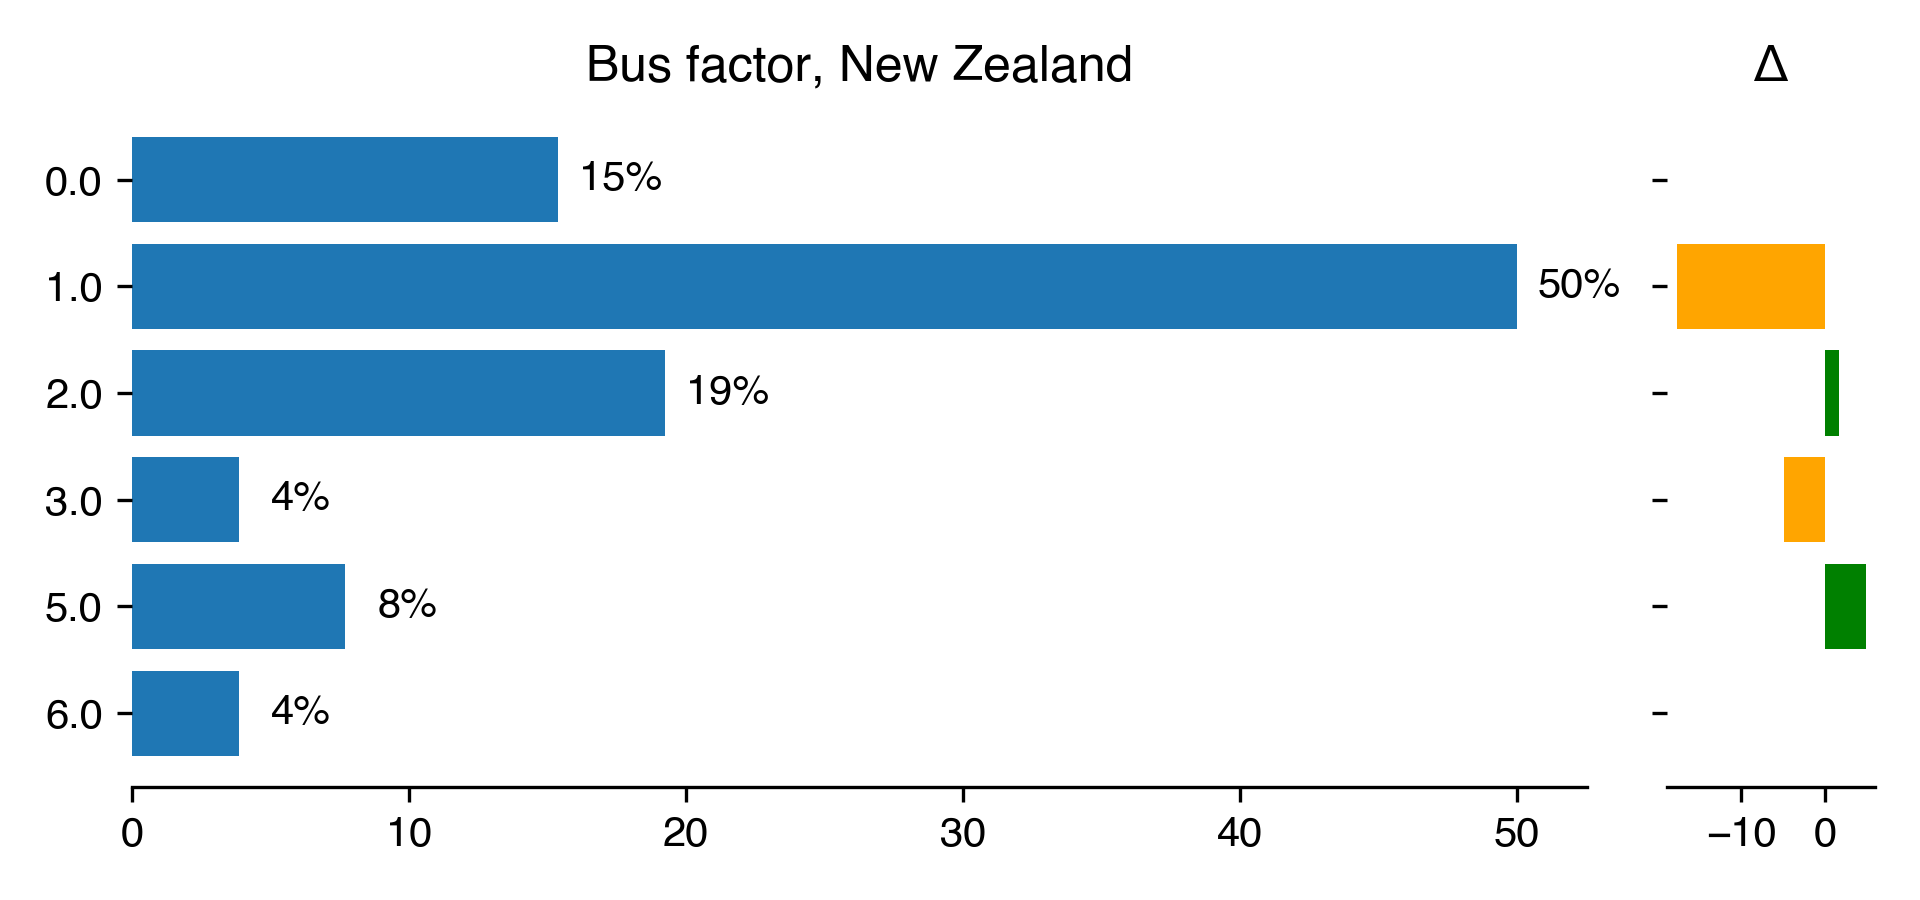
Bus factor for New Zealand
Count
Percentage
Percentage in 2018
Difference with previous year
0
4
15.38
nan
nan
1
13
50
67.65
-17.65
2
5
19.23
17.65
1.58
3
1
3.85
8.82
-4.98
5
2
7.69
2.94
4.75
6
1
3.85
nan
nan
Download CSV
2022-08-22T11:22:49.440588
image/svg+xml
Matplotlib v3.5.2, https://matplotlib.org/
PNG SVG
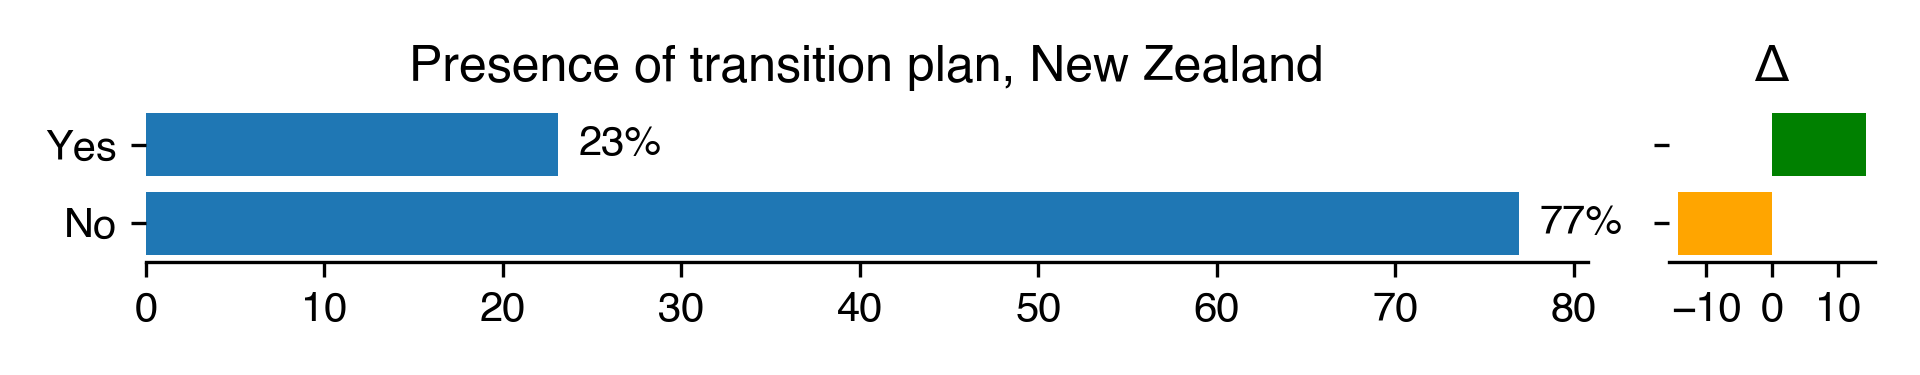
Presence of transition plan for New Zealand
Count
Percentage
Percentage in 2018
Difference with previous year
Yes
6
23.08
8.82
14.25
No
20
76.92
91.18
-14.25
Download CSV
2022-08-22T11:22:49.725699
image/svg+xml
Matplotlib v3.5.2, https://matplotlib.org/
PNG SVG
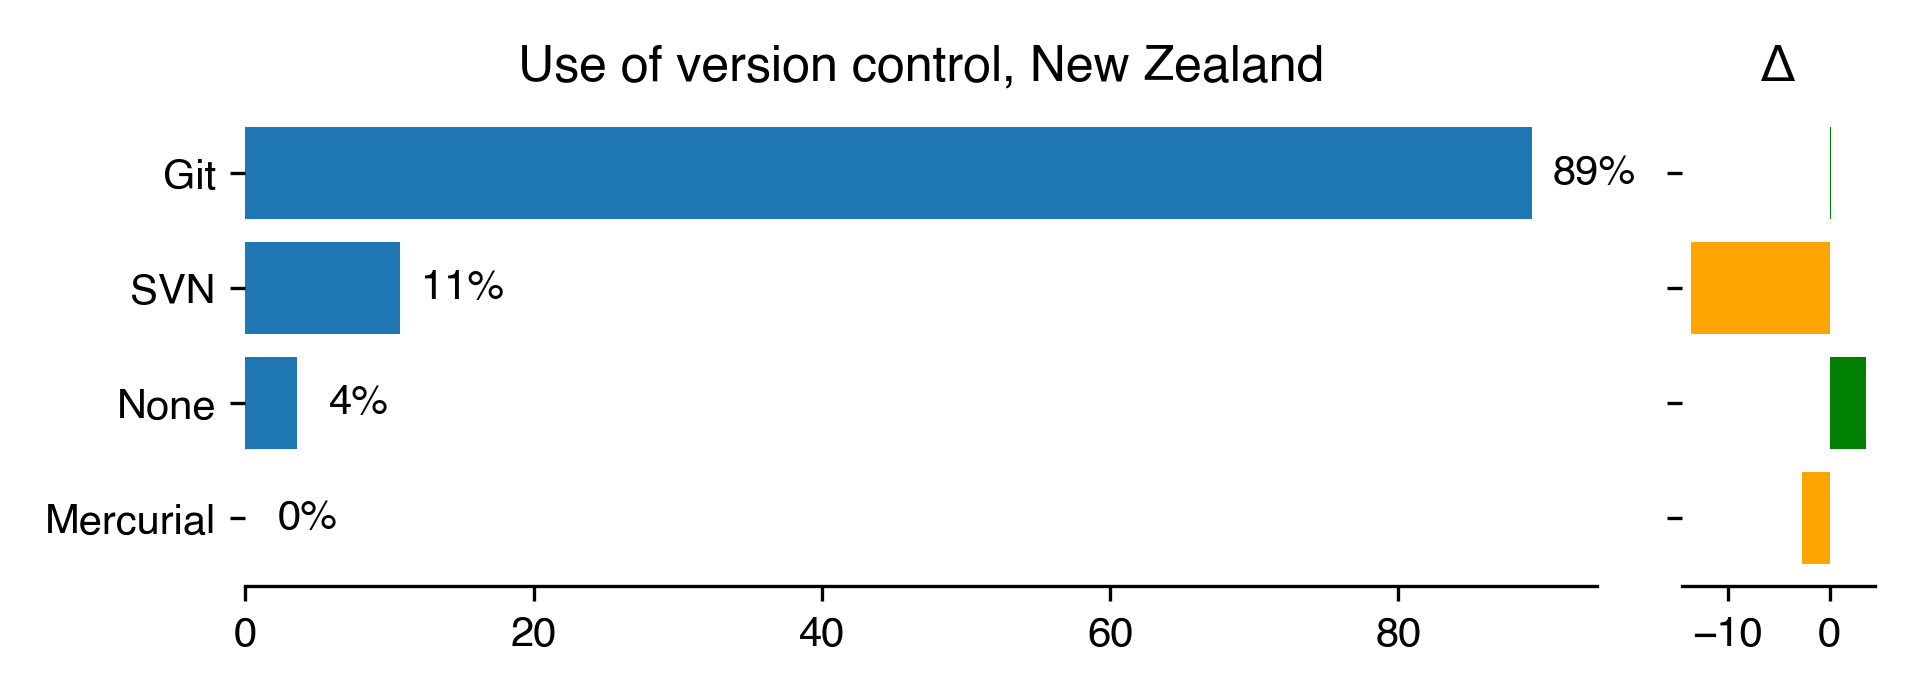
Use of version control for New Zealand
Count
Percentage
Percentage in 2018
Difference with previous year
Git
25
89.29
89.19
0.1
SVN
3
10.71
24.32
-13.61
None
1
3.57
0
3.57
Mercurial
0
0
2.7
-2.7
Download CSV
2022-08-22T11:22:50.055444
image/svg+xml
Matplotlib v3.5.2, https://matplotlib.org/
PNG SVG
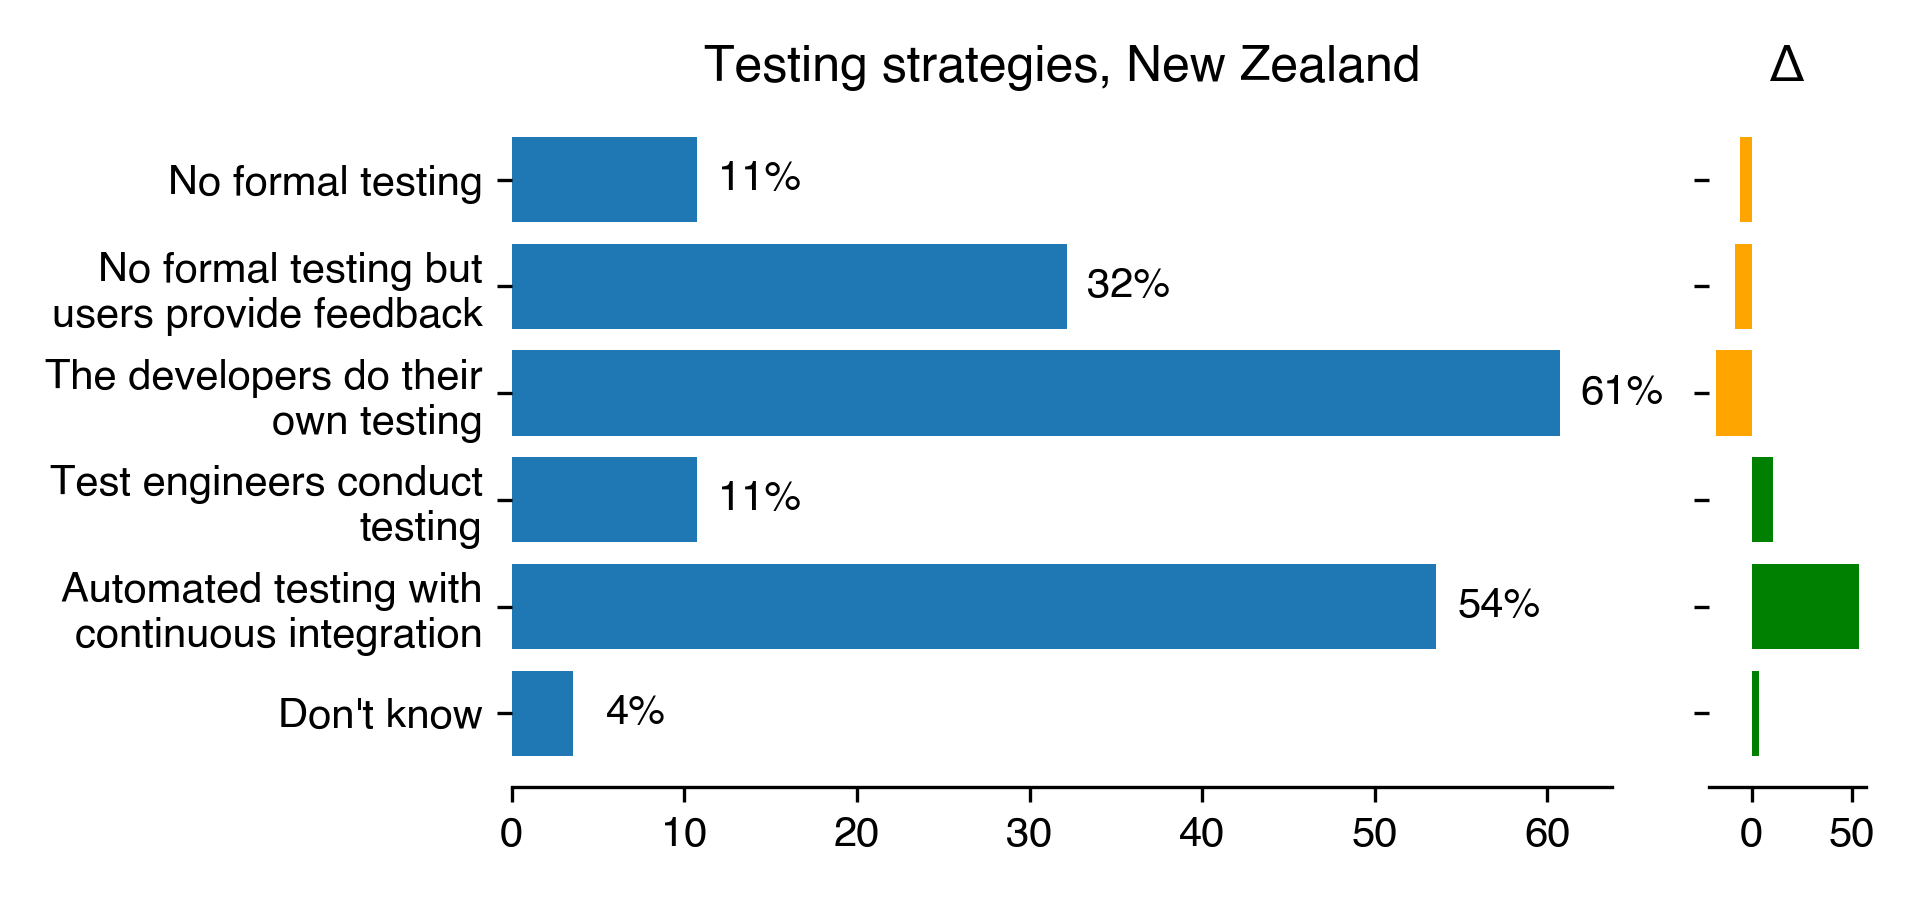
Testing strategies for New Zealand
Count
Percentage
Percentage in 2018
Difference with previous year
No formal testing
3
10.71
16.22
-5.5
No formal testing but users provide feedback
9
32.14
40.54
-8.4
The developers do their own testing
17
60.71
78.38
-17.66
Test engineers conduct testing
3
10.71
0
10.71
Automated testing with continuous integration
15
53.57
0
53.57
Don’t know
1
3.57
0
3.57
Download CSV
2022-08-22T11:22:50.477302
image/svg+xml
Matplotlib v3.5.2, https://matplotlib.org/
PNG SVG
2022-08-22T11:22:51.499925
image/svg+xml
Matplotlib v3.5.2, https://matplotlib.org/
PNG SVG
Bus factor for South Africa
Count
Percentage
Percentage in 2018
Difference with previous year
1
2
100
66.67
33.33
Download CSV
2022-08-22T11:22:52.021241
image/svg+xml
Matplotlib v3.5.2, https://matplotlib.org/
PNG SVG
Presence of transition plan for South Africa
Count
Percentage
Percentage in 2018
Difference with previous year
Yes
nan
nan
23.81
nan
No
2
100
76.19
23.81
Download CSV
2022-08-22T11:22:52.363271
image/svg+xml
Matplotlib v3.5.2, https://matplotlib.org/
PNG SVG
Use of version control for South Africa
Count
Percentage
Percentage in 2018
Difference with previous year
Git
2
100
73.91
26.09
SVN
0
0
13.04
-13.04
None
0
0
13.04
-13.04
Download CSV
2022-08-22T11:22:52.663857
image/svg+xml
Matplotlib v3.5.2, https://matplotlib.org/
PNG SVG
Testing strategies for South Africa
Count
Percentage
Percentage in 2018
Difference with previous year
No formal testing
1
50
13.04
36.96
No formal testing but users provide feedback
2
100
47.83
52.17
The developers do their own testing
2
100
60.87
39.13
Test engineers conduct testing
0
0
4.35
-4.35
Automated testing with continuous integration
nan
nan
nan
nan
Don’t know
nan
nan
nan
nan
Download CSV
2022-08-22T11:22:53.078684
image/svg+xml
Matplotlib v3.5.2, https://matplotlib.org/
PNG SVG
2022-08-22T11:22:53.711089
image/svg+xml
Matplotlib v3.5.2, https://matplotlib.org/
PNG SVG
Bus factor for United Kingdom
Count
Percentage
Percentage in 2018
Difference with previous year
0
2
1.32
2.34
-1.02
1
72
47.37
38.32
9.05
2
42
27.63
35.98
-8.35
3
23
15.13
9.81
5.32
4
8
5.26
6.54
-1.28
5
2
1.32
1.87
-0.55
6
1
0.66
1.4
-0.74
20
1
0.66
nan
nan
100
1
0.66
nan
nan
Download CSV
2022-08-22T11:22:54.397849
image/svg+xml
Matplotlib v3.5.2, https://matplotlib.org/
PNG SVG
Presence of transition plan for United Kingdom
Count
Percentage
Percentage in 2018
Difference with previous year
Yes
43
28.29
24.3
3.99
No
109
71.71
75.7
-3.99
Download CSV
2022-08-22T11:22:54.734822
image/svg+xml
Matplotlib v3.5.2, https://matplotlib.org/
PNG SVG
Use of version control for United Kingdom
Count
Percentage
Percentage in 2018
Difference with previous year
Git
149
85.14
84.32
0.82
SVN
14
8
22.46
-14.46
Mercurial
3
1.71
9.75
-8.03
None
2
1.14
1.69
-0.55
CVS
0
0
4.66
-4.66
Download CSV
2022-08-22T11:22:55.116240
image/svg+xml
Matplotlib v3.5.2, https://matplotlib.org/
PNG SVG
Testing strategies for United Kingdom
Count
Percentage
Percentage in 2018
Difference with previous year
No formal testing
20
11.43
7.63
3.8
No formal testing but users provide feedback
35
20
22.46
-2.46
The developers do their own testing
116
66.29
81.36
-15.07
Test engineers conduct testing
6
3.43
2.97
0.46
Automated testing with continuous integration
100
57.14
0
57.14
Don’t know
1
0.57
0
0.57
Download CSV
2022-08-22T11:22:55.547404
image/svg+xml
Matplotlib v3.5.2, https://matplotlib.org/
PNG SVG
2022-08-22T11:22:56.929489
image/svg+xml
Matplotlib v3.5.2, https://matplotlib.org/
PNG SVG
Bus factor for United States
Count
Percentage
Percentage in 2018
Difference with previous year
1
63
44.06
52.9
-8.84
1.5
2
1.4
nan
nan
2
49
34.27
28.26
6
3
17
11.89
9.42
2.47
4
4
2.8
5.8
-3
5
6
4.2
0.72
3.47
7
1
0.7
0.72
-0.03
10
1
0.7
nan
nan
Download CSV
2022-08-22T11:22:57.681675
image/svg+xml
Matplotlib v3.5.2, https://matplotlib.org/
PNG SVG
Presence of transition plan for United States
Count
Percentage
Percentage in 2018
Difference with previous year
Yes
25
17.48
20.29
-2.81
No
118
82.52
79.71
2.81
Download CSV
2022-08-22T11:22:57.976456
image/svg+xml
Matplotlib v3.5.2, https://matplotlib.org/
PNG SVG
Use of version control for United States
Count
Percentage
Percentage in 2018
Difference with previous year
Git
136
85
91.16
-6.16
SVN
8
5
14.97
-9.97
CVS
4
2.5
6.12
-3.62
None
4
2.5
3.4
-0.9
Mercurial
2
1.25
4.08
-2.83
Download CSV
2022-08-22T11:22:58.352129
image/svg+xml
Matplotlib v3.5.2, https://matplotlib.org/
PNG SVG
Testing strategies for United States
Count
Percentage
Percentage in 2018
Difference with previous year
No formal testing
19
11.88
6.8
5.07
No formal testing but users provide feedback
37
23.12
29.25
-6.13
The developers do their own testing
102
63.75
85.03
-21.28
Test engineers conduct testing
8
5
10.88
-5.88
Automated testing with continuous integration
96
60
0
60
Don’t know
2
1.25
0
1.25
Download CSV
2022-08-22T11:22:58.900890
image/svg+xml
Matplotlib v3.5.2, https://matplotlib.org/
PNG SVG
2022-08-22T11:23:00.318147
image/svg+xml
Matplotlib v3.5.2, https://matplotlib.org/
PNG SVG
Bus factor for World
Count
Percentage
Percentage in 2018
Difference with previous year
-1
1
0.12
nan
nan
0
31
3.71
3.51
0.2
1
441
52.81
52.83
-0.02
1.3
1
0.12
nan
nan
1.5
5
0.6
0.23
0.37
2
221
26.47
28.12
-1.65
3
70
8.38
8.05
0.33
3.5
1
0.12
nan
nan
4
18
2.16
3.29
-1.13
5
21
2.51
1.47
1.04
6
4
0.48
0.68
-0.2
7
1
0.12
0.45
-0.33
8
2
0.24
0.11
0.13
10
8
0.96
0.34
0.62
18
1
0.12
nan
nan
20
2
0.24
0.11
0.13
50
2
0.24
0.11
0.13
100
2
0.24
nan
nan
1000
1
0.12
nan
nan
1e+10
1
0.12
nan
nan
1e+20
1
0.12
nan
nan
Download CSV
2022-08-22T11:23:01.392175
image/svg+xml
Matplotlib v3.5.2, https://matplotlib.org/
PNG SVG
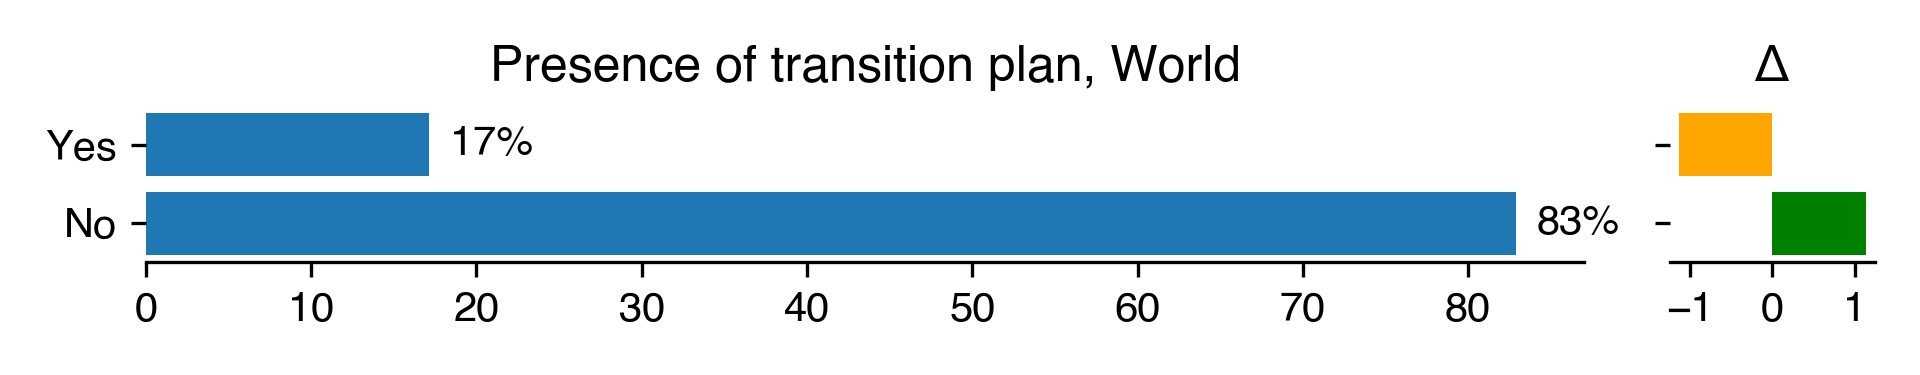
Presence of transition plan for World
Count
Percentage
Percentage in 2018
Difference with previous year
Yes
145
17.12
18.25
-1.13
No
702
82.88
81.75
1.13
Download CSV
2022-08-22T11:23:01.765819
image/svg+xml
Matplotlib v3.5.2, https://matplotlib.org/
PNG SVG
Use of version control for World
Count
Percentage
Percentage in 2018
Difference with previous year
Git
814
81.64
82.81
-1.17
SVN
70
7.02
22.41
-15.39
None
30
3.01
3.82
-0.81
Mercurial
10
1
5.53
-4.52
CVS
9
0.9
4.12
-3.22
Download CSV
2022-08-22T11:23:02.142885
image/svg+xml
Matplotlib v3.5.2, https://matplotlib.org/
PNG SVG
Testing strategies for World
Count
Percentage
Percentage in 2018
Difference with previous year
No formal testing
111
11.13
10.85
0.28
No formal testing but users provide feedback
238
23.87
31.06
-7.18
The developers do their own testing
599
60.08
77.99
-17.91
Test engineers conduct testing
34
3.41
4.82
-1.41
Automated testing with continuous integration
502
50.35
0
50.35
Don’t know
10
1
0
1
Download CSV
2022-08-22T11:23:02.585712
image/svg+xml
Matplotlib v3.5.2, https://matplotlib.org/
PNG SVG
2022-08-22T11:23:04.050381
image/svg+xml
Matplotlib v3.5.2, https://matplotlib.org/
PNG SVG