Australia Canada Germany Netherlands New Zealand South Africa United Kingdom United States World
RSEs is an hybrid role between a researcher and a software developer. We
investigated both of these aspects concerning publication and dissemination of
their work, one on the traditional aspect of it (publications and conference)
and, as developed here, on the more software aspect (open source and DOI).
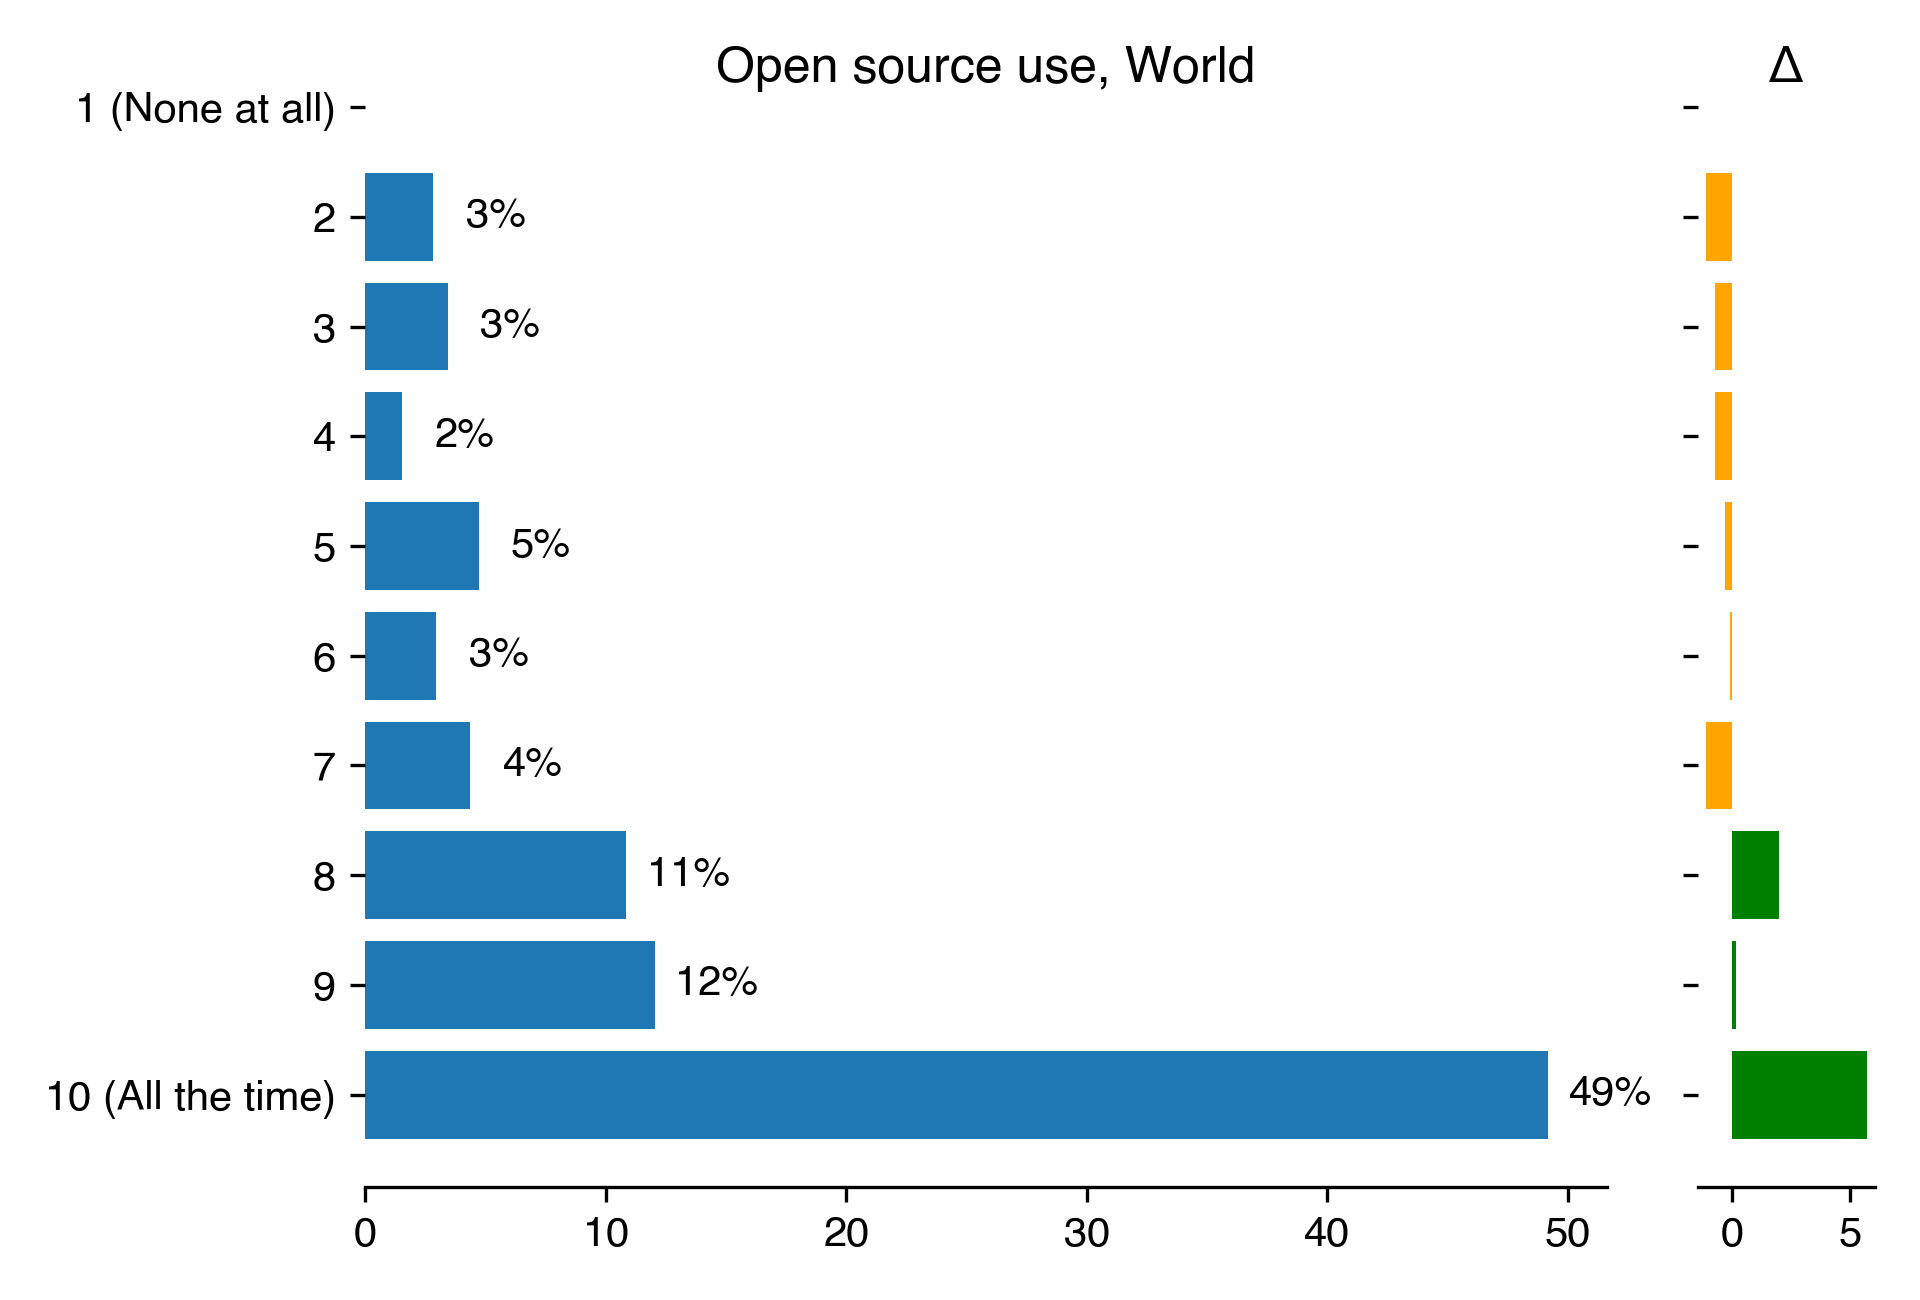
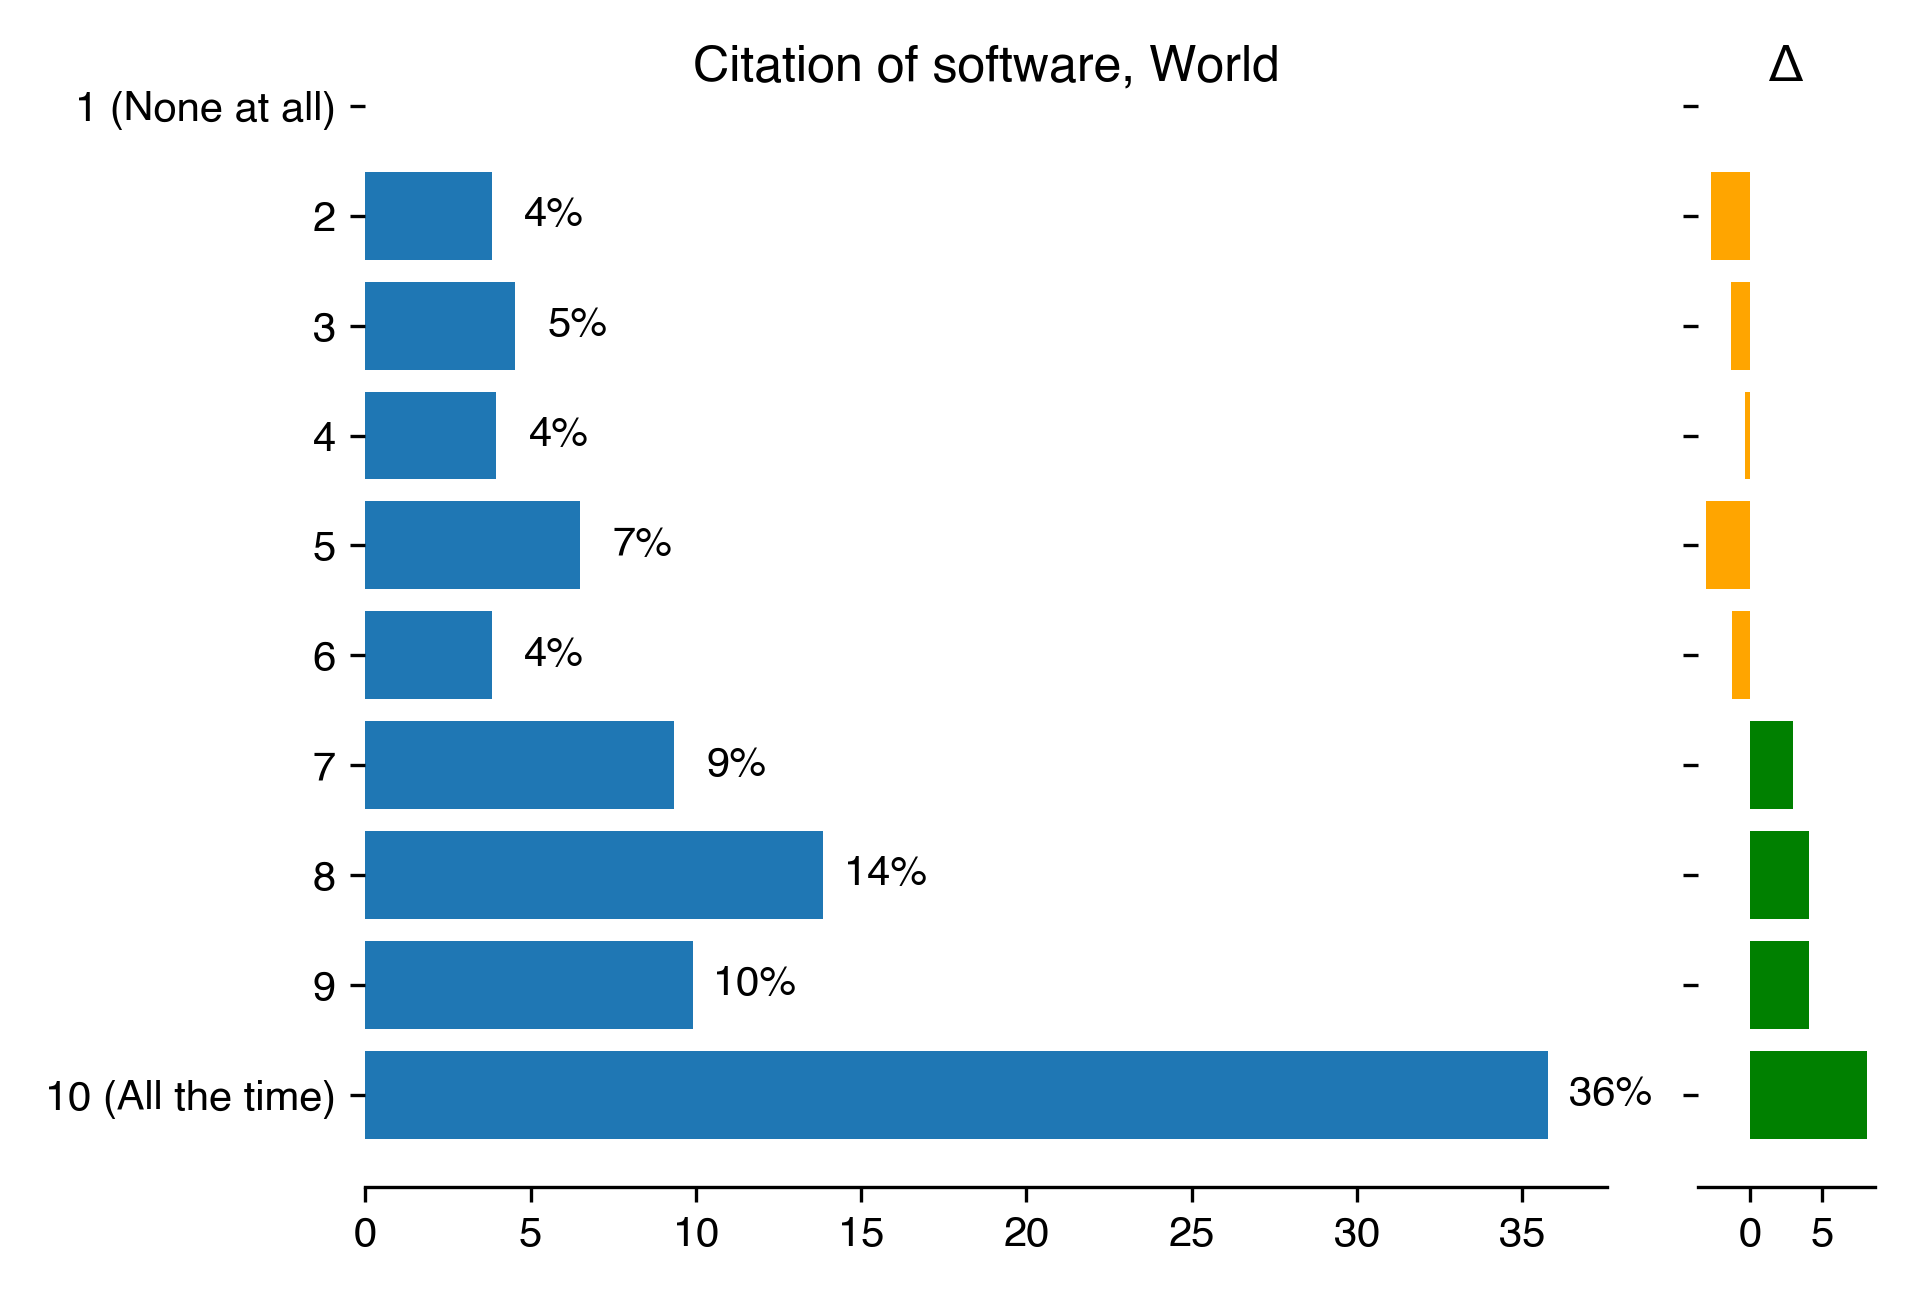
We asked the participants if they have ever released their work under open
source licence but also questions about the referencing system. We asked them
how often they reference software, and if they use DOI for it, and which tools
for it.
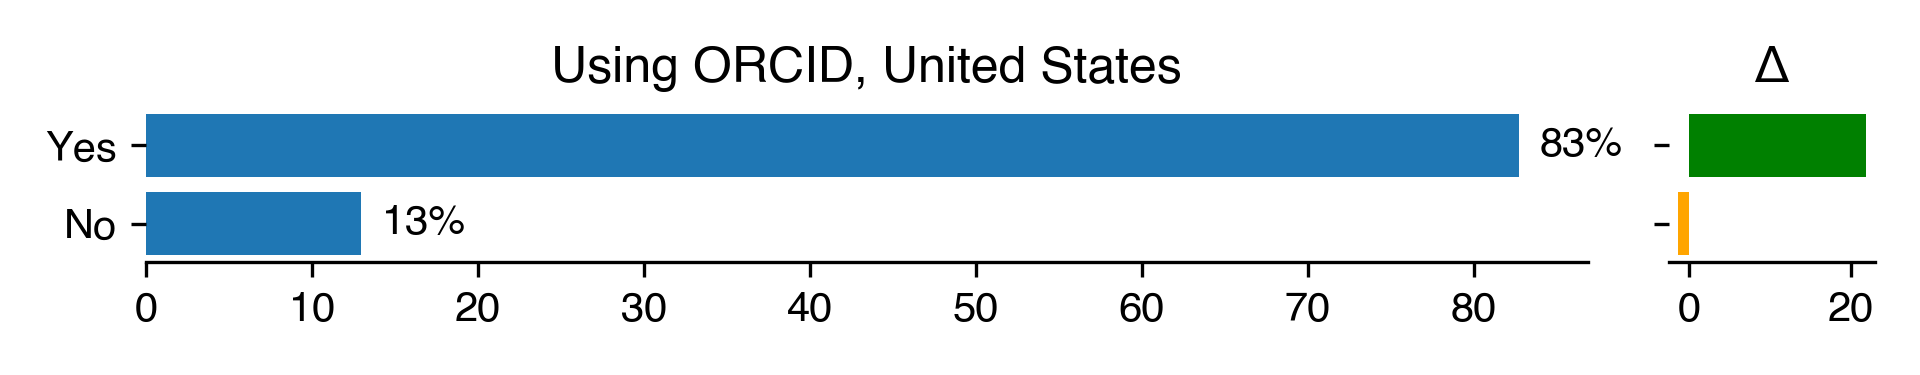
We also asked them if they have an ORCID ID, a system that gives a unique
reference ID for the researcher.
Questions in this section:
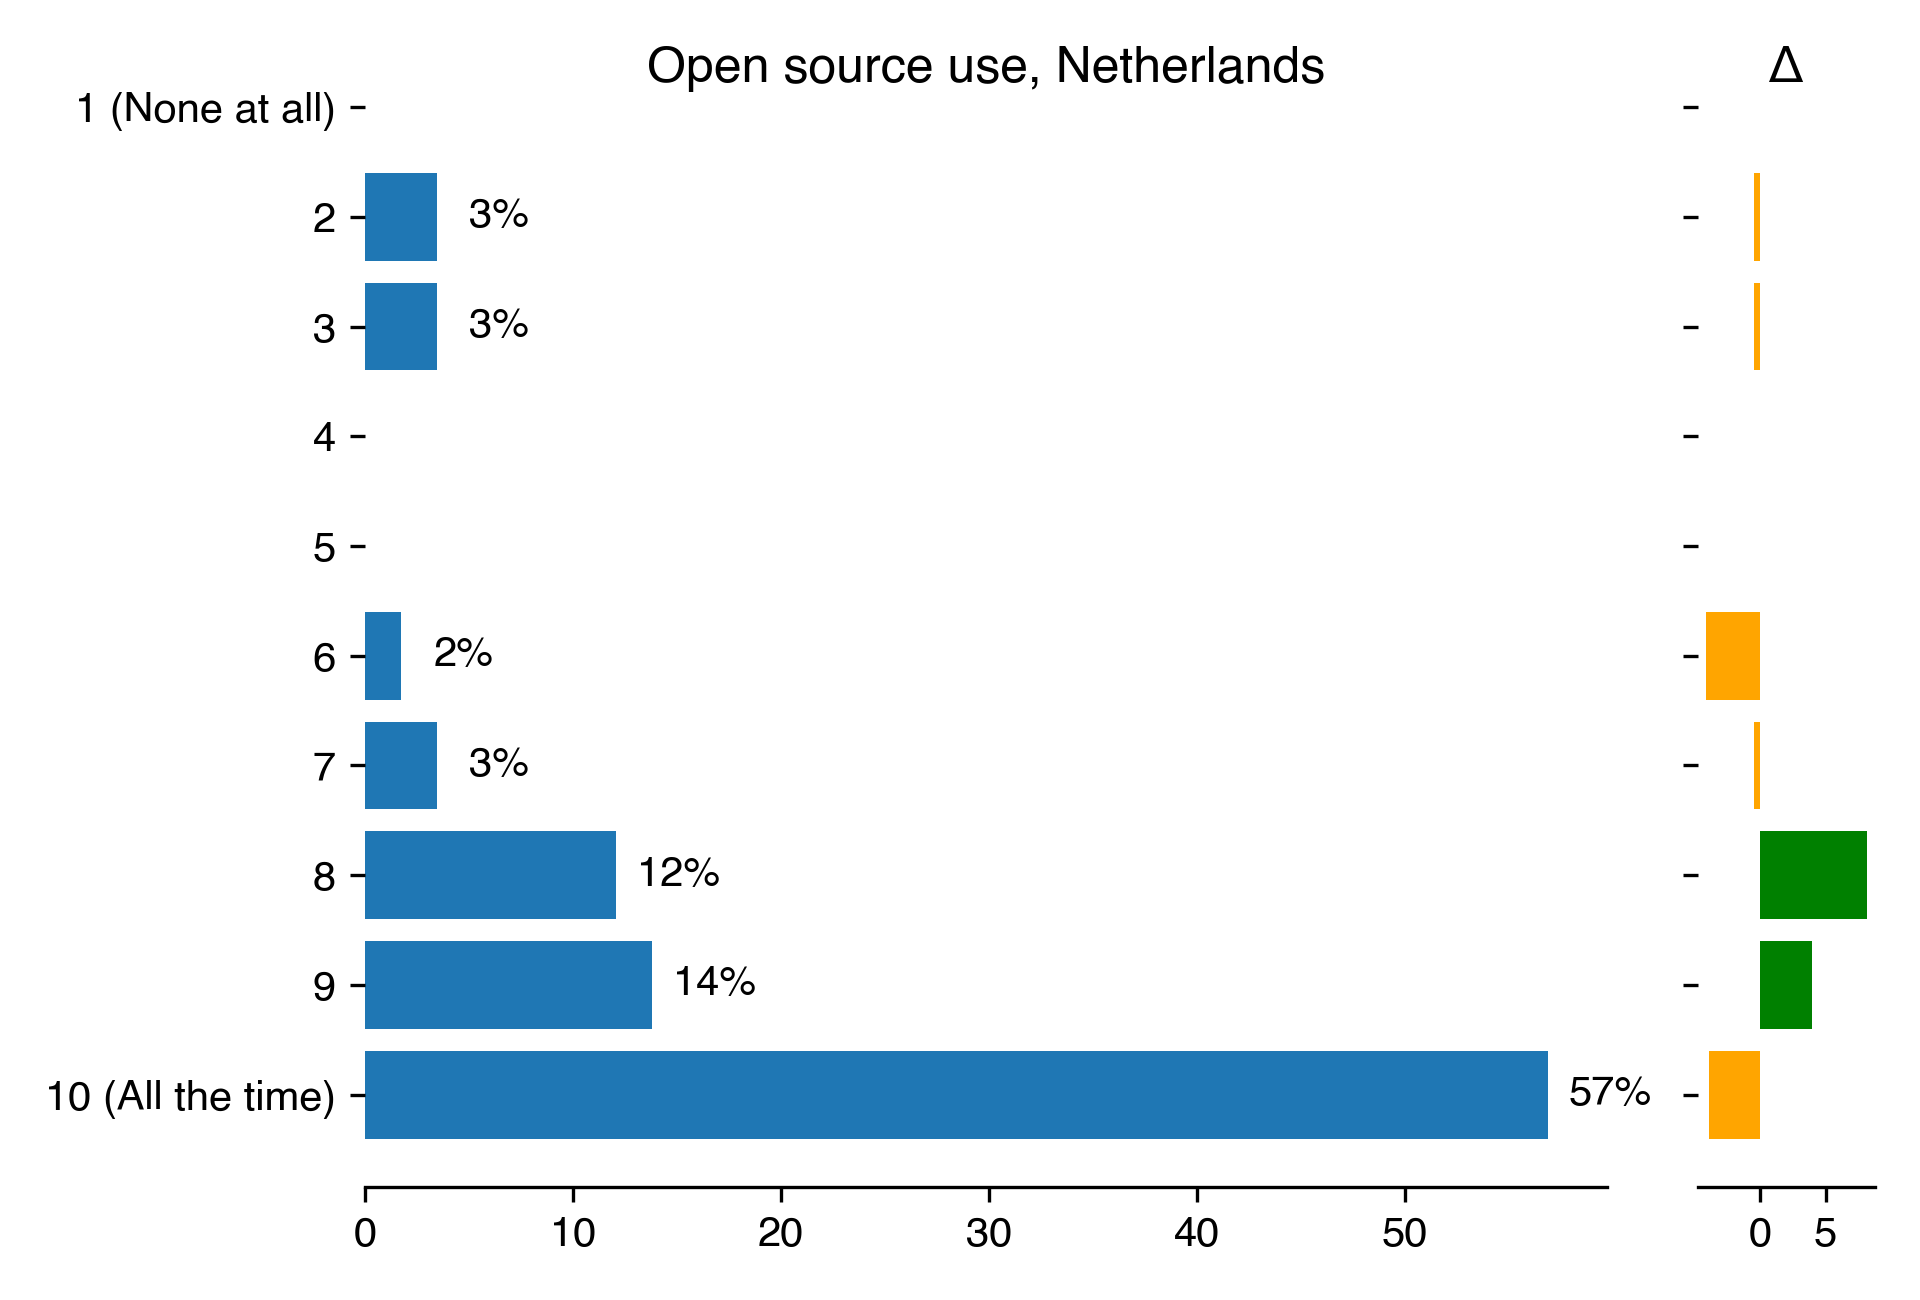
How often do you use an open-source licence for your software? (likert scale)
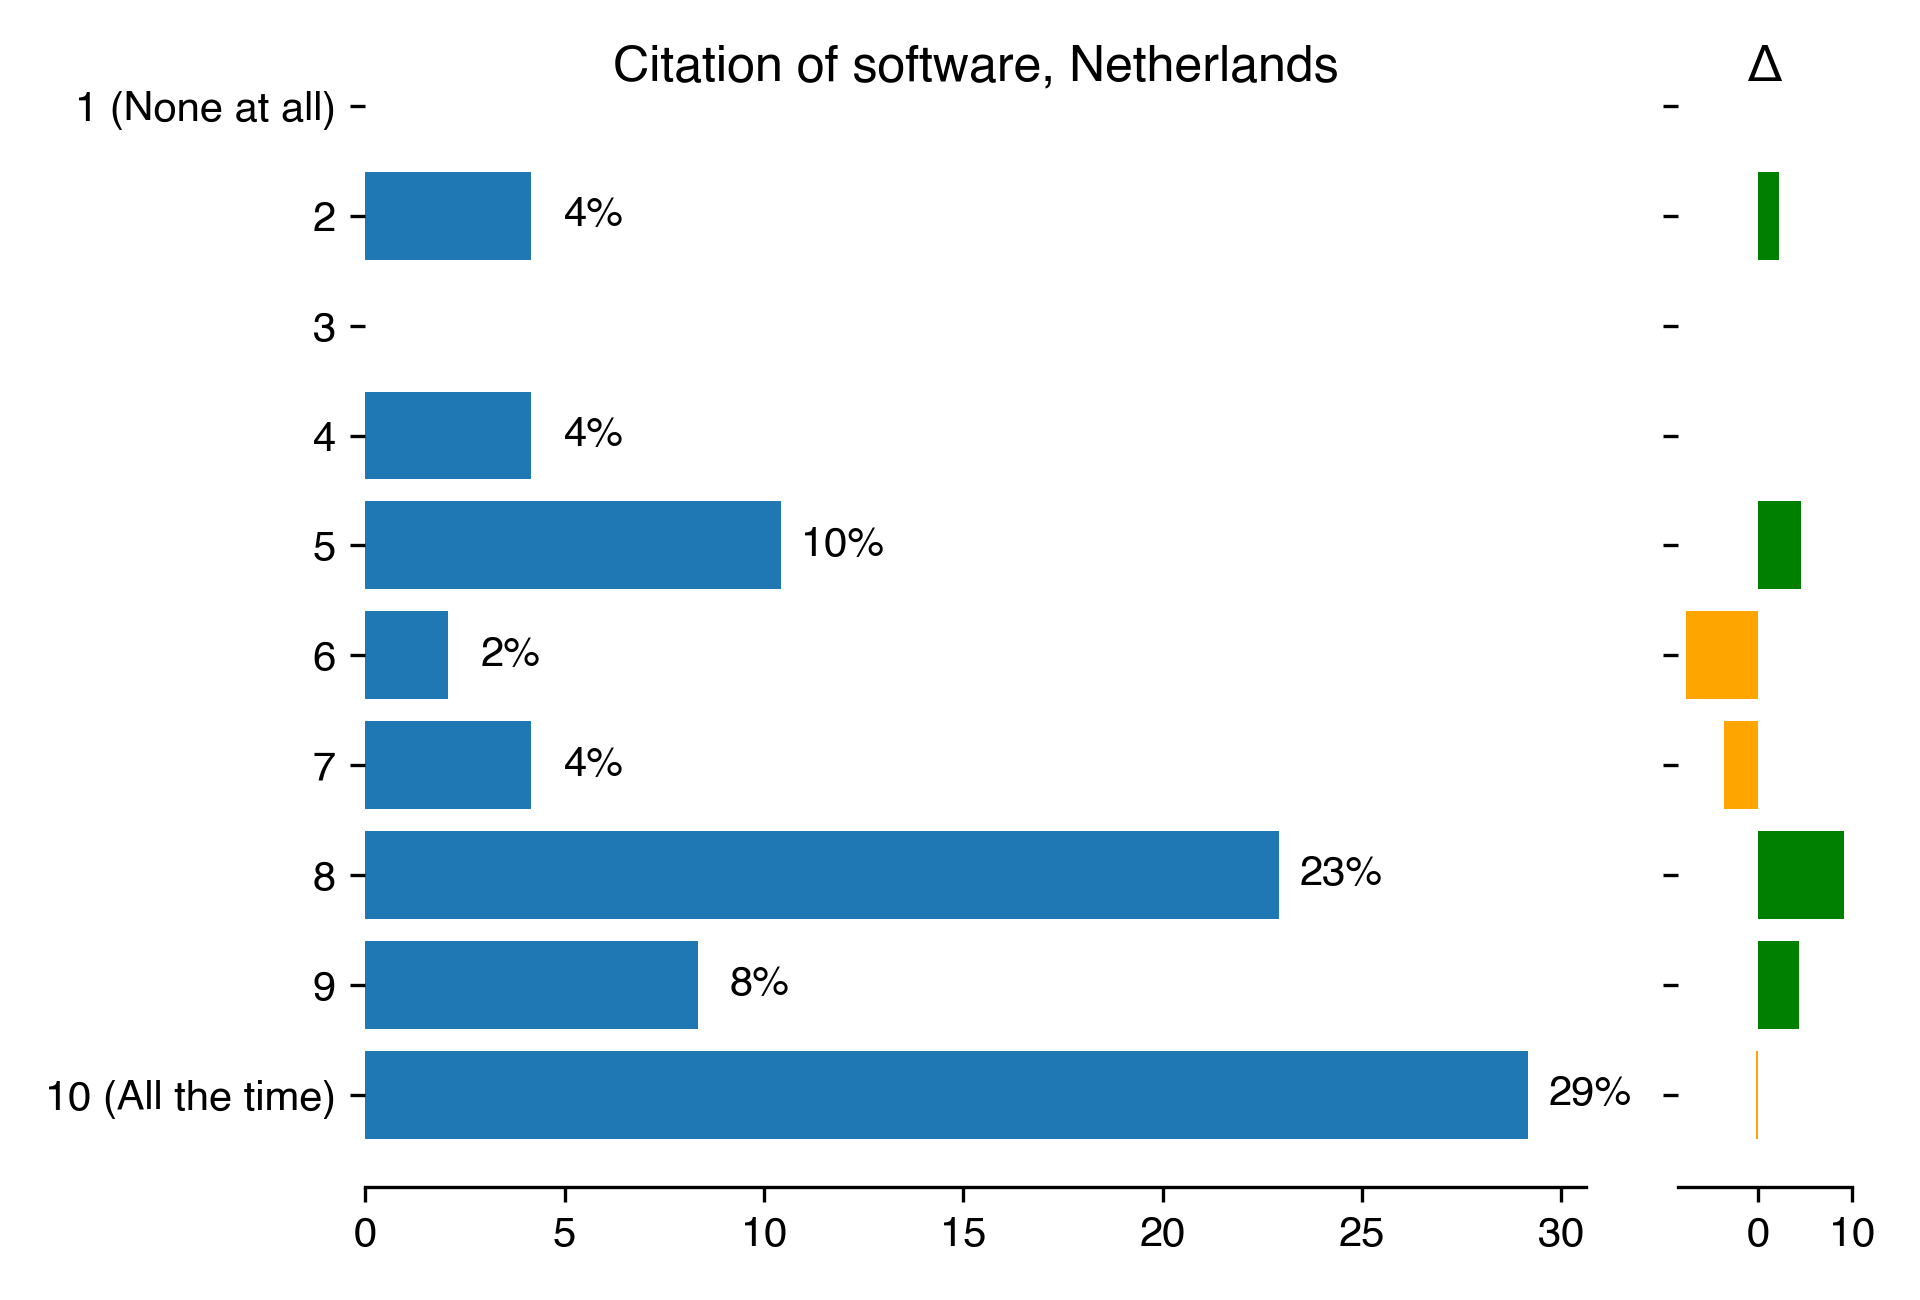
How often do you reference software directly or the papers describing the software? (likert scale)
How often do you associate your software with a Digital Object Identifier (DOI)? (likert scale)
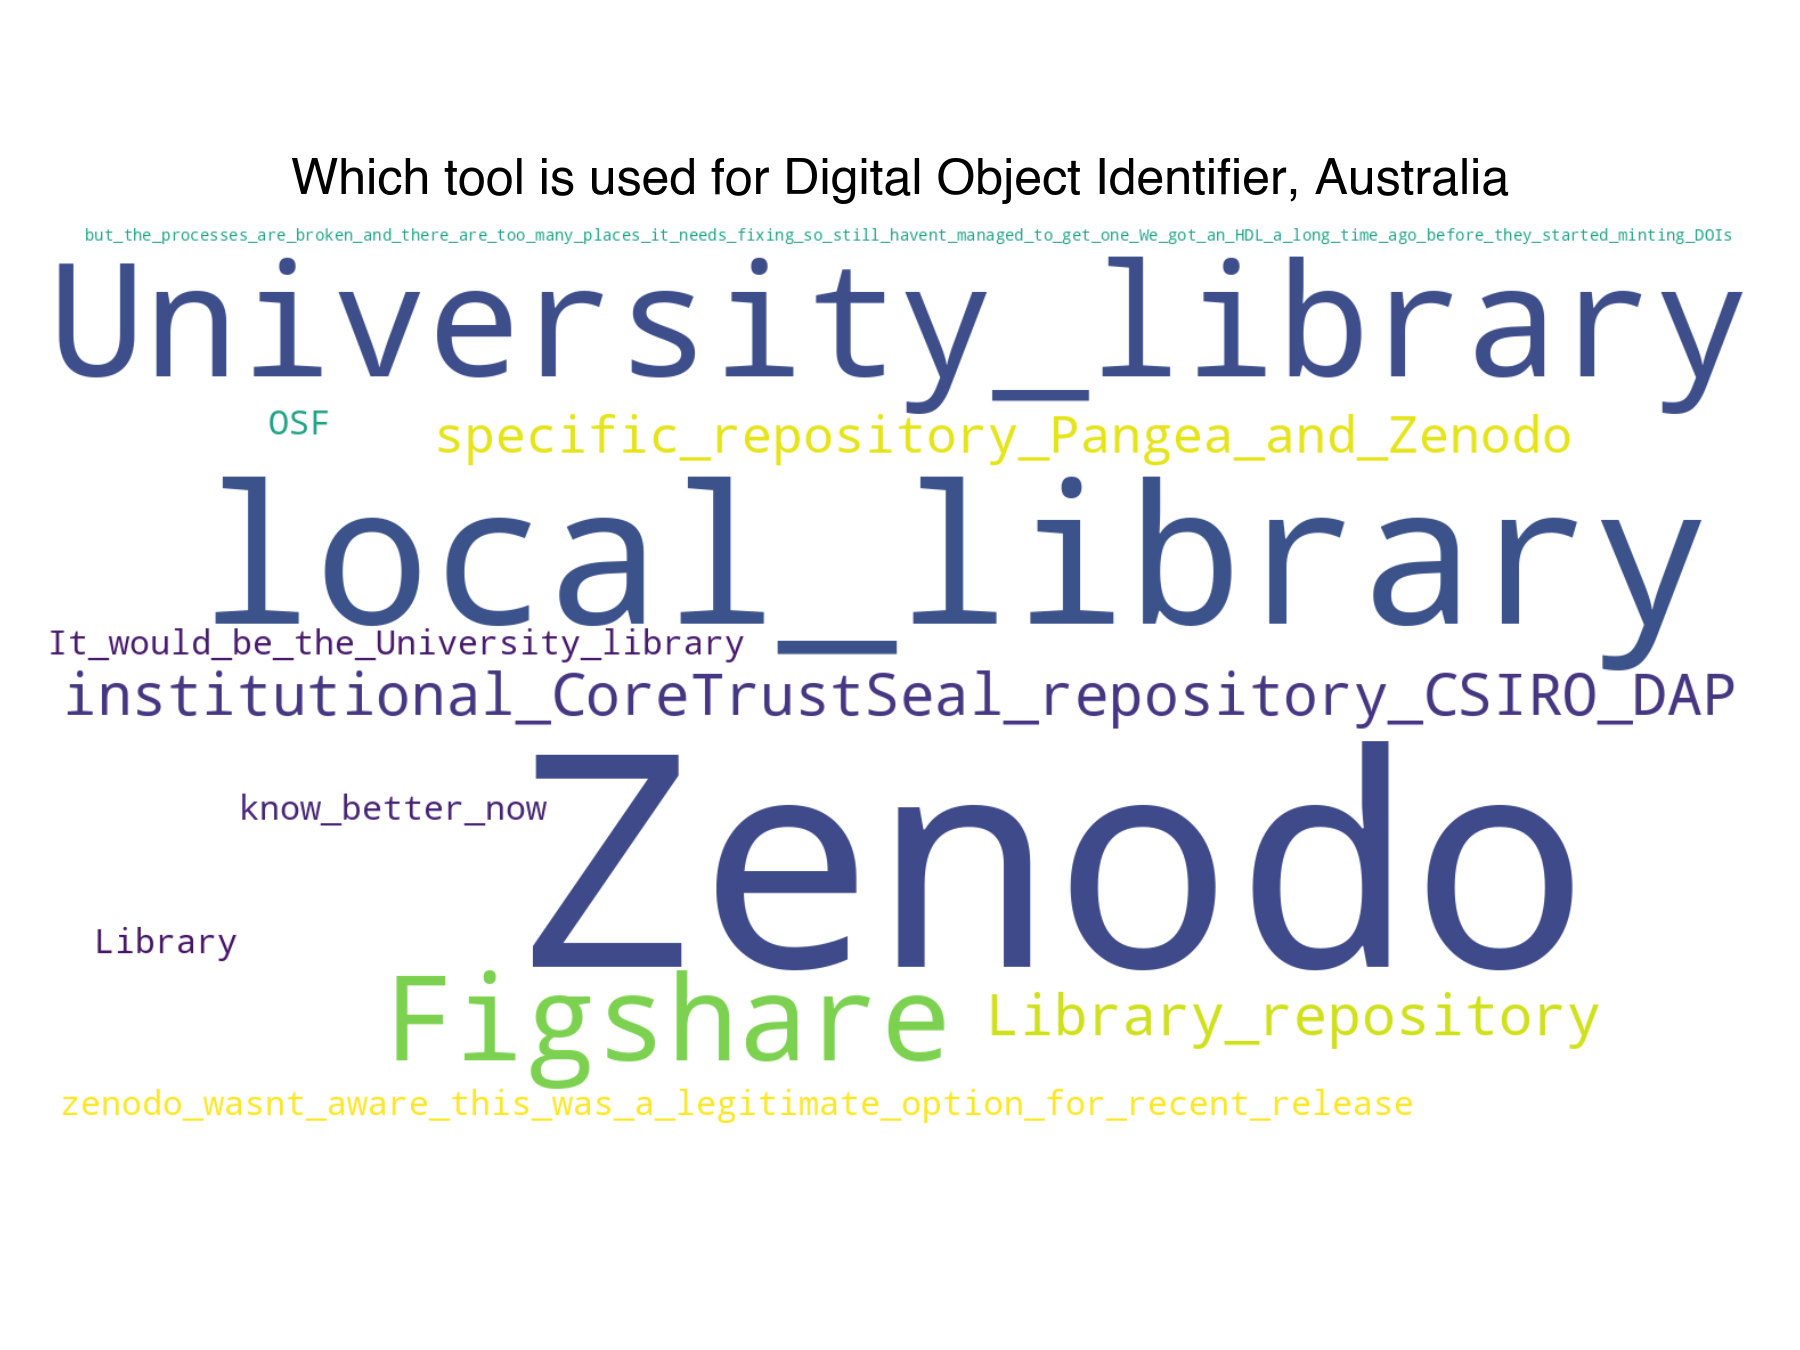
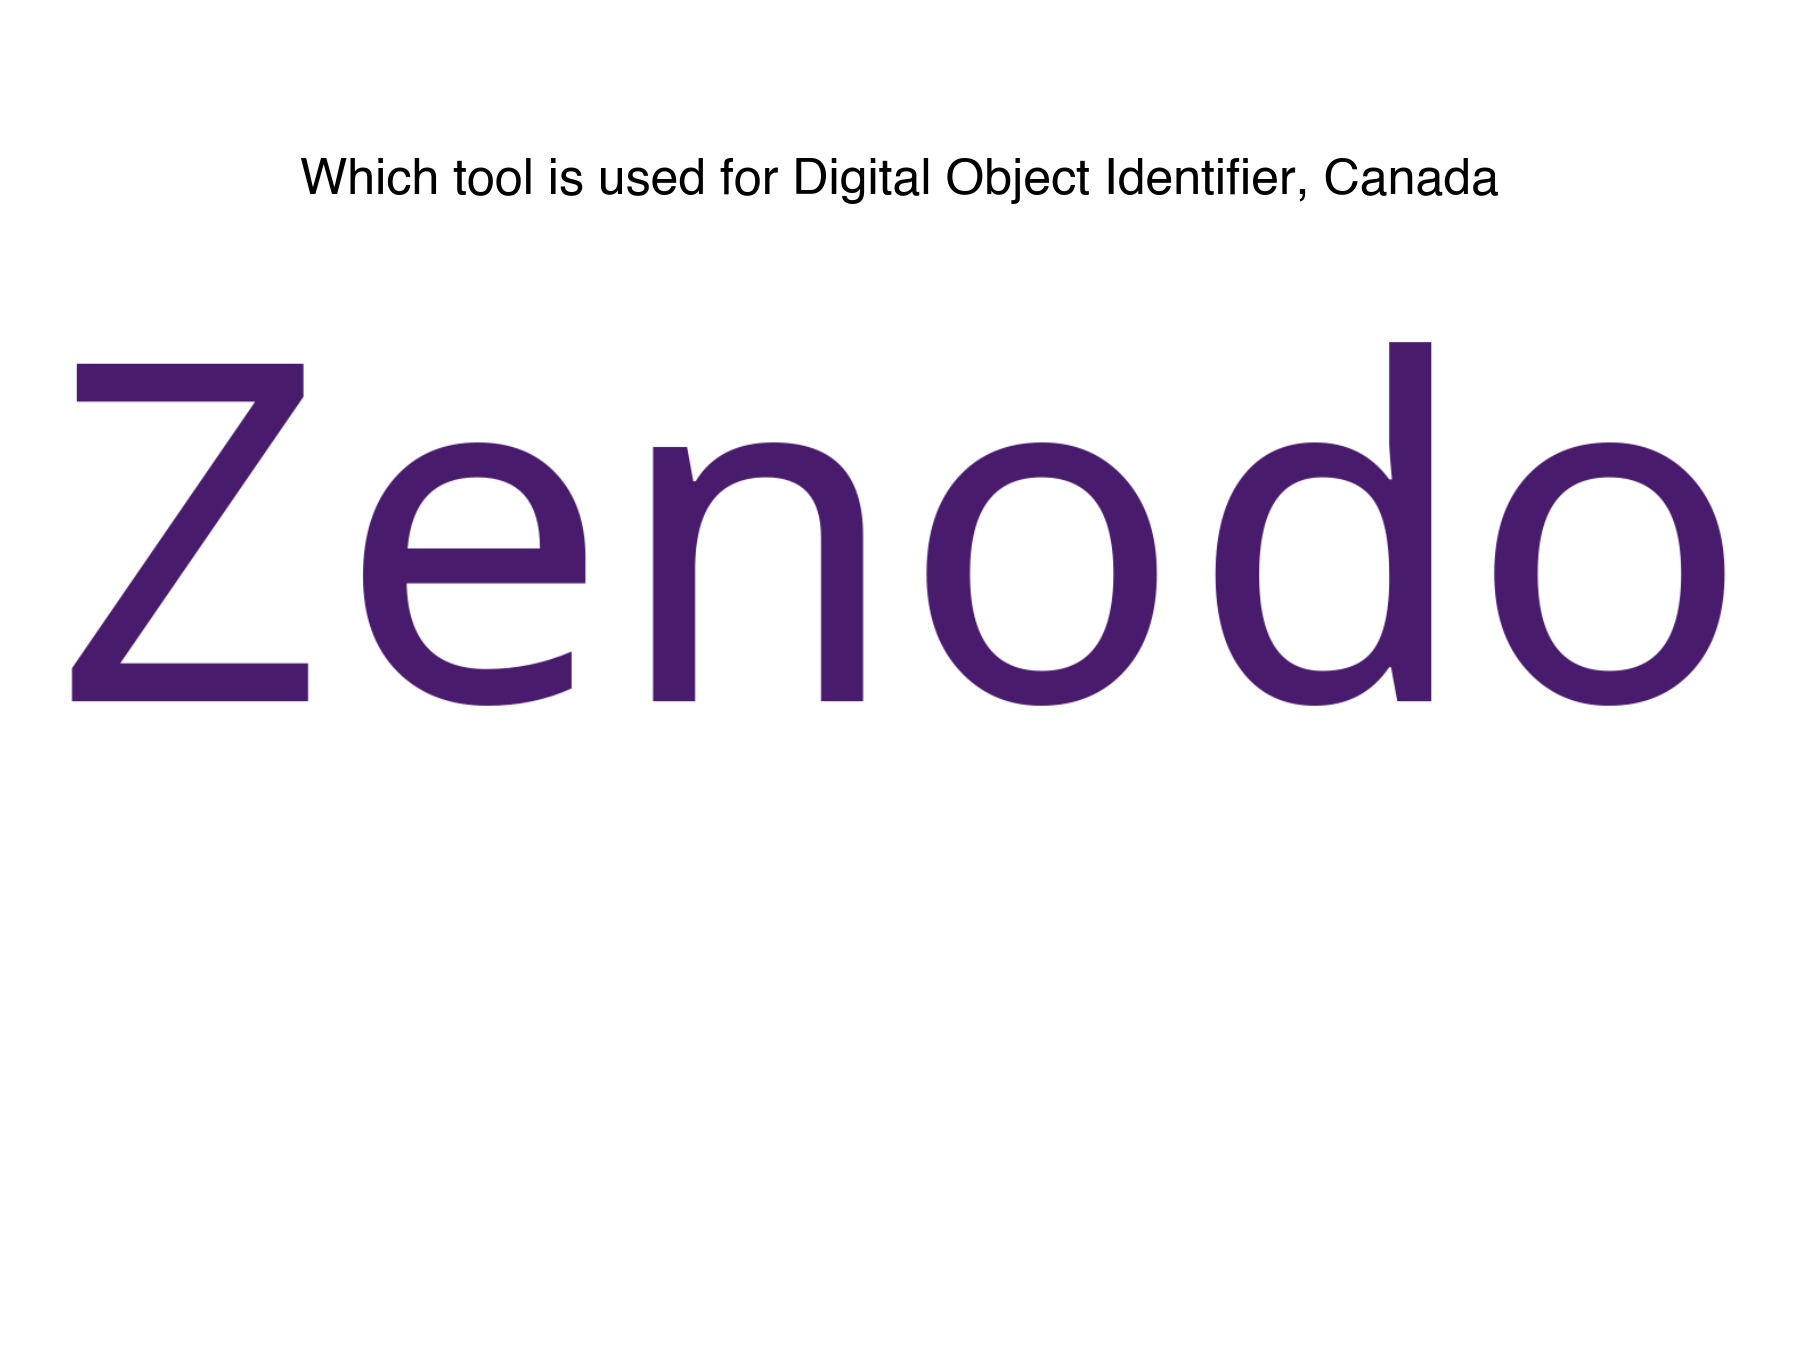
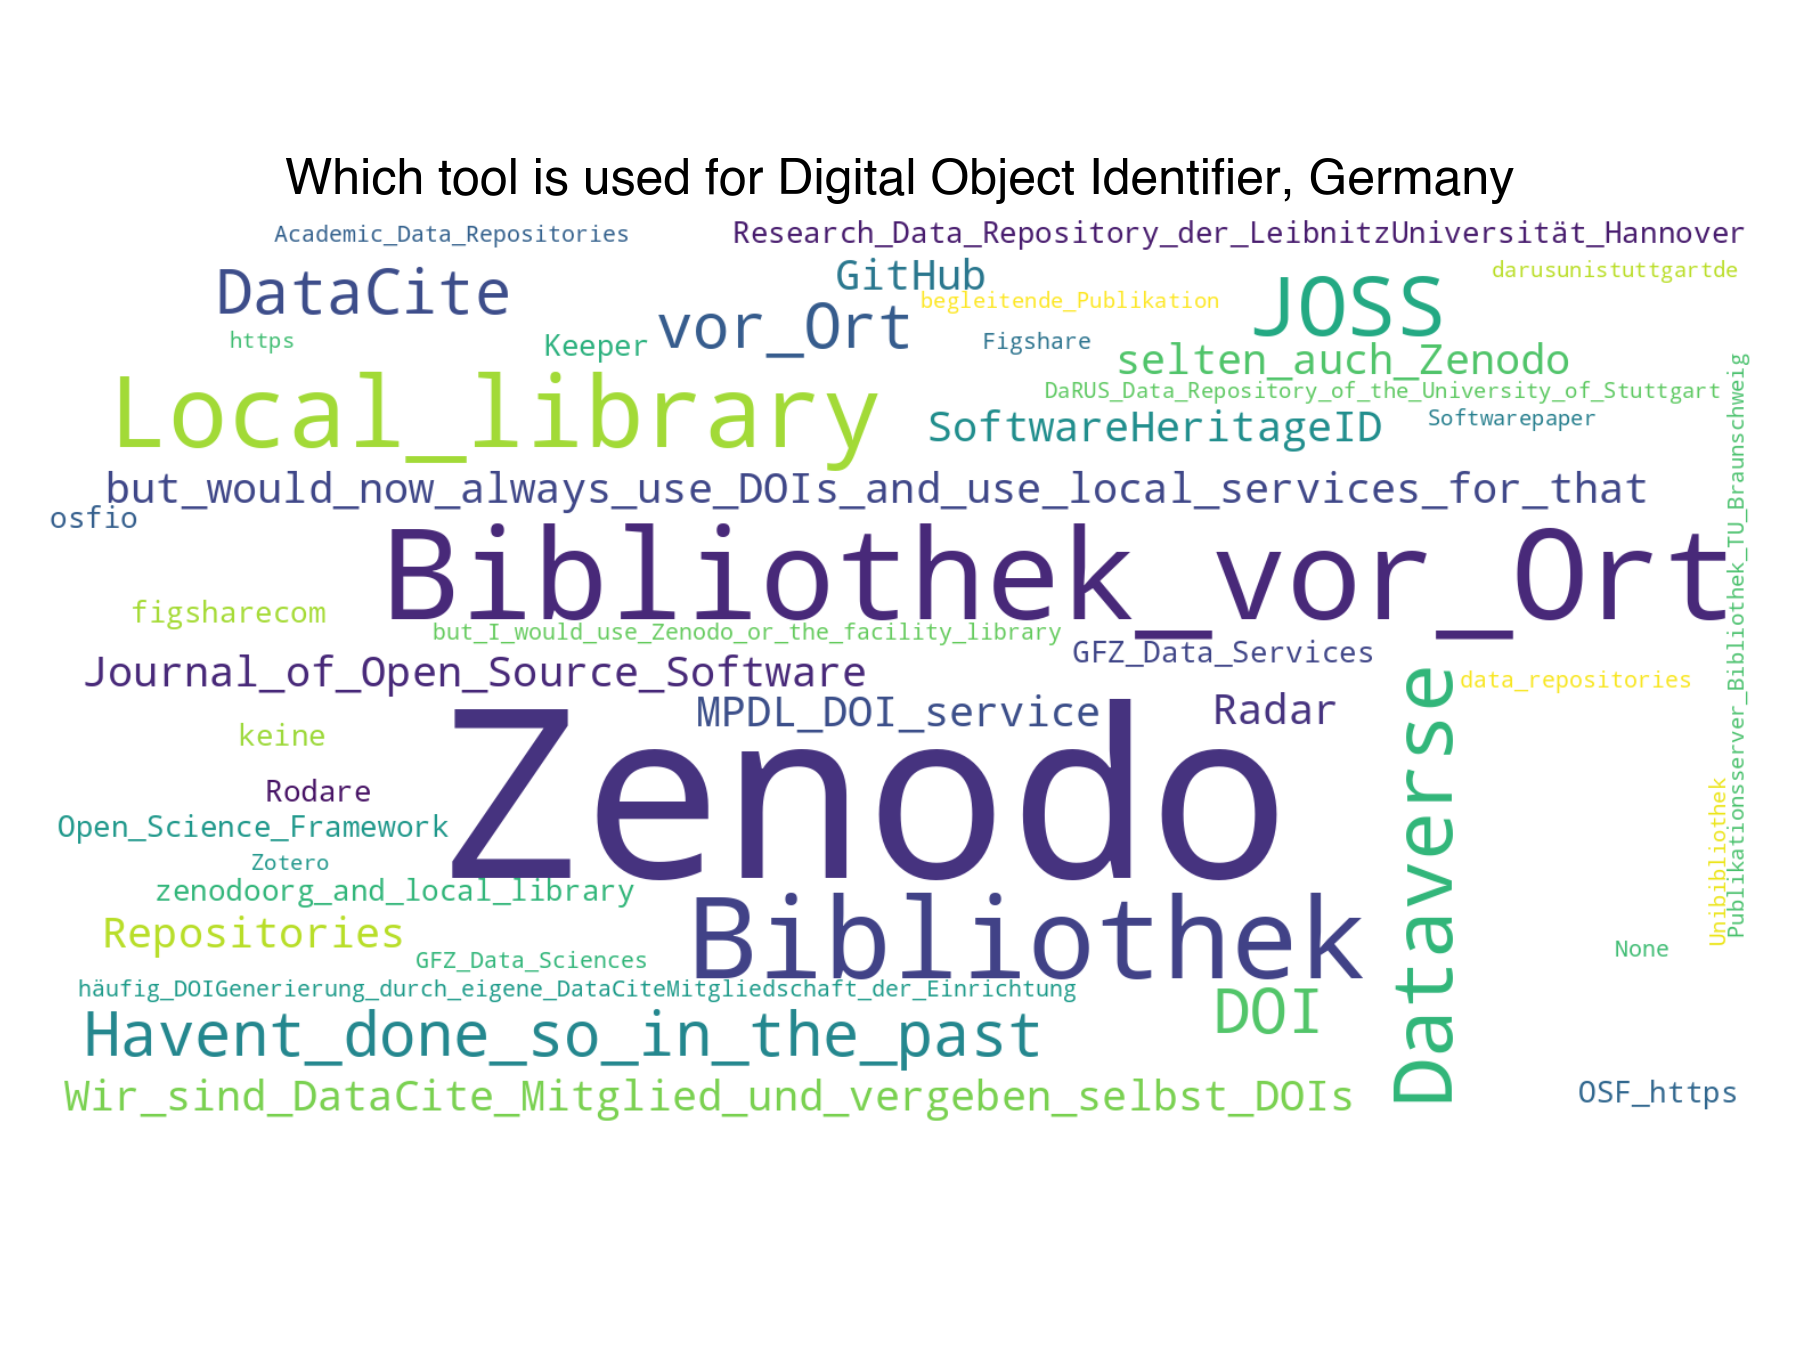
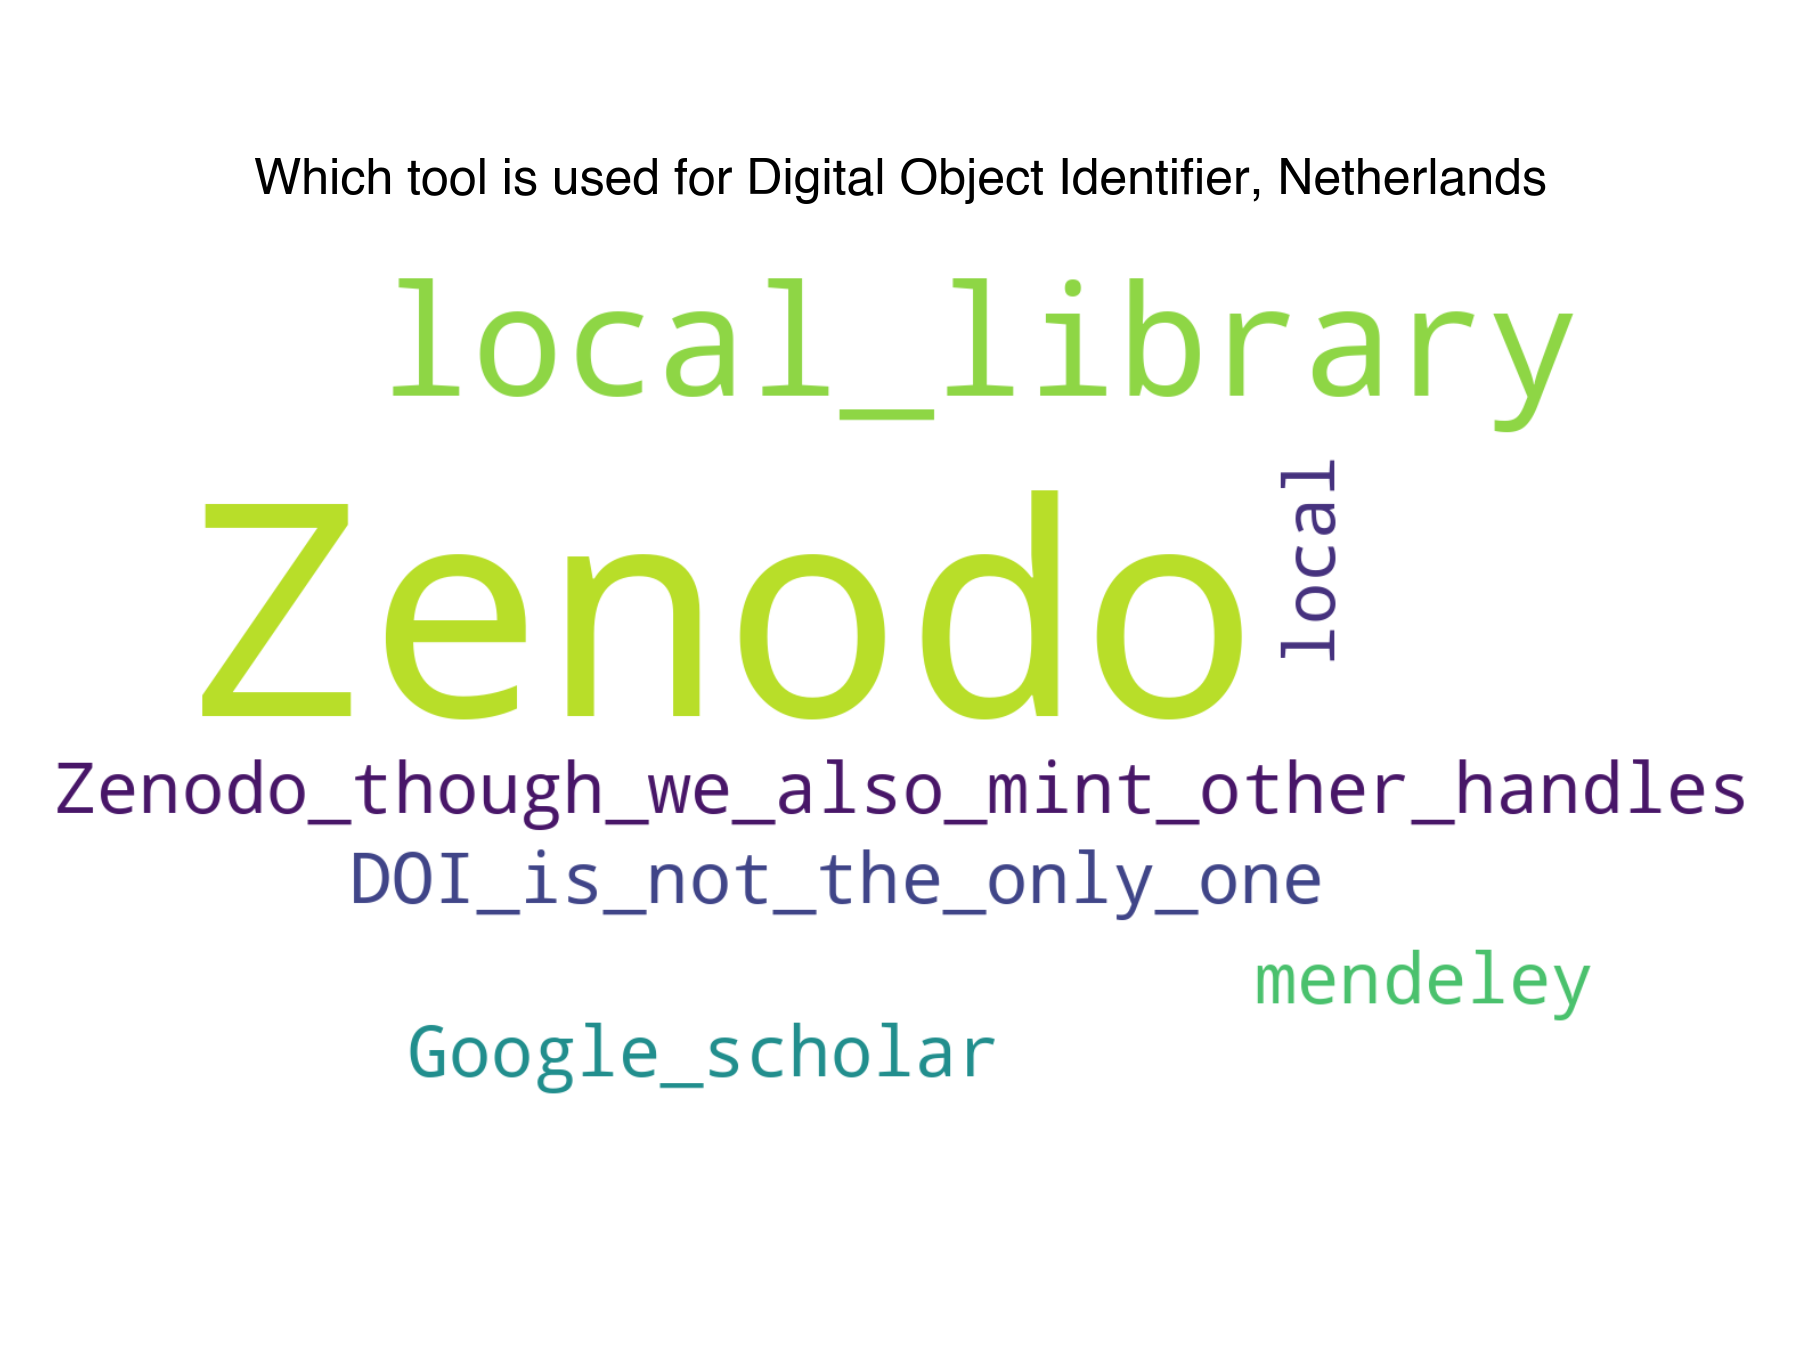
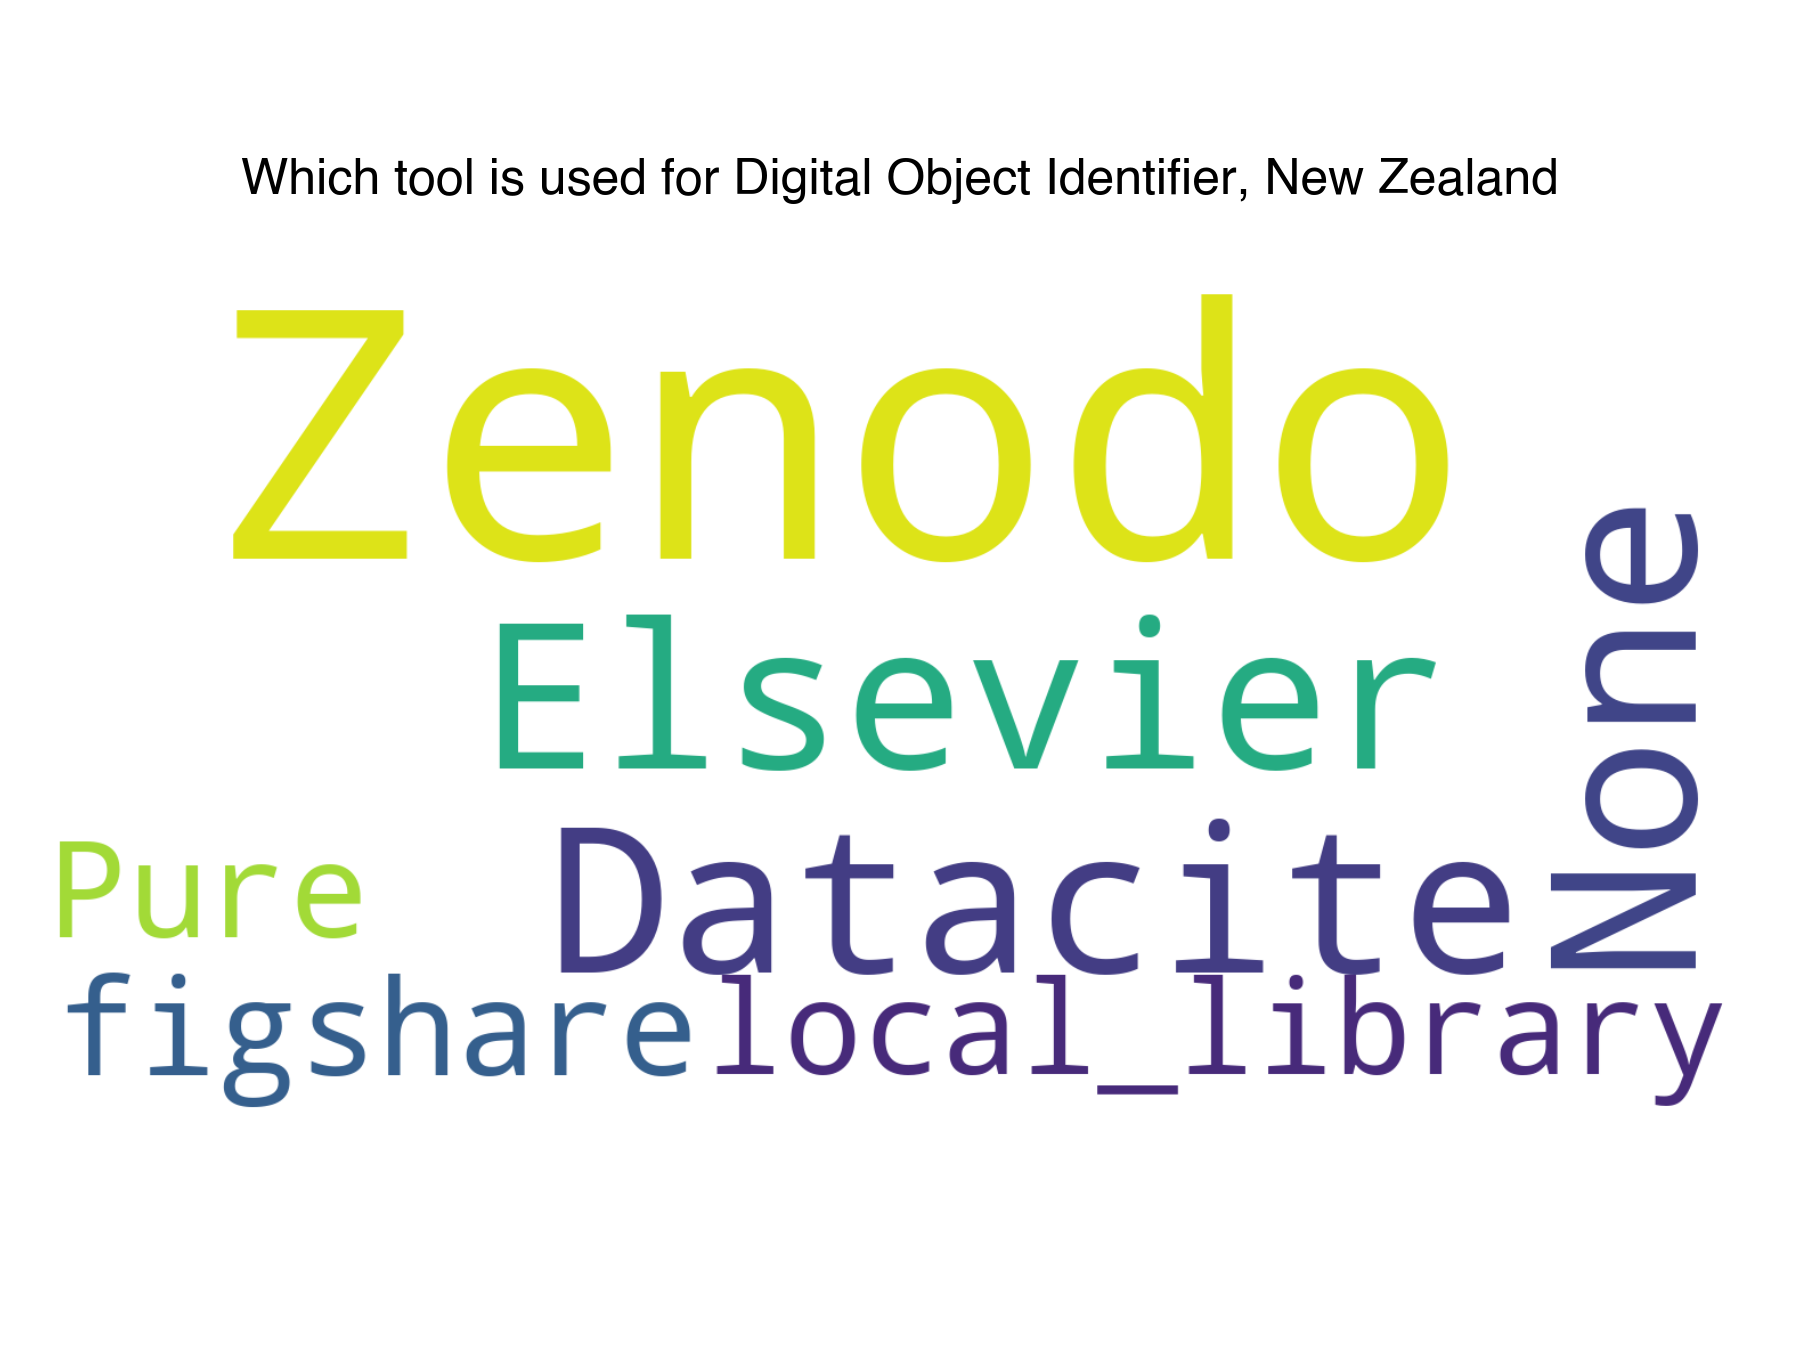
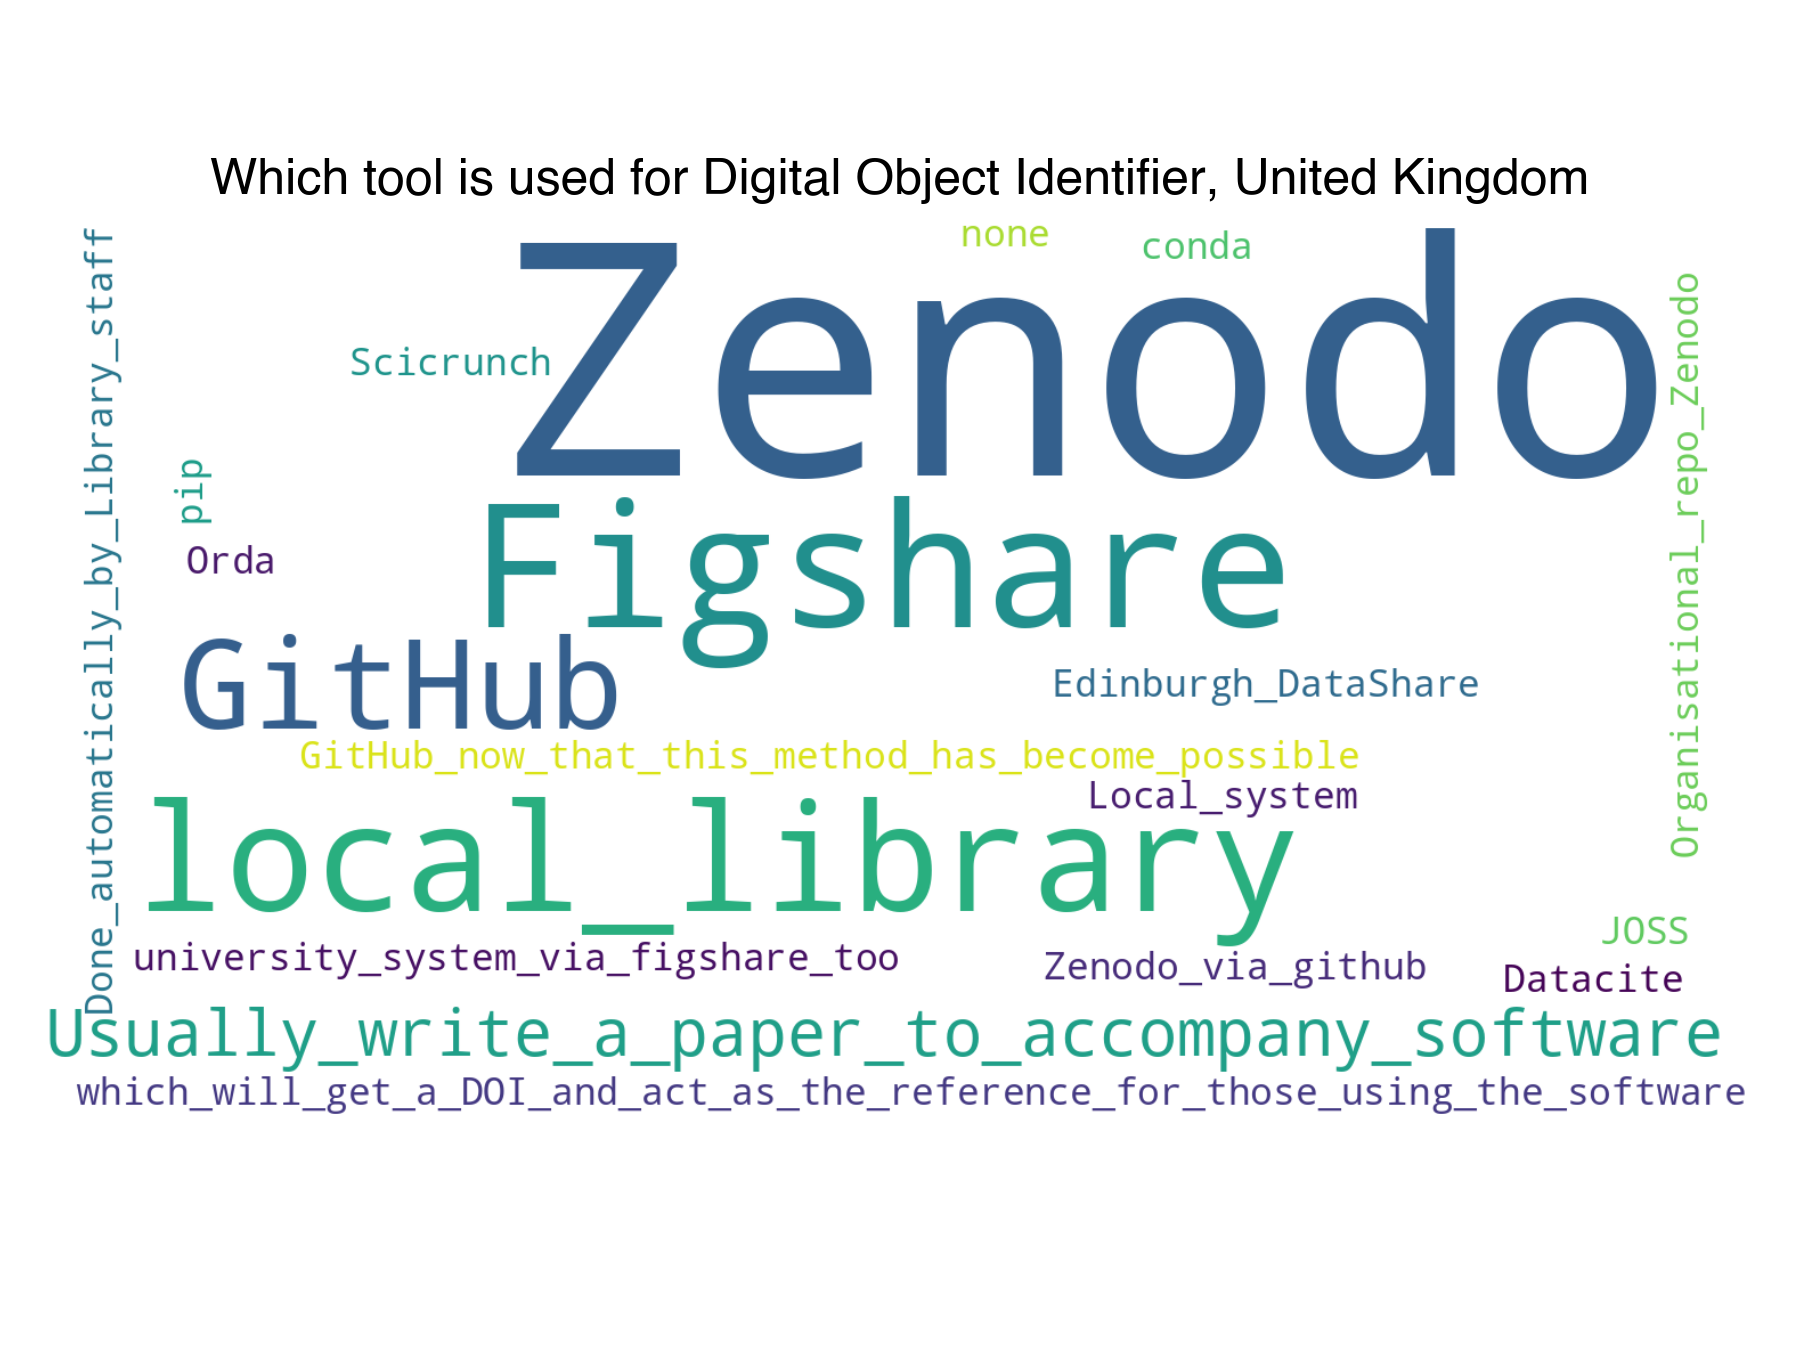
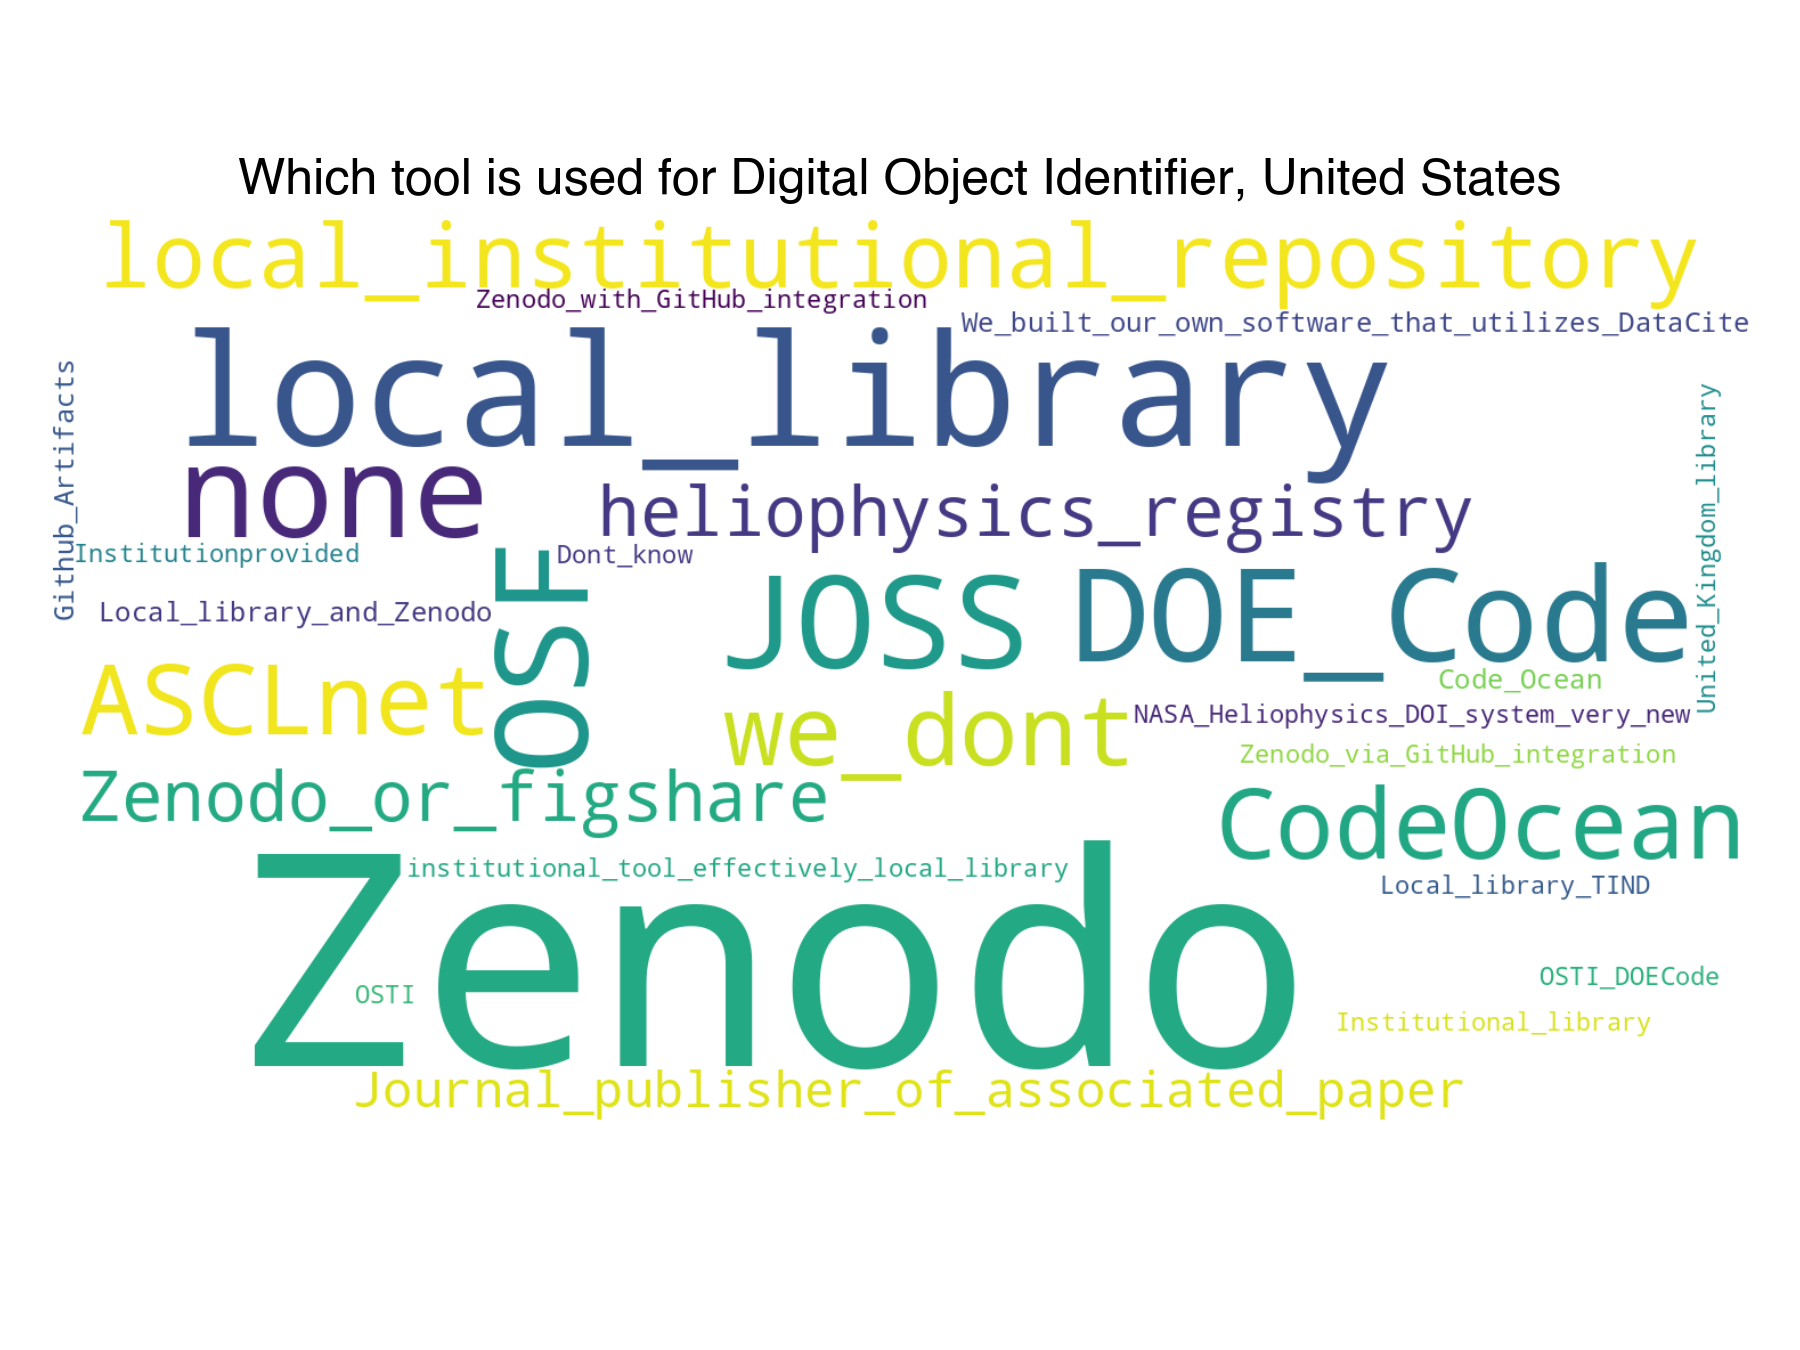
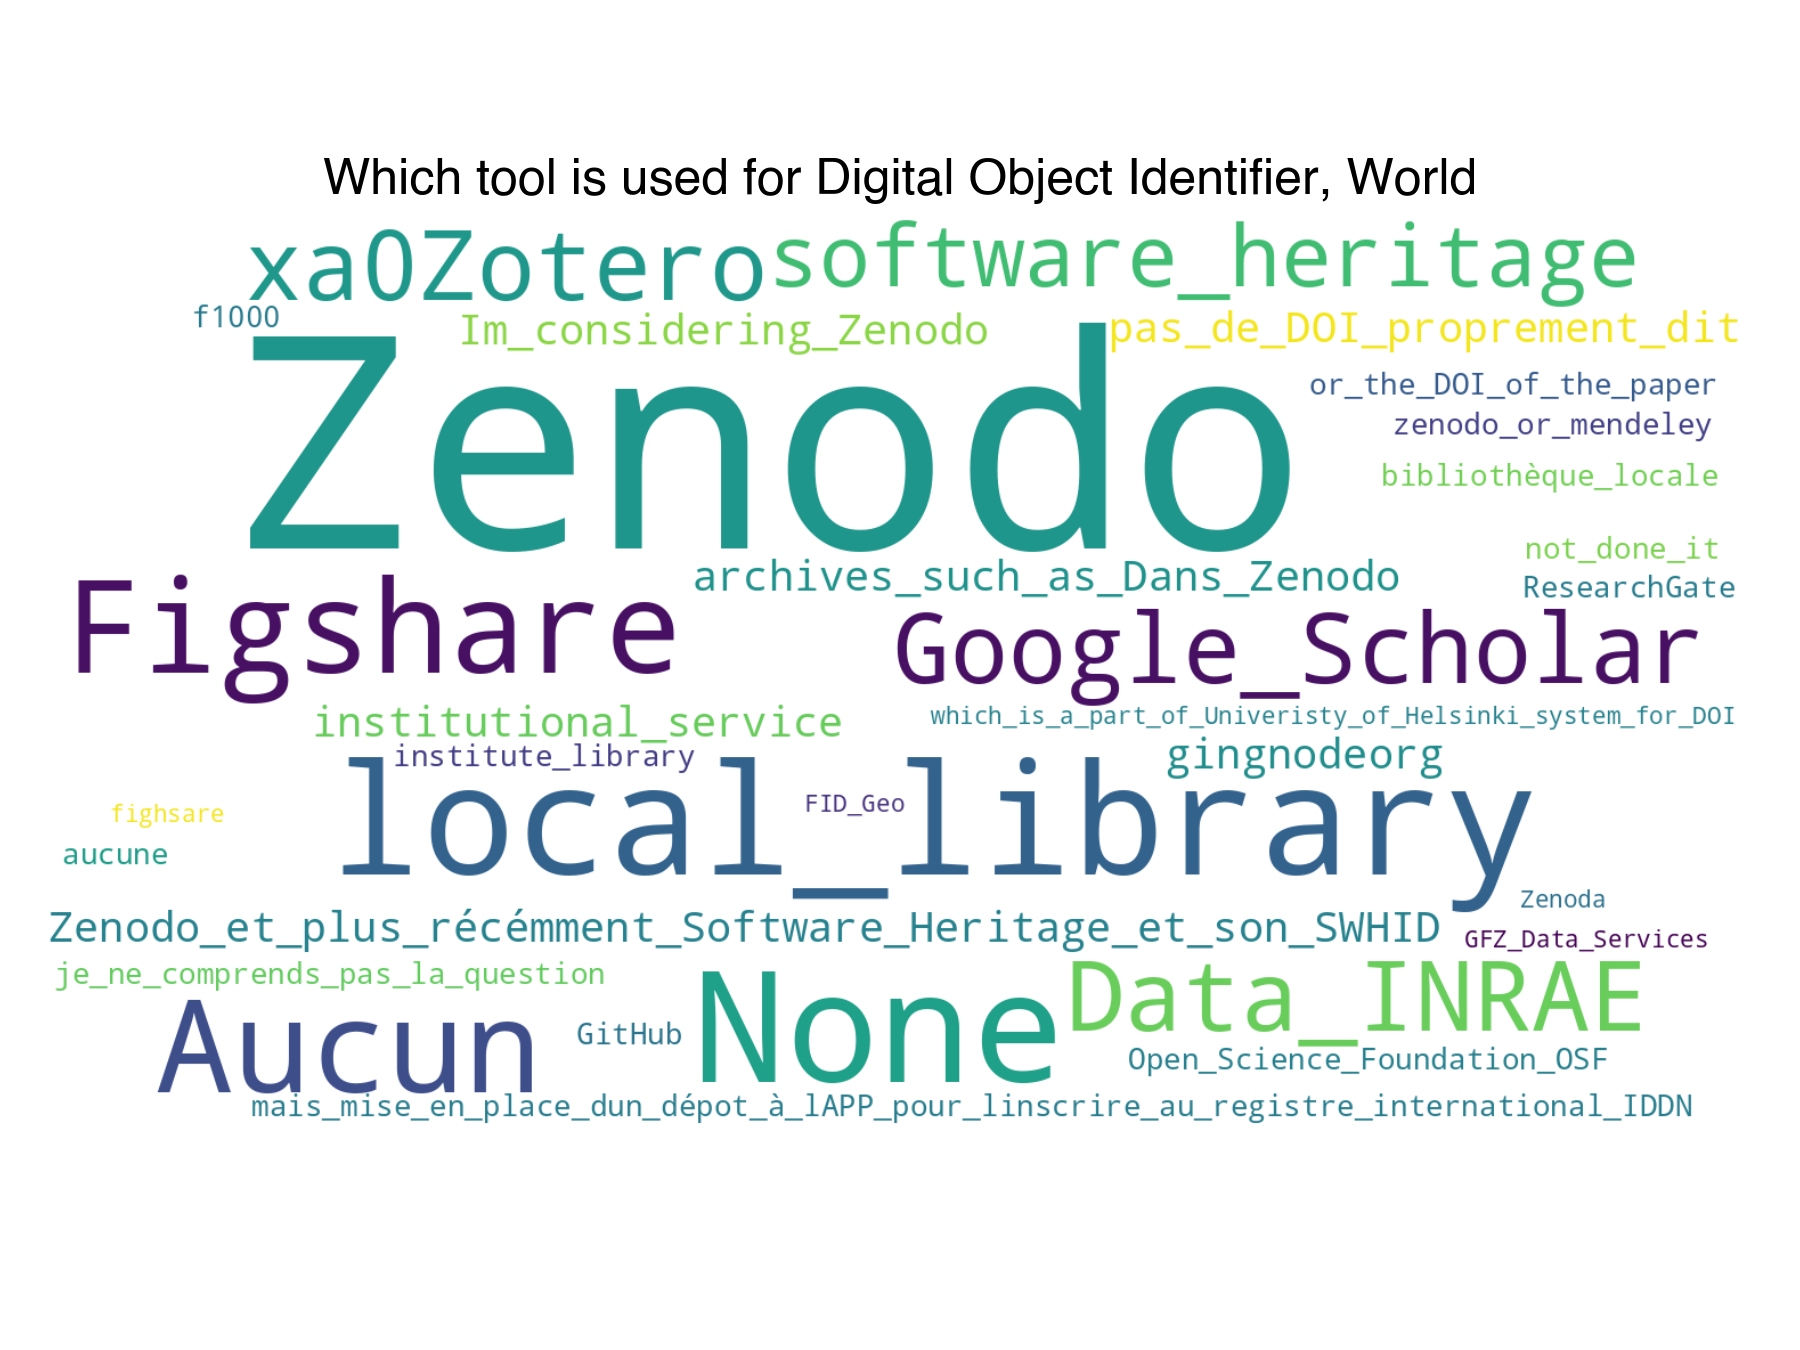
Which tools do you use to mint a DOI (e.g. local library, Zenodo)? (free text)
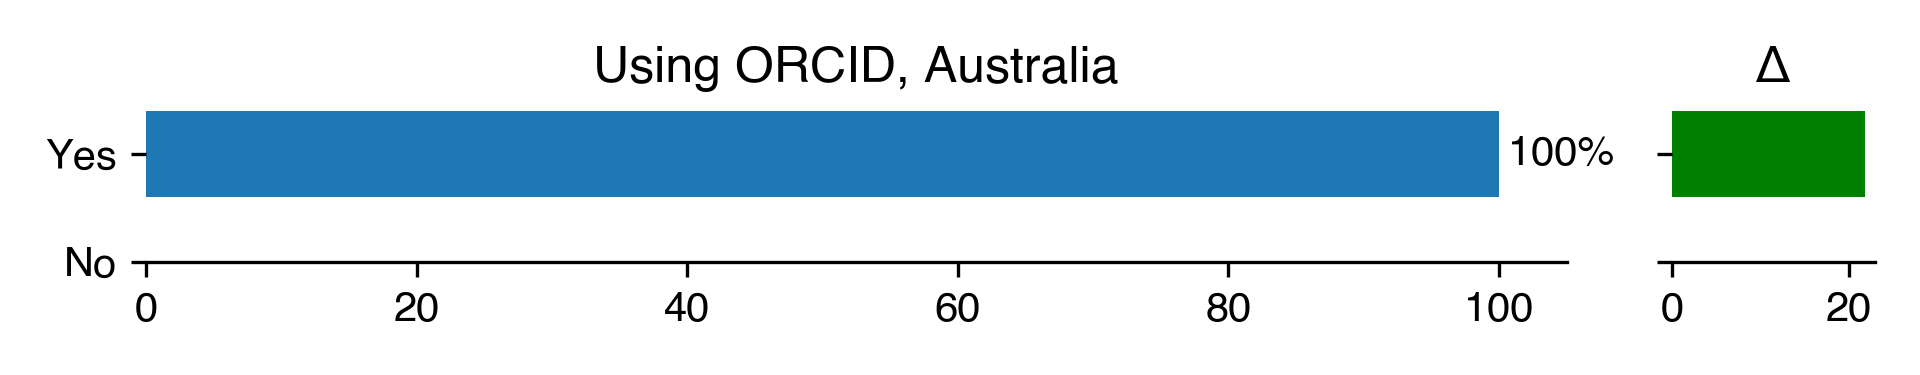
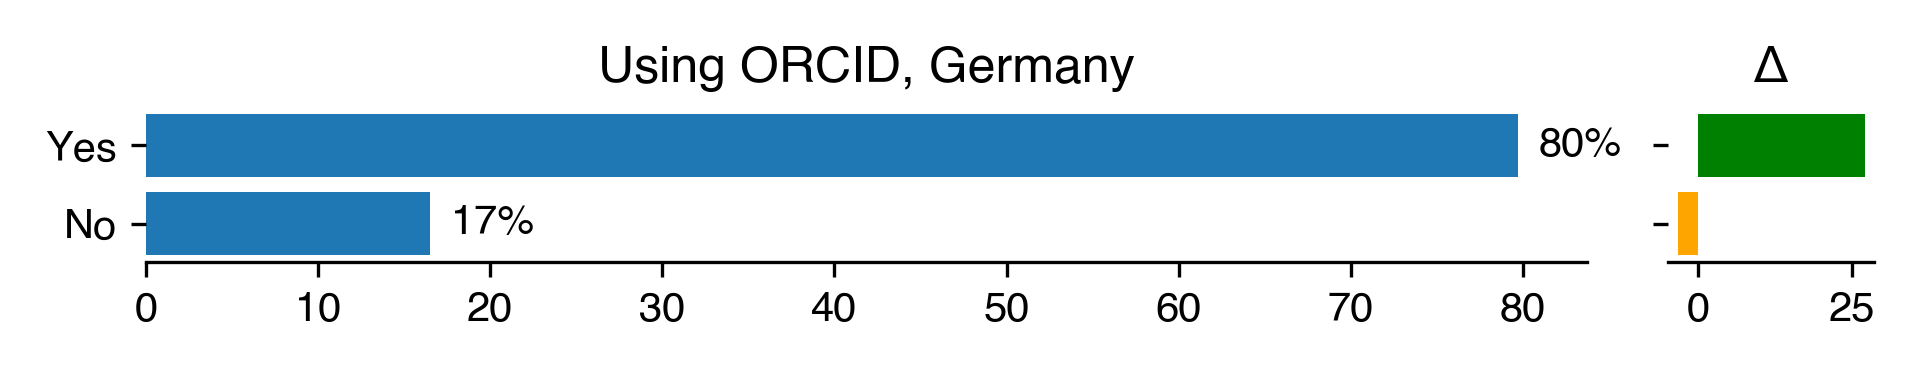
Do you have an ORCID ID? (yes-no)
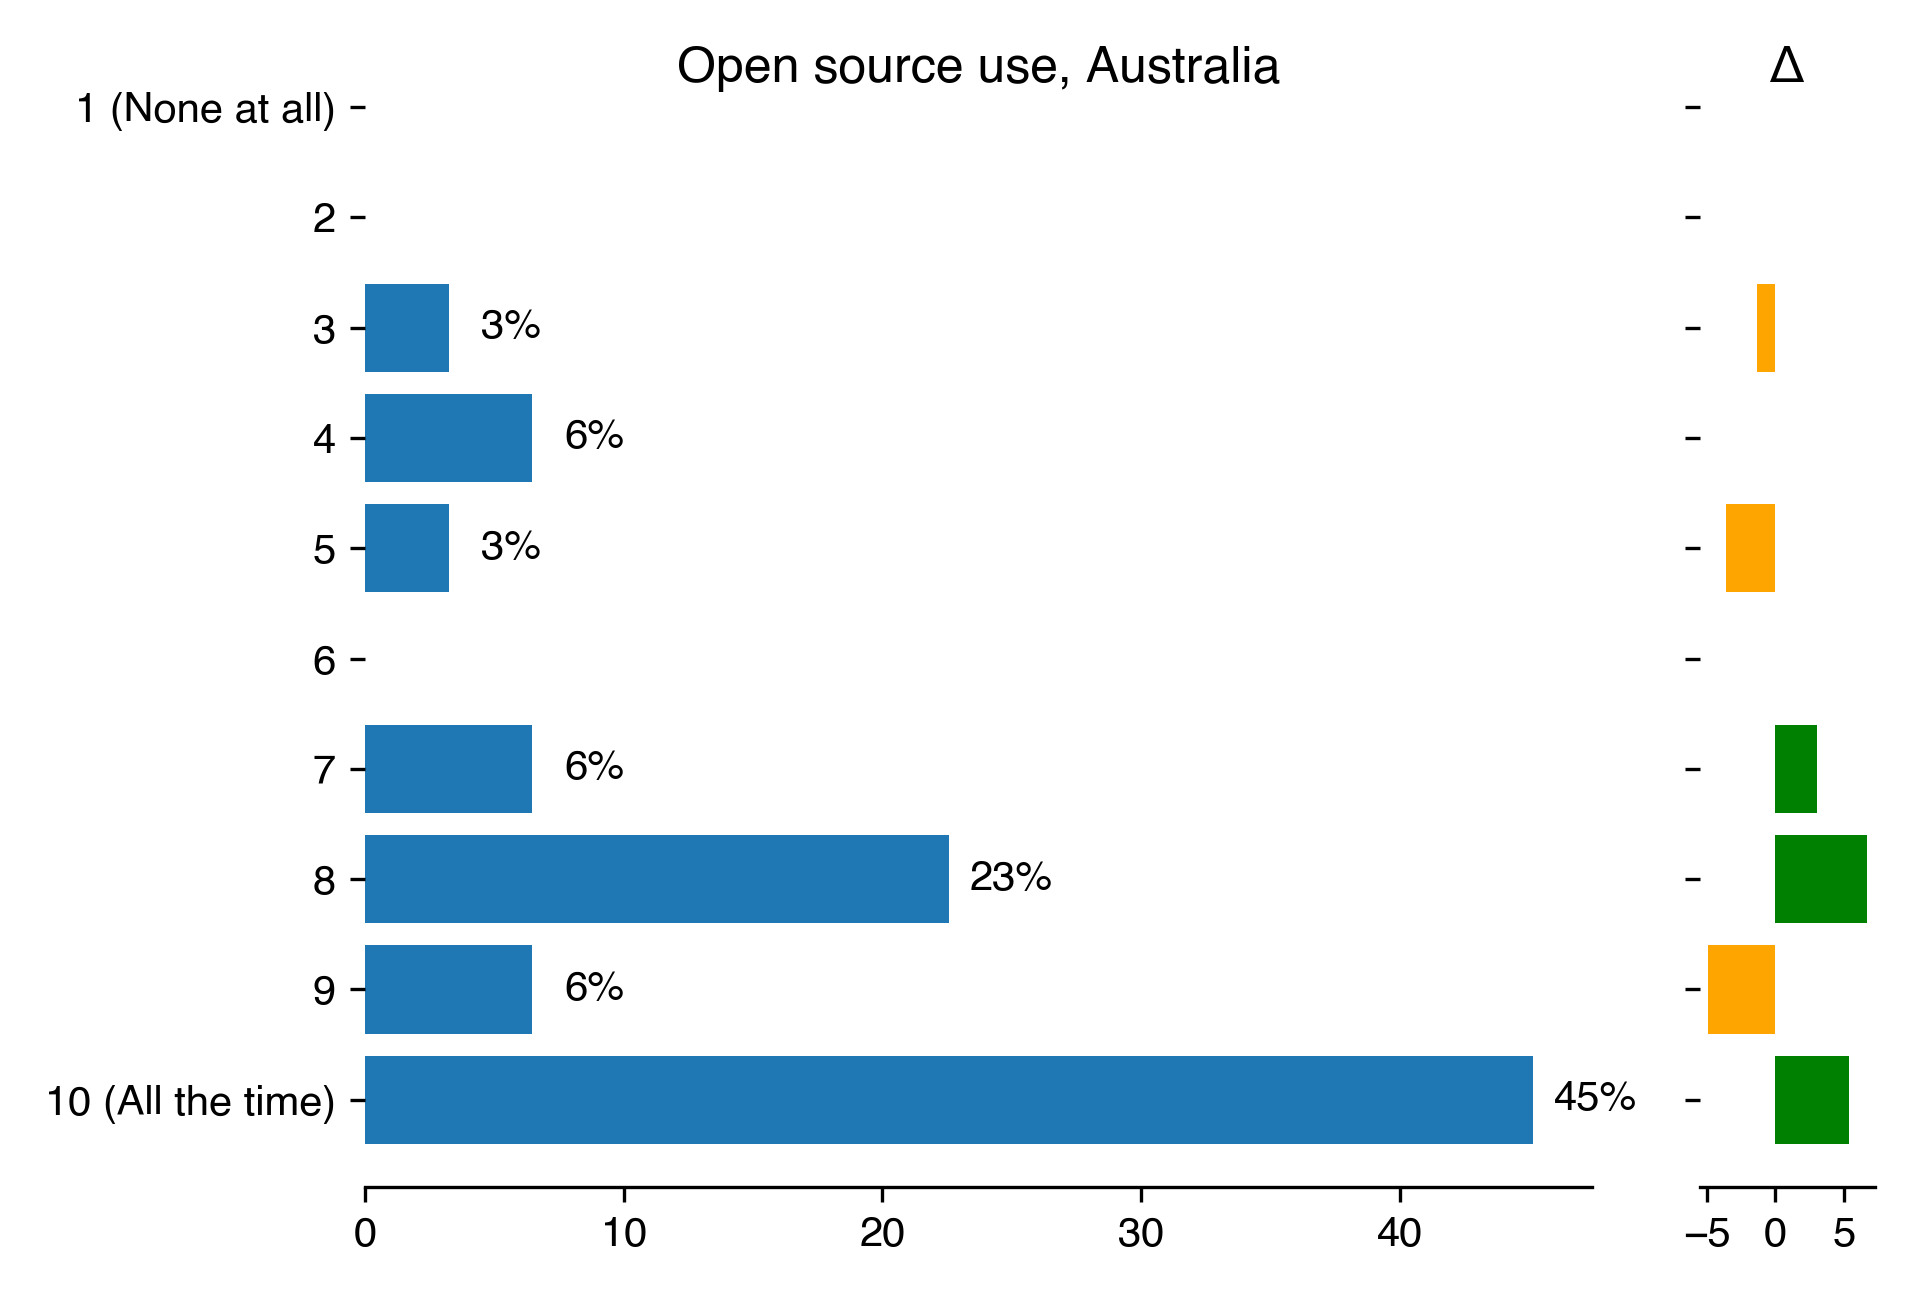
Open source use for Australia
Count
Percentage
Percentage in 2018
Difference with previous year
1 (None at all)
nan
nan
nan
nan
2
nan
nan
nan
nan
3
1
3.23
4.55
-1.32
4
2
6.45
nan
nan
5
1
3.23
6.82
-3.59
6
nan
nan
nan
nan
7
2
6.45
3.41
3.04
8
7
22.58
15.91
6.67
9
2
6.45
11.36
-4.91
10 (All the time)
14
45.16
39.77
5.39
Download CSV
2022-08-22T11:28:50.231076
image/svg+xml
Matplotlib v3.5.2, https://matplotlib.org/
PNG SVG
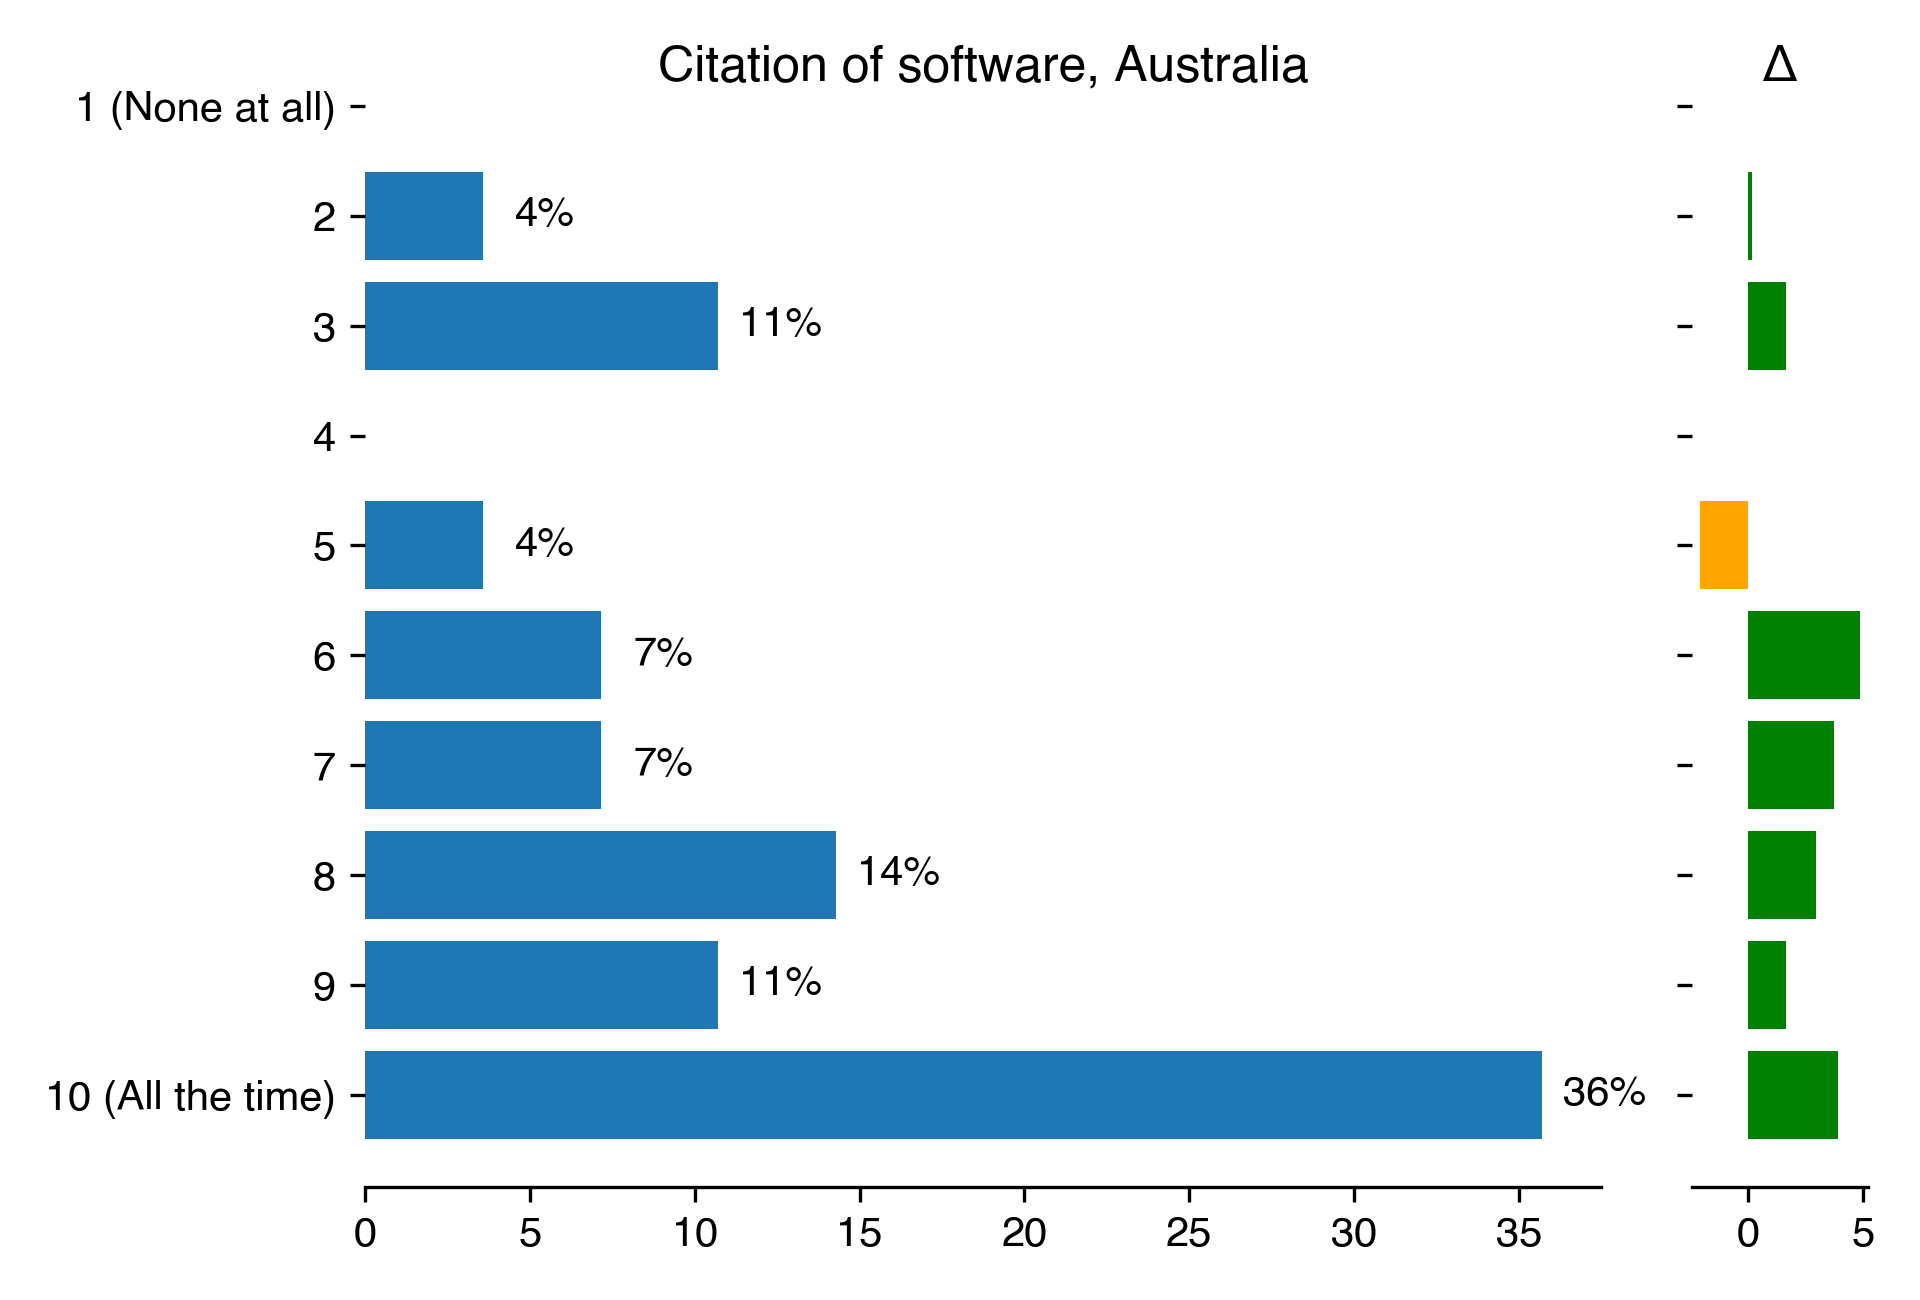
Citation of software for Australia
Count
Percentage
Percentage in 2018
Difference with previous year
1 (None at all)
nan
nan
nan
nan
2
1
3.57
3.41
0.16
3
3
10.71
9.09
1.62
4
nan
nan
nan
nan
5
1
3.57
5.68
-2.11
6
2
7.14
2.27
4.87
7
2
7.14
3.41
3.73
8
4
14.29
11.36
2.92
9
3
10.71
9.09
1.62
10 (All the time)
10
35.71
31.82
3.9
Download CSV
2022-08-22T11:28:52.271631
image/svg+xml
Matplotlib v3.5.2, https://matplotlib.org/
PNG SVG
Use of Digital Object Identifier for Australia
Count
Percentage
Percentage in 2018
Difference with previous year
1 (None at all)
nan
nan
nan
nan
2
4
14.81
5.68
9.13
3
3
11.11
5.68
5.43
4
1
3.7
7.95
-4.25
5
3
11.11
5.68
5.43
6
1
3.7
6.82
-3.11
7
3
11.11
3.41
7.7
8
1
3.7
3.41
0.29
9
nan
nan
nan
nan
10 (All the time)
3
11.11
6.82
4.29
Download CSV
2022-08-22T11:28:54.435854
image/svg+xml
Matplotlib v3.5.2, https://matplotlib.org/
PNG SVG
2022-08-22T11:28:55.445638
image/svg+xml
Matplotlib v3.5.2, https://matplotlib.org/
PNG SVG
Using ORCID for Australia
Count
Percentage
Percentage in 2018
Difference with previous year
Yes
31
100
78.16
21.84
No
nan
nan
9.2
nan
Download CSV
2022-08-22T11:28:56.010820
image/svg+xml
Matplotlib v3.5.2, https://matplotlib.org/
PNG SVG
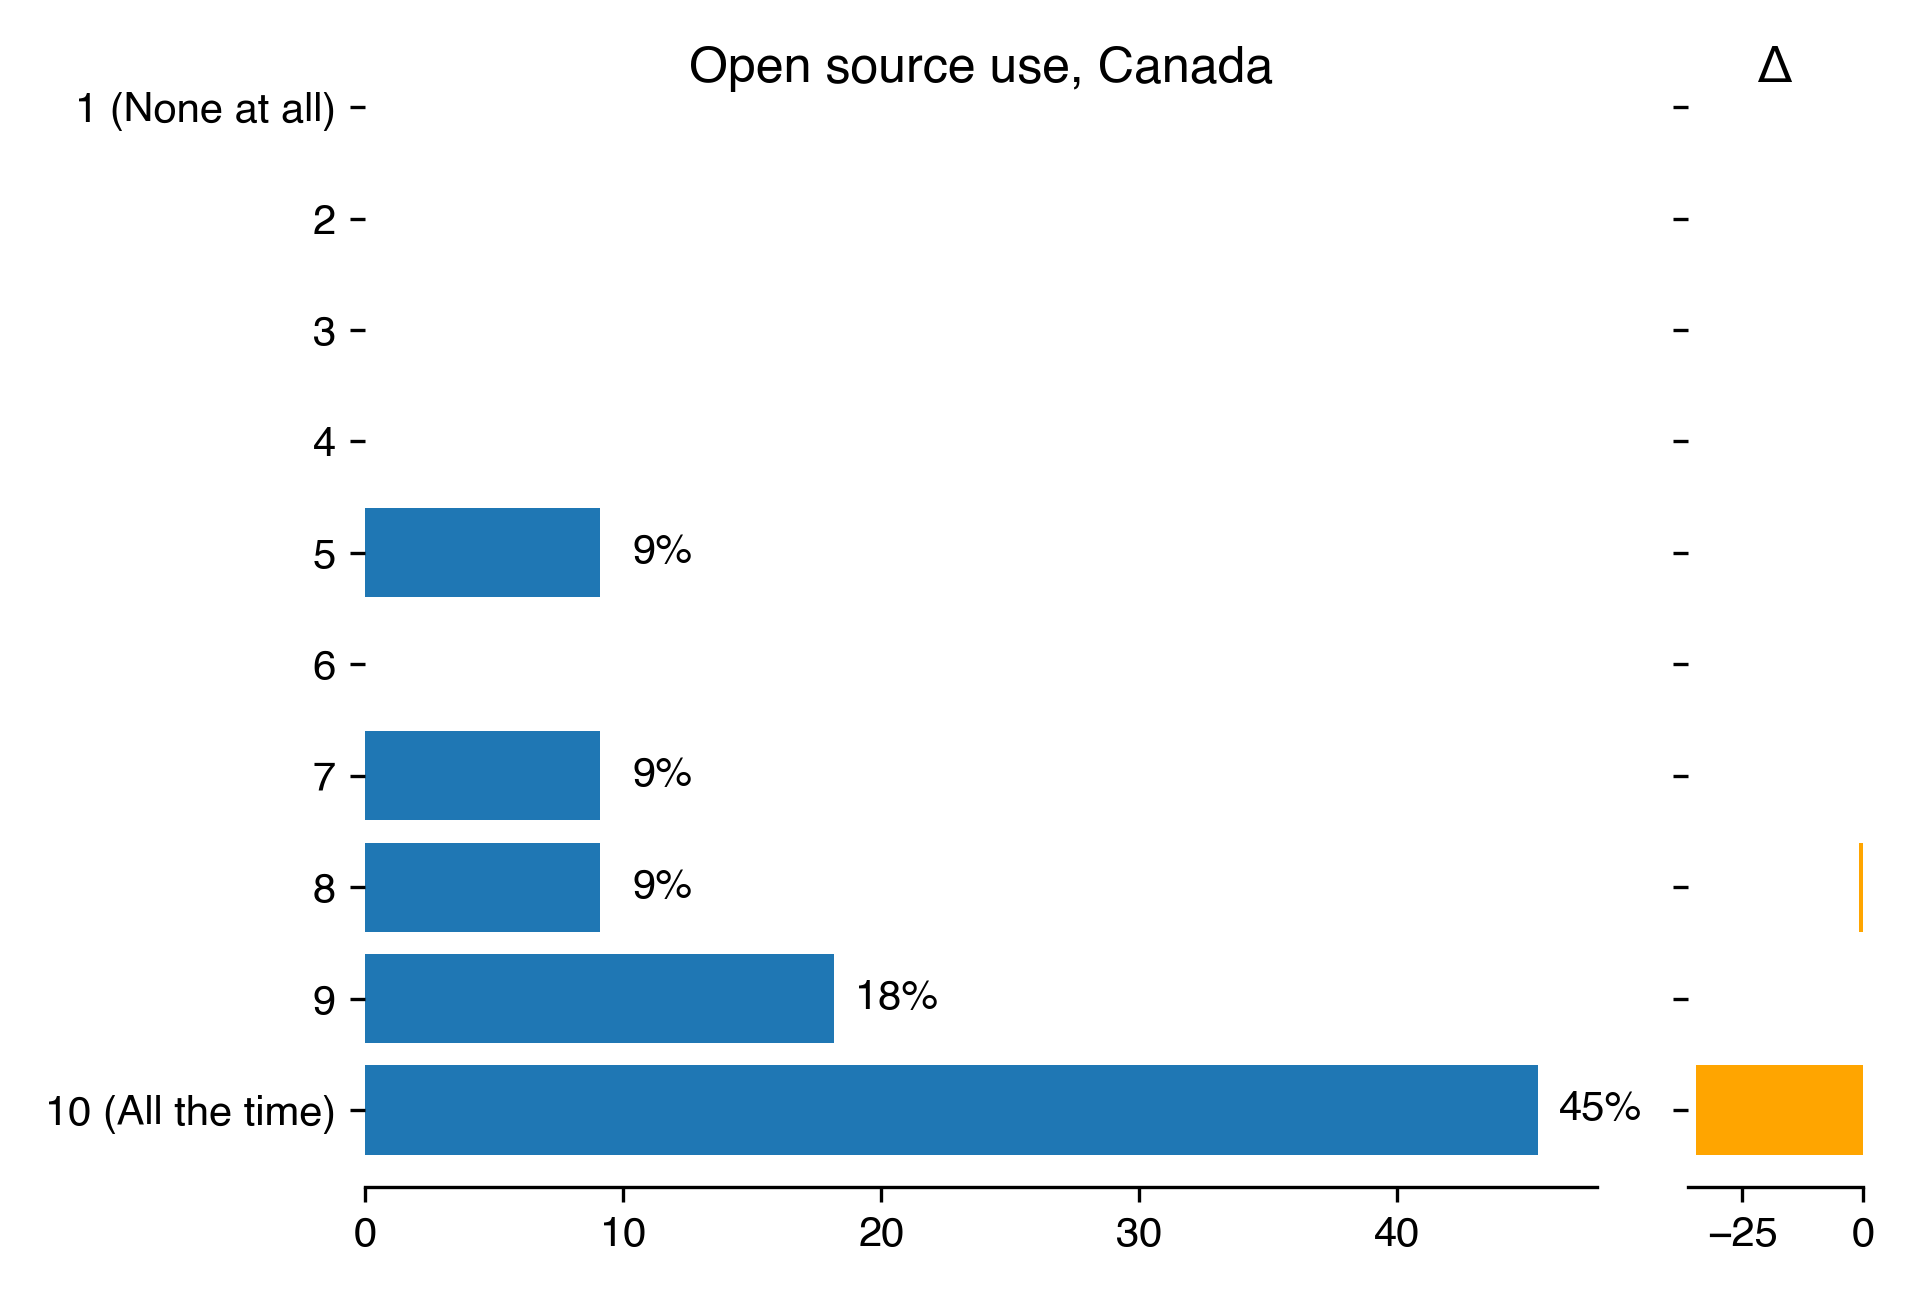
Open source use for Canada
Count
Percentage
Percentage in 2018
Difference with previous year
1 (None at all)
nan
nan
nan
nan
2
nan
nan
nan
nan
3
nan
nan
nan
nan
4
nan
nan
nan
nan
5
1
9.09
nan
nan
6
nan
nan
nan
nan
7
1
9.09
nan
nan
8
1
9.09
10
-0.91
9
2
18.18
nan
nan
10 (All the time)
5
45.45
80
-34.55
Download CSV
2022-08-22T11:28:56.483935
image/svg+xml
Matplotlib v3.5.2, https://matplotlib.org/
PNG SVG
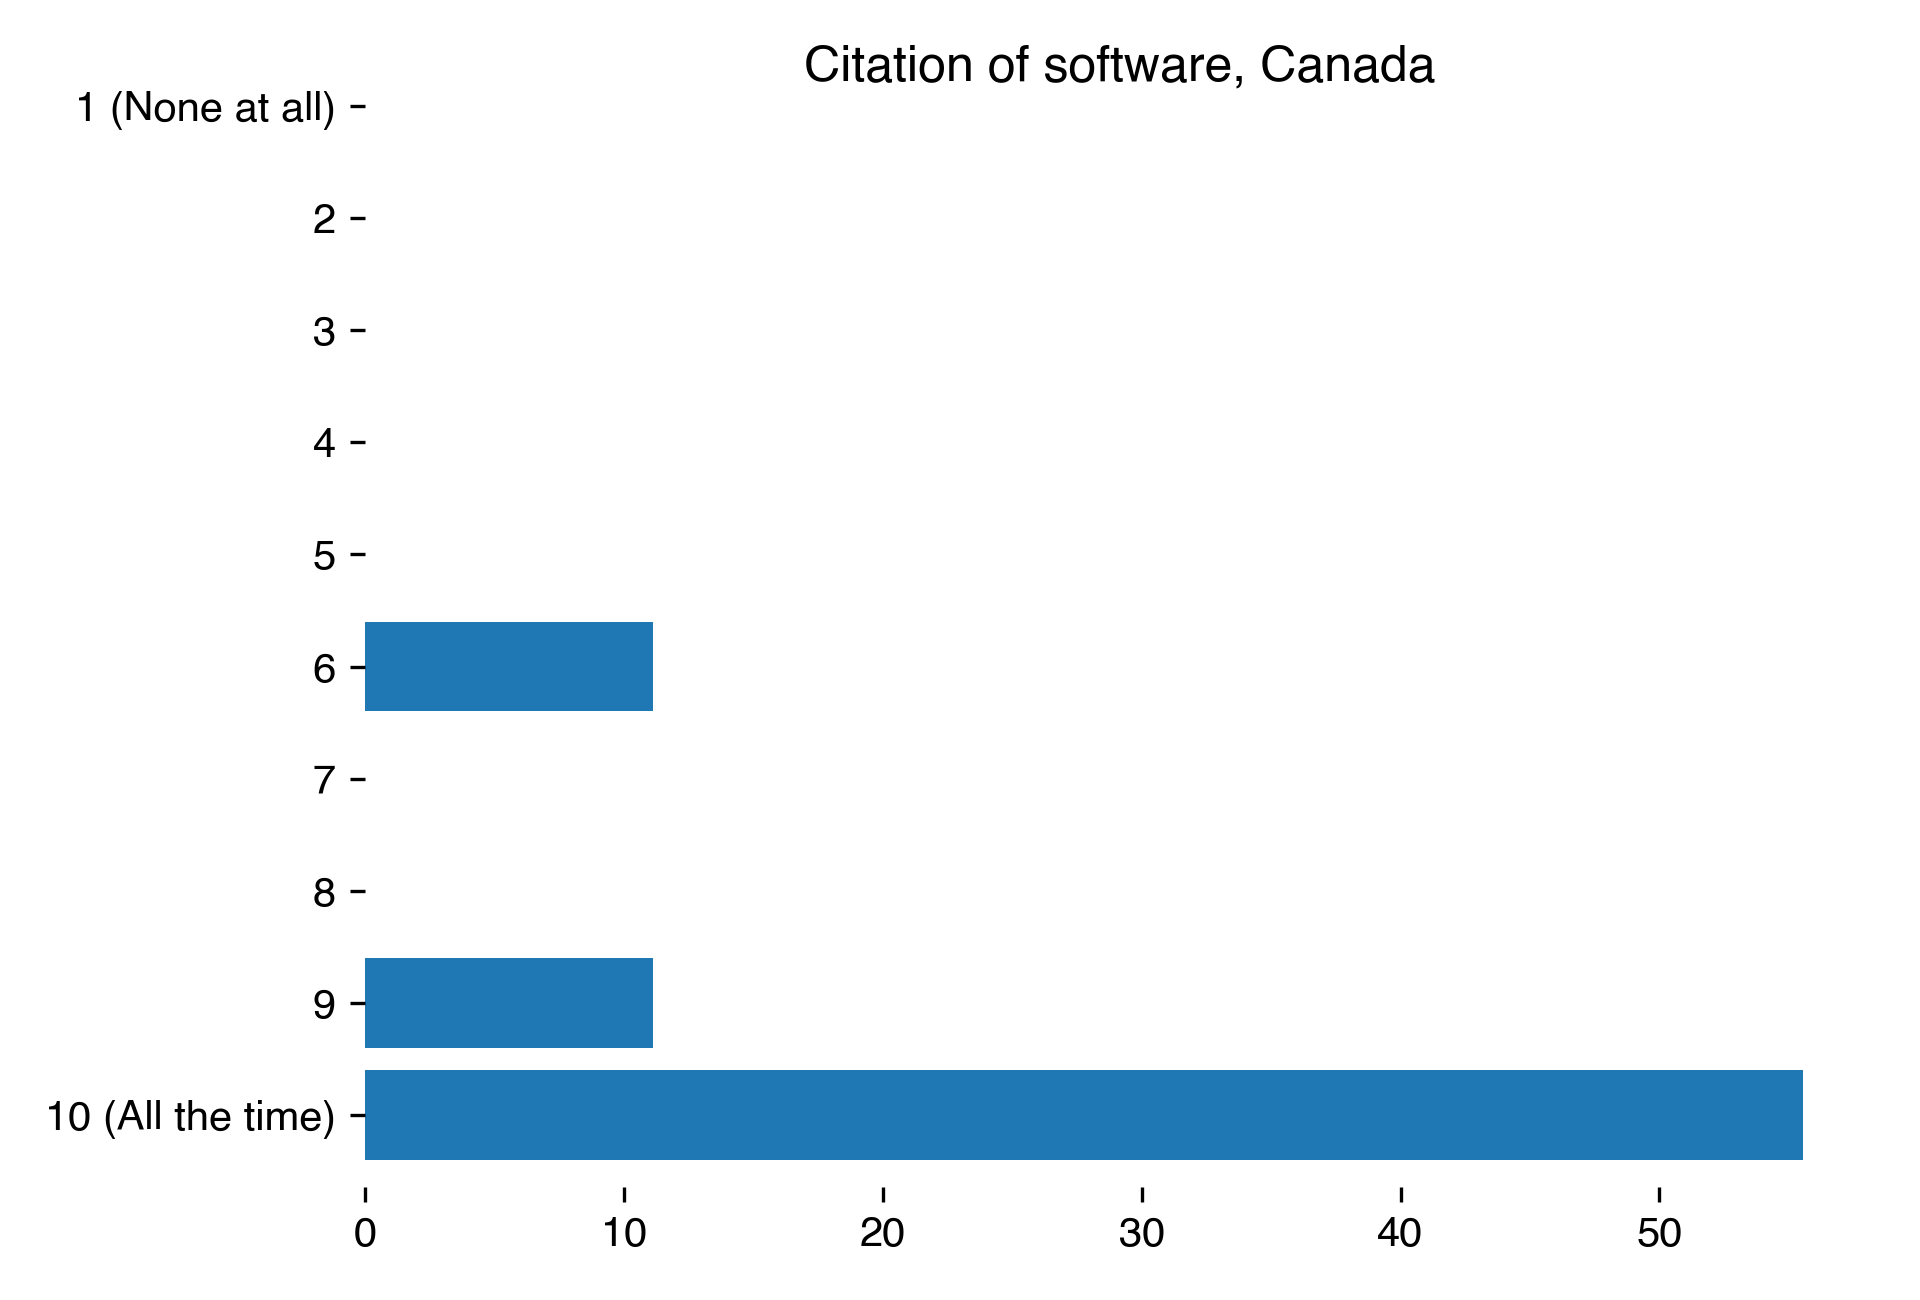
Citation of software for Canada
Count
Percentage
1 (None at all)
nan
nan
2
nan
nan
3
nan
nan
4
nan
nan
5
nan
nan
6
1
11.11
7
nan
nan
8
nan
nan
9
1
11.11
10 (All the time)
5
55.56
Download CSV
2022-08-22T11:28:58.076335
image/svg+xml
Matplotlib v3.5.2, https://matplotlib.org/
PNG SVG
Use of Digital Object Identifier for Canada
Count
Percentage
1 (None at all)
nan
nan
2
nan
nan
3
1
11.11
4
nan
nan
5
3
33.33
6
nan
nan
7
nan
nan
8
nan
nan
9
nan
nan
10 (All the time)
2
22.22
Download CSV
2022-08-22T11:28:59.646209
image/svg+xml
Matplotlib v3.5.2, https://matplotlib.org/
PNG SVG
2022-08-22T11:29:00.299768
image/svg+xml
Matplotlib v3.5.2, https://matplotlib.org/
PNG SVG
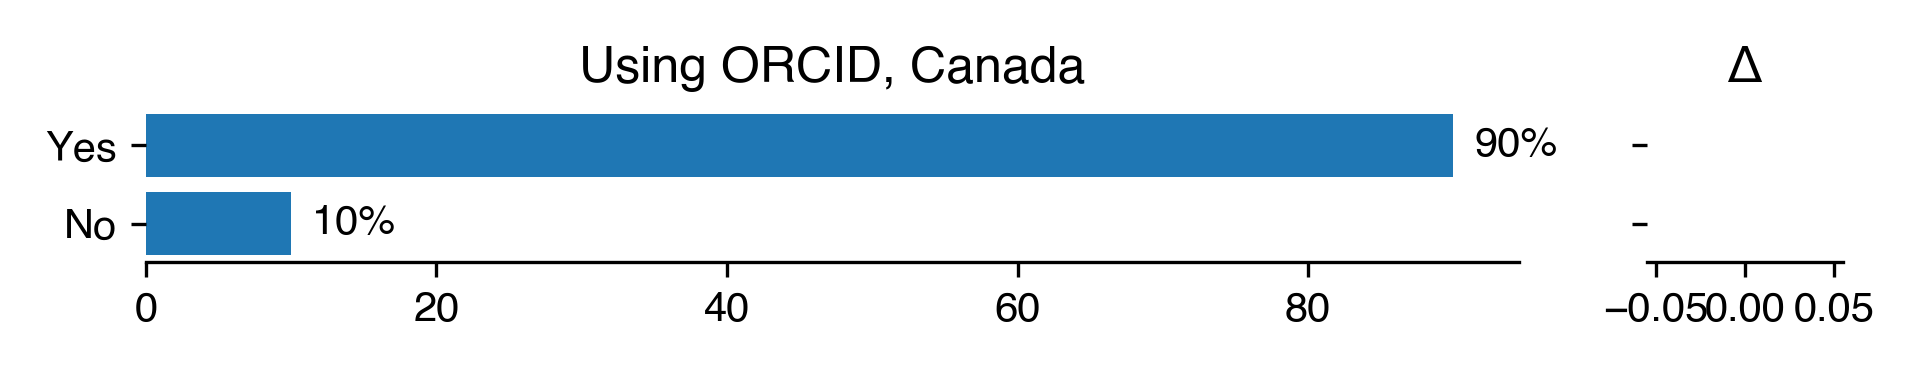
Using ORCID for Canada
Count
Percentage
Percentage in 2018
Difference with previous year
Yes
9
90
90
0
No
1
10
nan
nan
Download CSV
2022-08-22T11:29:00.788360
image/svg+xml
Matplotlib v3.5.2, https://matplotlib.org/
PNG SVG
Open source use for Germany
Count
Percentage
Percentage in 2018
Difference with previous year
1 (None at all)
nan
nan
nan
nan
2
13
5.99
6.42
-0.43
3
7
3.23
5.74
-2.52
4
nan
nan
nan
nan
5
9
4.15
5.07
-0.92
6
5
2.3
2.36
-0.06
7
11
5.07
4.73
0.34
8
23
10.6
6.08
4.52
9
24
11.06
9.8
1.26
10 (All the time)
95
43.78
30.07
13.71
Download CSV
2022-08-22T11:29:01.399074
image/svg+xml
Matplotlib v3.5.2, https://matplotlib.org/
PNG SVG
Citation of software for Germany
Count
Percentage
Percentage in 2018
Difference with previous year
1 (None at all)
nan
nan
nan
nan
2
9
4.89
10.14
-5.24
3
7
3.8
6.76
-2.95
4
8
4.35
4.39
-0.04
5
15
8.15
8.11
0.04
6
5
2.72
5.07
-2.35
7
22
11.96
6.42
5.54
8
19
10.33
7.09
3.23
9
20
10.87
5.74
5.13
10 (All the time)
58
31.52
22.64
8.89
Download CSV
2022-08-22T11:29:03.847581
image/svg+xml
Matplotlib v3.5.2, https://matplotlib.org/
PNG SVG
Use of Digital Object Identifier for Germany
Count
Percentage
Percentage in 2018
Difference with previous year
1 (None at all)
nan
nan
nan
nan
2
16
8.25
7.43
0.81
3
11
5.67
5.07
0.6
4
10
5.15
2.03
3.13
5
20
10.31
6.08
4.23
6
5
2.58
2.03
0.55
7
5
2.58
1.69
0.89
8
16
8.25
1.35
6.9
9
7
3.61
2.36
1.24
10 (All the time)
20
10.31
4.73
5.58
Download CSV
2022-08-22T11:29:06.214082
image/svg+xml
Matplotlib v3.5.2, https://matplotlib.org/
PNG SVG
2022-08-22T11:29:07.507039
image/svg+xml
Matplotlib v3.5.2, https://matplotlib.org/
PNG SVG
Using ORCID for Germany
Count
Percentage
Percentage in 2018
Difference with previous year
Yes
169
79.72
52.56
27.16
No
35
16.51
19.8
-3.29
Download CSV
2022-08-22T11:29:08.097587
image/svg+xml
Matplotlib v3.5.2, https://matplotlib.org/
PNG SVG
Open source use for Netherlands
Count
Percentage
Percentage in 2018
Difference with previous year
1 (None at all)
nan
nan
nan
nan
2
2
3.45
3.92
-0.47
3
2
3.45
3.92
-0.47
4
nan
nan
nan
nan
5
nan
nan
nan
nan
6
1
1.72
5.88
-4.16
7
2
3.45
3.92
-0.47
8
7
12.07
3.92
8.15
9
8
13.79
9.8
3.99
10 (All the time)
33
56.9
60.78
-3.89
Download CSV
2022-08-22T11:29:08.571931
image/svg+xml
Matplotlib v3.5.2, https://matplotlib.org/
PNG SVG
Citation of software for Netherlands
Count
Percentage
Percentage in 2018
Difference with previous year
1 (None at all)
nan
nan
nan
nan
2
2
4.17
1.96
2.21
3
nan
nan
nan
nan
4
2
4.17
nan
nan
5
5
10.42
5.88
4.53
6
1
2.08
9.8
-7.72
7
2
4.17
7.84
-3.68
8
11
22.92
13.73
9.19
9
4
8.33
3.92
4.41
10 (All the time)
14
29.17
29.41
-0.25
Download CSV
2022-08-22T11:29:10.399562
image/svg+xml
Matplotlib v3.5.2, https://matplotlib.org/
PNG SVG
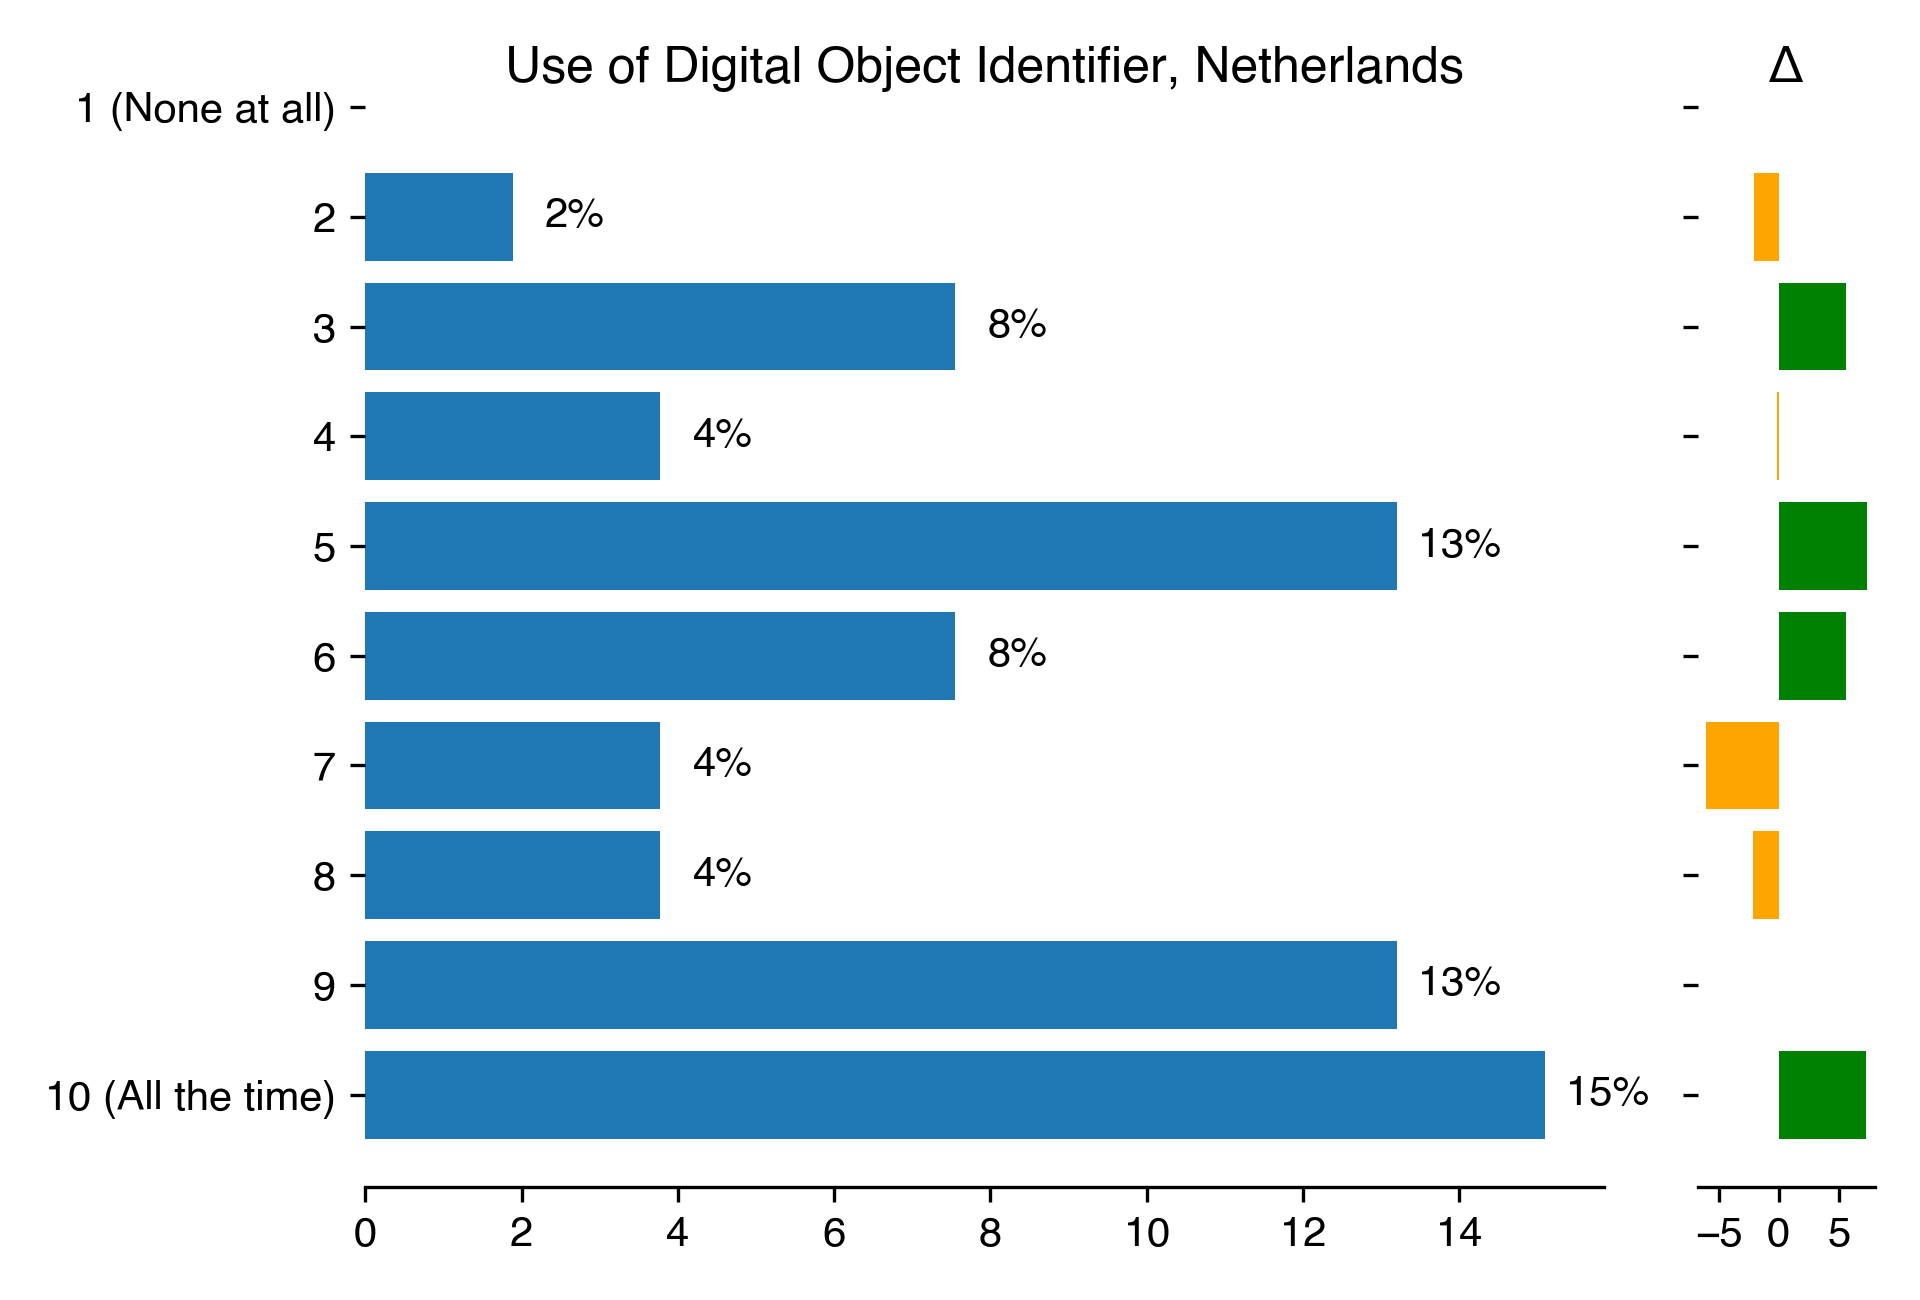
Use of Digital Object Identifier for Netherlands
Count
Percentage
Percentage in 2018
Difference with previous year
1 (None at all)
nan
nan
nan
nan
2
1
1.89
3.92
-2.03
3
4
7.55
1.96
5.59
4
2
3.77
3.92
-0.15
5
7
13.21
5.88
7.33
6
4
7.55
1.96
5.59
7
2
3.77
9.8
-6.03
8
2
3.77
5.88
-2.11
9
7
13.21
nan
nan
10 (All the time)
8
15.09
7.84
7.25
Download CSV
2022-08-22T11:29:12.371925
image/svg+xml
Matplotlib v3.5.2, https://matplotlib.org/
PNG SVG
2022-08-22T11:29:13.223942
image/svg+xml
Matplotlib v3.5.2, https://matplotlib.org/
PNG SVG
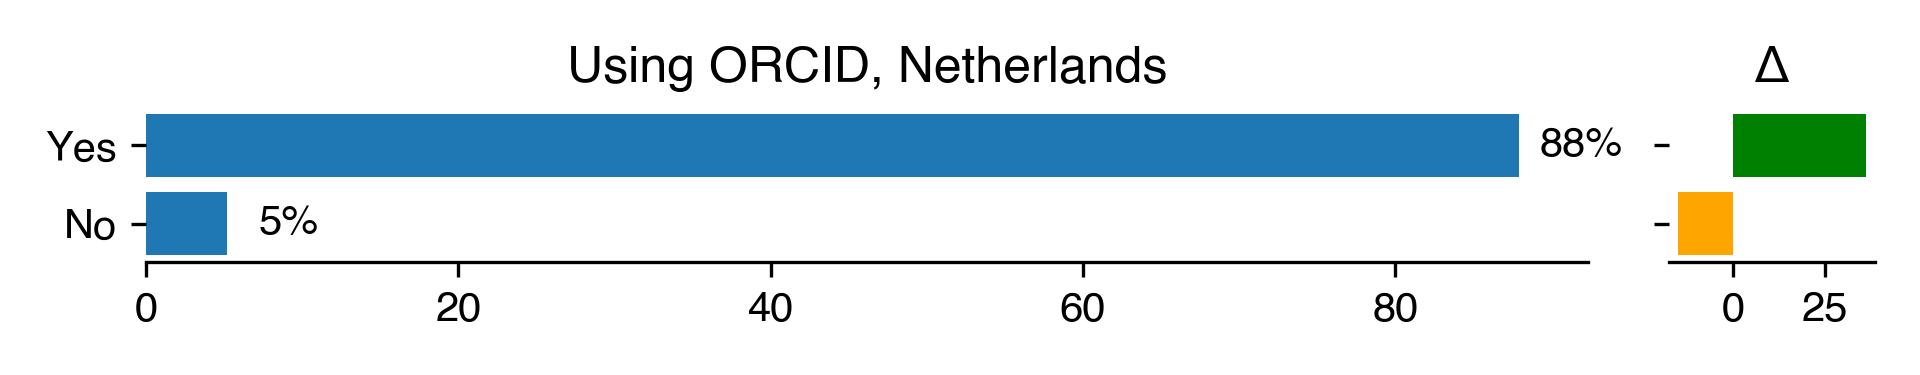
Using ORCID for Netherlands
Count
Percentage
Percentage in 2018
Difference with previous year
Yes
51
87.93
52
35.93
No
3
5.17
20
-14.83
Download CSV
2022-08-22T11:29:13.783310
image/svg+xml
Matplotlib v3.5.2, https://matplotlib.org/
PNG SVG
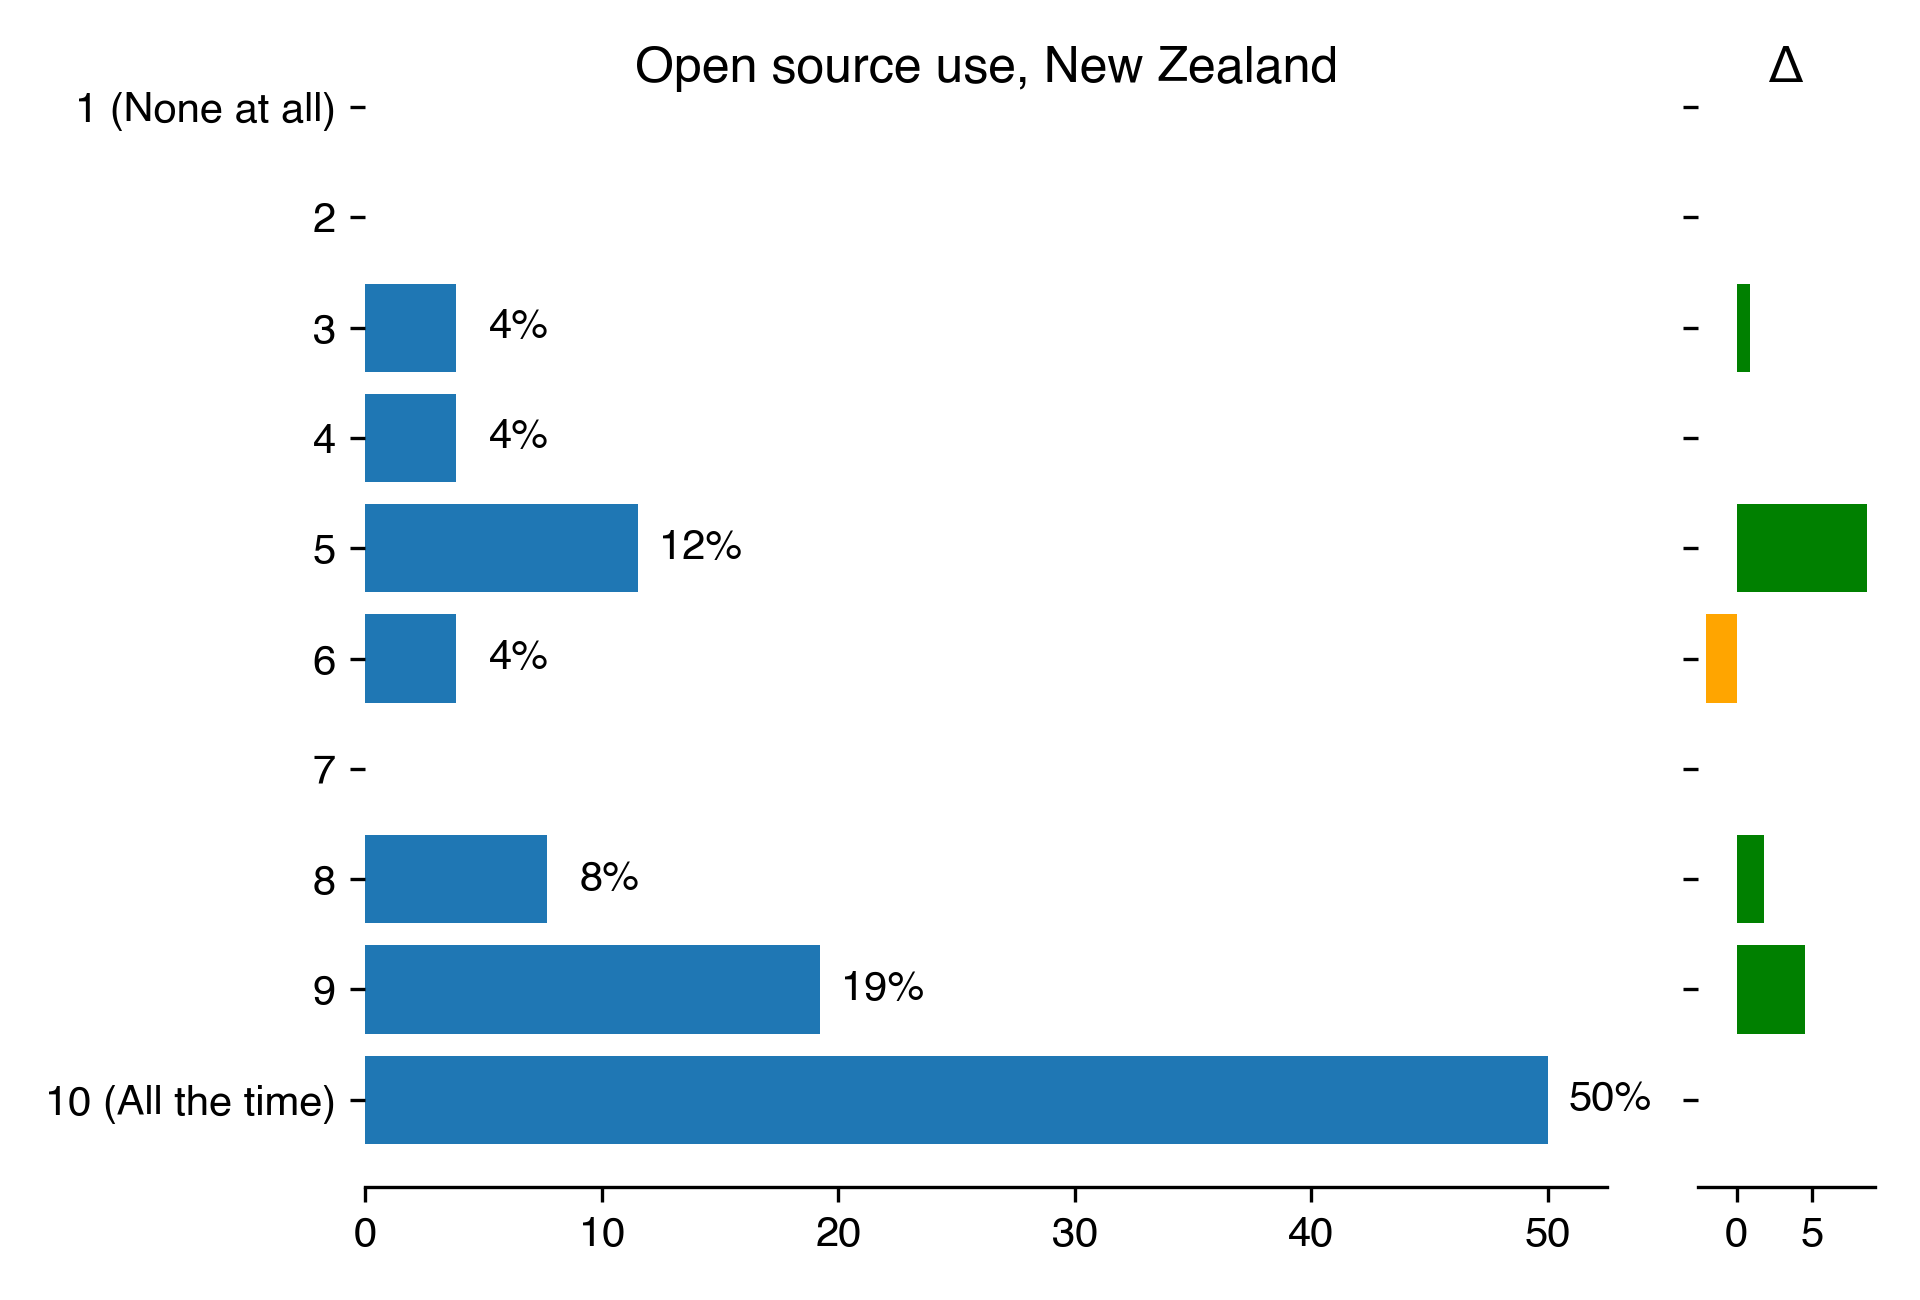
Open source use for New Zealand
Count
Percentage
Percentage in 2018
Difference with previous year
1 (None at all)
nan
nan
nan
nan
2
nan
nan
nan
nan
3
1
3.85
2.94
0.9
4
1
3.85
nan
nan
5
3
11.54
2.94
8.6
6
1
3.85
5.88
-2.04
7
nan
nan
nan
nan
8
2
7.69
5.88
1.81
9
5
19.23
14.71
4.52
10 (All the time)
13
50
50
0
Download CSV
2022-08-22T11:29:14.259821
image/svg+xml
Matplotlib v3.5.2, https://matplotlib.org/
PNG SVG
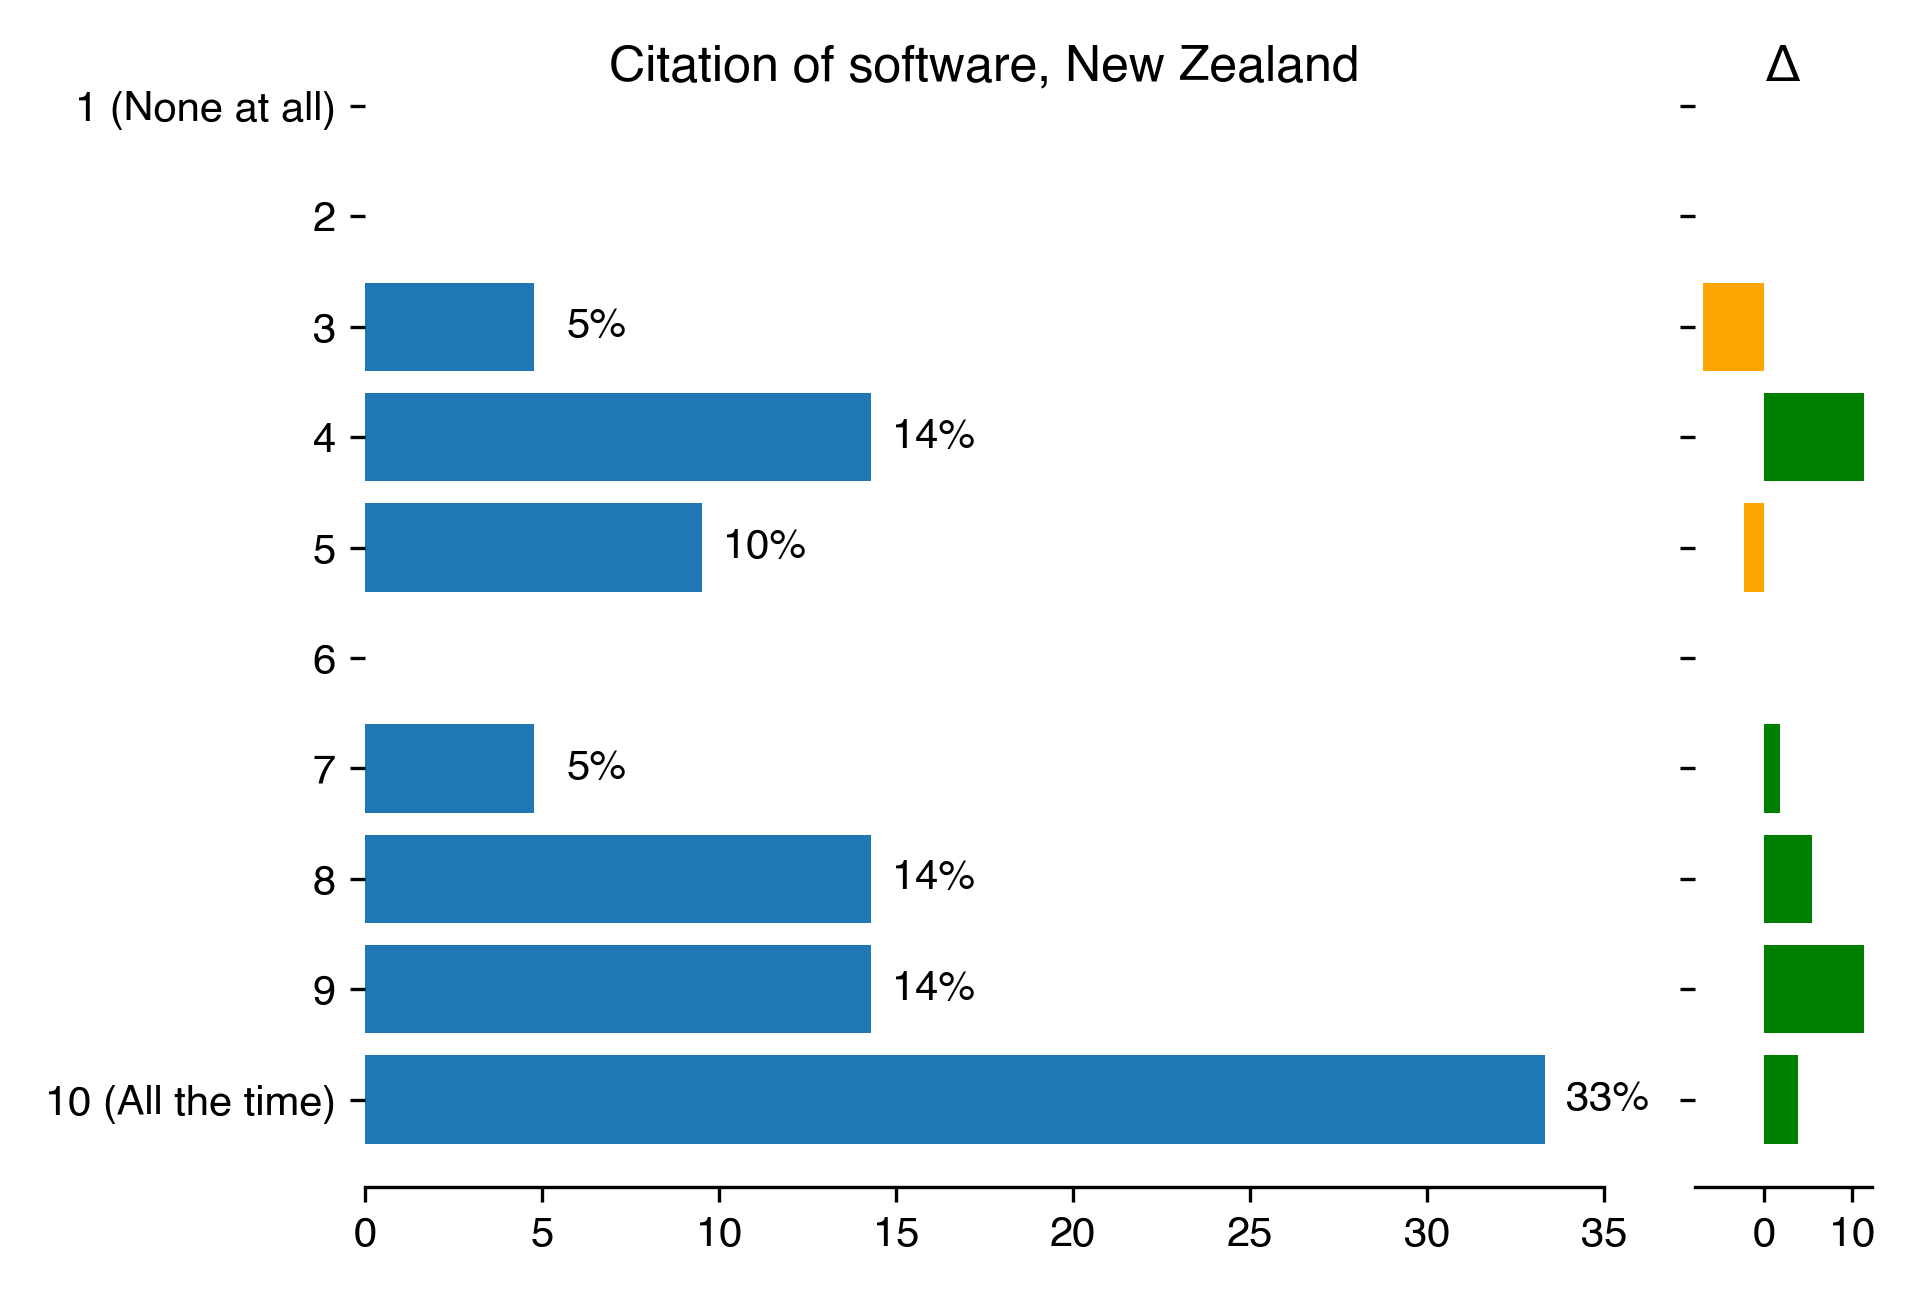
Citation of software for New Zealand
Count
Percentage
Percentage in 2018
Difference with previous year
1 (None at all)
nan
nan
nan
nan
2
nan
nan
nan
nan
3
1
4.76
11.76
-7
4
3
14.29
2.94
11.34
5
2
9.52
11.76
-2.24
6
nan
nan
nan
nan
7
1
4.76
2.94
1.82
8
3
14.29
8.82
5.46
9
3
14.29
2.94
11.34
10 (All the time)
7
33.33
29.41
3.92
Download CSV
2022-08-22T11:29:16.127578
image/svg+xml
Matplotlib v3.5.2, https://matplotlib.org/
PNG SVG
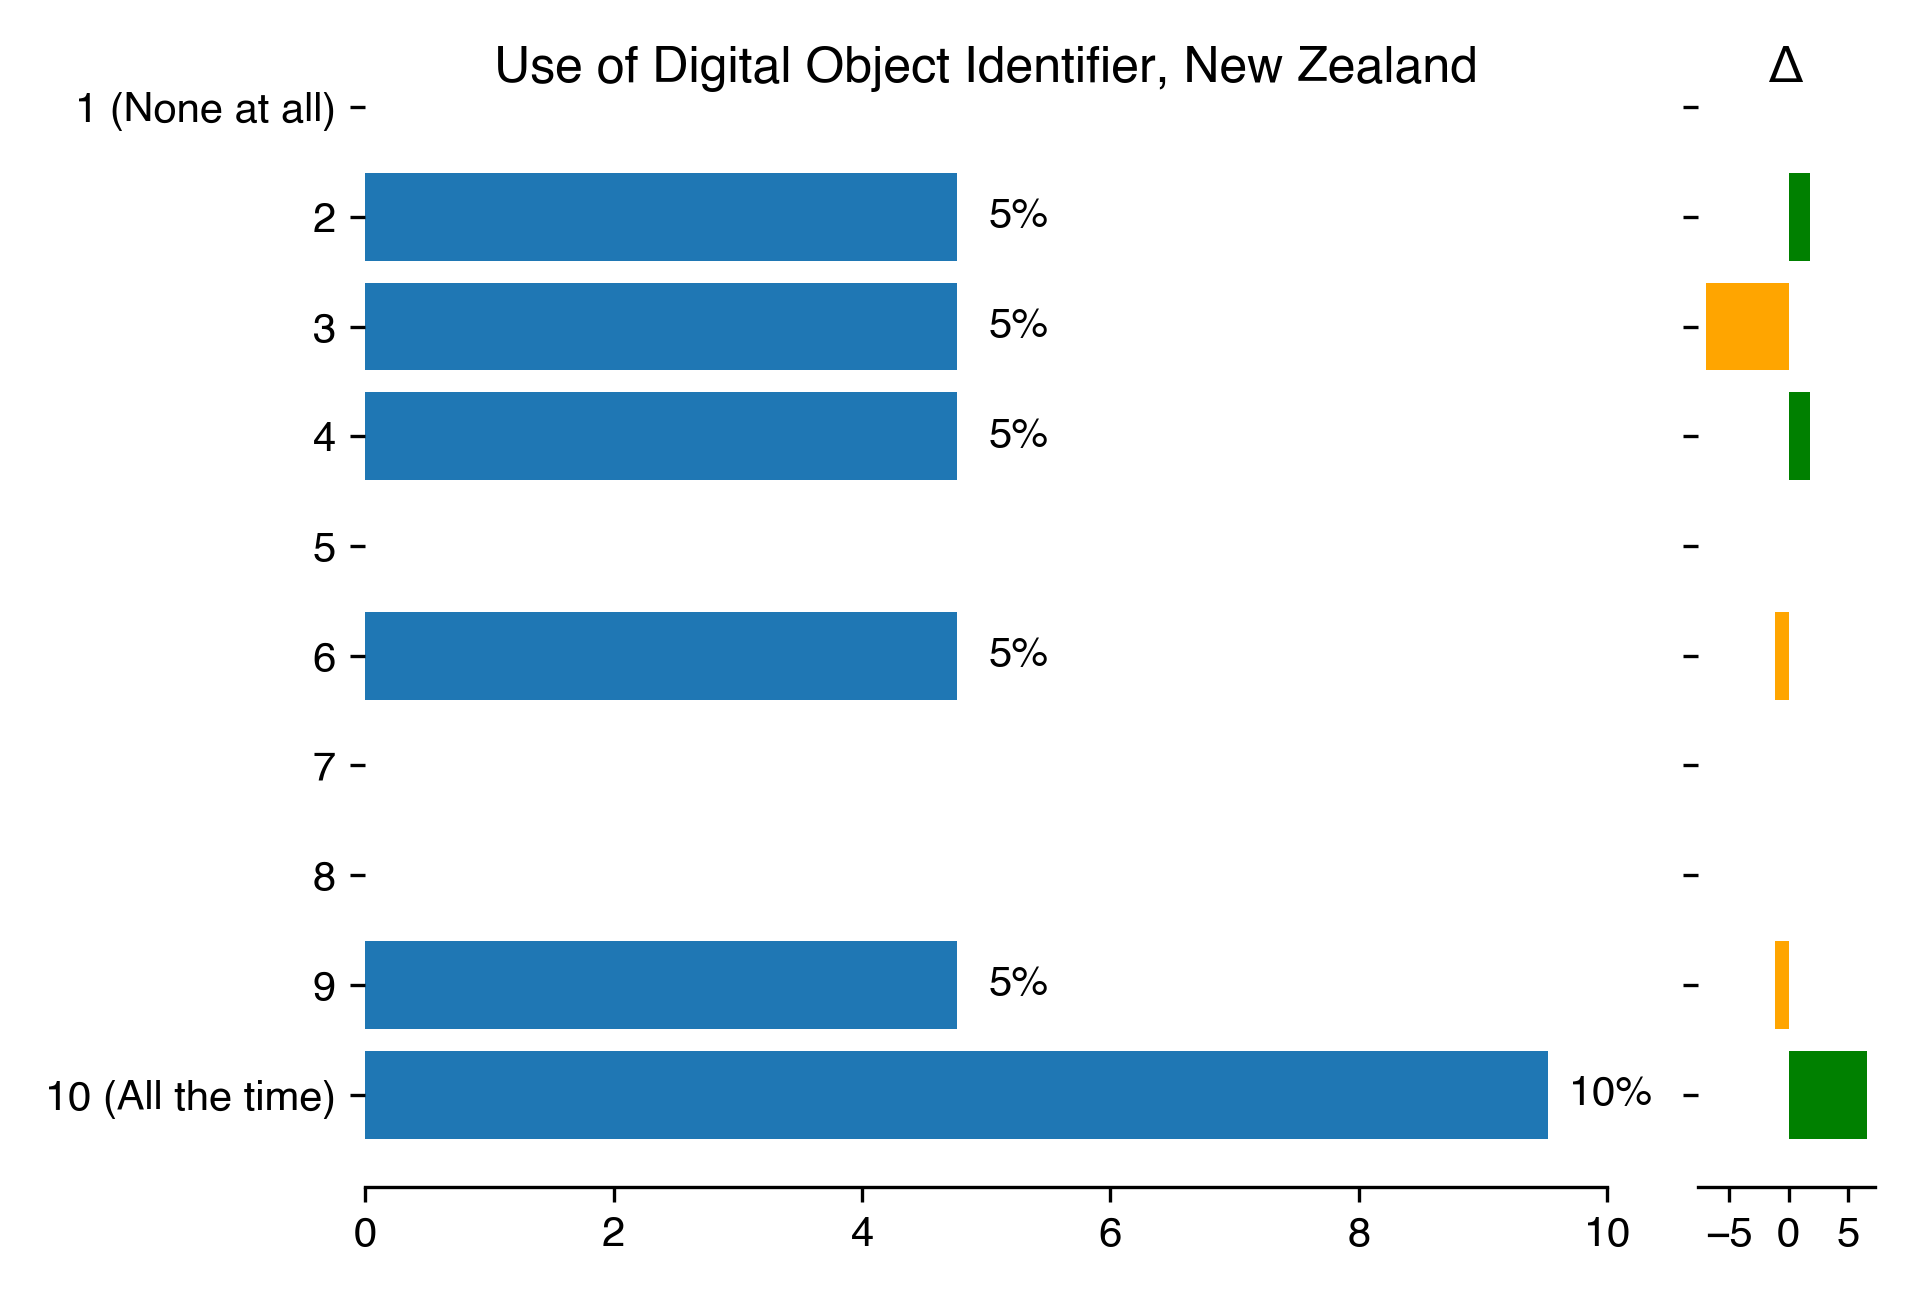
Use of Digital Object Identifier for New Zealand
Count
Percentage
Percentage in 2018
Difference with previous year
1 (None at all)
nan
nan
nan
nan
2
1
4.76
2.94
1.82
3
1
4.76
11.76
-7
4
1
4.76
2.94
1.82
5
nan
nan
nan
nan
6
1
4.76
5.88
-1.12
7
nan
nan
nan
nan
8
nan
nan
nan
nan
9
1
4.76
5.88
-1.12
10 (All the time)
2
9.52
2.94
6.58
Download CSV
2022-08-22T11:29:18.101662
image/svg+xml
Matplotlib v3.5.2, https://matplotlib.org/
PNG SVG
2022-08-22T11:29:18.983821
image/svg+xml
Matplotlib v3.5.2, https://matplotlib.org/
PNG SVG
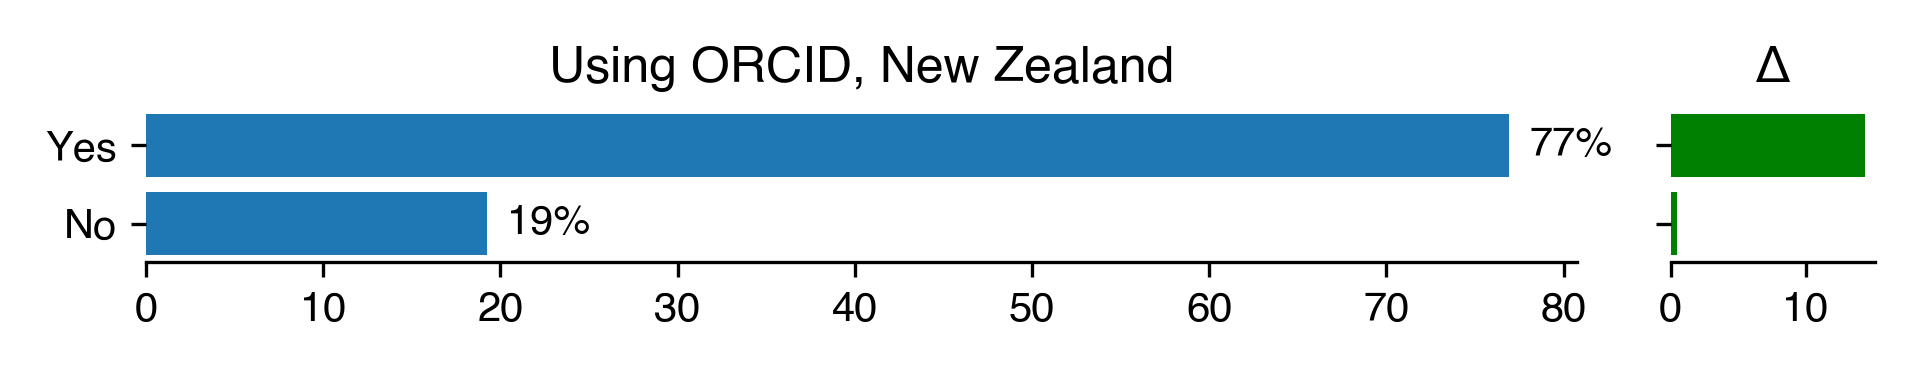
Using ORCID for New Zealand
Count
Percentage
Percentage in 2018
Difference with previous year
Yes
20
76.92
62.5
14.42
No
5
19.23
18.75
0.48
Download CSV
2022-08-22T11:29:19.542331
image/svg+xml
Matplotlib v3.5.2, https://matplotlib.org/
PNG SVG
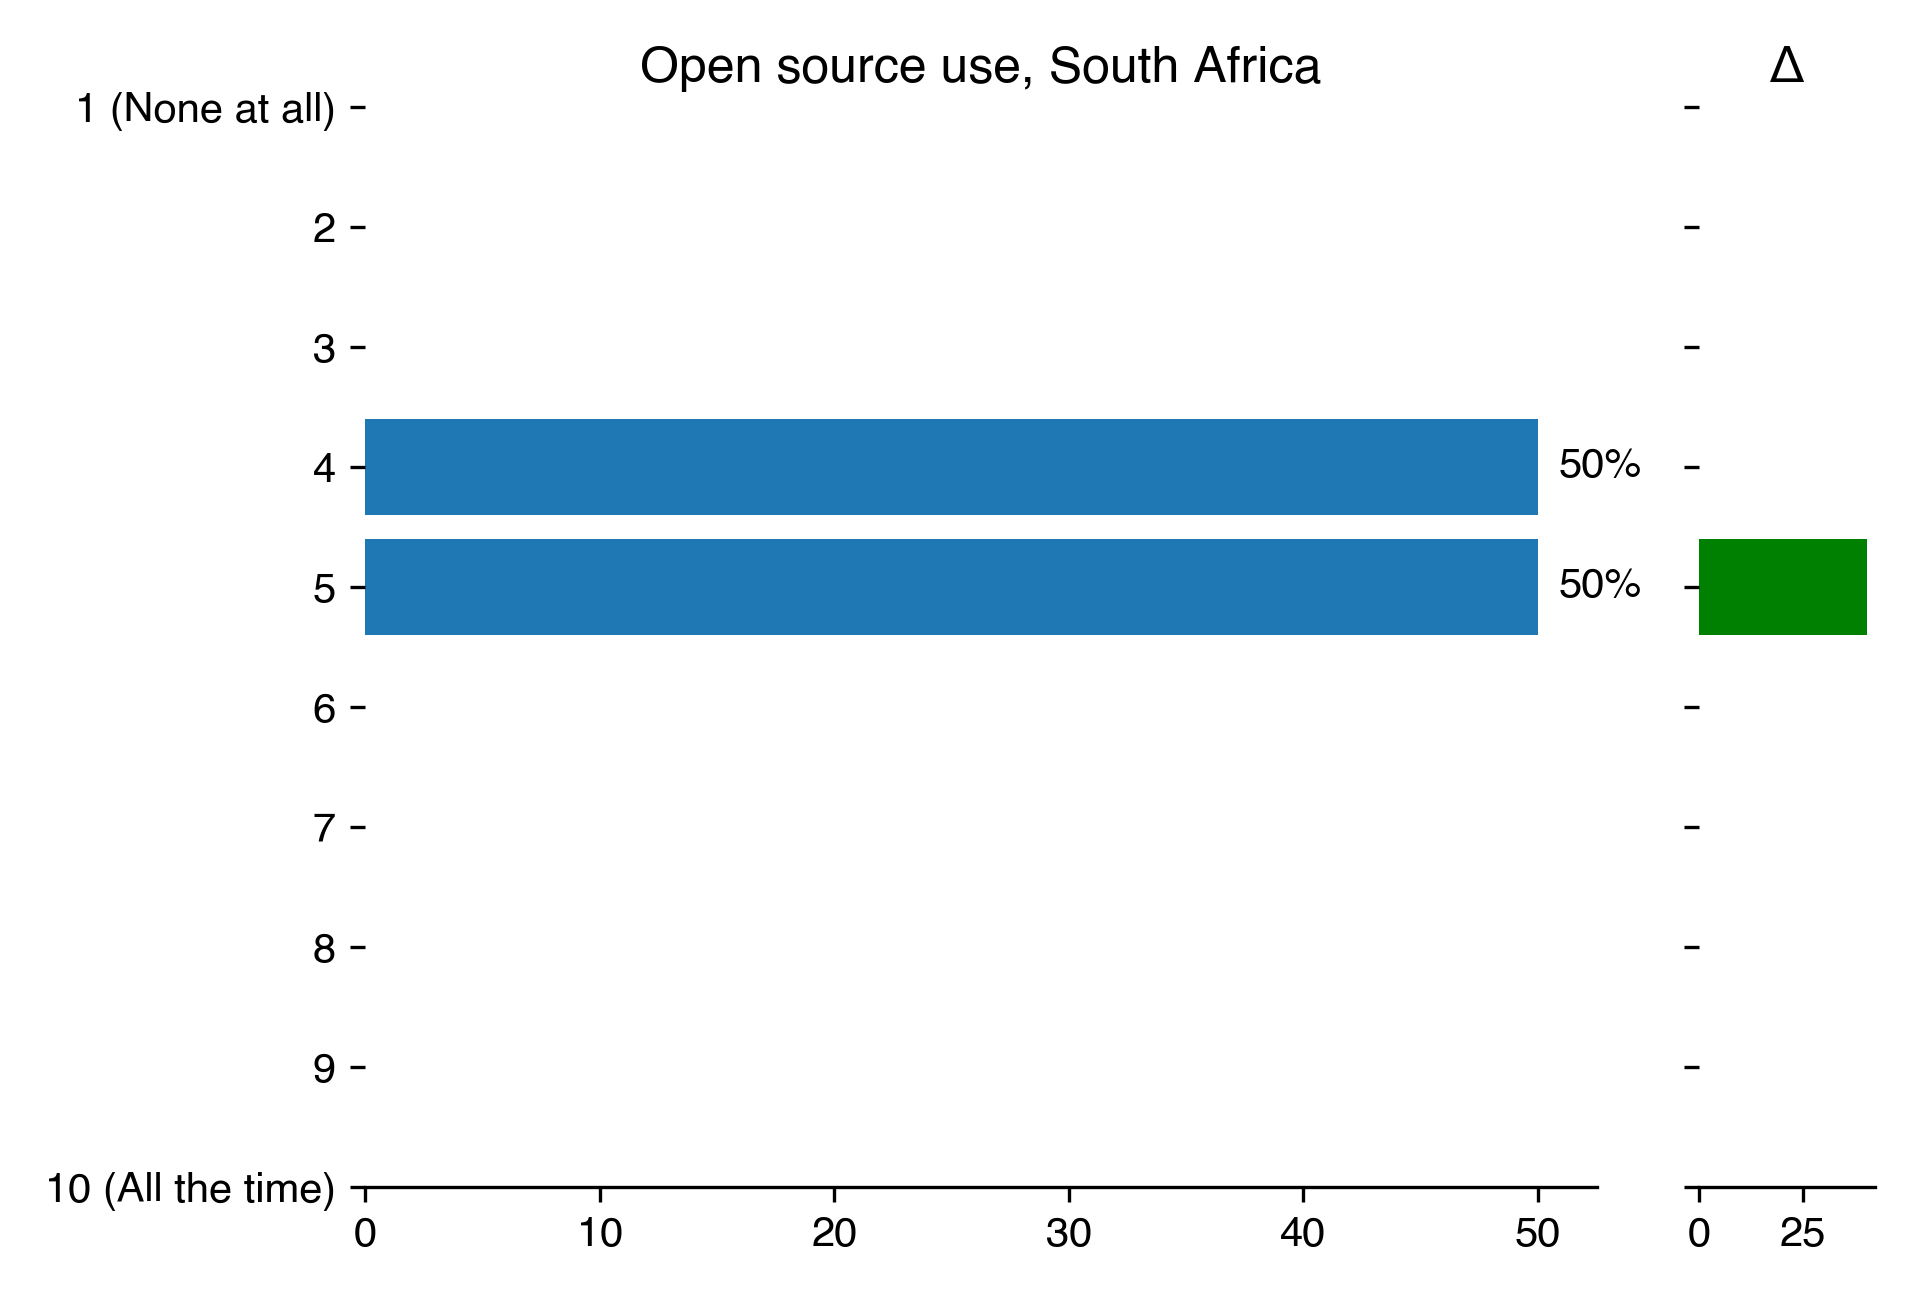
Open source use for South Africa
Count
Percentage
Percentage in 2018
Difference with previous year
1 (None at all)
nan
nan
nan
nan
2
nan
nan
nan
nan
3
nan
nan
nan
nan
4
1
50
nan
nan
5
1
50
9.52
40.48
6
nan
nan
nan
nan
7
nan
nan
nan
nan
8
nan
nan
nan
nan
9
nan
nan
nan
nan
10 (All the time)
nan
nan
nan
nan
Download CSV
2022-08-22T11:29:20.114148
image/svg+xml
Matplotlib v3.5.2, https://matplotlib.org/
PNG SVG
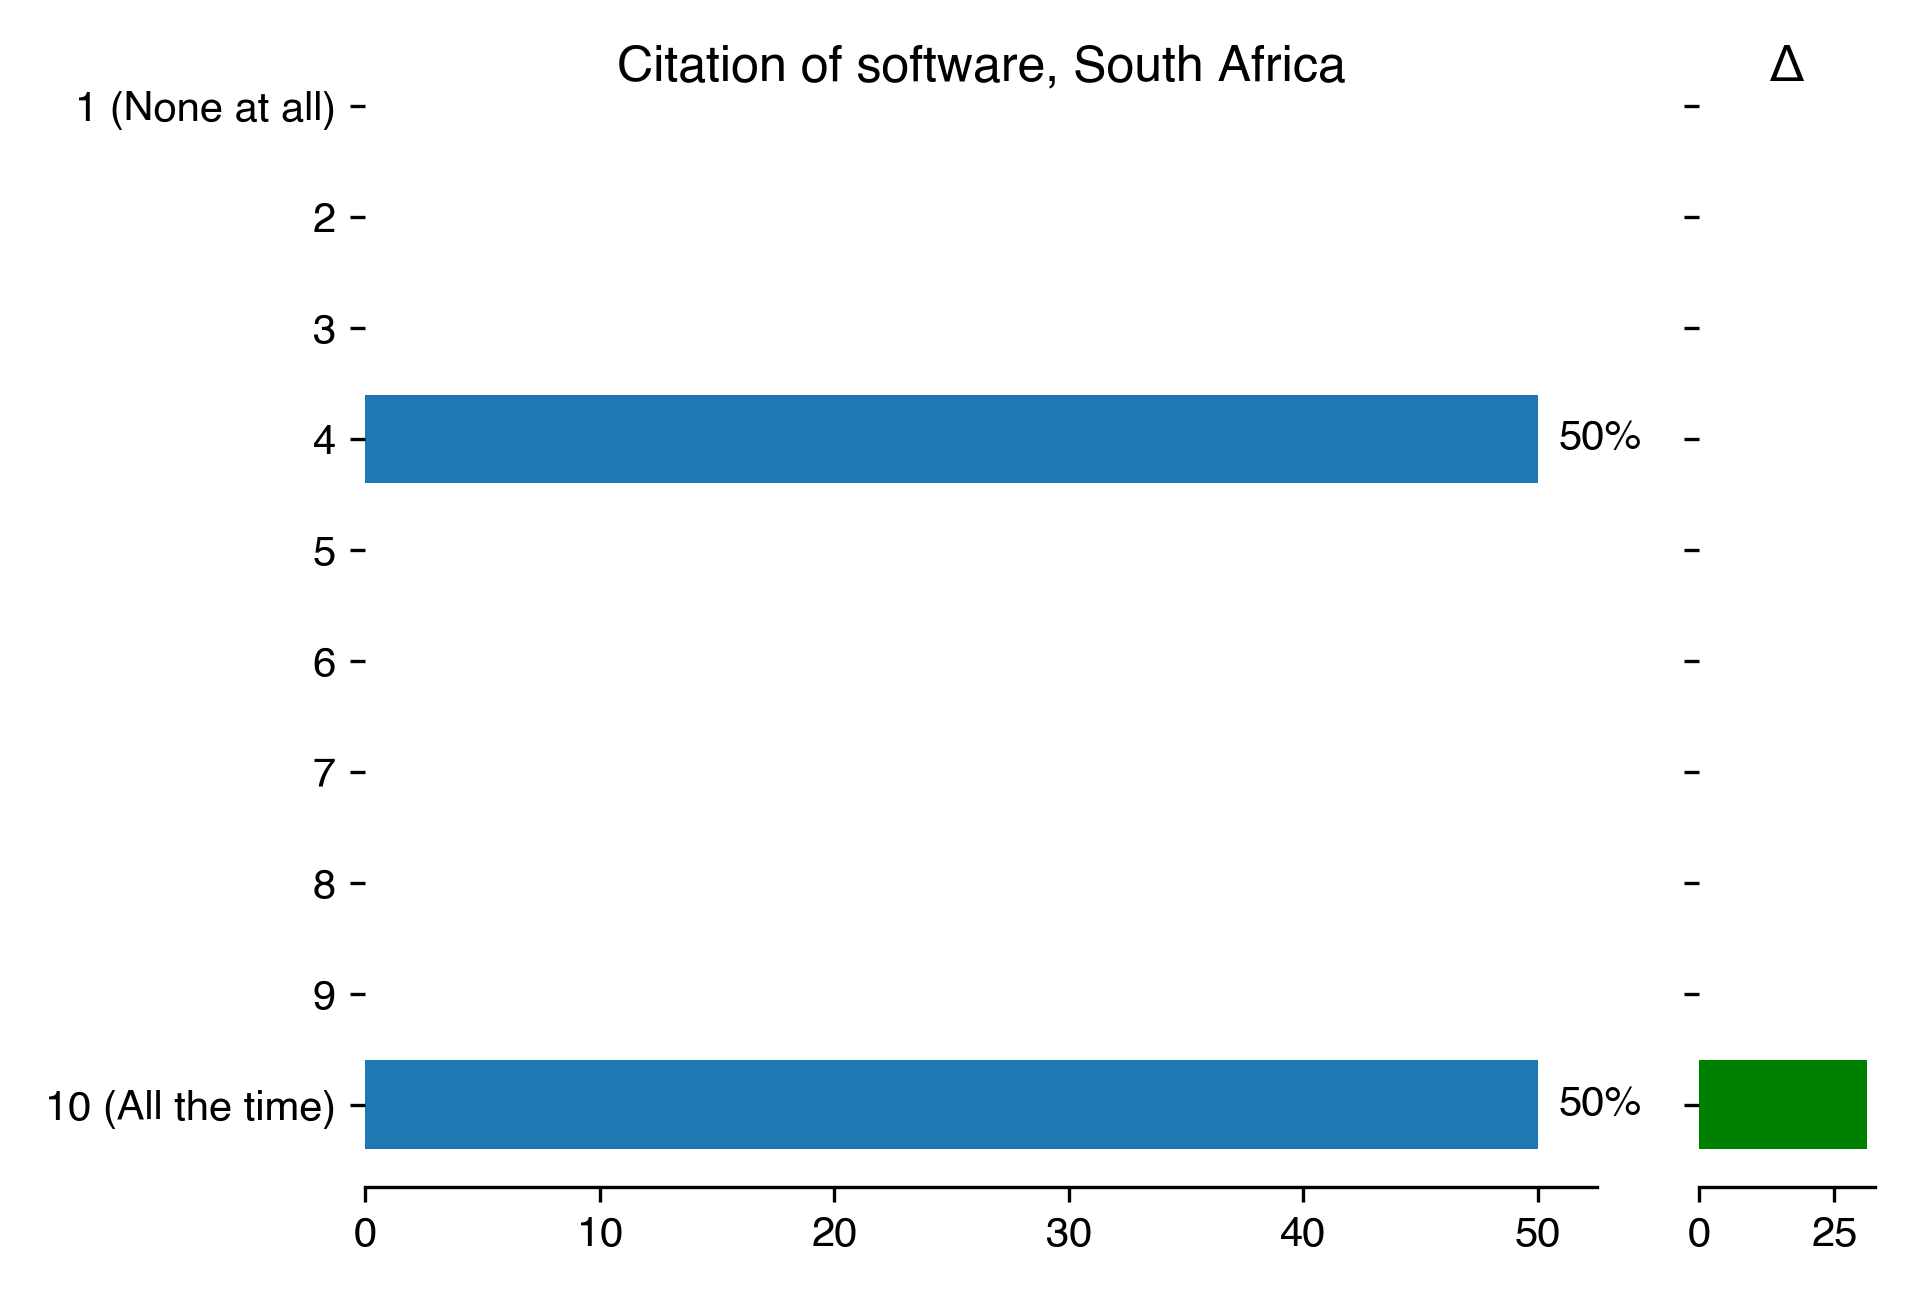
Citation of software for South Africa
Count
Percentage
Percentage in 2018
Difference with previous year
1 (None at all)
nan
nan
nan
nan
2
nan
nan
nan
nan
3
nan
nan
nan
nan
4
1
50
nan
nan
5
nan
nan
nan
nan
6
nan
nan
nan
nan
7
nan
nan
nan
nan
8
nan
nan
nan
nan
9
nan
nan
nan
nan
10 (All the time)
1
50
19.05
30.95
Download CSV
2022-08-22T11:29:20.957984
image/svg+xml
Matplotlib v3.5.2, https://matplotlib.org/
PNG SVG
Use of Digital Object Identifier for South Africa
Count
Percentage
1 (None at all)
nan
nan
2
nan
nan
3
nan
nan
4
nan
nan
5
nan
nan
6
nan
nan
7
nan
nan
8
nan
nan
9
nan
nan
10 (All the time)
nan
nan
Download CSV
2022-08-22T11:29:21.749750
image/svg+xml
Matplotlib v3.5.2, https://matplotlib.org/
PNG SVG
2022-08-22T11:29:21.876980
image/svg+xml
Matplotlib v3.5.2, https://matplotlib.org/
PNG SVG
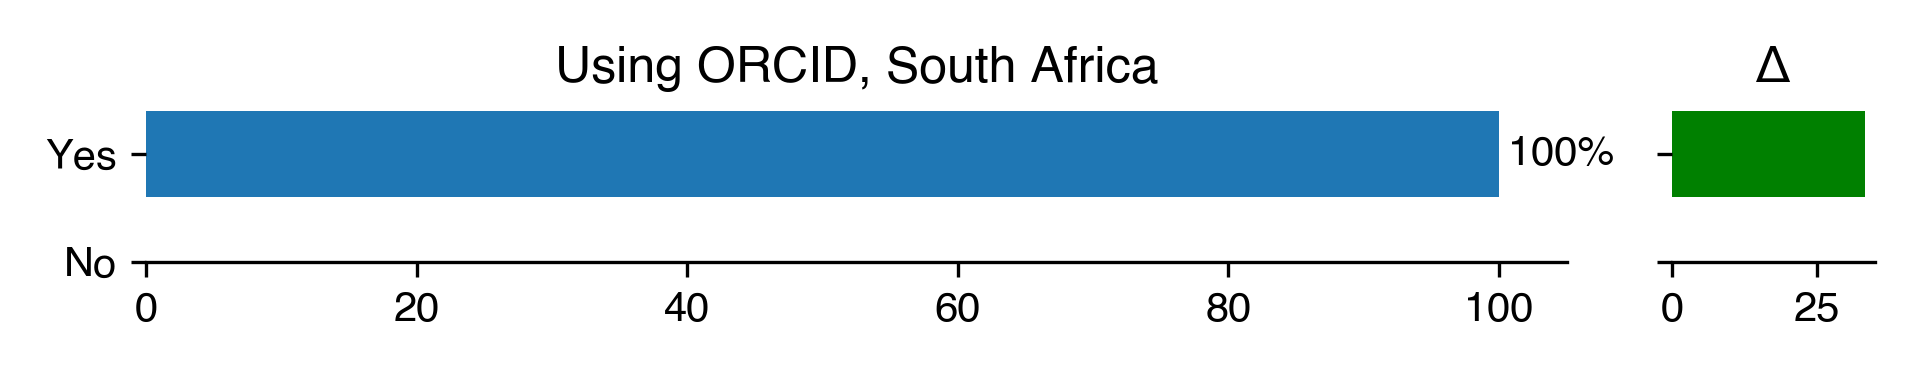
Using ORCID for South Africa
Count
Percentage
Percentage in 2018
Difference with previous year
Yes
2
100
66.67
33.33
No
nan
nan
14.29
nan
Download CSV
2022-08-22T11:29:22.090242
image/svg+xml
Matplotlib v3.5.2, https://matplotlib.org/
PNG SVG
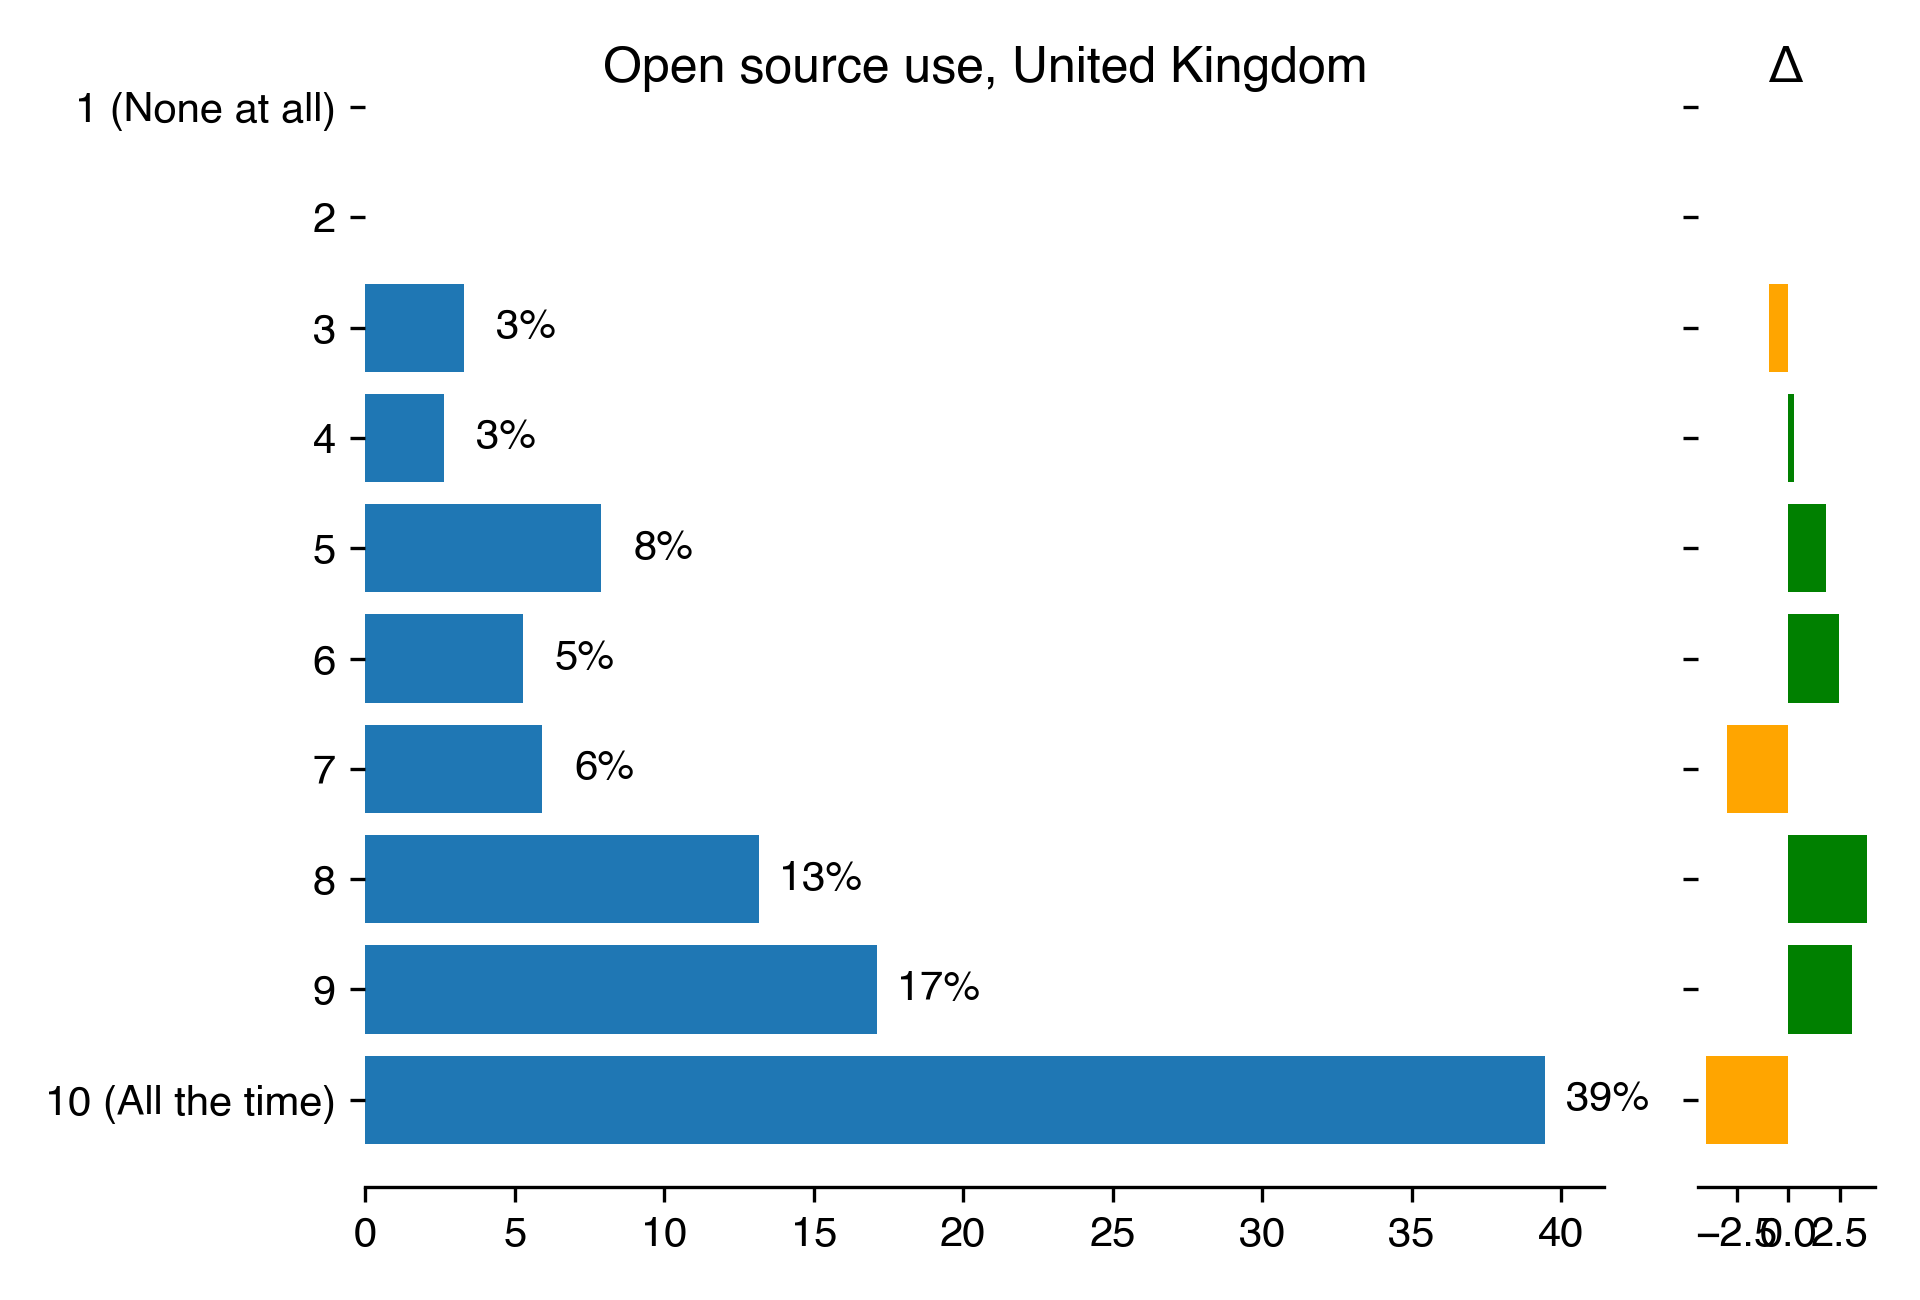
Open source use for United Kingdom
Count
Percentage
Percentage in 2018
Difference with previous year
1 (None at all)
nan
nan
nan
nan
2
nan
nan
nan
nan
3
5
3.29
4.21
-0.92
4
4
2.63
2.34
0.3
5
12
7.89
6.07
1.82
6
8
5.26
2.8
2.46
7
9
5.92
8.88
-2.96
8
20
13.16
9.35
3.81
9
26
17.11
14.02
3.09
10 (All the time)
60
39.47
43.46
-3.98
Download CSV
2022-08-22T11:29:22.588837
image/svg+xml
Matplotlib v3.5.2, https://matplotlib.org/
PNG SVG
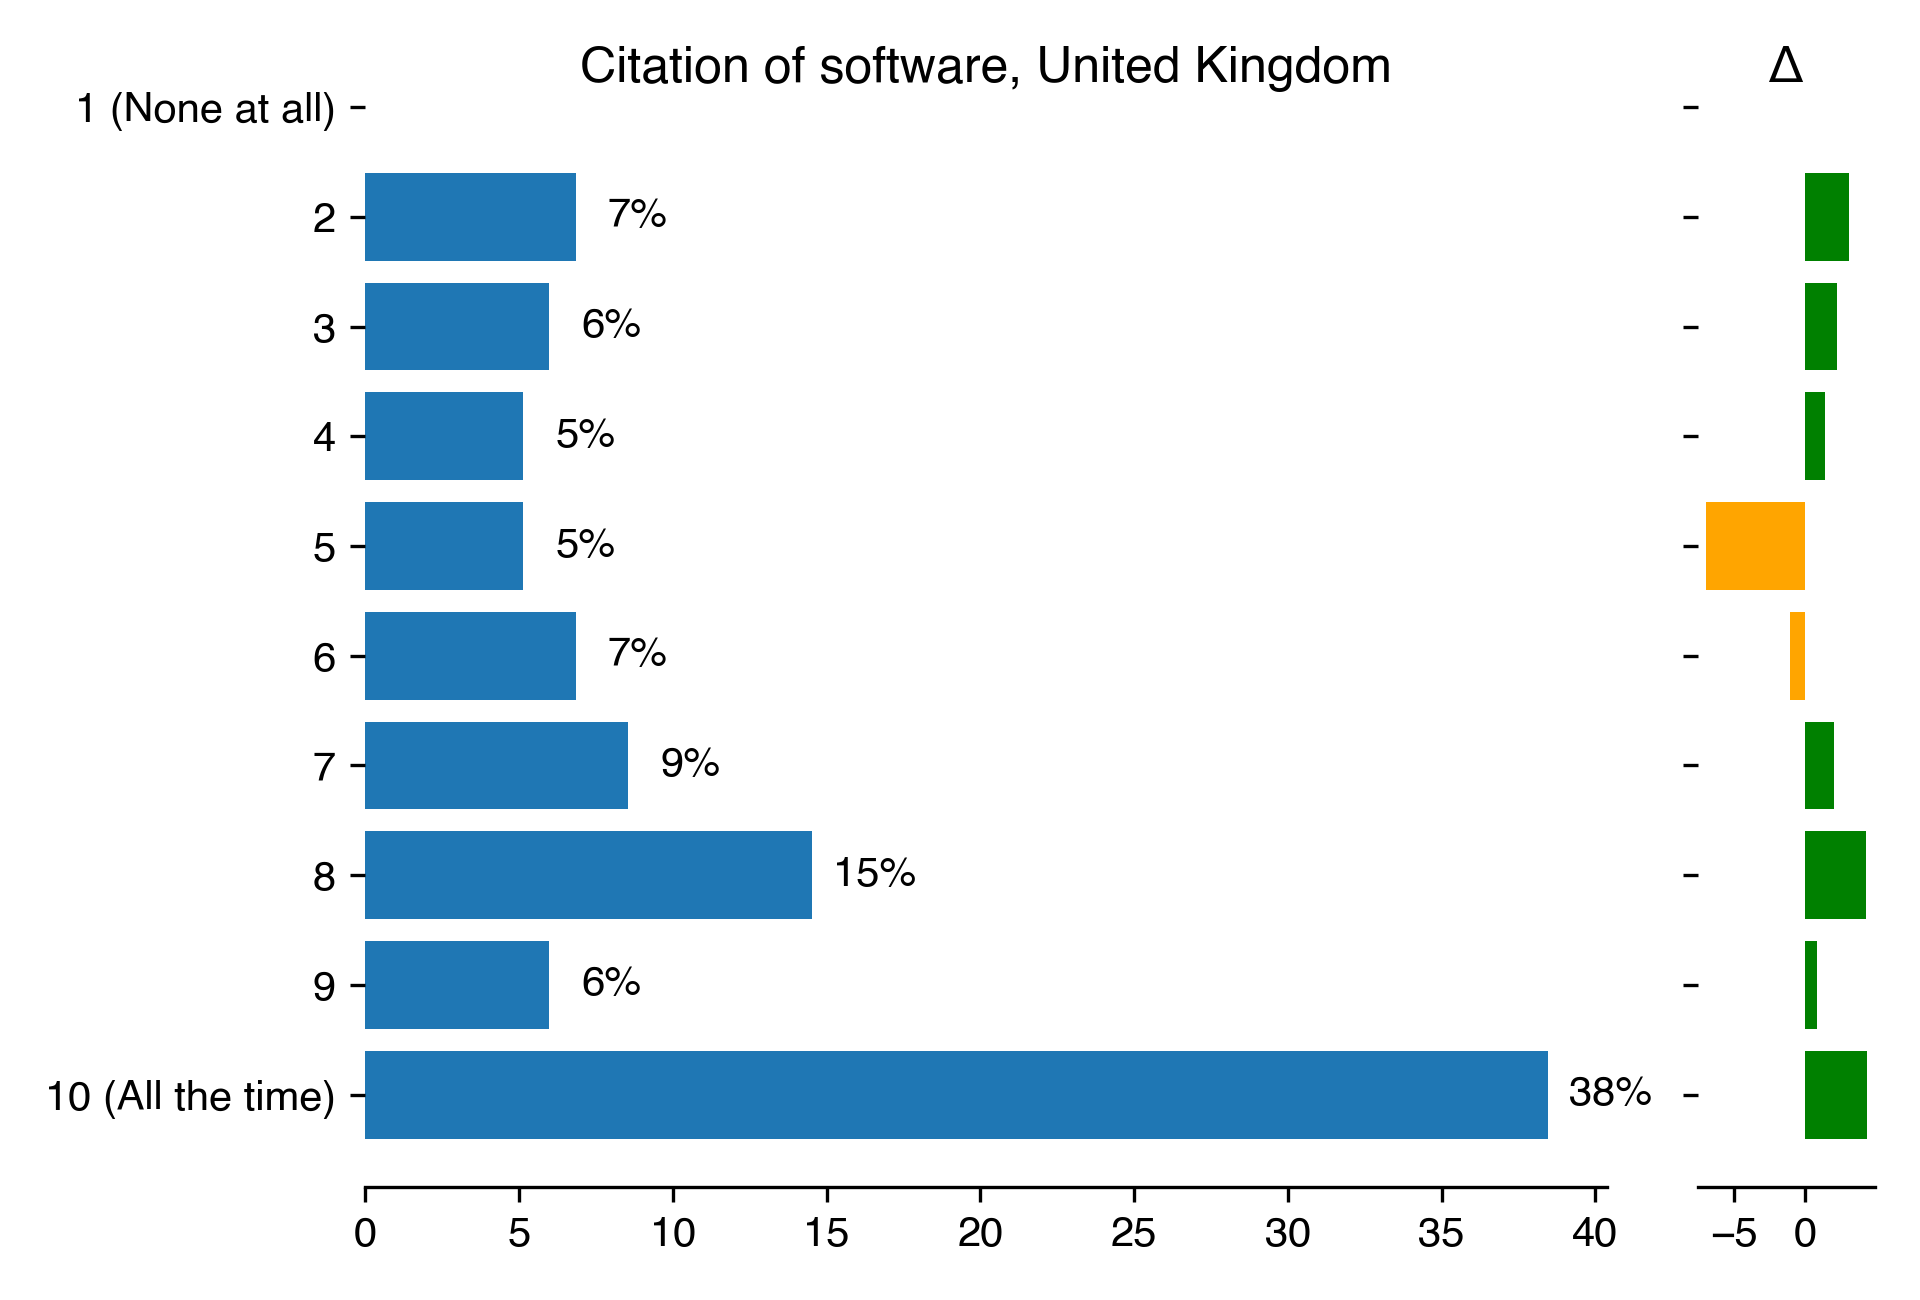
Citation of software for United Kingdom
Count
Percentage
Percentage in 2018
Difference with previous year
1 (None at all)
nan
nan
nan
nan
2
8
6.84
3.74
3.1
3
7
5.98
3.74
2.24
4
6
5.13
3.74
1.39
5
6
5.13
12.15
-7.02
6
8
6.84
7.94
-1.11
7
10
8.55
6.54
2
8
17
14.53
10.28
4.25
9
7
5.98
5.14
0.84
10 (All the time)
45
38.46
34.11
4.35
Download CSV
2022-08-22T11:29:24.668770
image/svg+xml
Matplotlib v3.5.2, https://matplotlib.org/
PNG SVG
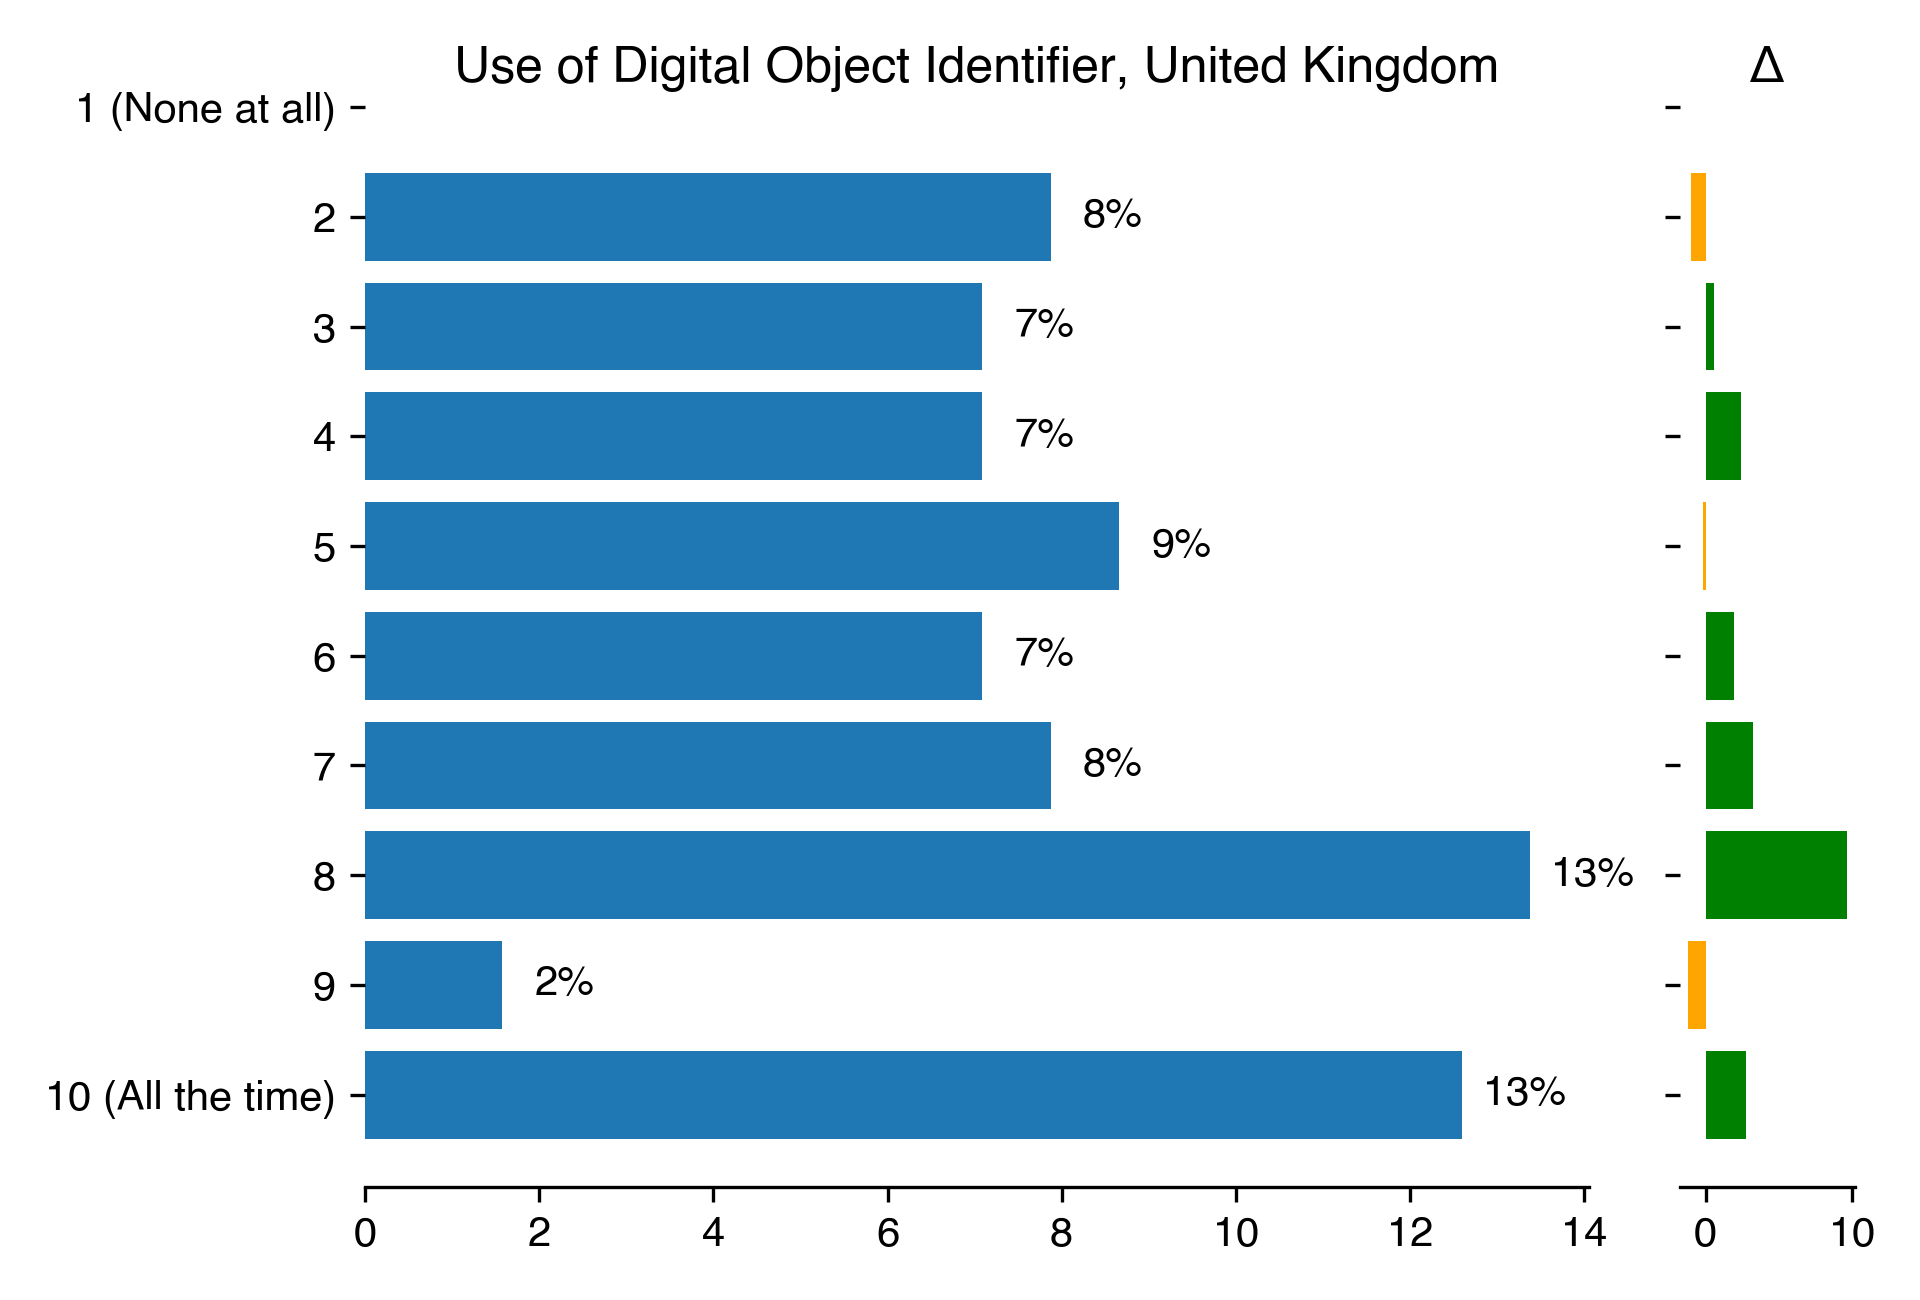
Use of Digital Object Identifier for United Kingdom
Count
Percentage
Percentage in 2018
Difference with previous year
1 (None at all)
nan
nan
nan
nan
2
10
7.87
8.88
-1
3
9
7.09
6.54
0.54
4
9
7.09
4.67
2.41
5
11
8.66
8.88
-0.22
6
9
7.09
5.14
1.95
7
10
7.87
4.67
3.2
8
17
13.39
3.74
9.65
9
2
1.57
2.8
-1.23
10 (All the time)
16
12.6
9.81
2.79
Download CSV
2022-08-22T11:29:26.893545
image/svg+xml
Matplotlib v3.5.2, https://matplotlib.org/
PNG SVG
2022-08-22T11:29:27.931837
image/svg+xml
Matplotlib v3.5.2, https://matplotlib.org/
PNG SVG
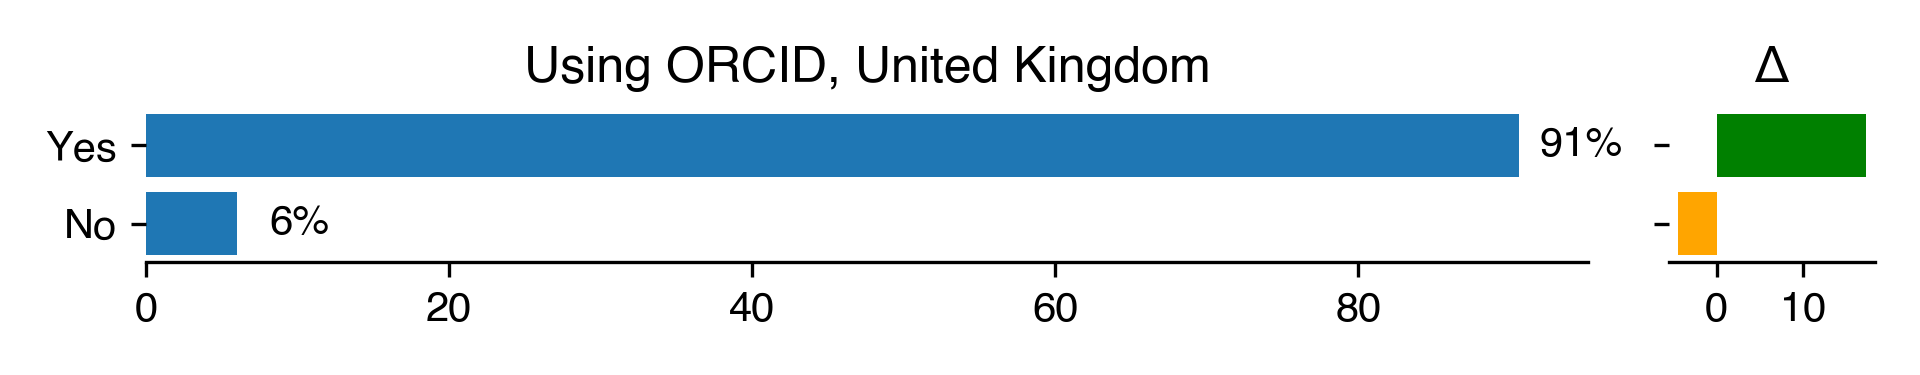
Using ORCID for United Kingdom
Count
Percentage
Percentage in 2018
Difference with previous year
Yes
135
90.6
73.33
17.27
No
9
6.04
10.48
-4.44
Download CSV
2022-08-22T11:29:28.505912
image/svg+xml
Matplotlib v3.5.2, https://matplotlib.org/
PNG SVG
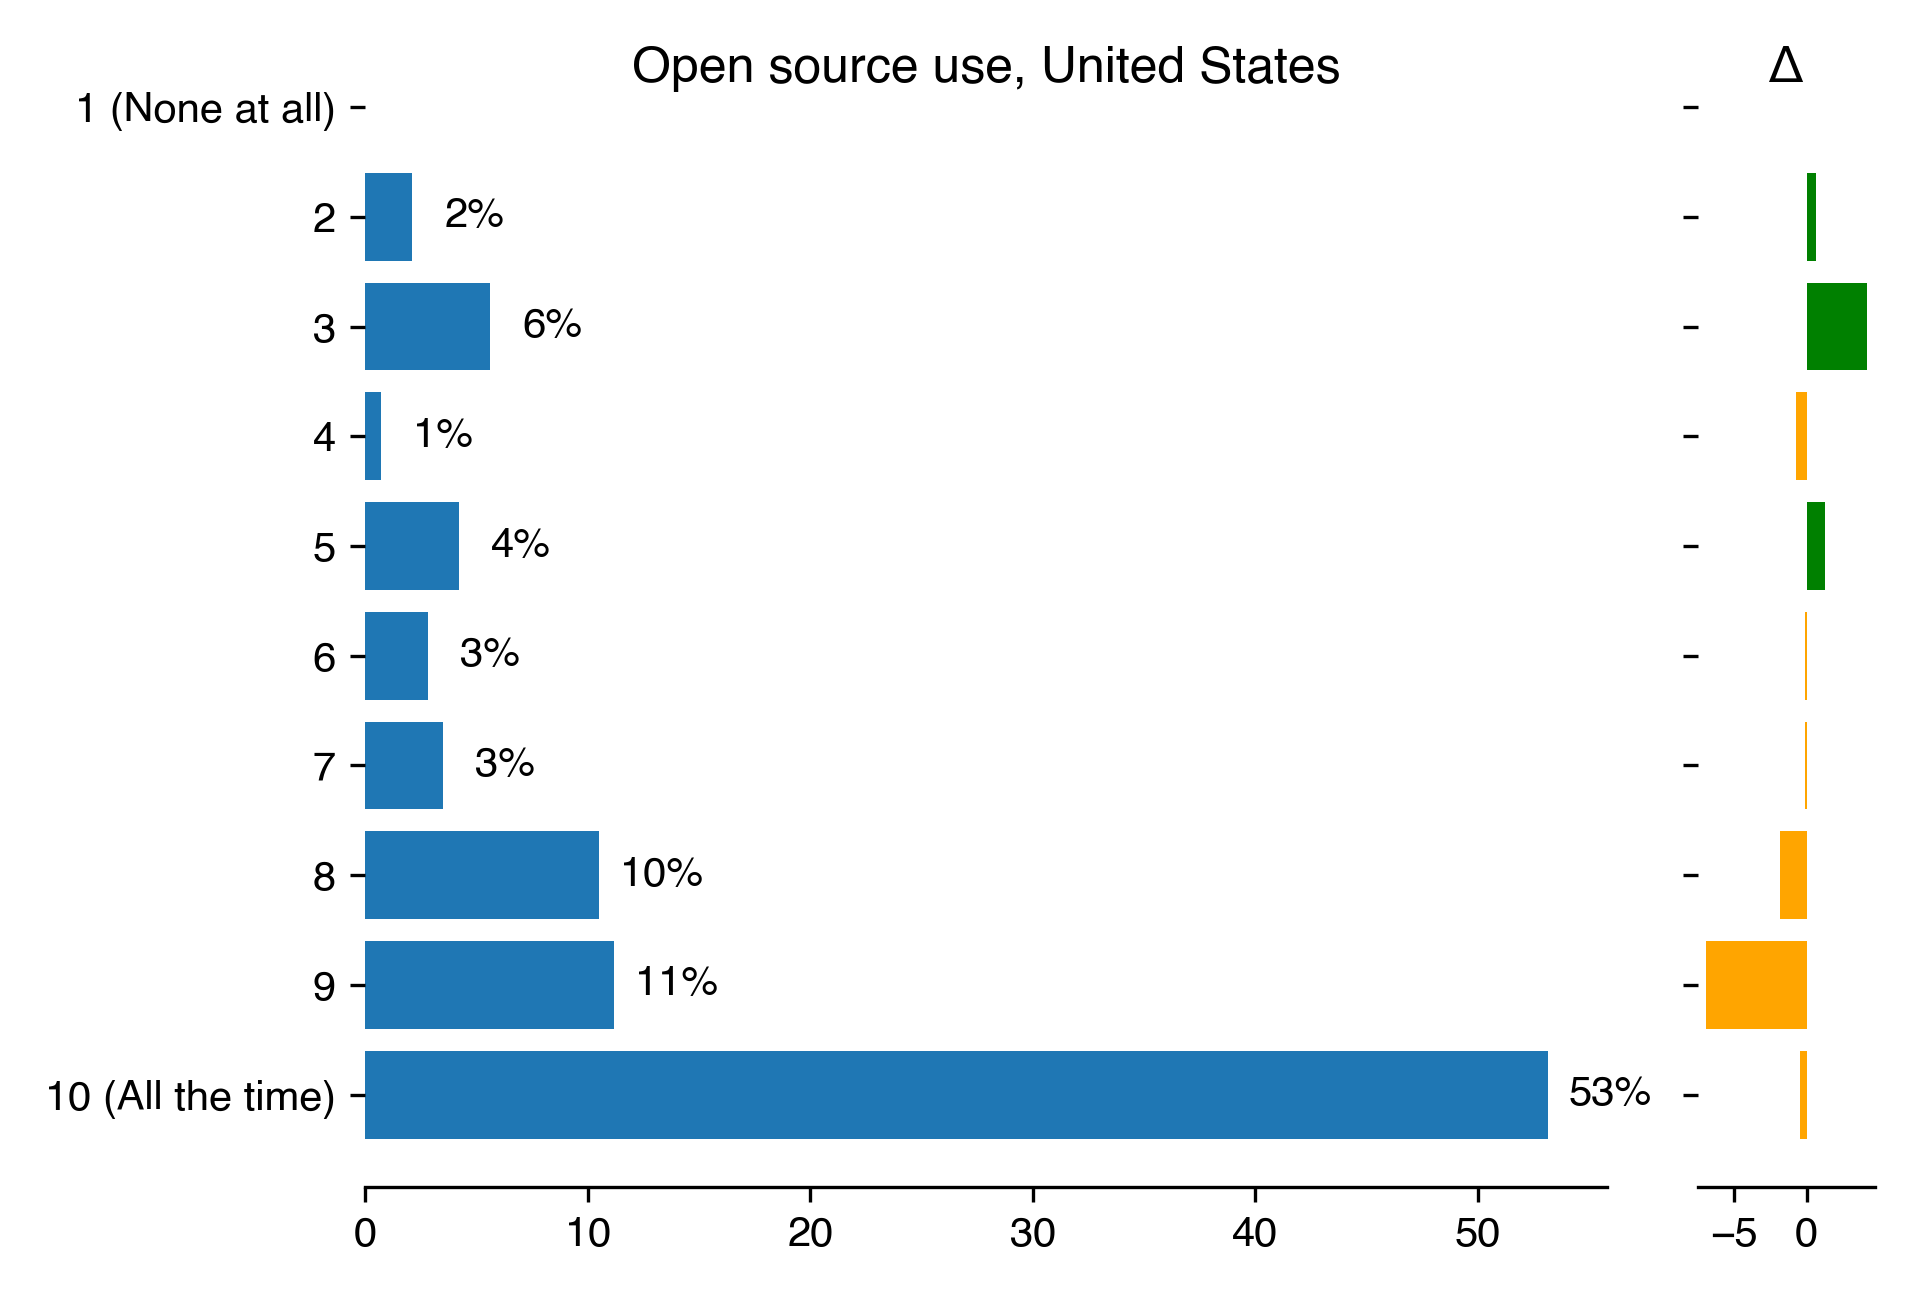
Open source use for United States
Count
Percentage
Percentage in 2018
Difference with previous year
1 (None at all)
nan
nan
nan
nan
2
3
2.1
1.45
0.65
3
8
5.59
1.45
4.15
4
1
0.7
1.45
-0.75
5
6
4.2
2.9
1.3
6
4
2.8
2.9
-0.1
7
5
3.5
3.62
-0.13
8
15
10.49
12.32
-1.83
9
16
11.19
18.12
-6.93
10 (All the time)
76
53.15
53.62
-0.48
Download CSV
2022-08-22T11:29:28.966809
image/svg+xml
Matplotlib v3.5.2, https://matplotlib.org/
PNG SVG
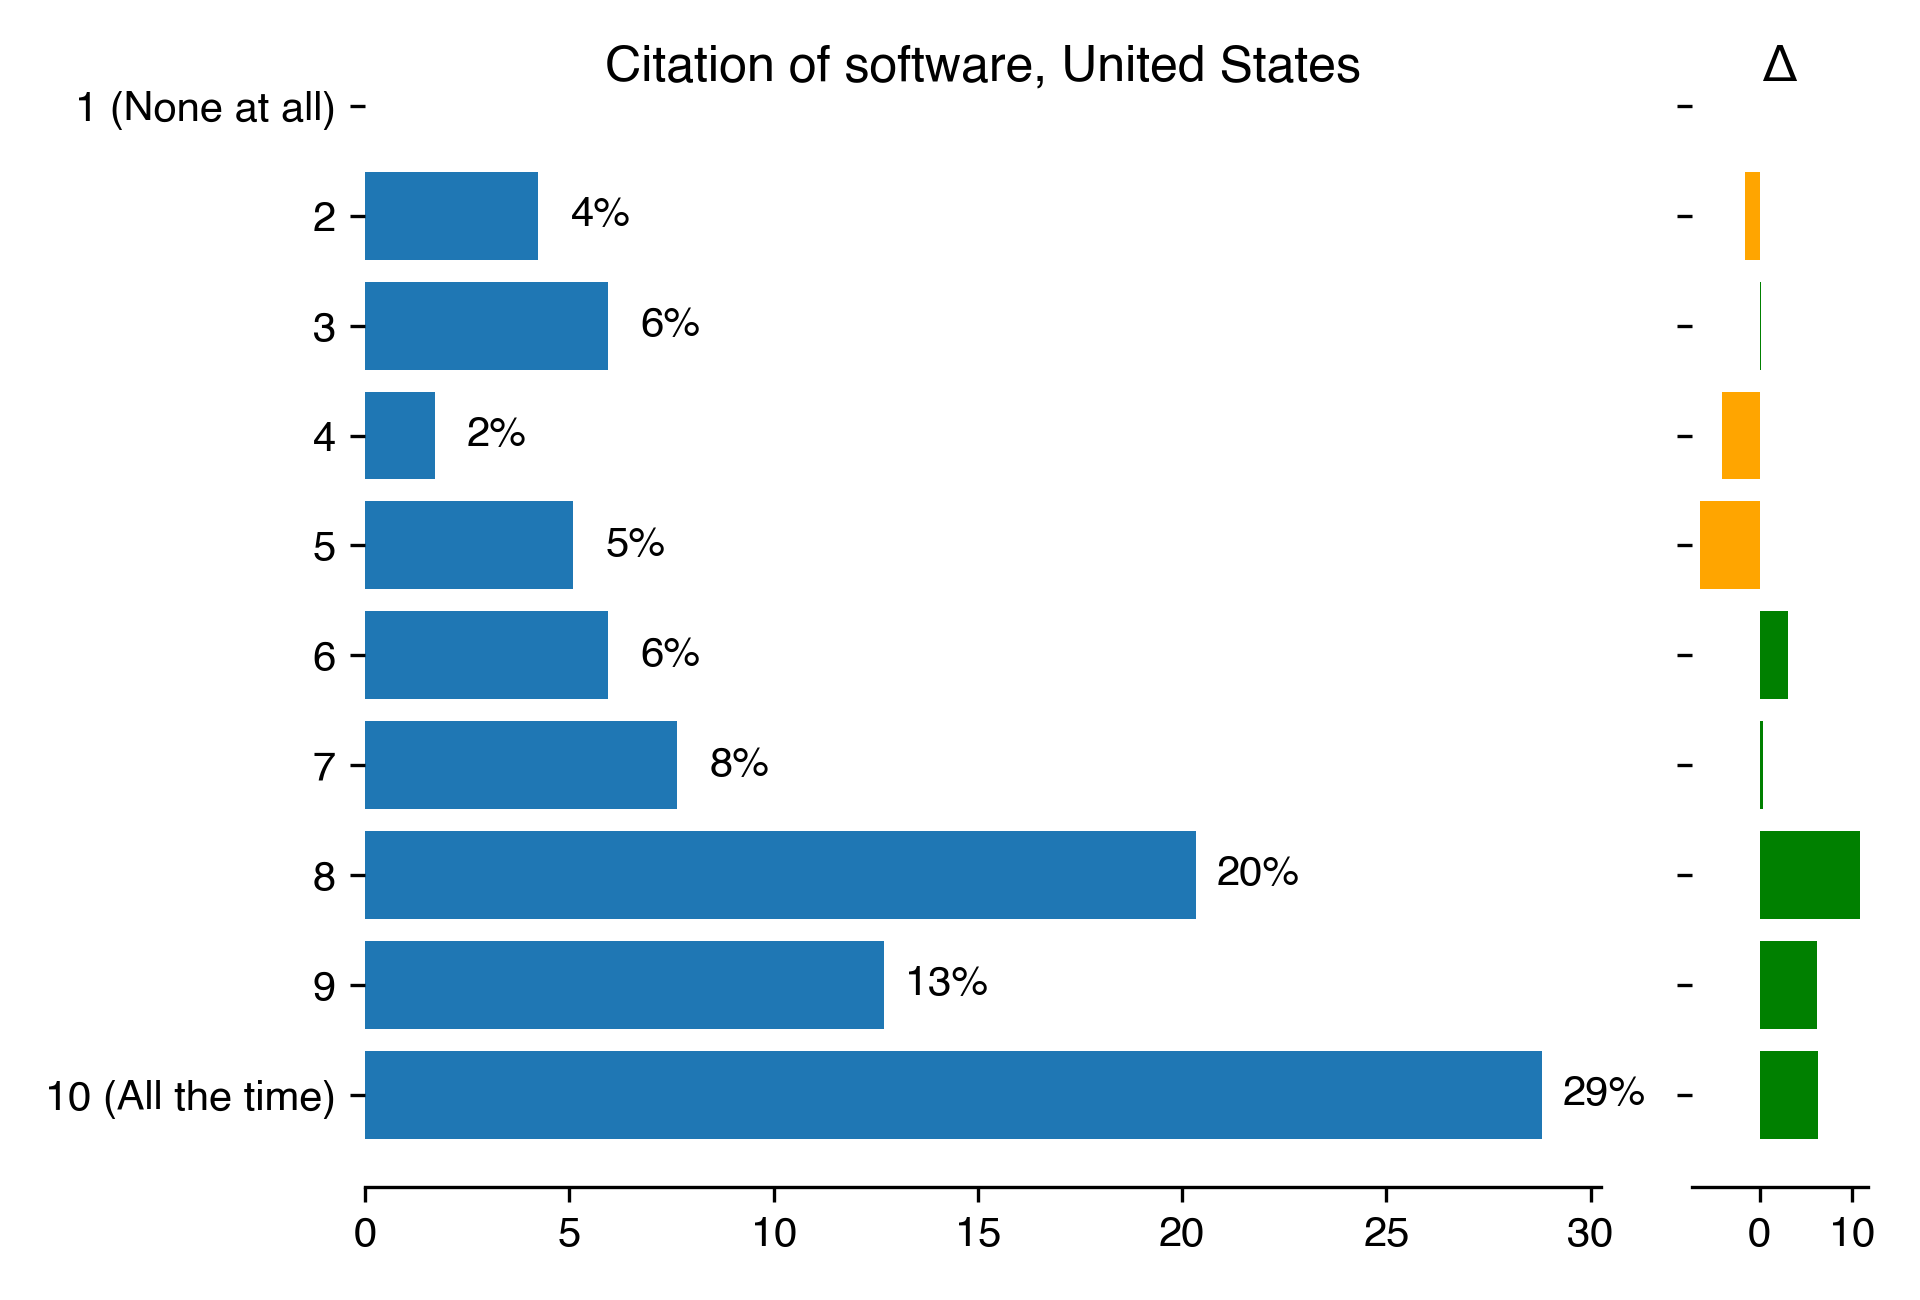
Citation of software for United States
Count
Percentage
Percentage in 2018
Difference with previous year
1 (None at all)
nan
nan
nan
nan
2
5
4.24
5.8
-1.56
3
7
5.93
5.8
0.14
4
2
1.69
5.8
-4.1
5
6
5.08
11.59
-6.51
6
7
5.93
2.9
3.03
7
9
7.63
7.25
0.38
8
24
20.34
9.42
10.92
9
15
12.71
6.52
6.19
10 (All the time)
34
28.81
22.46
6.35
Download CSV
2022-08-22T11:29:31.270103
image/svg+xml
Matplotlib v3.5.2, https://matplotlib.org/
PNG SVG
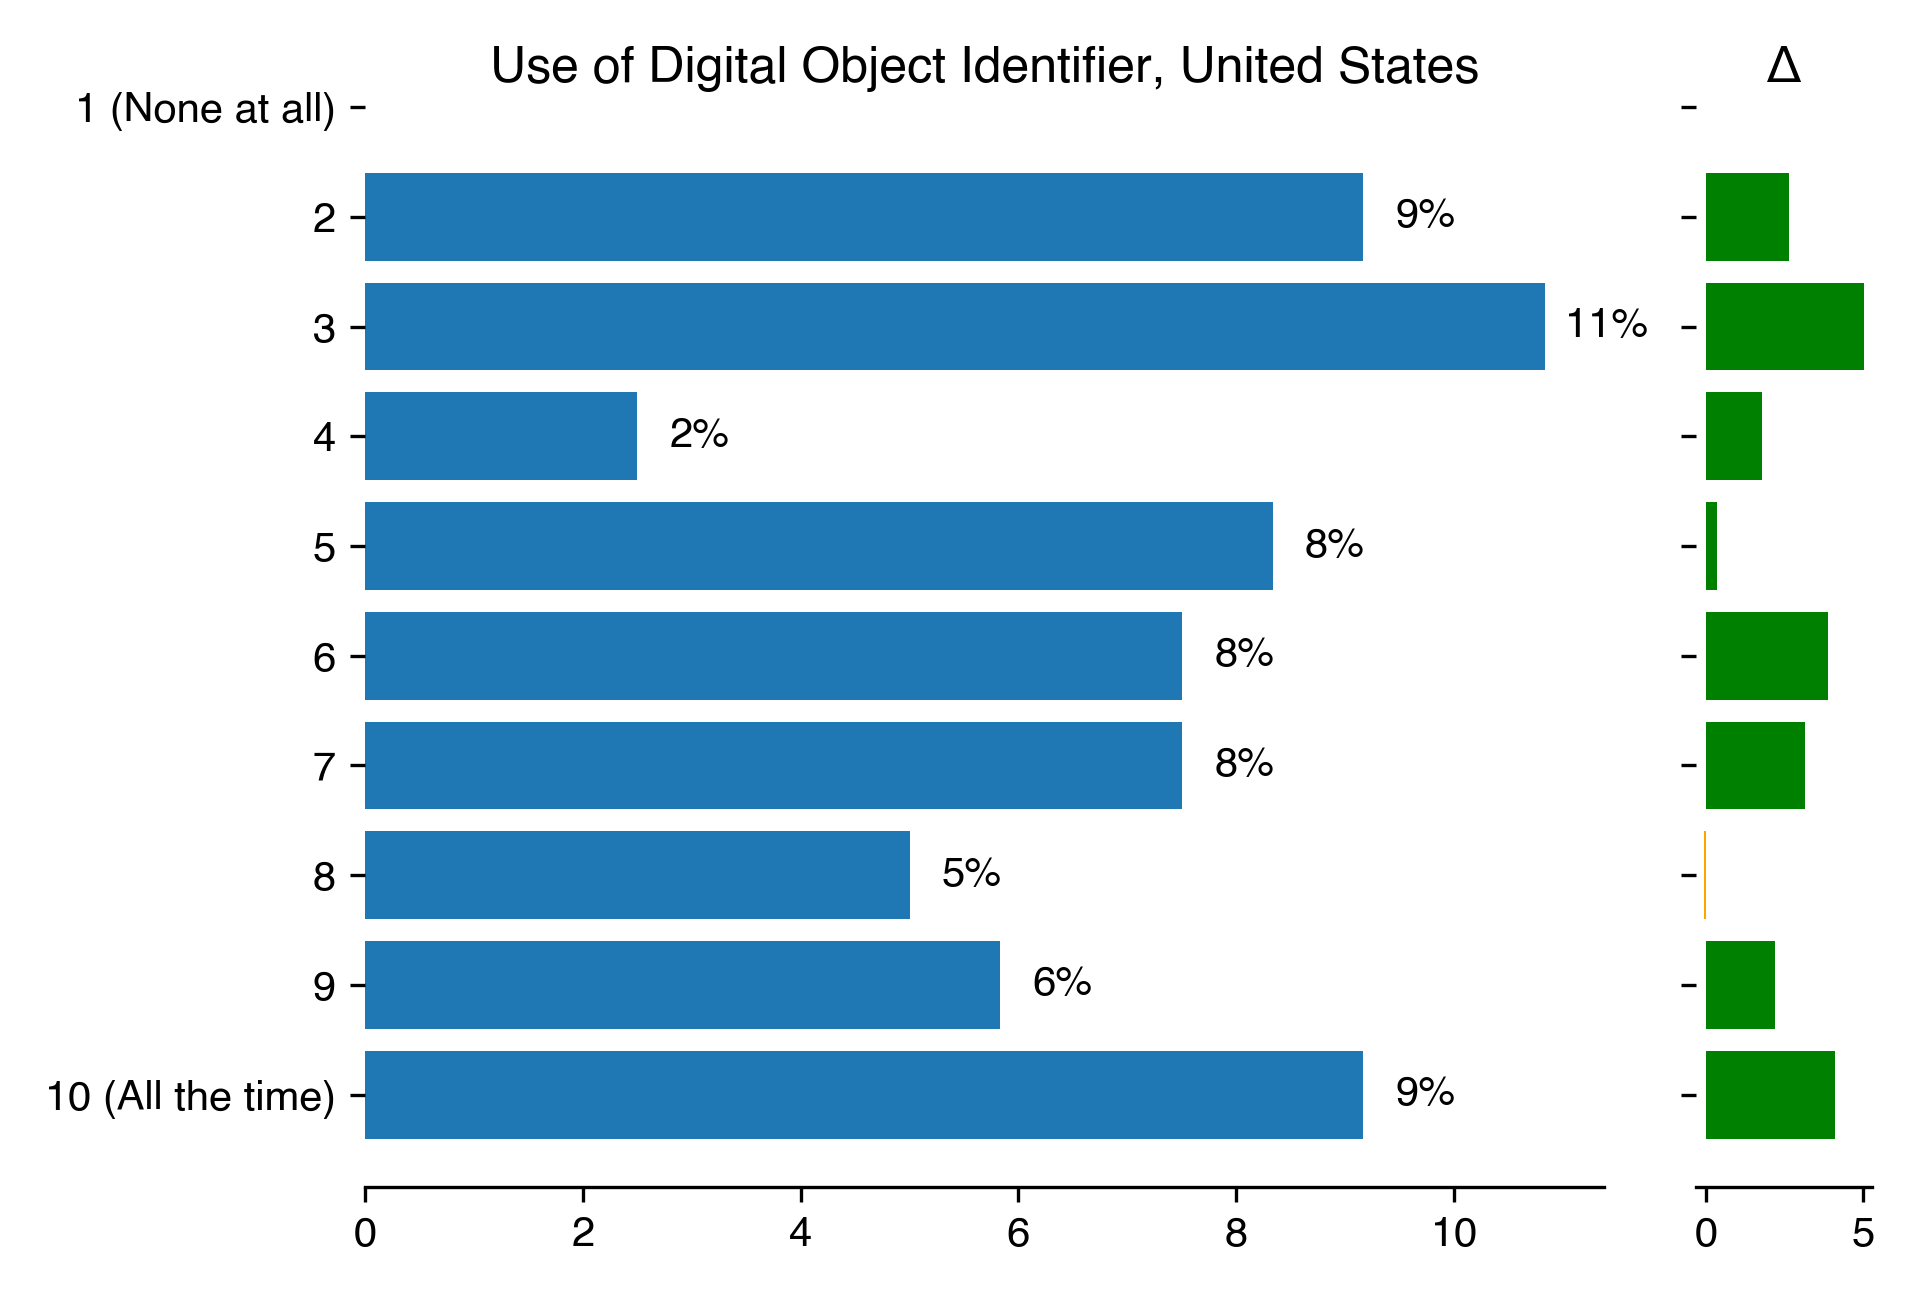
Use of Digital Object Identifier for United States
Count
Percentage
Percentage in 2018
Difference with previous year
1 (None at all)
nan
nan
nan
nan
2
11
9.17
6.52
2.64
3
13
10.83
5.8
5.04
4
3
2.5
0.72
1.78
5
10
8.33
7.97
0.36
6
9
7.5
3.62
3.88
7
9
7.5
4.35
3.15
8
6
5
5.07
-0.07
9
7
5.83
3.62
2.21
10 (All the time)
11
9.17
5.07
4.09
Download CSV
2022-08-22T11:29:33.482217
image/svg+xml
Matplotlib v3.5.2, https://matplotlib.org/
PNG SVG
2022-08-22T11:29:34.626621
image/svg+xml
Matplotlib v3.5.2, https://matplotlib.org/
PNG SVG
Using ORCID for United States
Count
Percentage
Percentage in 2018
Difference with previous year
Yes
115
82.73
60.9
21.83
No
18
12.95
14.29
-1.34
Download CSV
2022-08-22T11:29:35.242857
image/svg+xml
Matplotlib v3.5.2, https://matplotlib.org/
PNG SVG
Open source use for World
Count
Percentage
Percentage in 2018
Difference with previous year
1 (None at all)
nan
nan
nan
nan
2
24
2.83
3.92
-1.09
3
29
3.42
4.14
-0.72
4
13
1.53
2.24
-0.71
5
40
4.72
5.04
-0.32
6
25
2.95
3.02
-0.08
7
37
4.36
5.49
-1.12
8
92
10.85
8.85
2
9
102
12.03
11.87
0.16
10 (All the time)
417
49.17
43.45
5.73
Download CSV
2022-08-22T11:29:35.804180
image/svg+xml
Matplotlib v3.5.2, https://matplotlib.org/
PNG SVG
Citation of software for World
Count
Percentage
Percentage in 2018
Difference with previous year
1 (None at all)
nan
nan
nan
nan
2
27
3.82
6.57
-2.75
3
32
4.53
5.89
-1.36
4
28
3.96
4.3
-0.34
5
46
6.51
9.63
-3.12
6
27
3.82
5.1
-1.28
7
66
9.34
6.34
2.99
8
98
13.86
9.74
4.12
9
70
9.9
5.78
4.13
10 (All the time)
253
35.79
27.63
8.15
Download CSV
2022-08-22T11:29:38.092652
image/svg+xml
Matplotlib v3.5.2, https://matplotlib.org/
PNG SVG
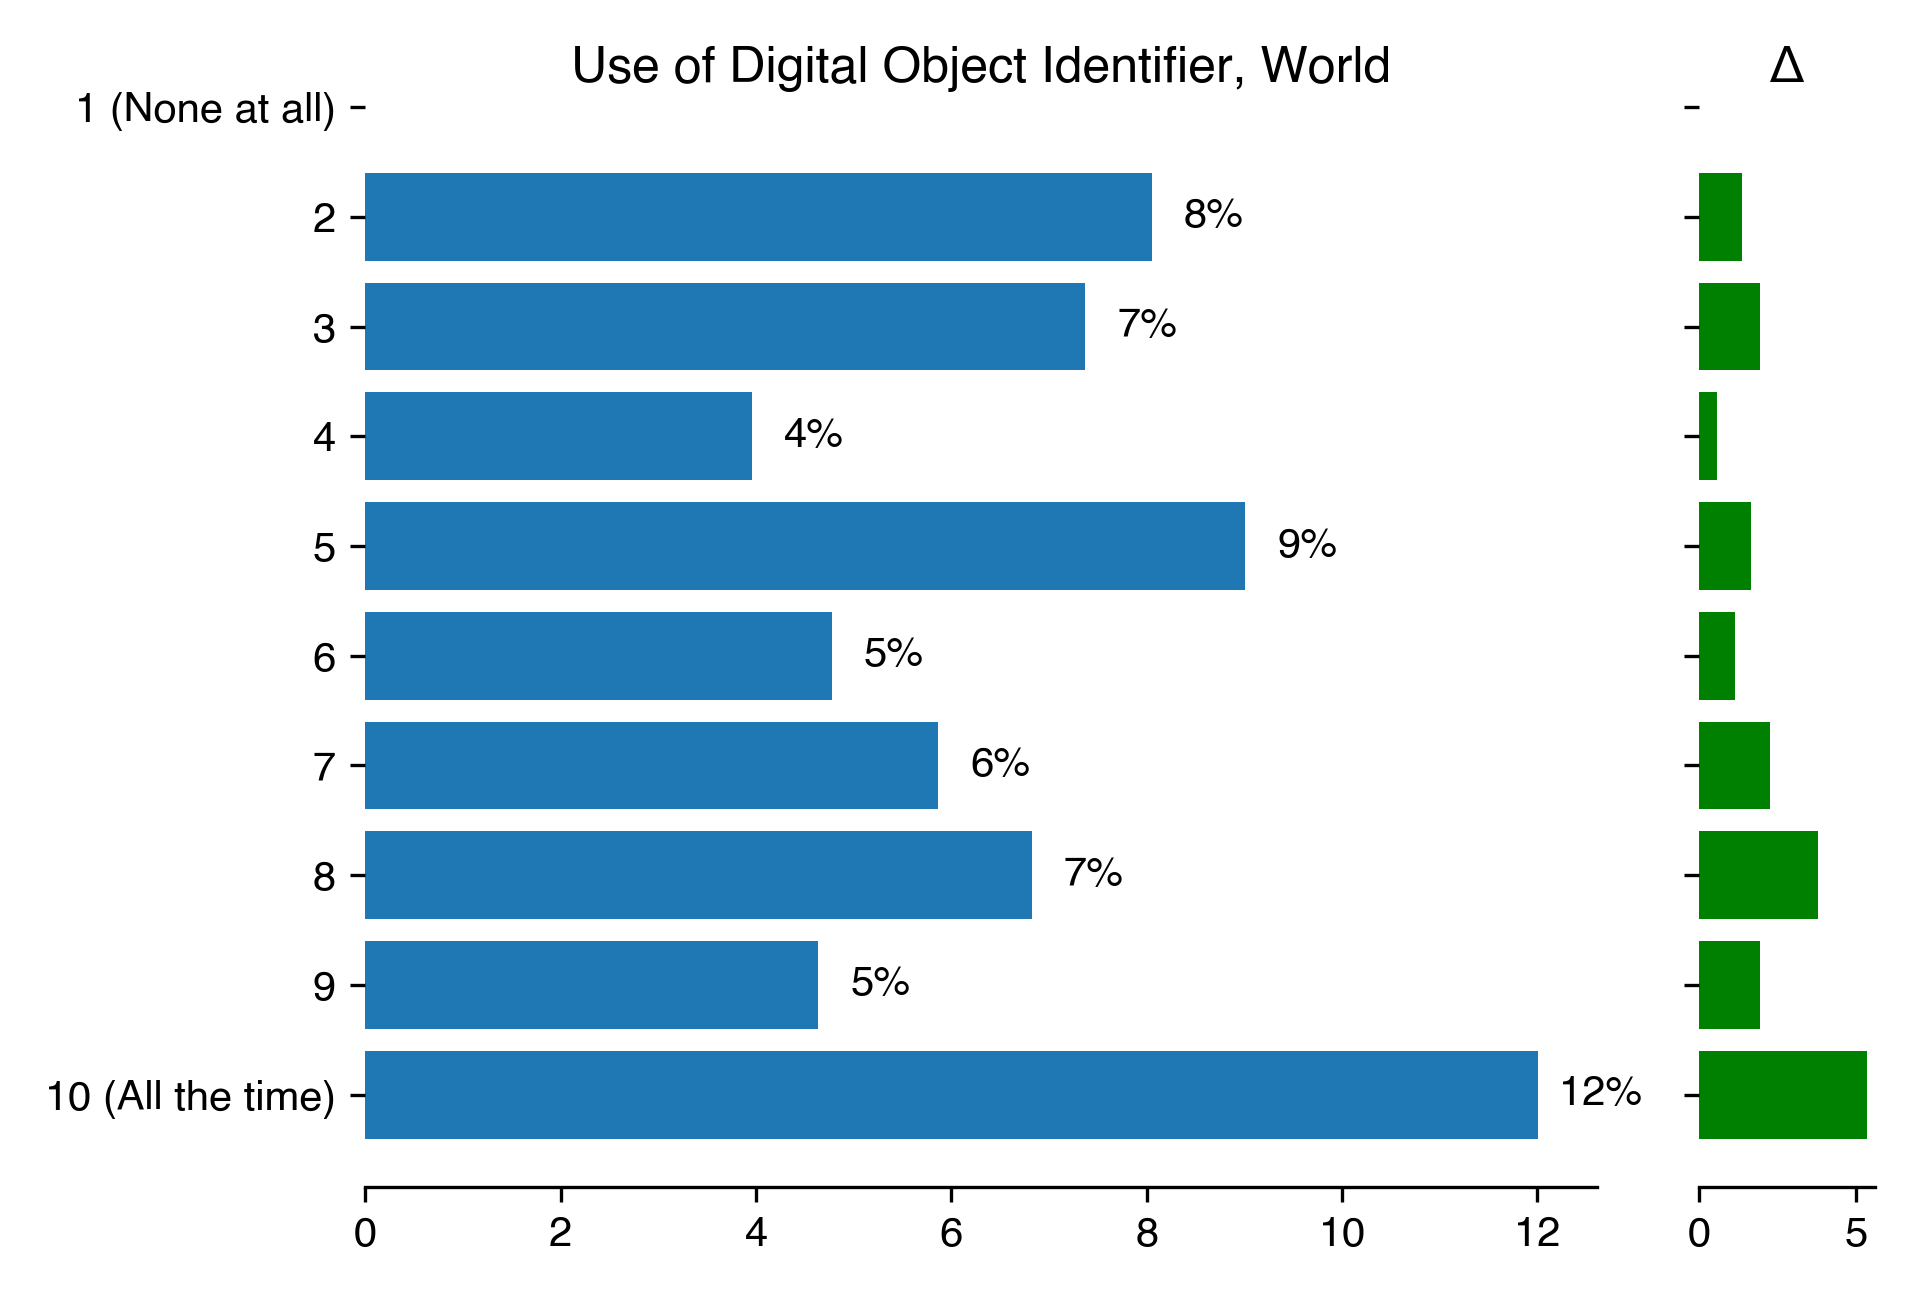
Use of Digital Object Identifier for World
Count
Percentage
Percentage in 2018
Difference with previous year
1 (None at all)
nan
nan
nan
nan
2
59
8.05
6.68
1.37
3
54
7.37
5.44
1.93
4
29
3.96
3.4
0.56
5
66
9
7.36
1.64
6
35
4.77
3.62
1.15
7
43
5.87
3.62
2.24
8
50
6.82
3.06
3.76
9
34
4.64
2.72
1.92
10 (All the time)
88
12.01
6.68
5.32
Download CSV
2022-08-22T11:29:40.369974
image/svg+xml
Matplotlib v3.5.2, https://matplotlib.org/
PNG SVG
2022-08-22T11:29:41.515397
image/svg+xml
Matplotlib v3.5.2, https://matplotlib.org/
PNG SVG
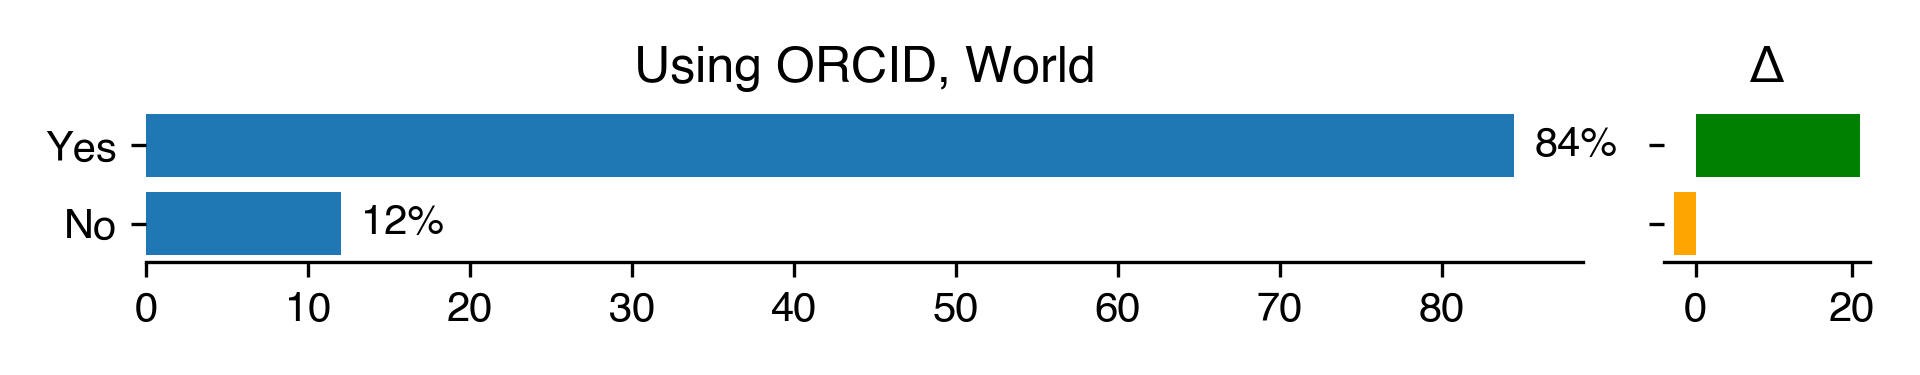
Using ORCID for World
Count
Percentage
Percentage in 2018
Difference with previous year
Yes
696
84.47
63.36
21.11
No
99
12.01
14.84
-2.83
Download CSV
2022-08-22T11:29:42.105889
image/svg+xml
Matplotlib v3.5.2, https://matplotlib.org/
PNG SVG