Australia Canada Germany Netherlands New Zealand South Africa United Kingdom United States World
Here we asked questions to know the sociodemographic composition of our participants, including the age, the gender and the disability and ethnicity for specific countries.
Questions in this section:
Please select your age (one choice)
What best describes your gender (one choice)
Do you have a condition that is defined as a disability by your country? (yes-no)
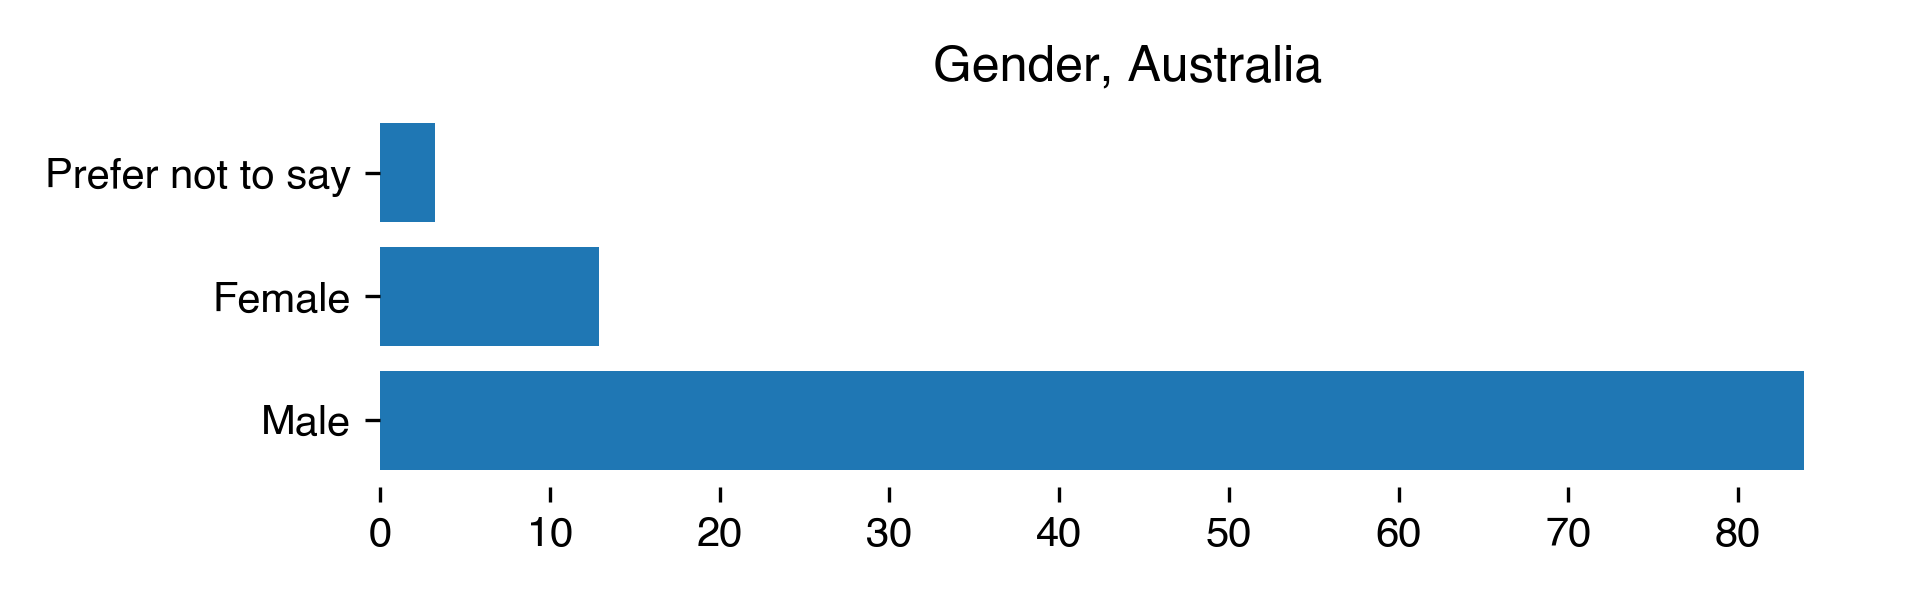
Gender for Australia
Count
Percentage
Male
26
83.87
Female
4
12.9
Prefer not to say
1
3.23
Download CSV
2022-08-22T11:23:04.716909
image/svg+xml
Matplotlib v3.5.2, https://matplotlib.org/
PNG SVG
No data found in survey.
2022-08-22T11:23:04.900518
image/svg+xml
Matplotlib v3.5.2, https://matplotlib.org/
PNG SVG
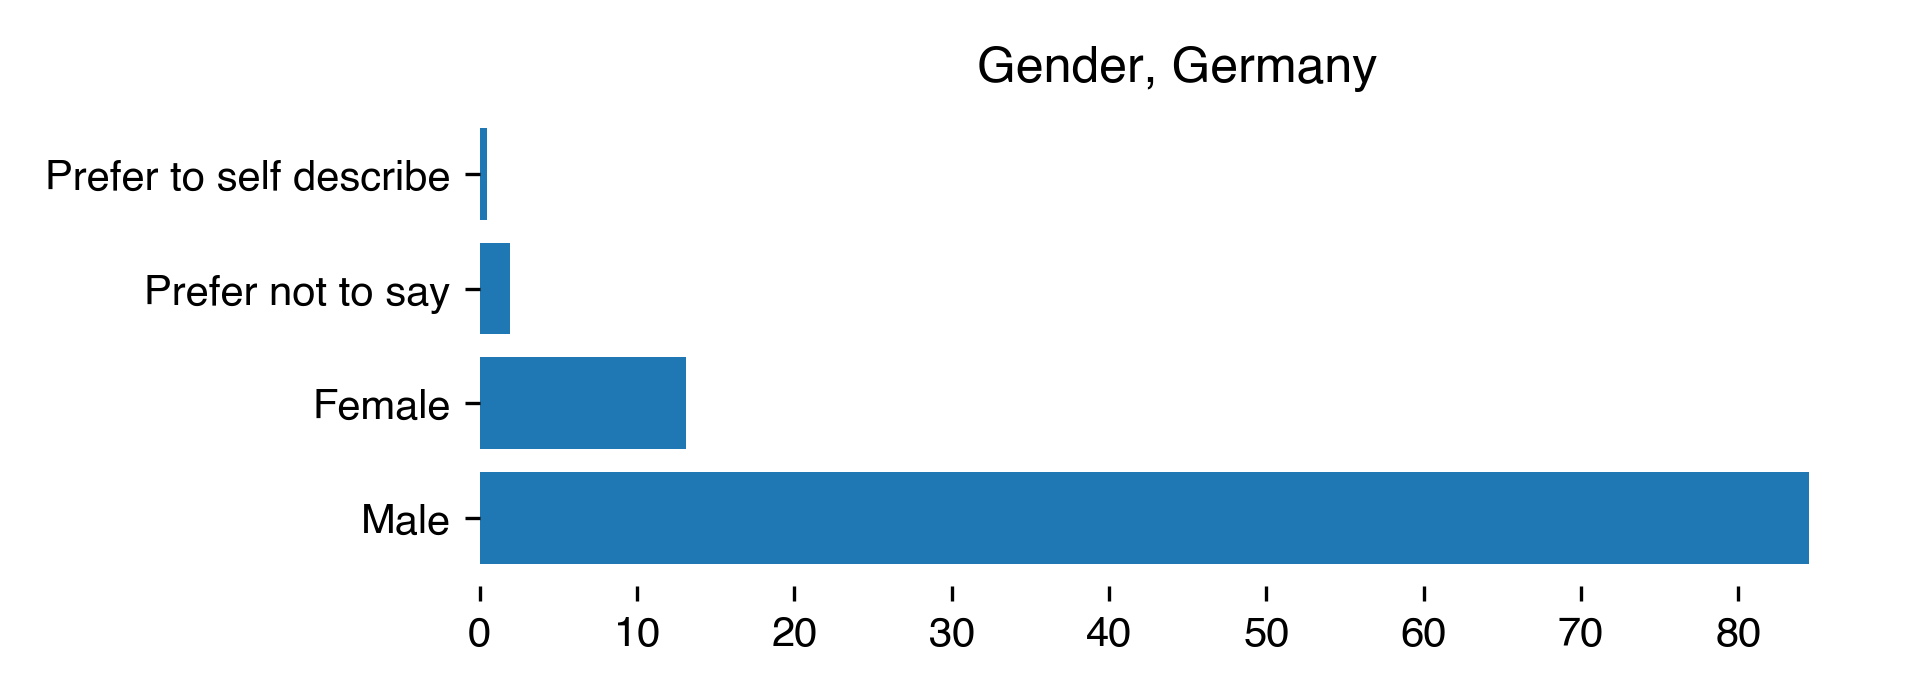
Gender for Germany
Count
Percentage
Male
174
84.47
Female
27
13.11
Prefer not to say
4
1.94
Prefer to self describe
1
0.49
Download CSV
2022-08-22T11:23:05.160143
image/svg+xml
Matplotlib v3.5.2, https://matplotlib.org/
PNG SVG
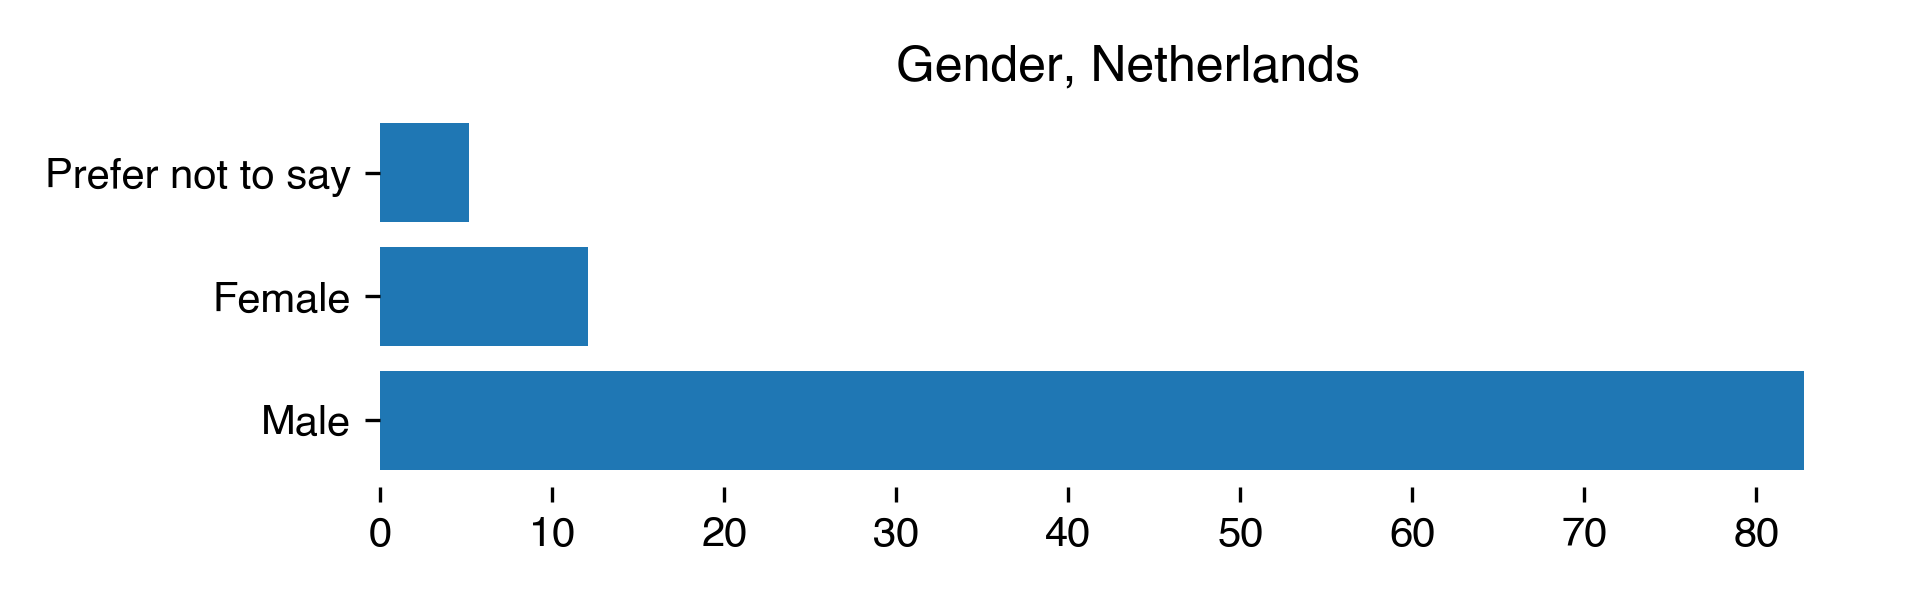
Gender for Netherlands
Count
Percentage
Male
48
82.76
Female
7
12.07
Prefer not to say
3
5.17
Download CSV
2022-08-22T11:23:05.414014
image/svg+xml
Matplotlib v3.5.2, https://matplotlib.org/
PNG SVG
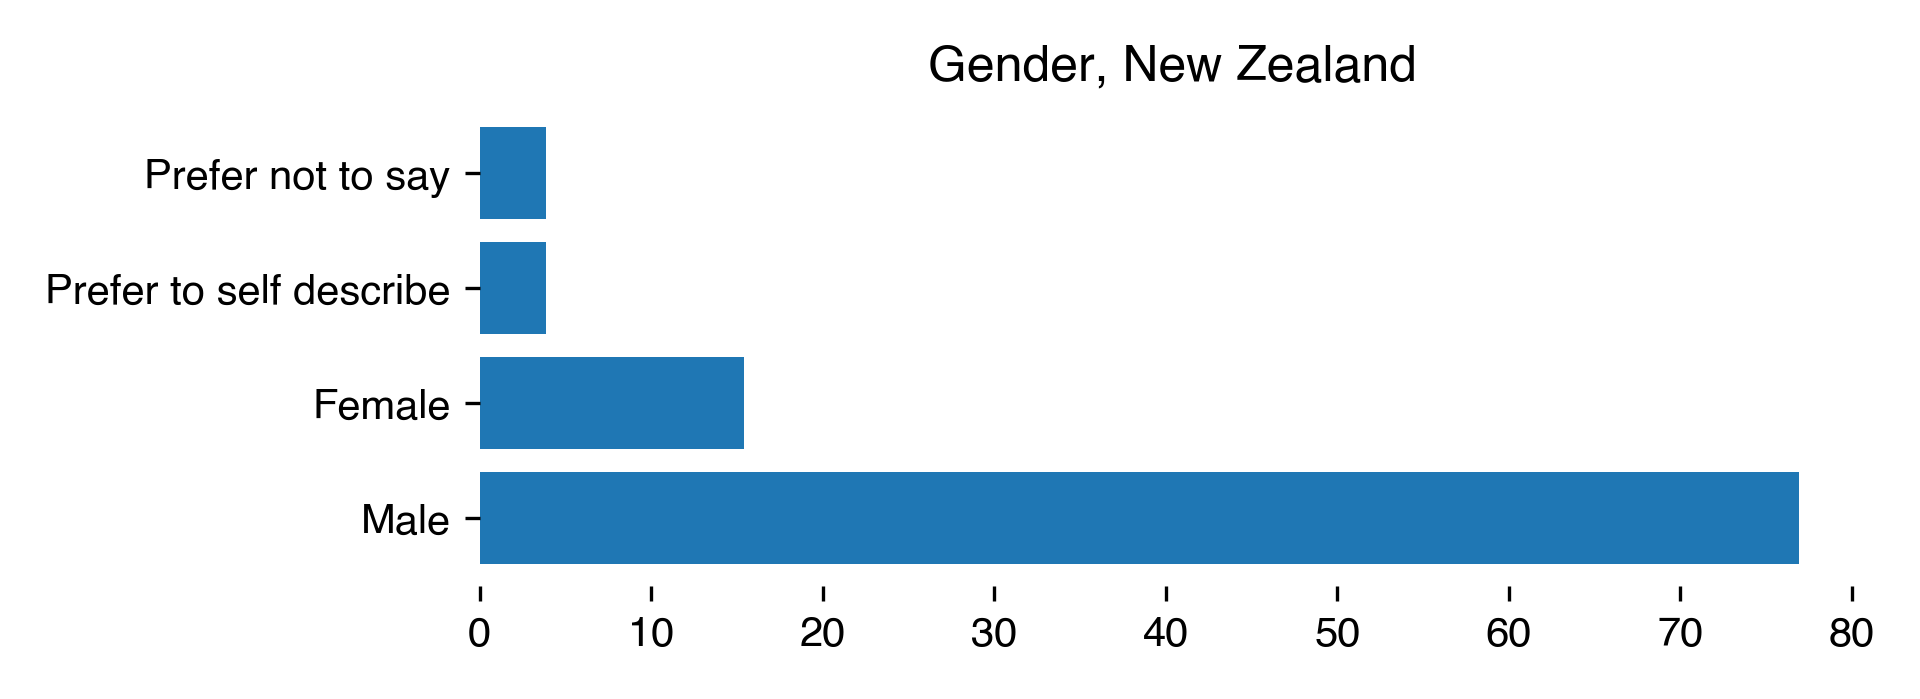
Gender for New Zealand
Count
Percentage
Male
20
76.92
Female
4
15.38
Prefer not to say
1
3.85
Prefer to self describe
1
3.85
Download CSV
2022-08-22T11:23:05.681331
image/svg+xml
Matplotlib v3.5.2, https://matplotlib.org/
PNG SVG
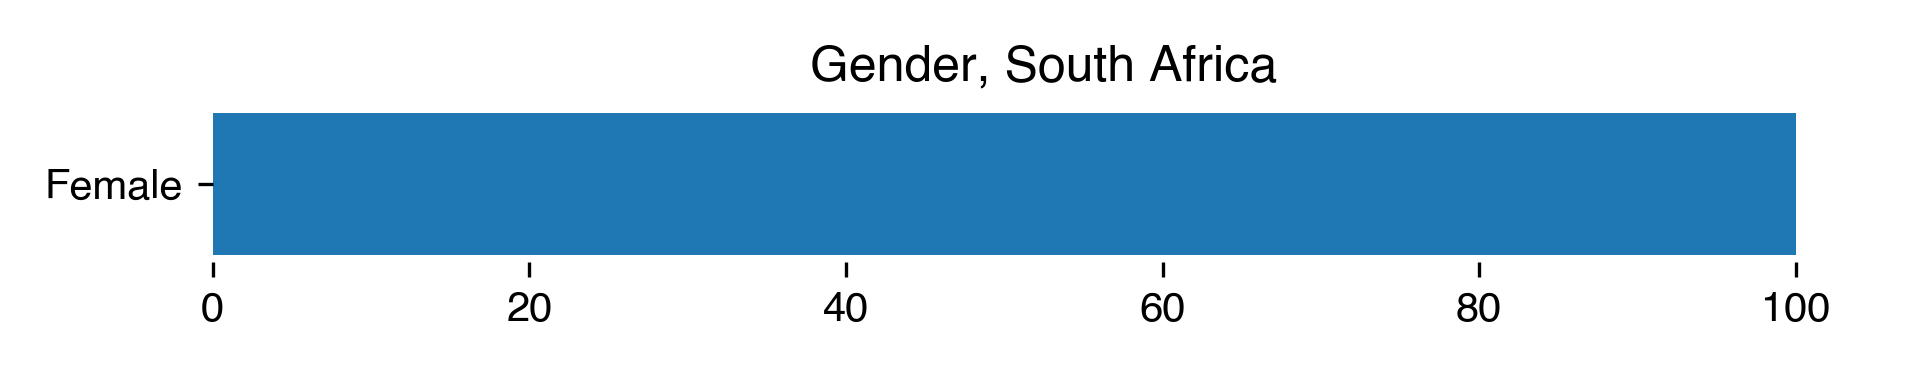
Gender for South Africa
Count
Percentage
Female
2
100
Download CSV
2022-08-22T11:23:05.875261
image/svg+xml
Matplotlib v3.5.2, https://matplotlib.org/
PNG SVG
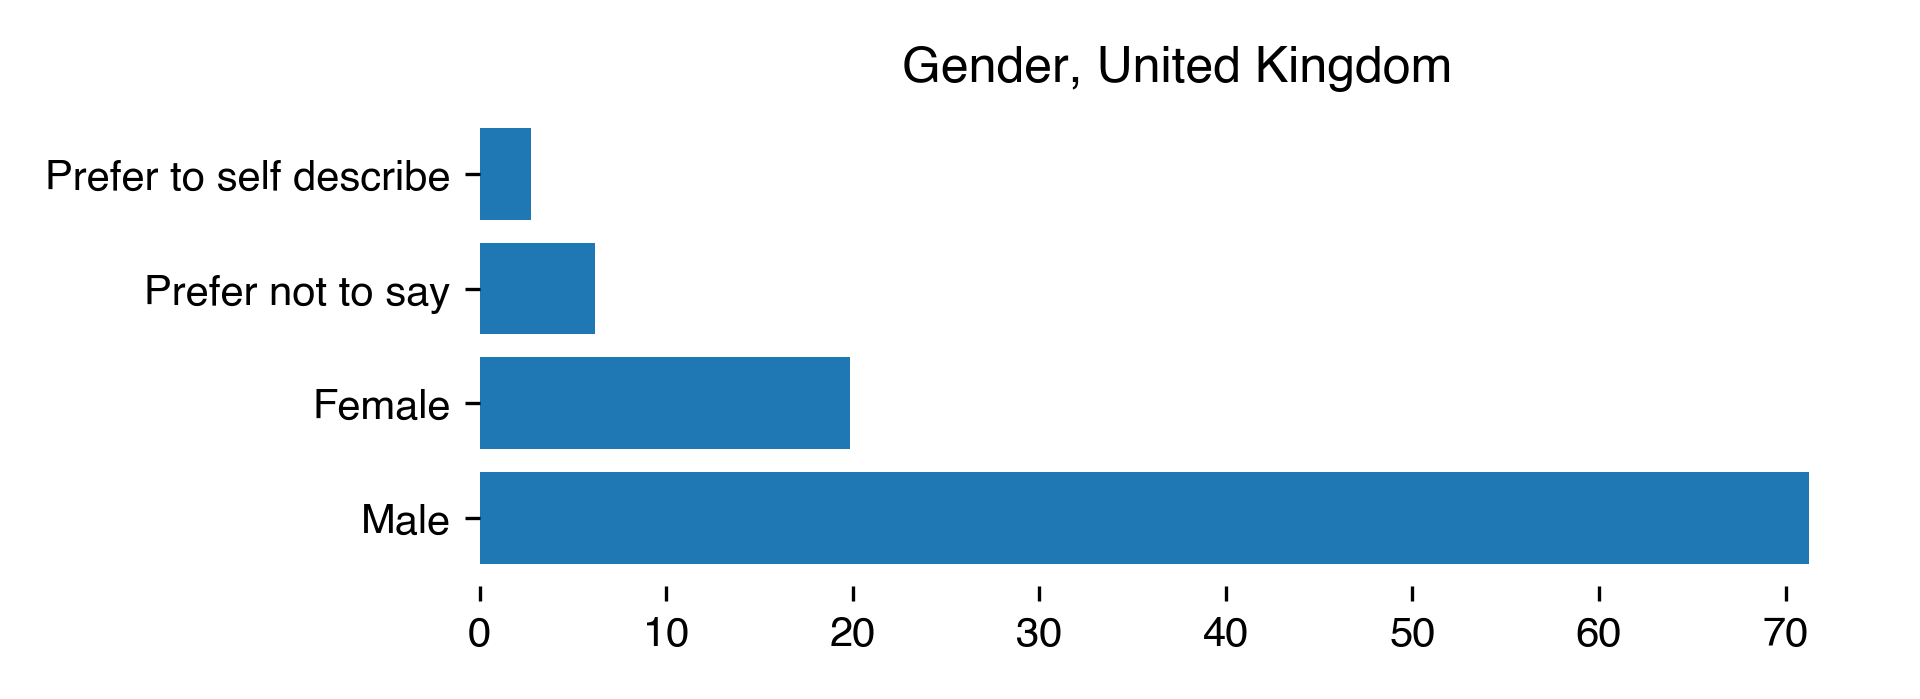
Gender for United Kingdom
Count
Percentage
Male
104
71.23
Female
29
19.86
Prefer not to say
9
6.16
Prefer to self describe
4
2.74
Download CSV
2022-08-22T11:23:06.135814
image/svg+xml
Matplotlib v3.5.2, https://matplotlib.org/
PNG SVG
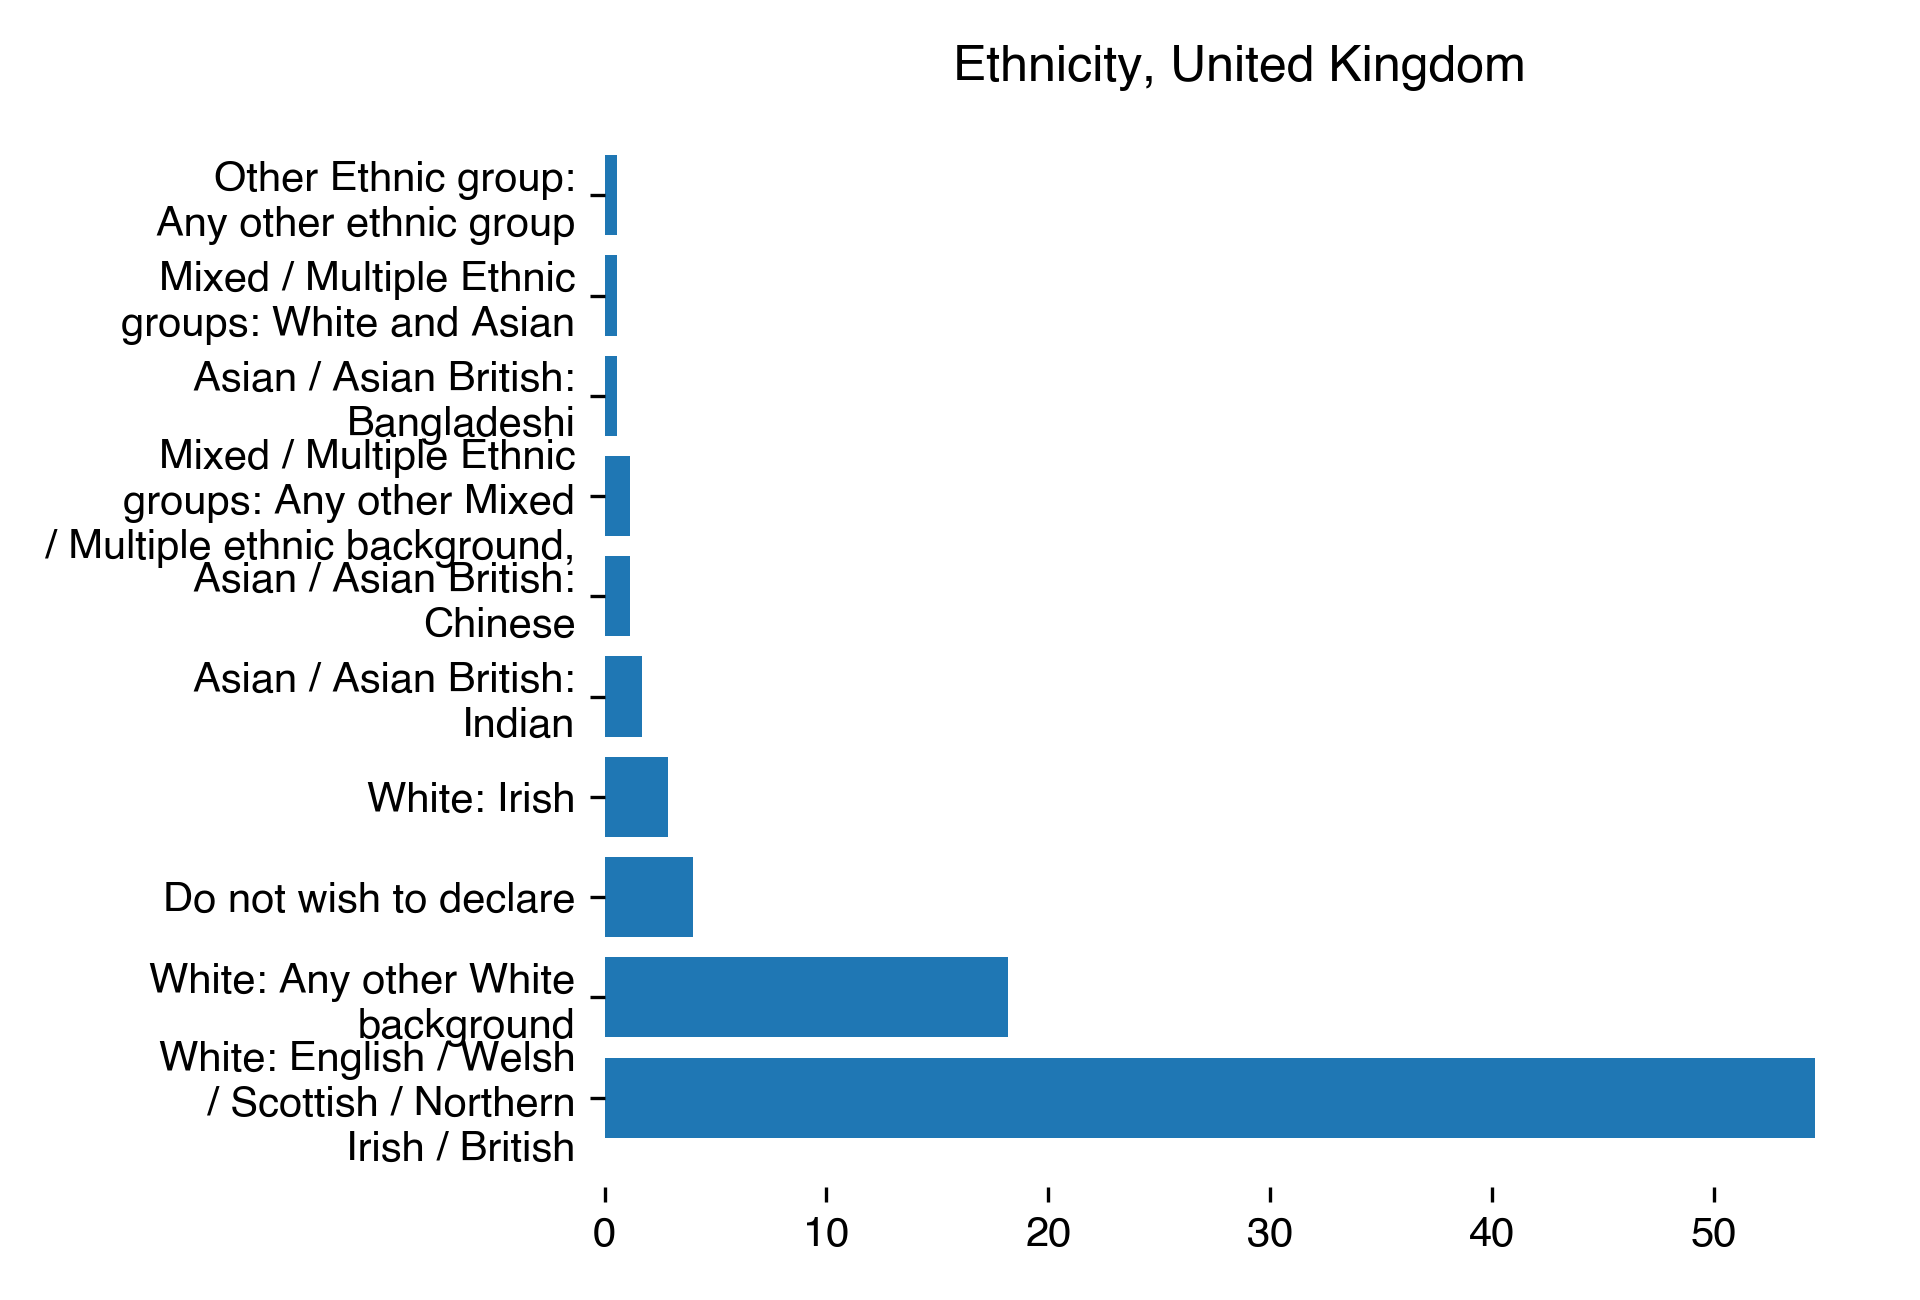
Ethnicity for United Kingdom
Count
Percentage
White: English / Welsh / Scottish / Northern Irish / British
96
54.55
White: Any other White background
32
18.18
Do not wish to declare
7
3.98
White: Irish
5
2.84
Asian / Asian British: Indian
3
1.7
Mixed / Multiple Ethnic groups: Any other Mixed / Multiple ethnic background,
2
1.14
Asian / Asian British: Chinese
2
1.14
Other Ethnic group: Any other ethnic group
1
0.57
Mixed / Multiple Ethnic groups: White and Asian
1
0.57
Asian / Asian British: Bangladeshi
1
0.57
Download CSV
2022-08-22T11:23:06.720748
image/svg+xml
Matplotlib v3.5.2, https://matplotlib.org/
PNG SVG
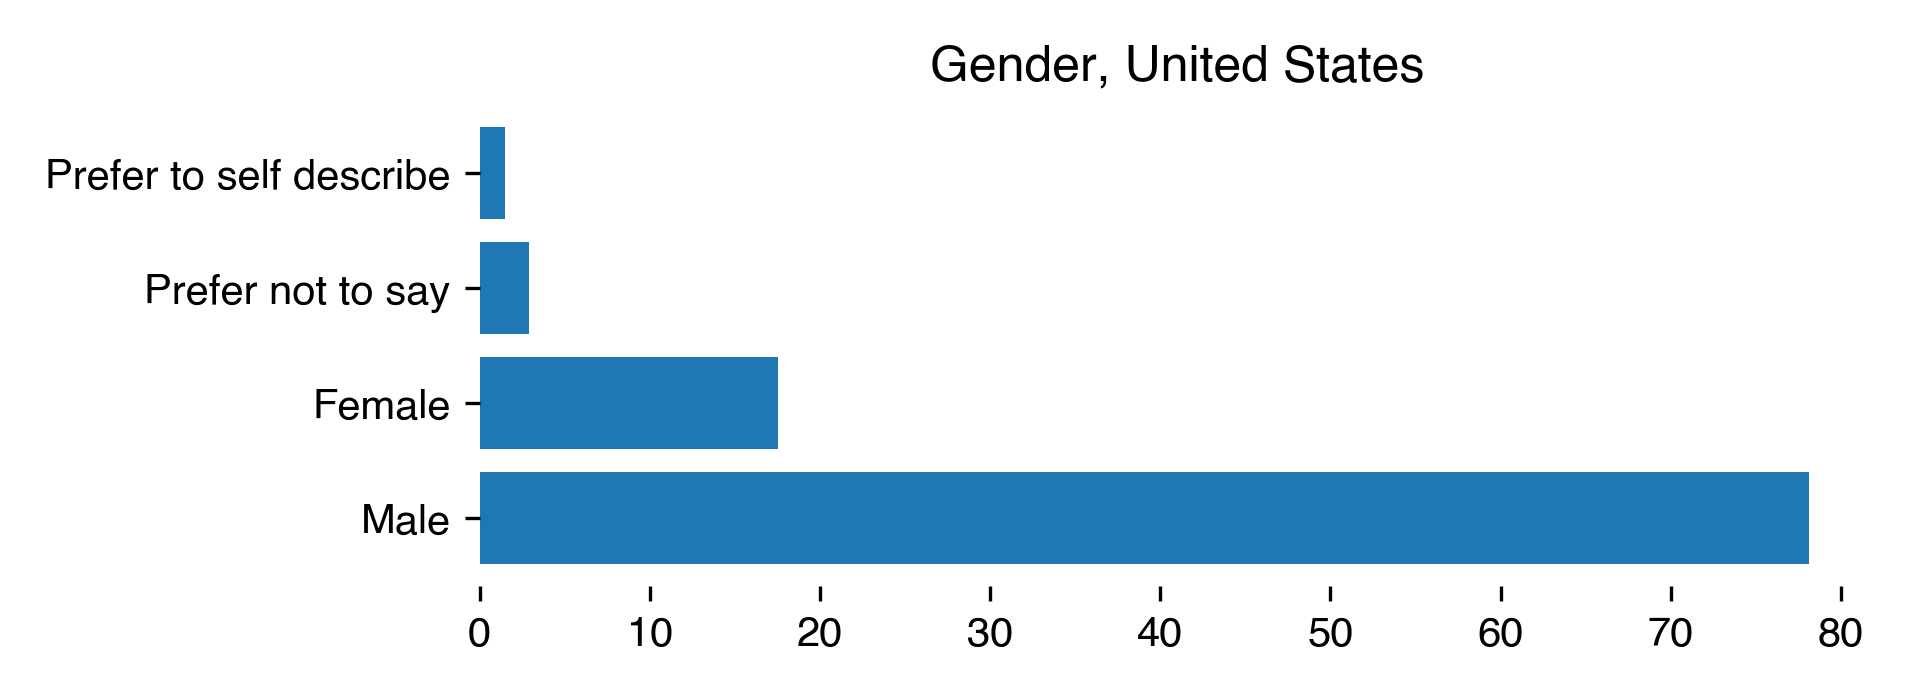
Gender for United States
Count
Percentage
Male
107
78.1
Female
24
17.52
Prefer not to say
4
2.92
Prefer to self describe
2
1.46
Download CSV
2022-08-22T11:23:07.204252
image/svg+xml
Matplotlib v3.5.2, https://matplotlib.org/
PNG SVG
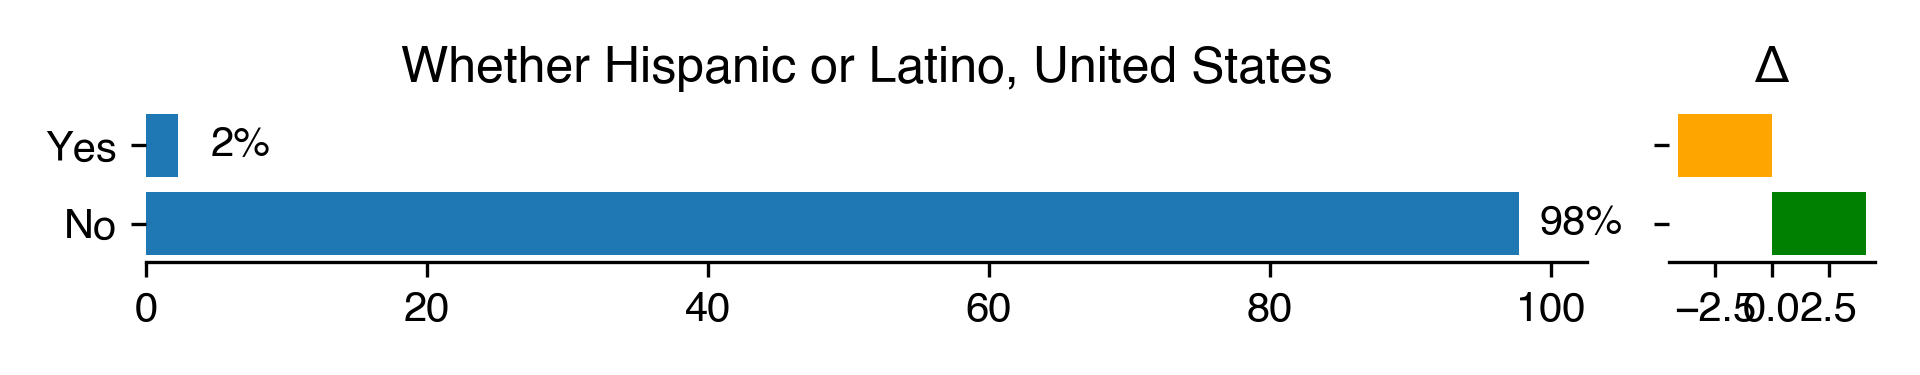
Whether Hispanic or Latino for United States
Count
Percentage
Percentage in 2018
Difference with previous year
Yes
3
2.29
6.4
-4.11
No
128
97.71
93.6
4.11
Download CSV
2022-08-22T11:23:07.454926
image/svg+xml
Matplotlib v3.5.2, https://matplotlib.org/
PNG SVG
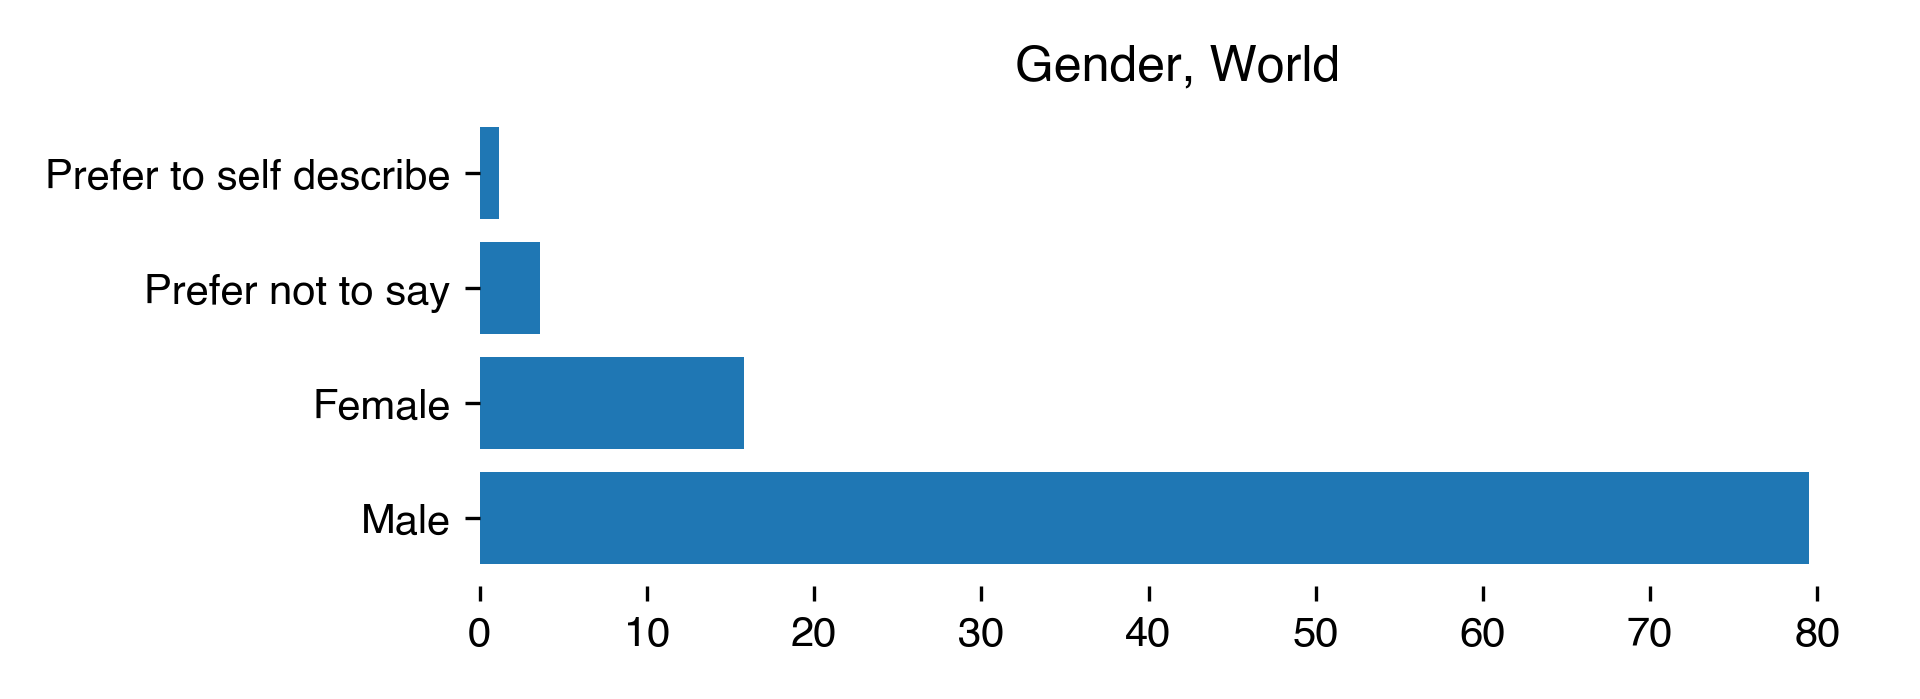
Gender for World
Count
Percentage
Male
639
79.48
Female
127
15.8
Prefer not to say
29
3.61
Prefer to self describe
9
1.12
Download CSV
2022-08-22T11:23:07.750088
image/svg+xml
Matplotlib v3.5.2, https://matplotlib.org/
PNG SVG