Questions in this section Levels of education Academic field for education and professional development Academic field of work
This section contains the information about the type of education the
participants have, as well as their highest degree obtained.
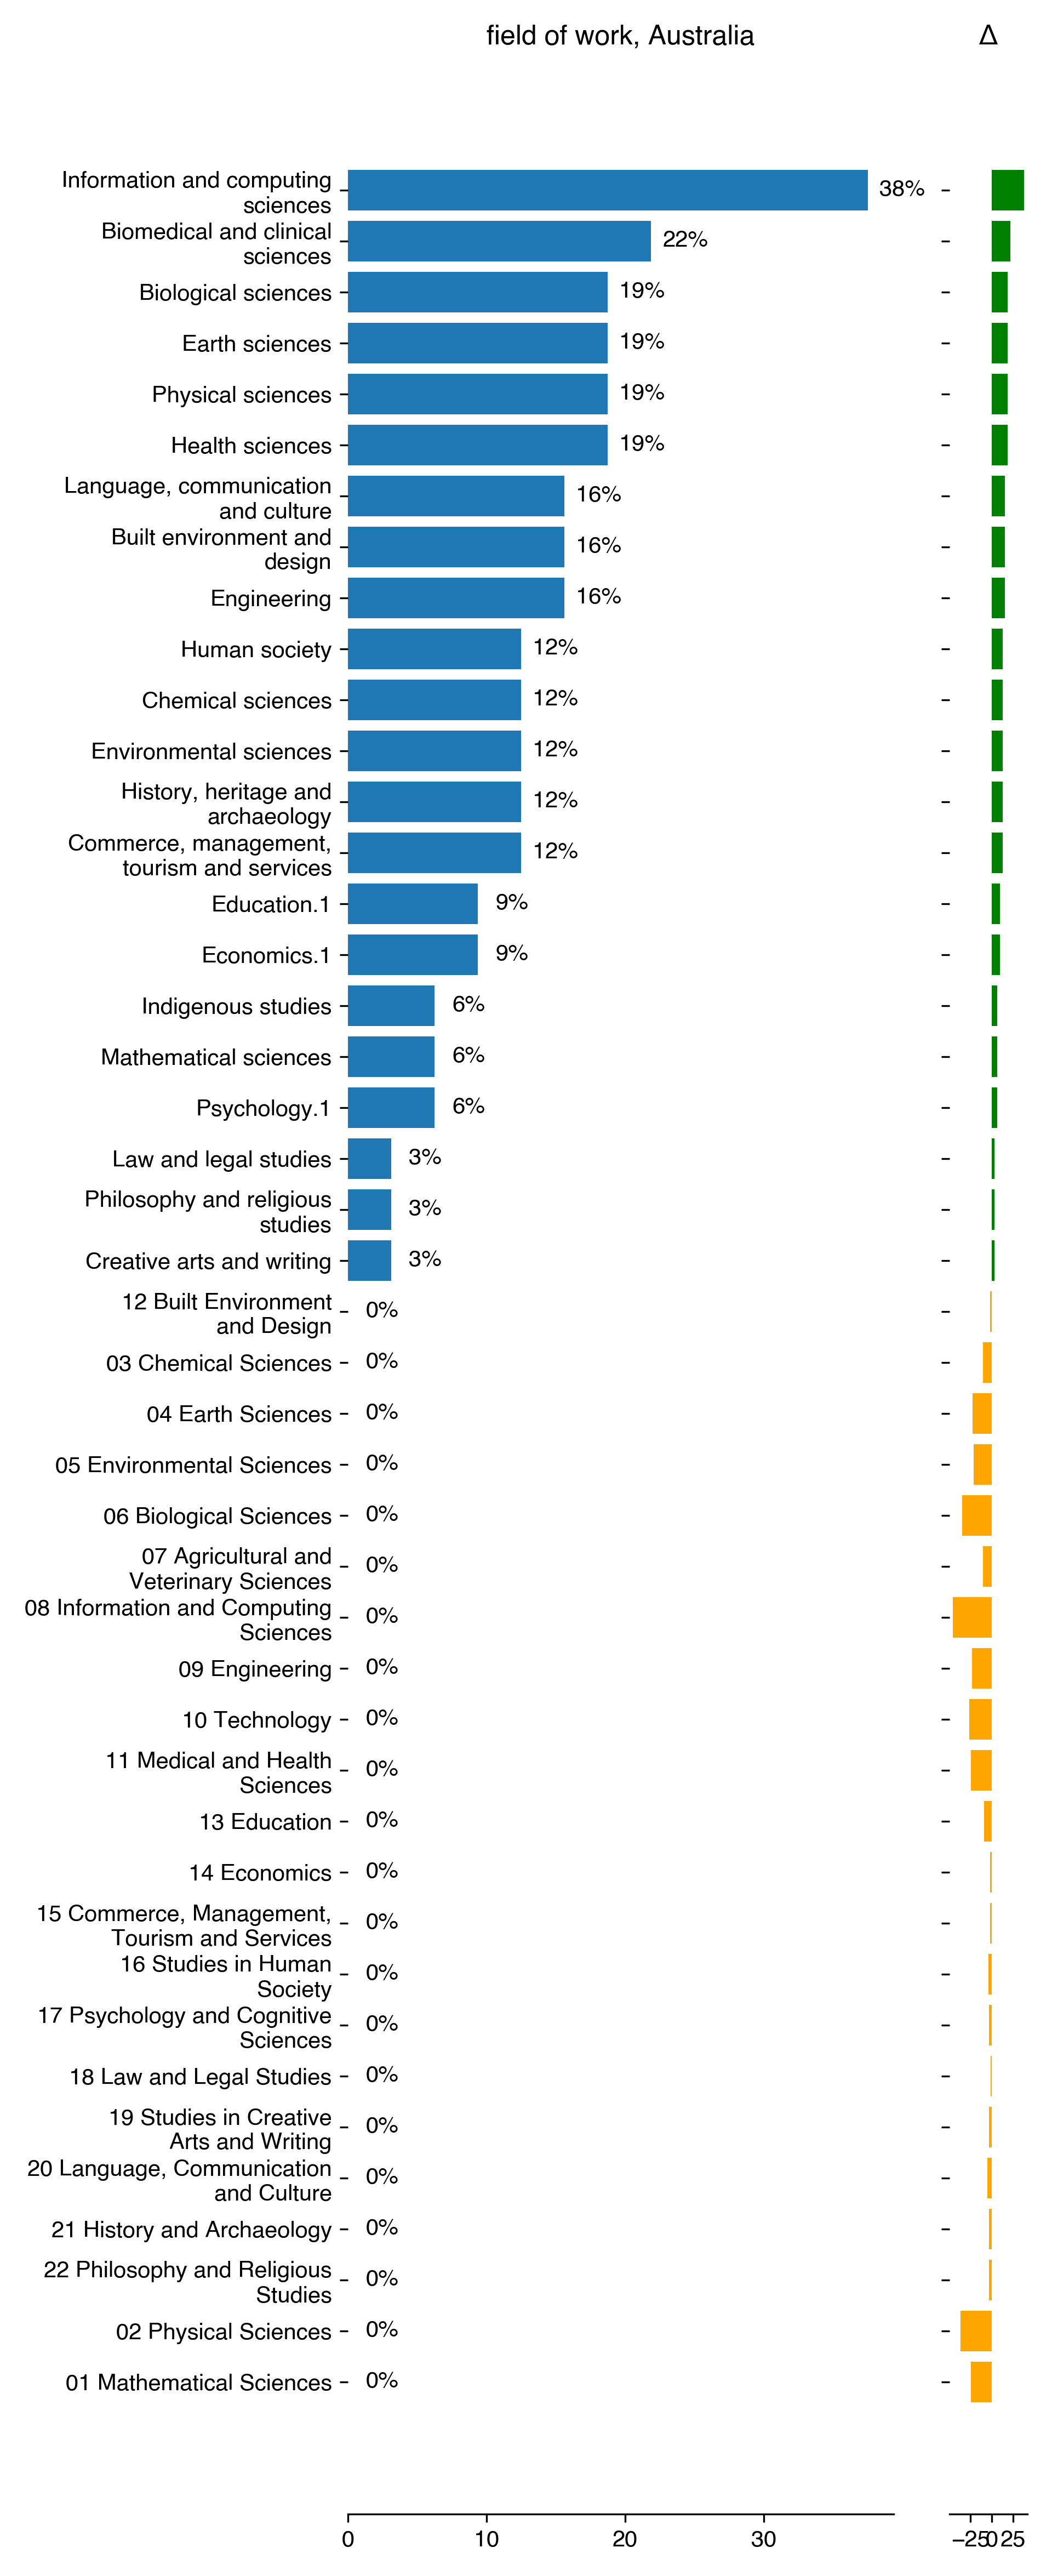
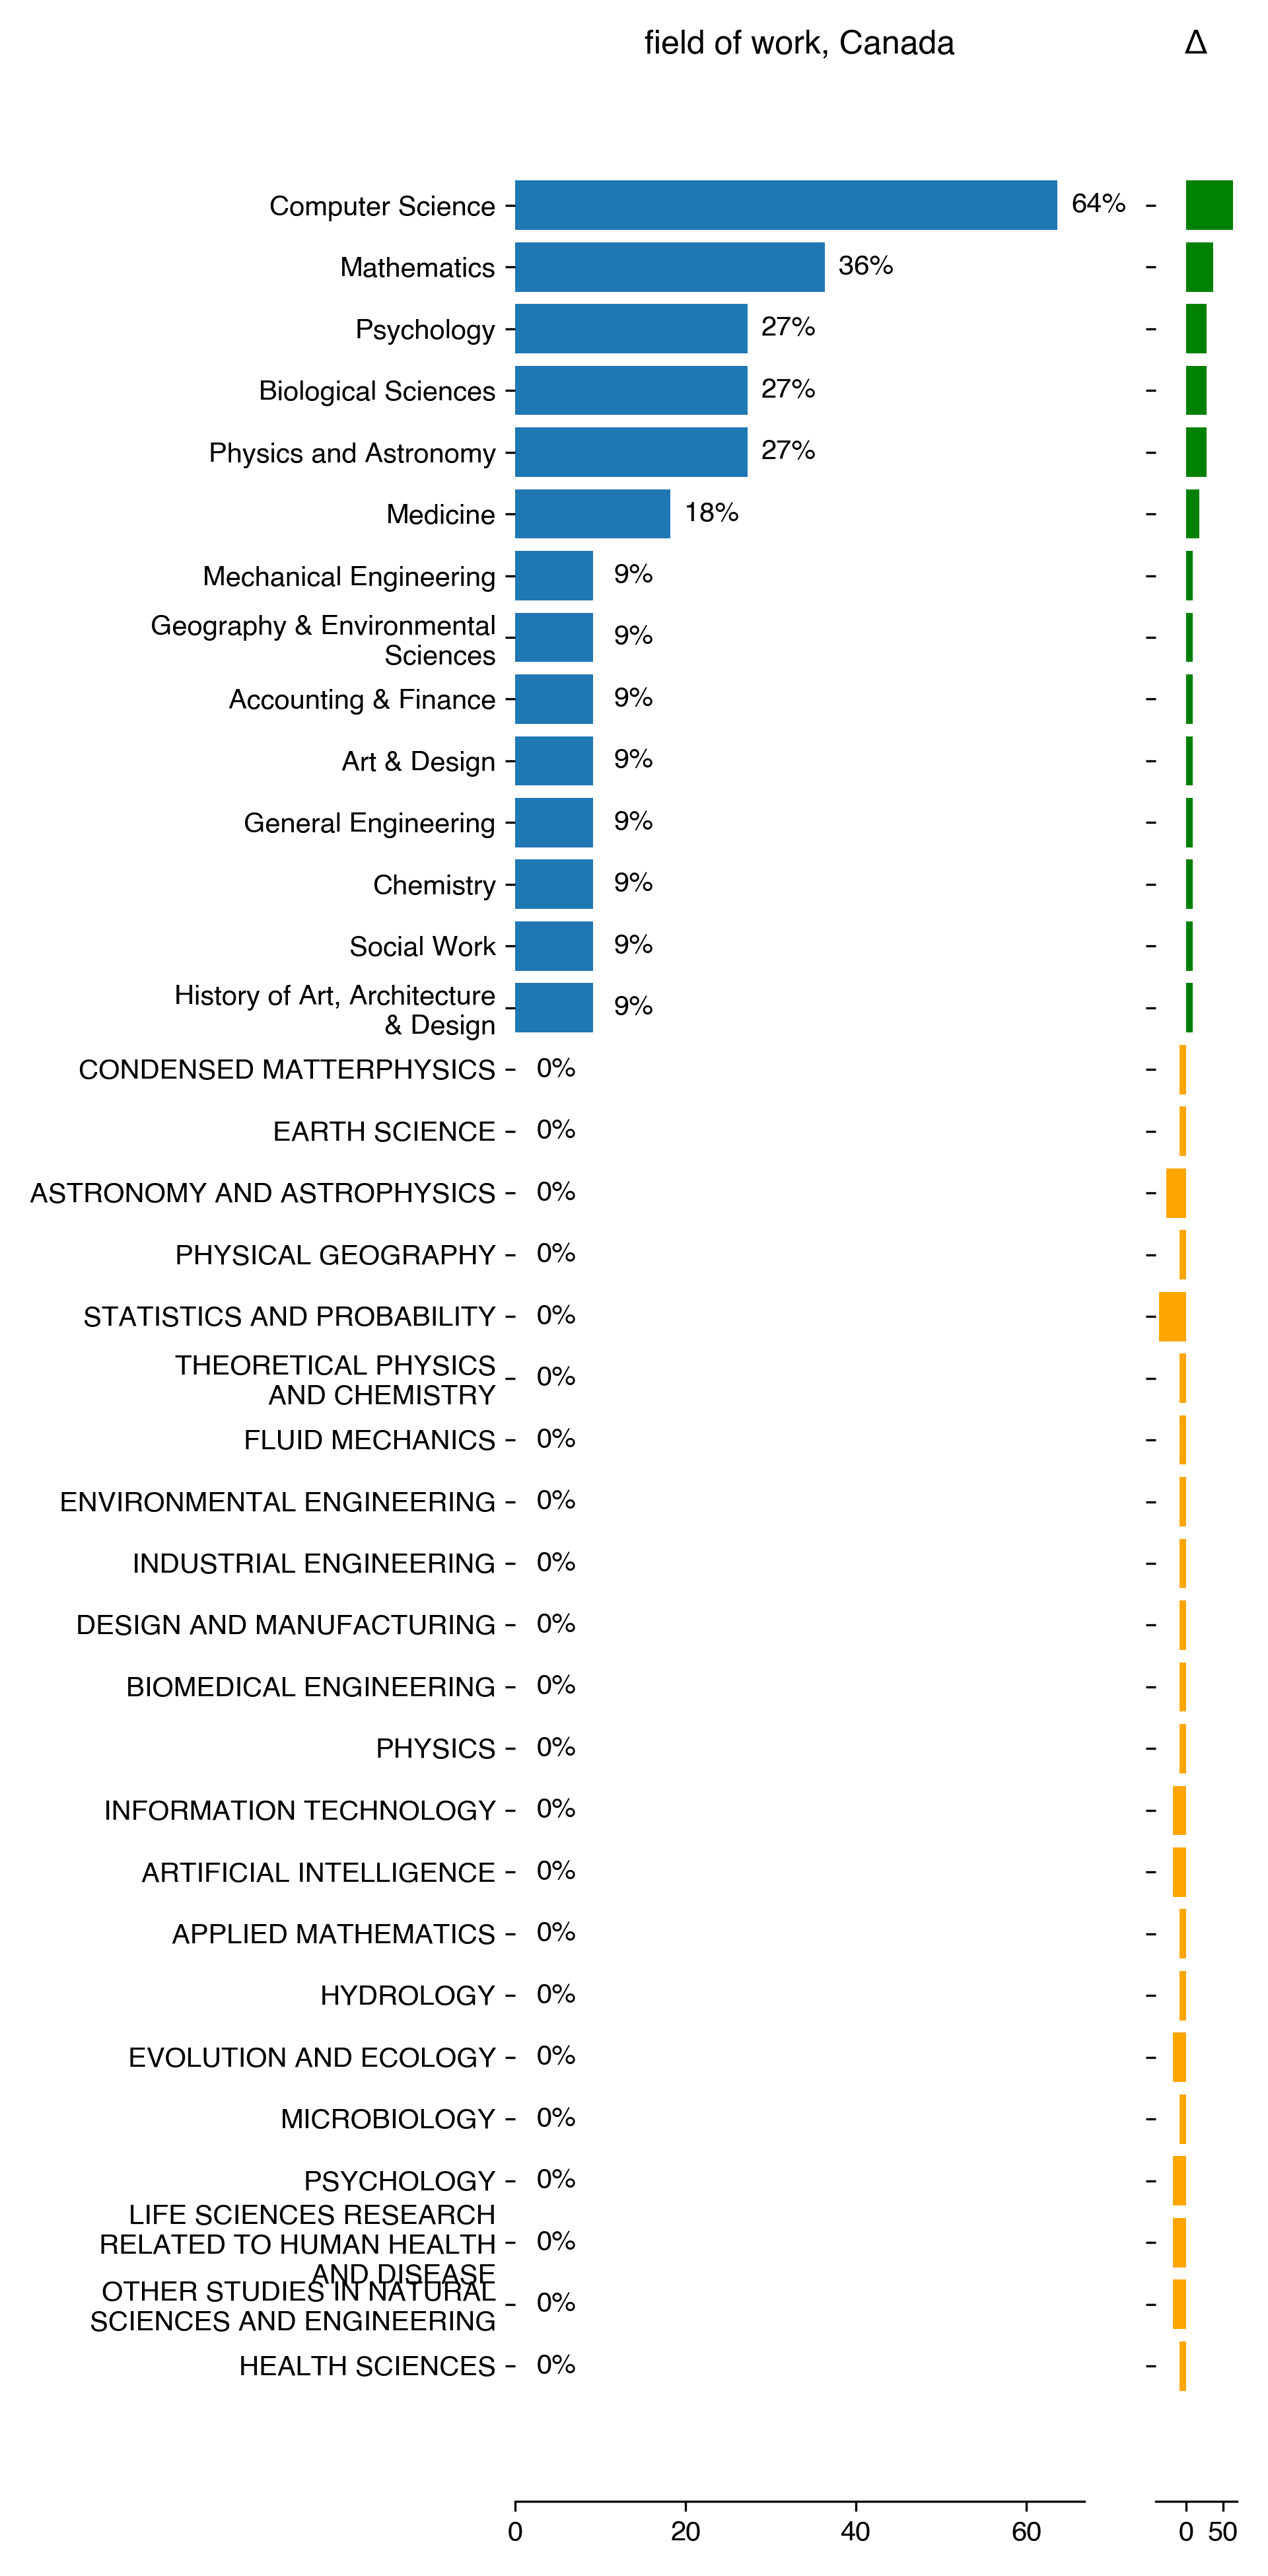
We asked the participants, in which field they are working. With that question,
it is possible to see which current field employed the most of RSE/RSD. The
questions were specific to each country and was multiple choice. Each
participant could choose several fields. We then calculate the different
proportion by dividing each field by the total of participants that have
selected at least one option.
What is the highest level of education you have attained? (one choice list)
In which discipline is your highest academic qualification? (one choice list)
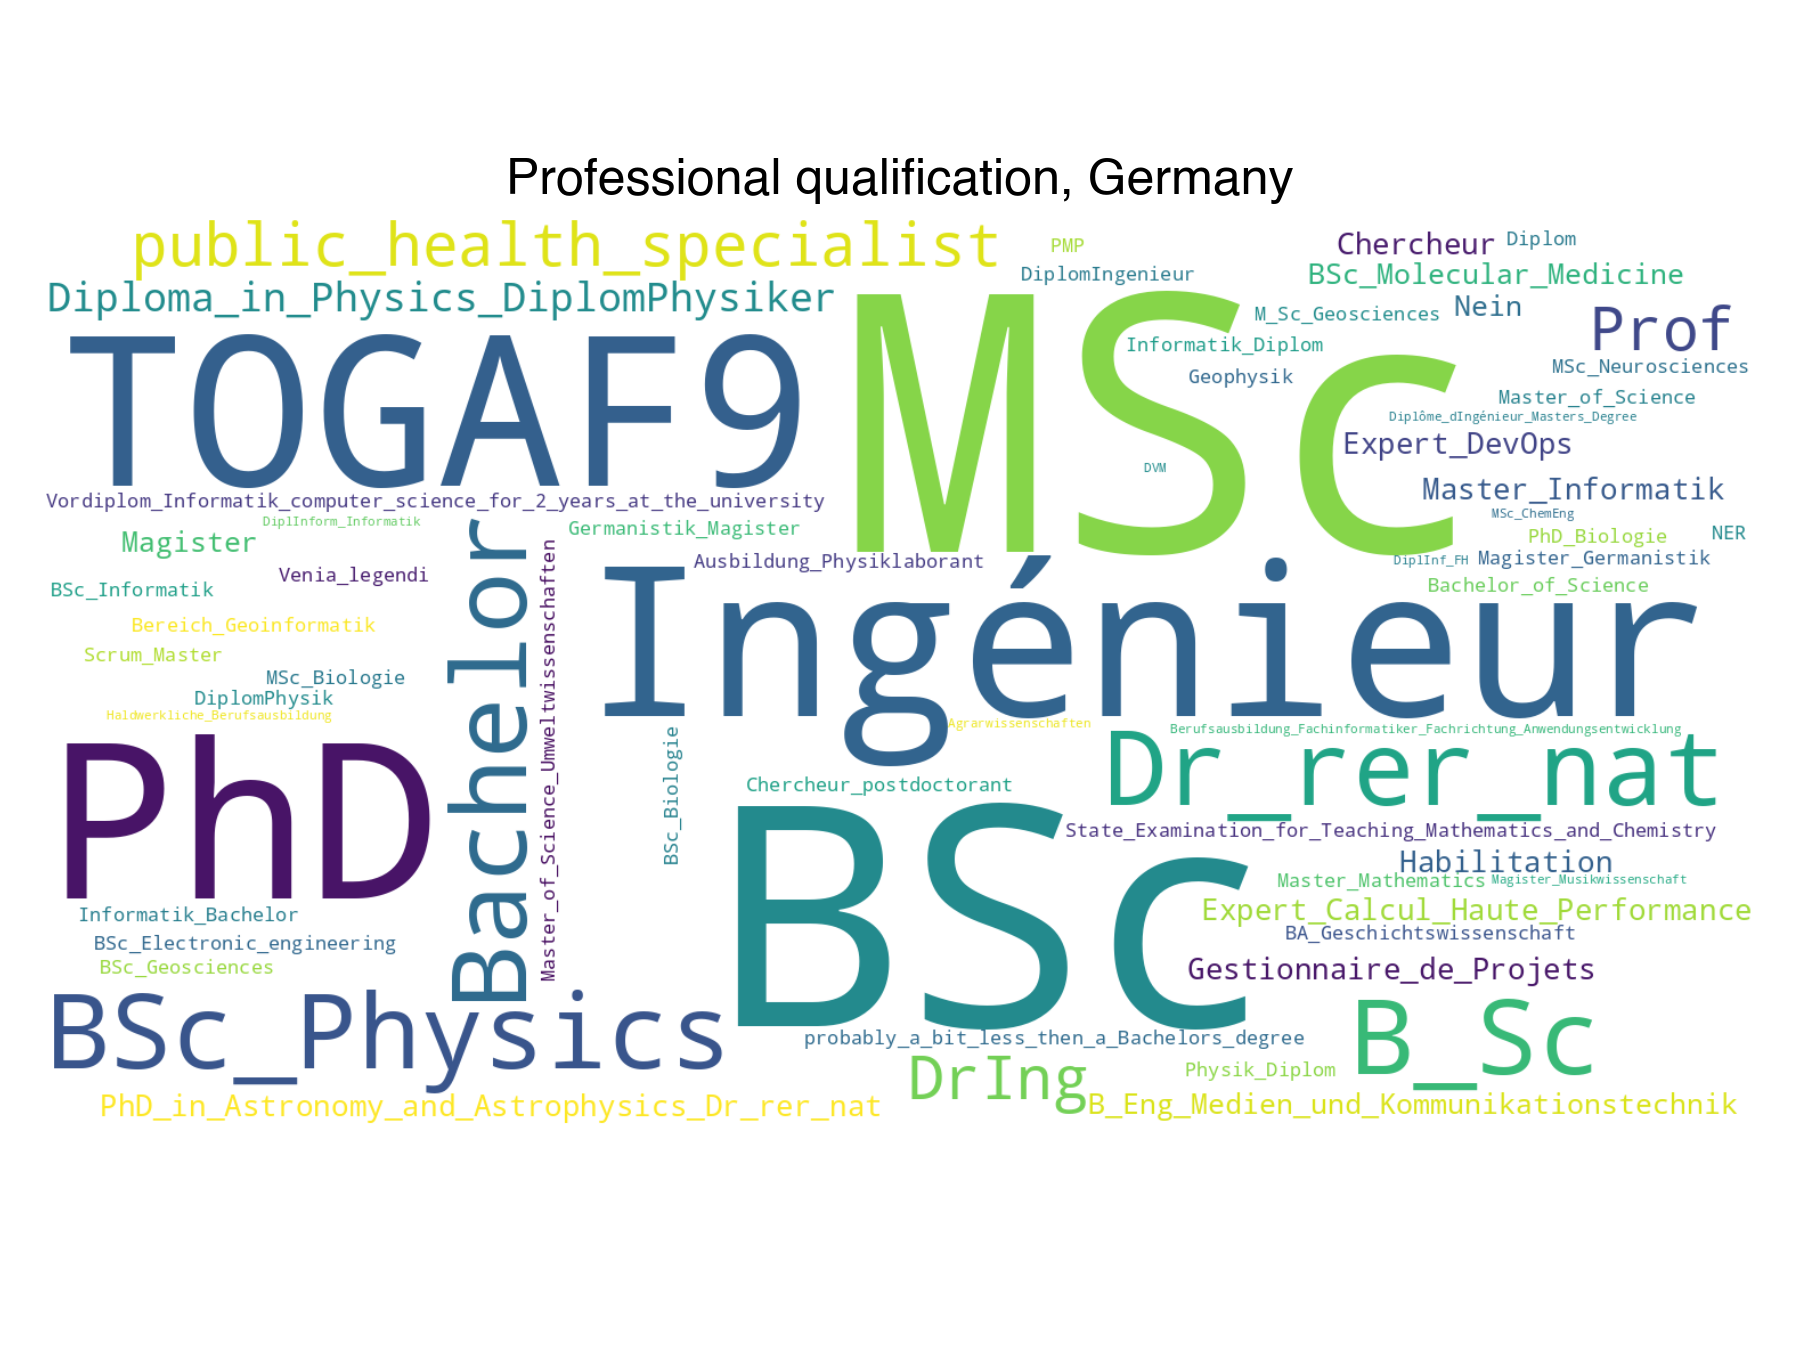
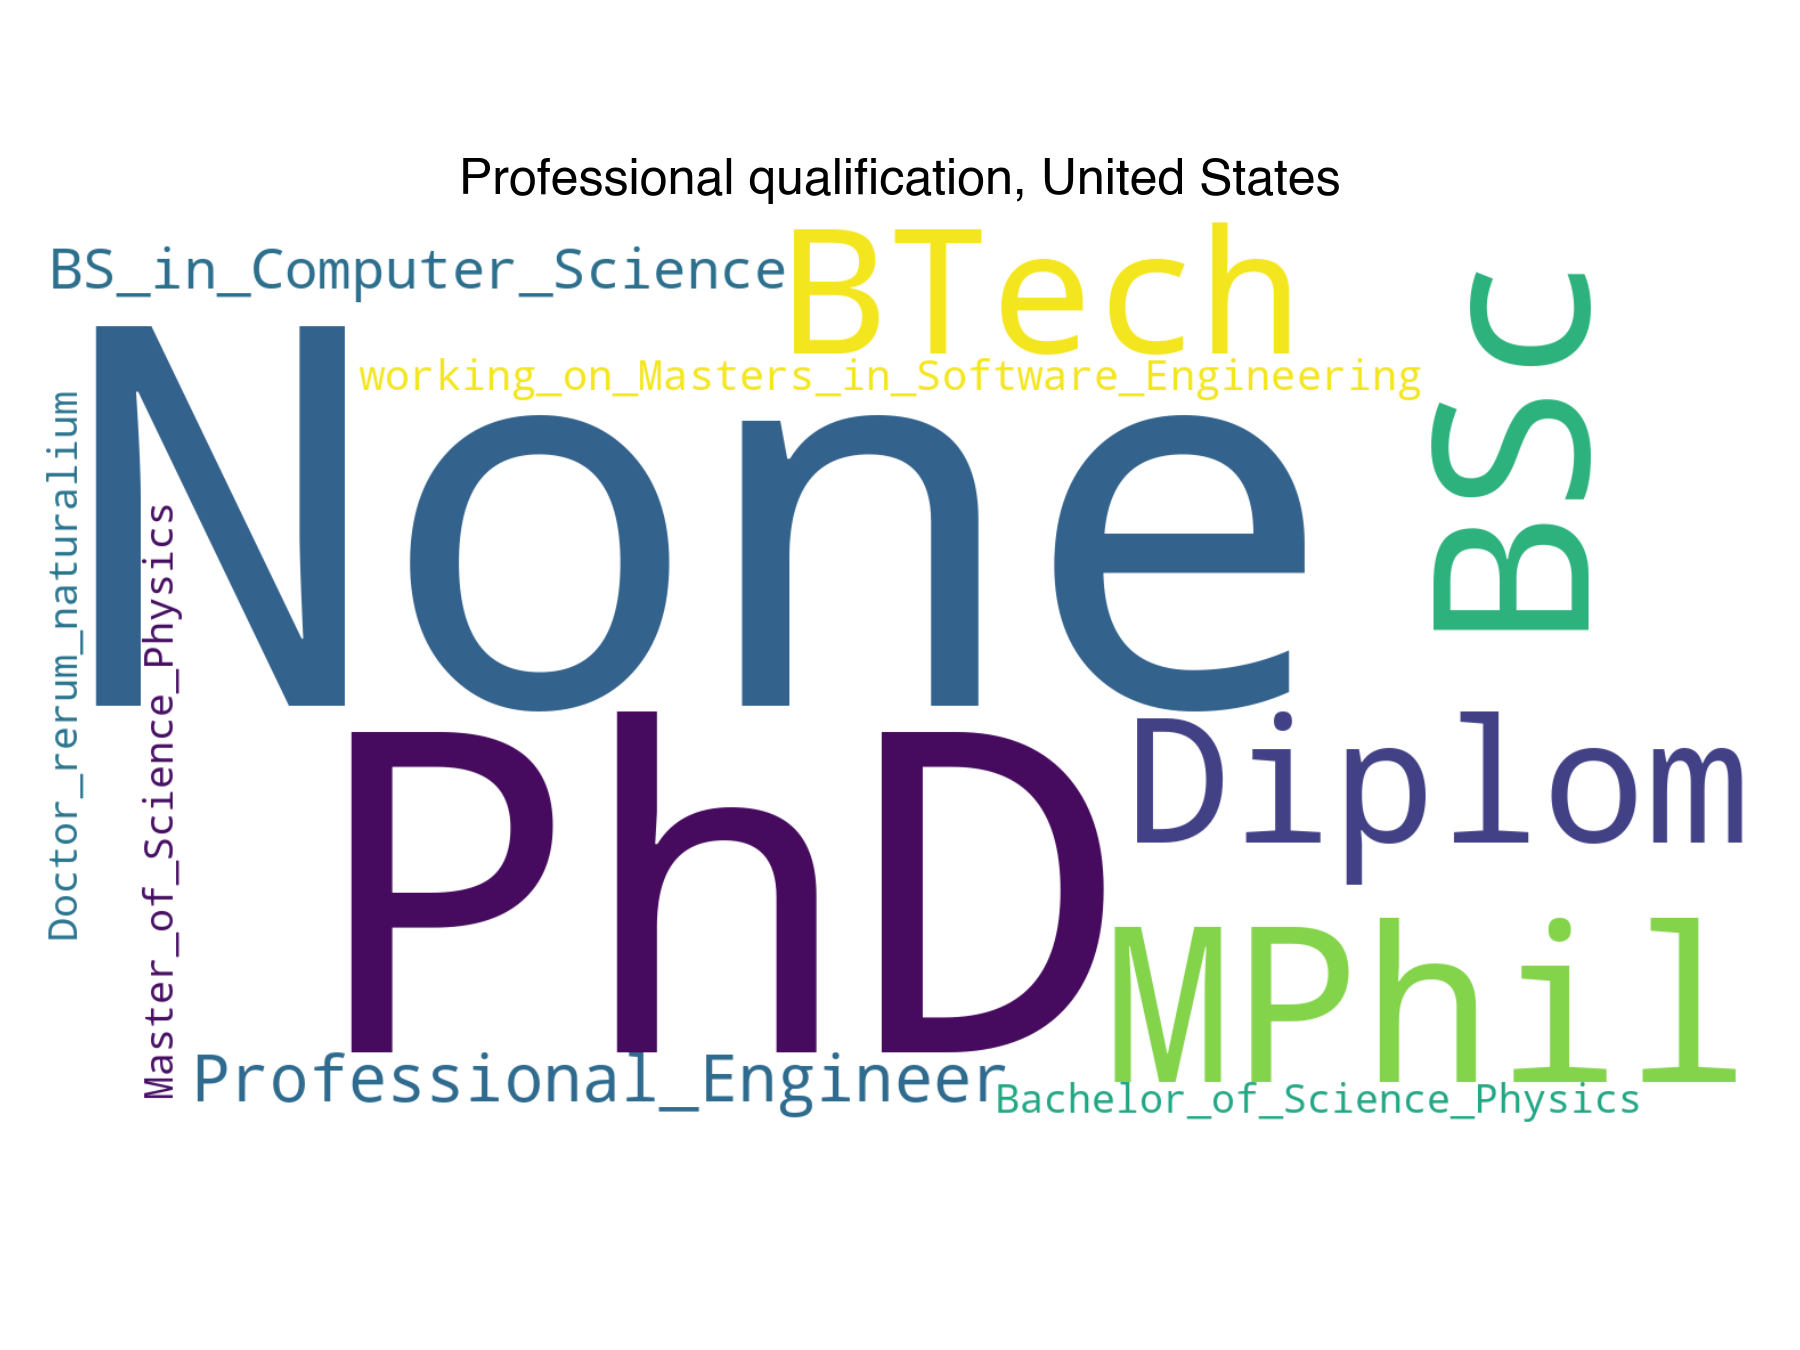
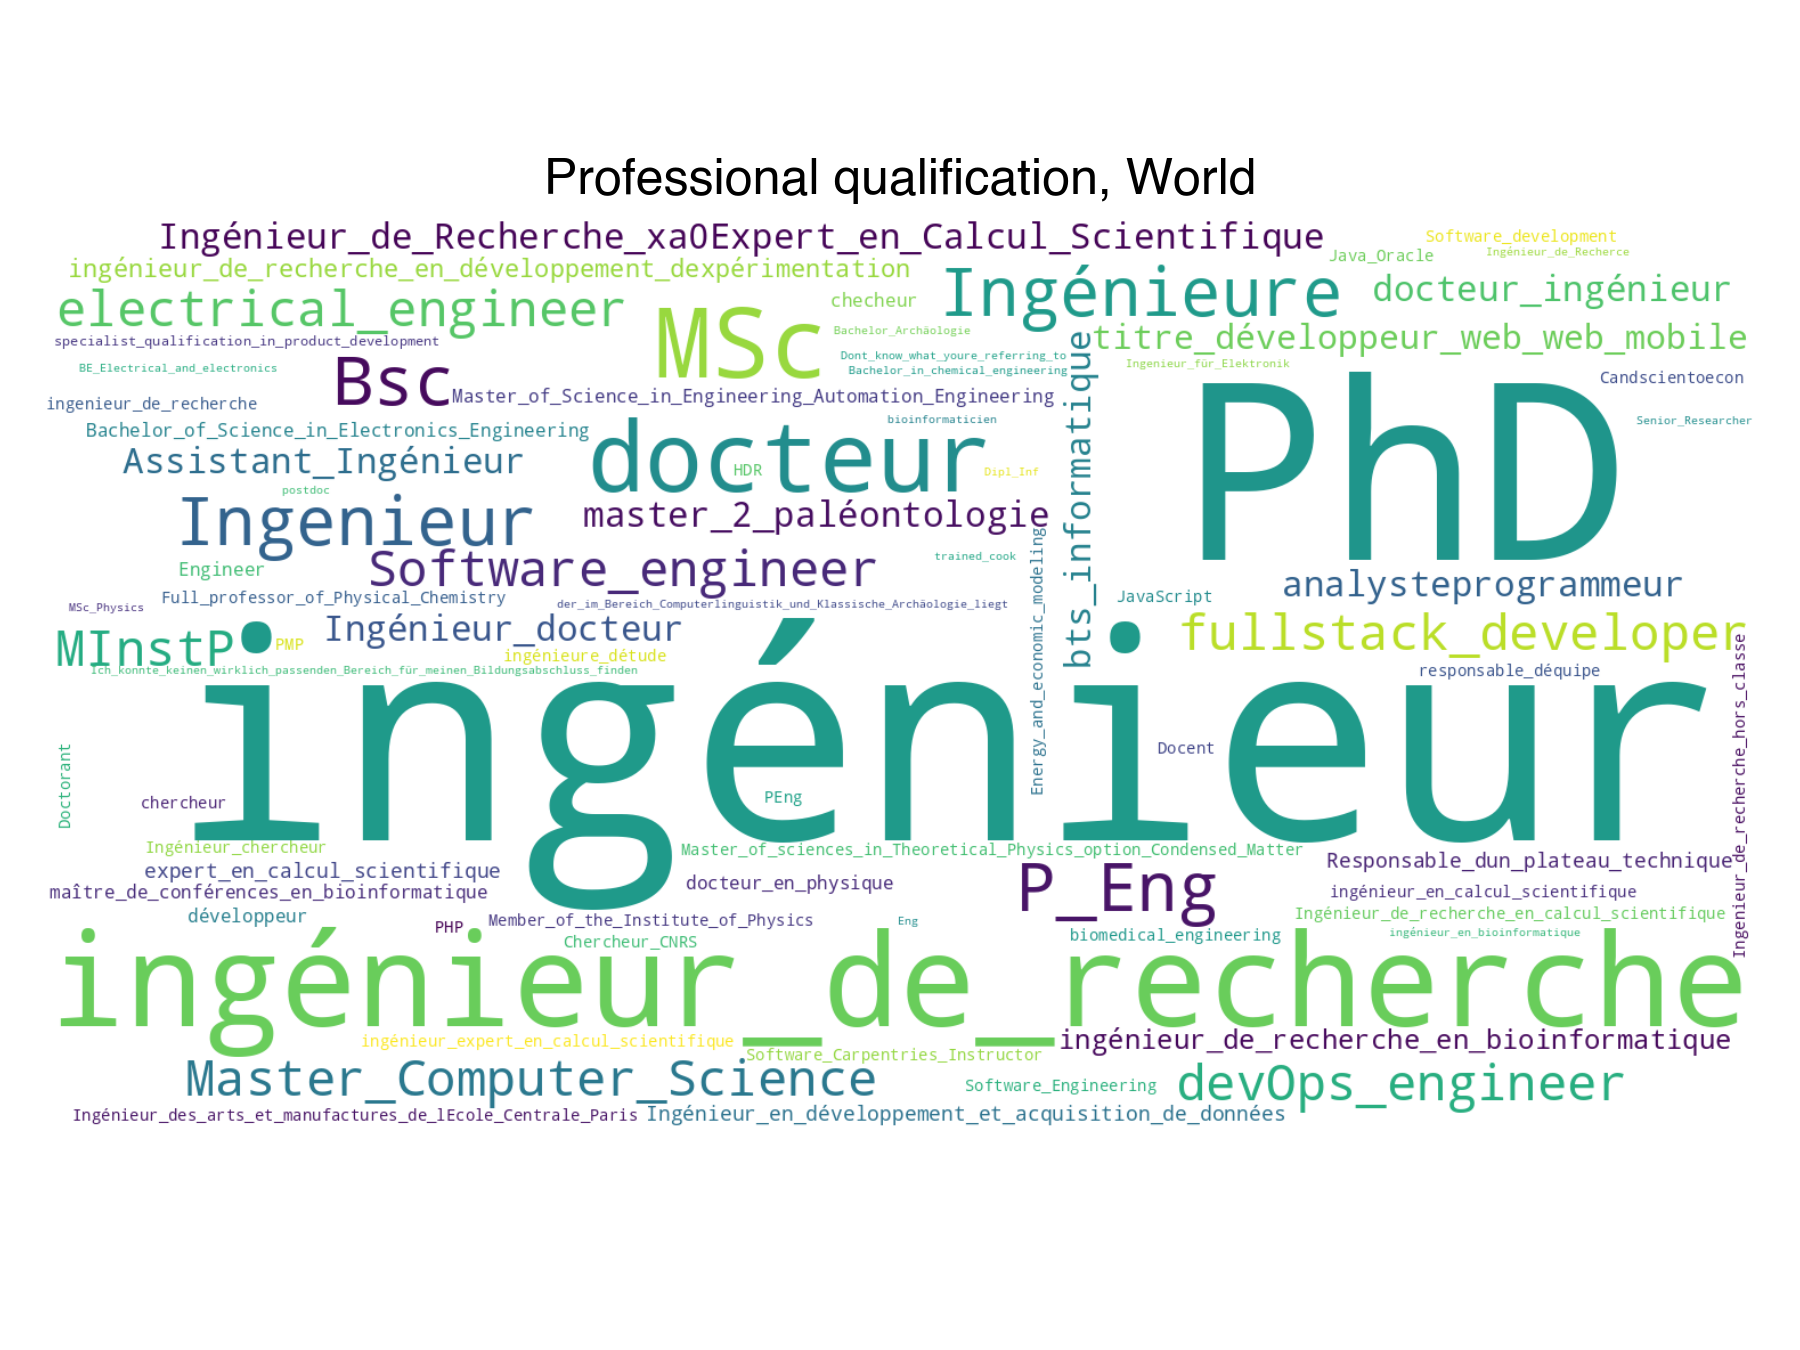
List any professional qualifications you hold (free text)
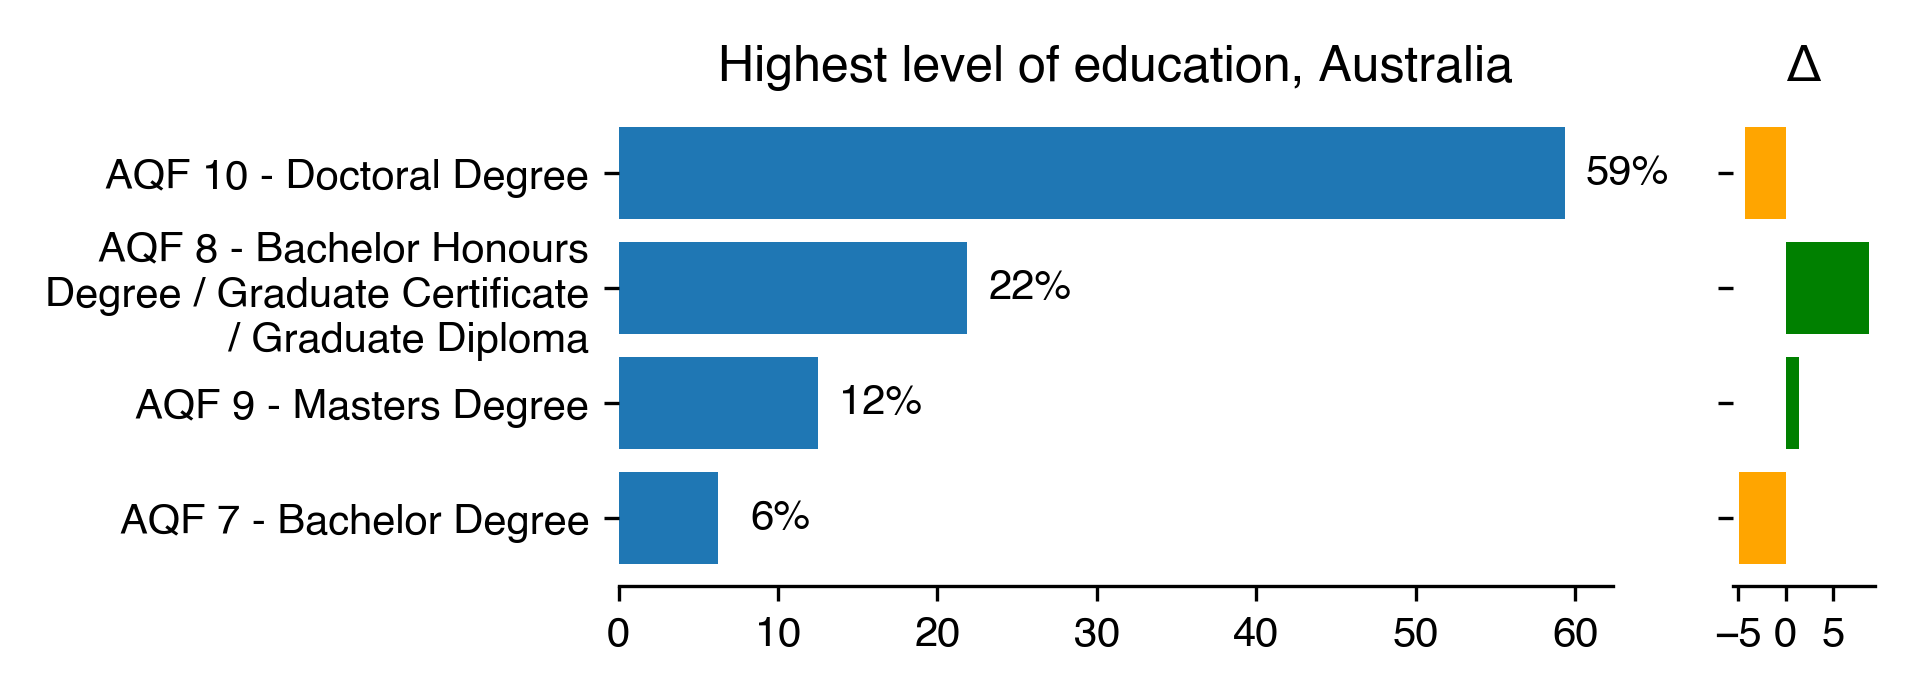
Highest level of education for Australia
Count
Percentage
Percentage in 2018
Difference with previous year
AQF 10 - Doctoral Degree
19
59.38
63.64
-4.26
AQF 8 - Bachelor Honours Degree / Graduate Certificate / Graduate Diploma
7
21.88
13.13
8.74
AQF 9 - Masters Degree
4
12.5
11.11
1.39
AQF 7 - Bachelor Degree
2
6.25
11.11
-4.86
Download CSV
2022-08-22T11:26:33.086261
image/svg+xml
Matplotlib v3.5.2, https://matplotlib.org/
PNG SVG
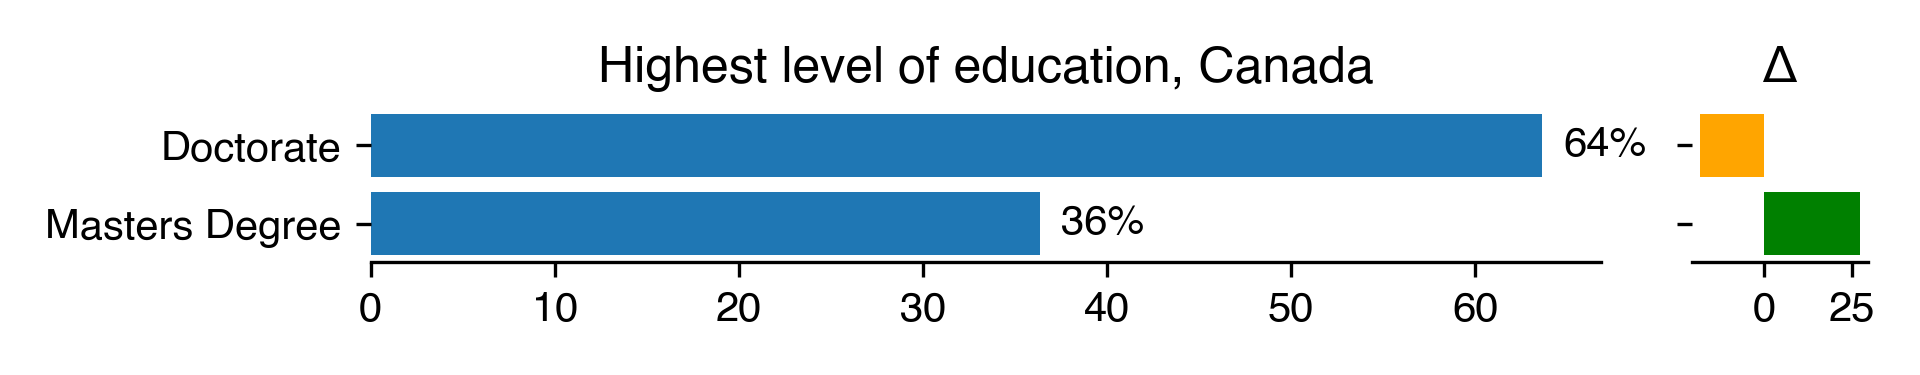
Highest level of education for Canada
Count
Percentage
Percentage in 2018
Difference with previous year
Doctorate
7
63.64
81.82
-18.18
Masters Degree
4
36.36
9.09
27.27
Download CSV
2022-08-22T11:26:33.380094
image/svg+xml
Matplotlib v3.5.2, https://matplotlib.org/
PNG SVG
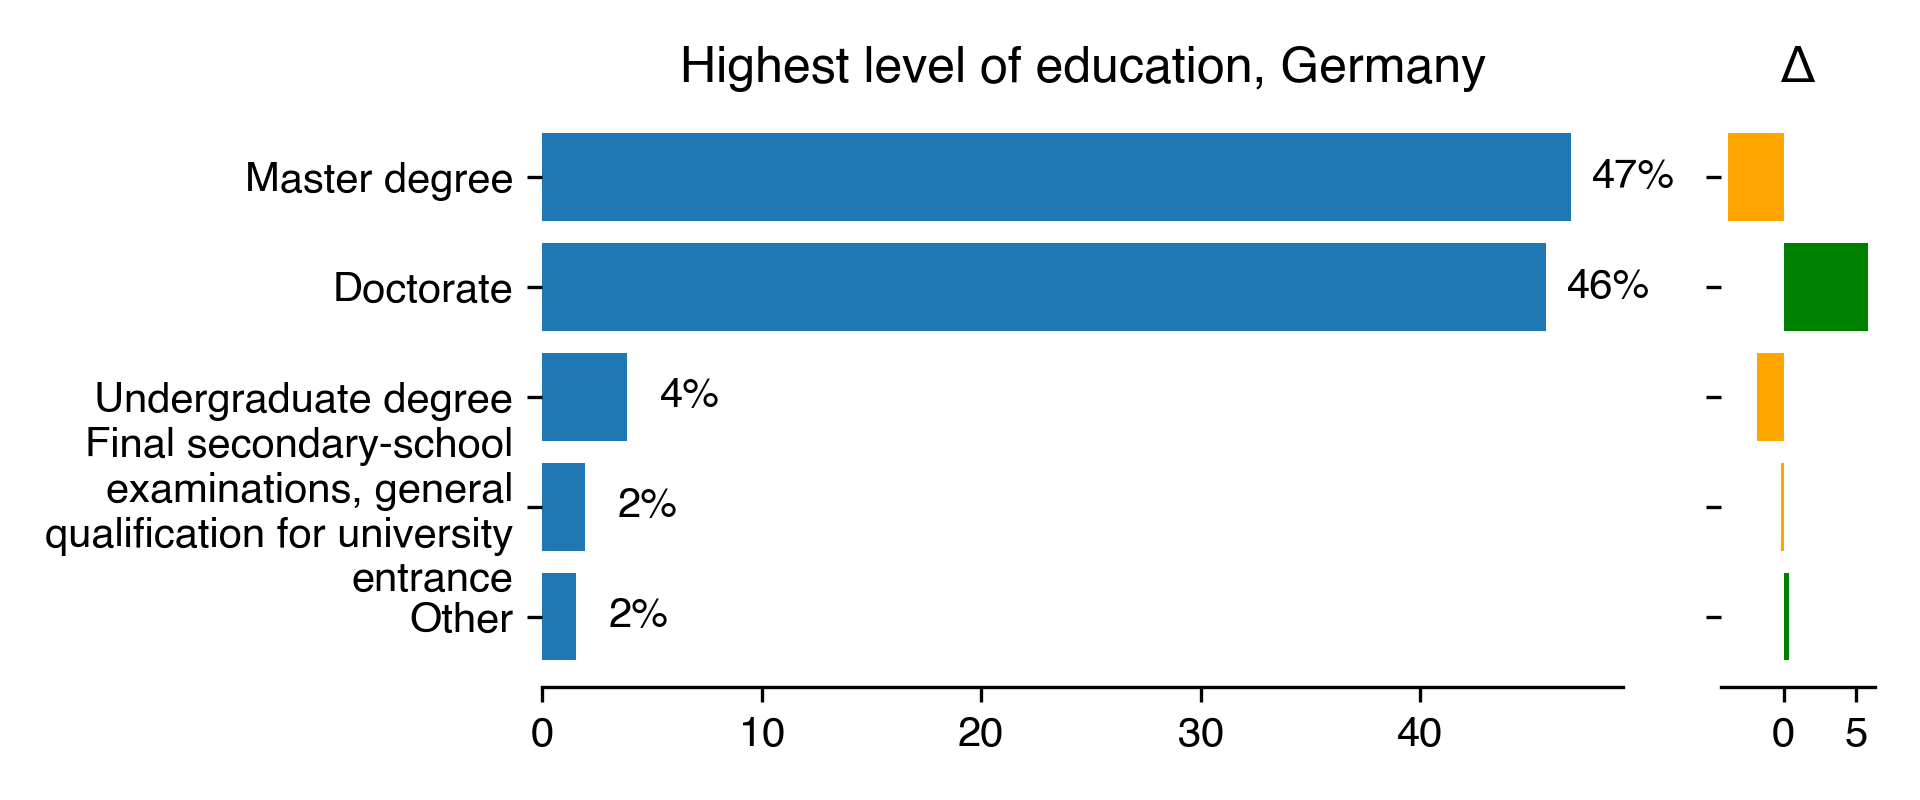
Highest level of education for Germany
Count
Percentage
Percentage in 2018
Difference with previous year
Master degree
121
46.9
50.75
-3.85
Doctorate
118
45.74
39.94
5.8
Undergraduate degree
10
3.88
5.71
-1.83
Final secondary-school examinations, general qualification for university entrance
5
1.94
2.1
-0.16
Other
4
1.55
1.2
0.35
Download CSV
2022-08-22T11:26:33.773933
image/svg+xml
Matplotlib v3.5.2, https://matplotlib.org/
PNG SVG
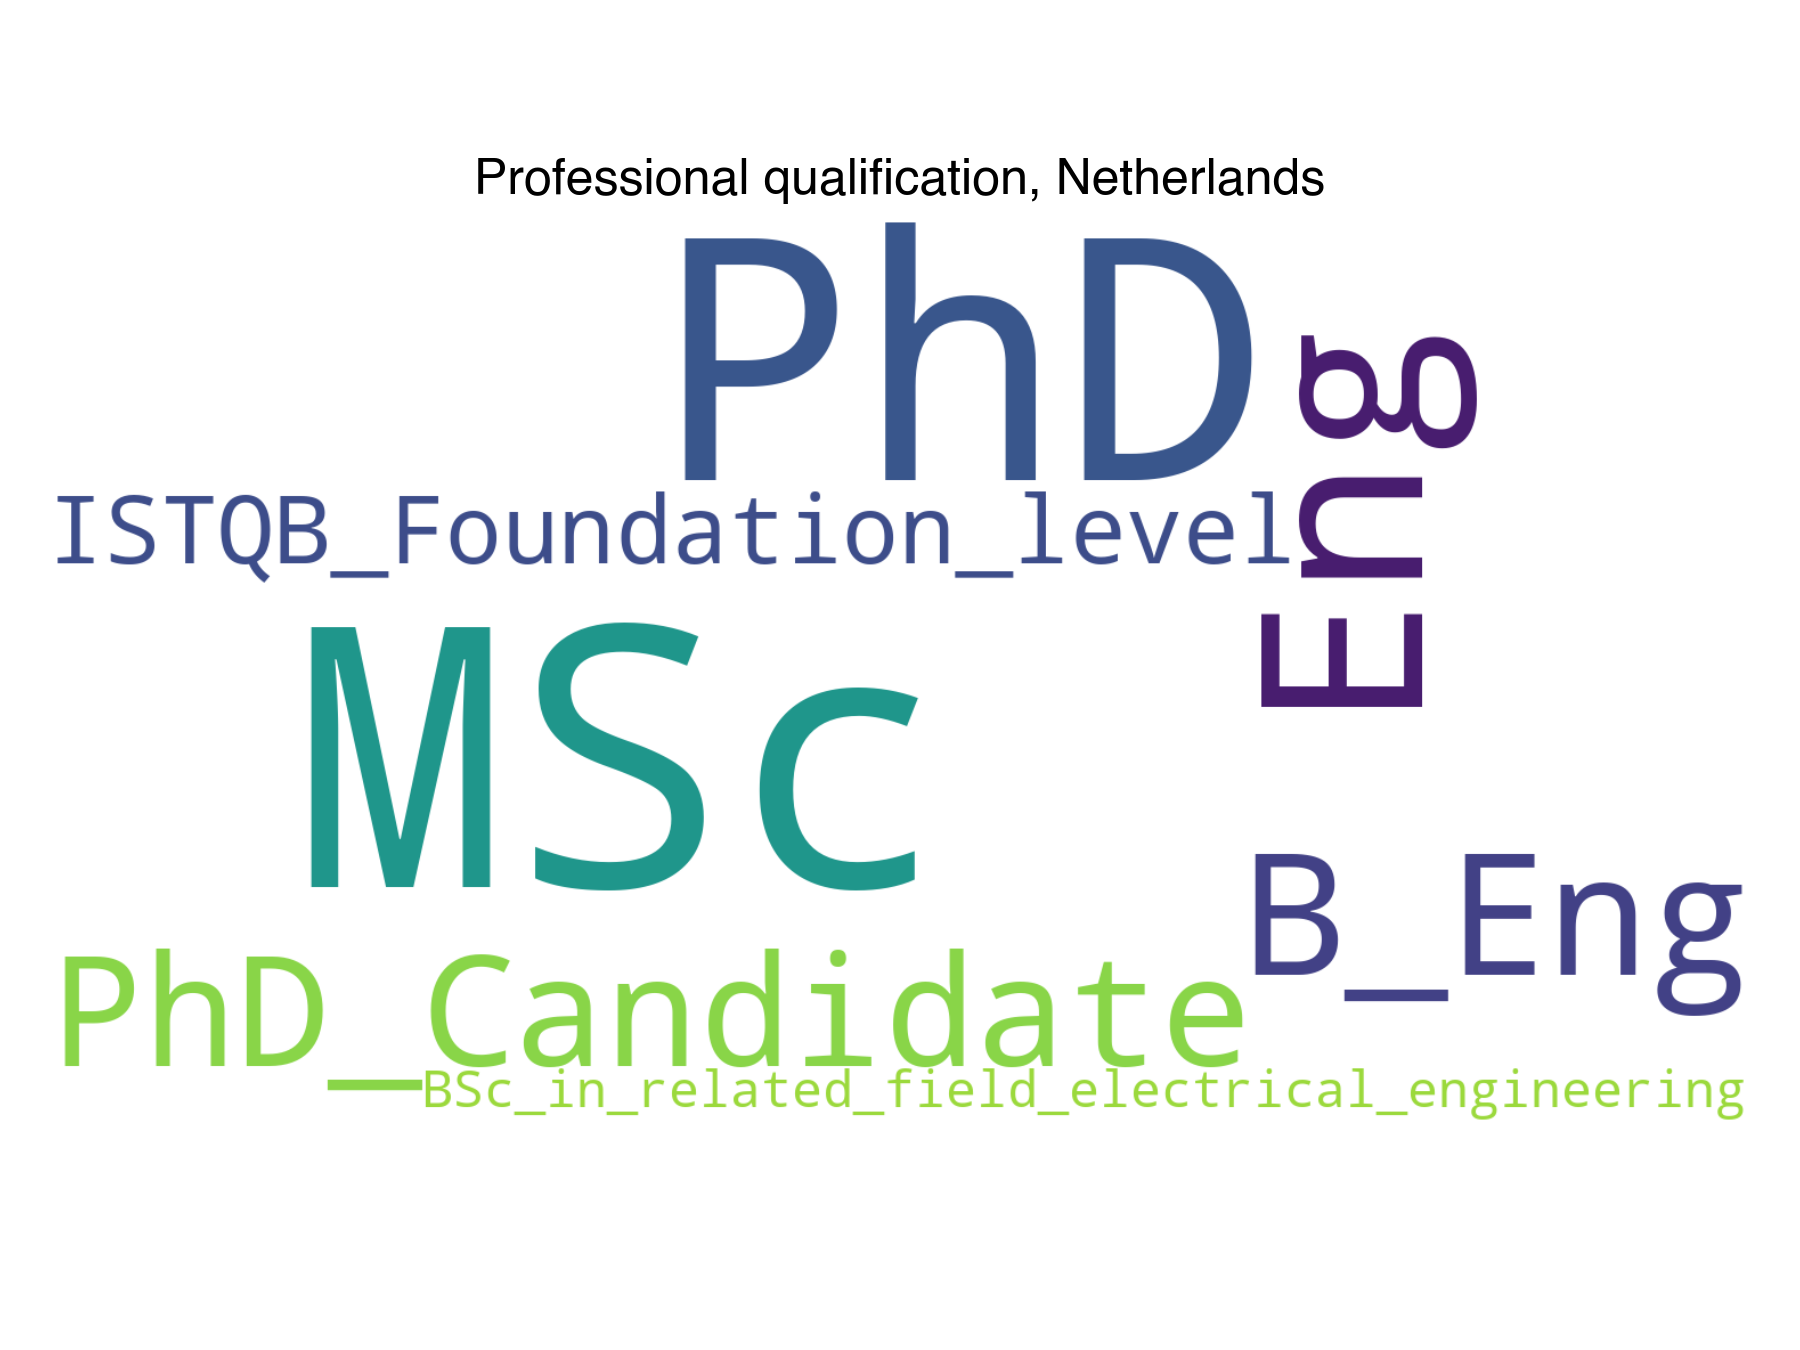
Highest level of education for Netherlands
Count
Percentage
Percentage in 2018
Difference with previous year
PhD
34
51.52
50
1.52
WO (Wetenschappelijk onderwijs) Master
26
39.39
37.04
2.36
HBO (Hoger beroepsonderwijs) Master
3
4.55
5.56
-1.01
HBO (Hoger beroepsonderwijs) Bachelor
2
3.03
1.85
1.18
WO (Wetenschappelijk onderwijs) Bachelor
1
1.52
5.56
-4.04
Download CSV
2022-08-22T11:26:34.204276
image/svg+xml
Matplotlib v3.5.2, https://matplotlib.org/
PNG SVG
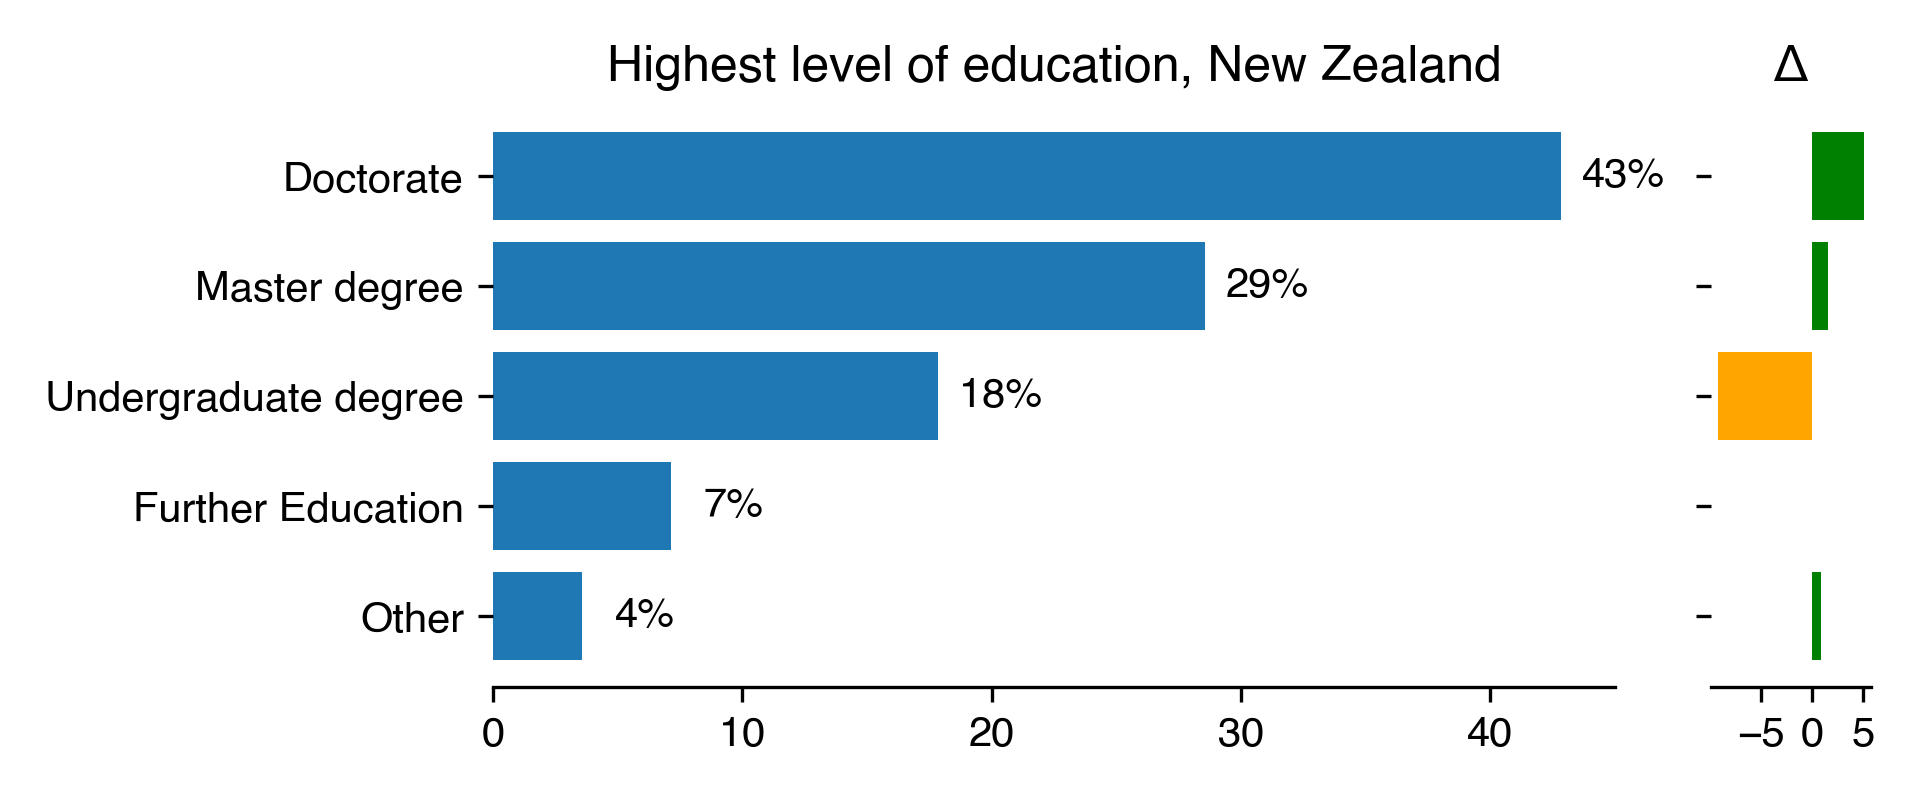
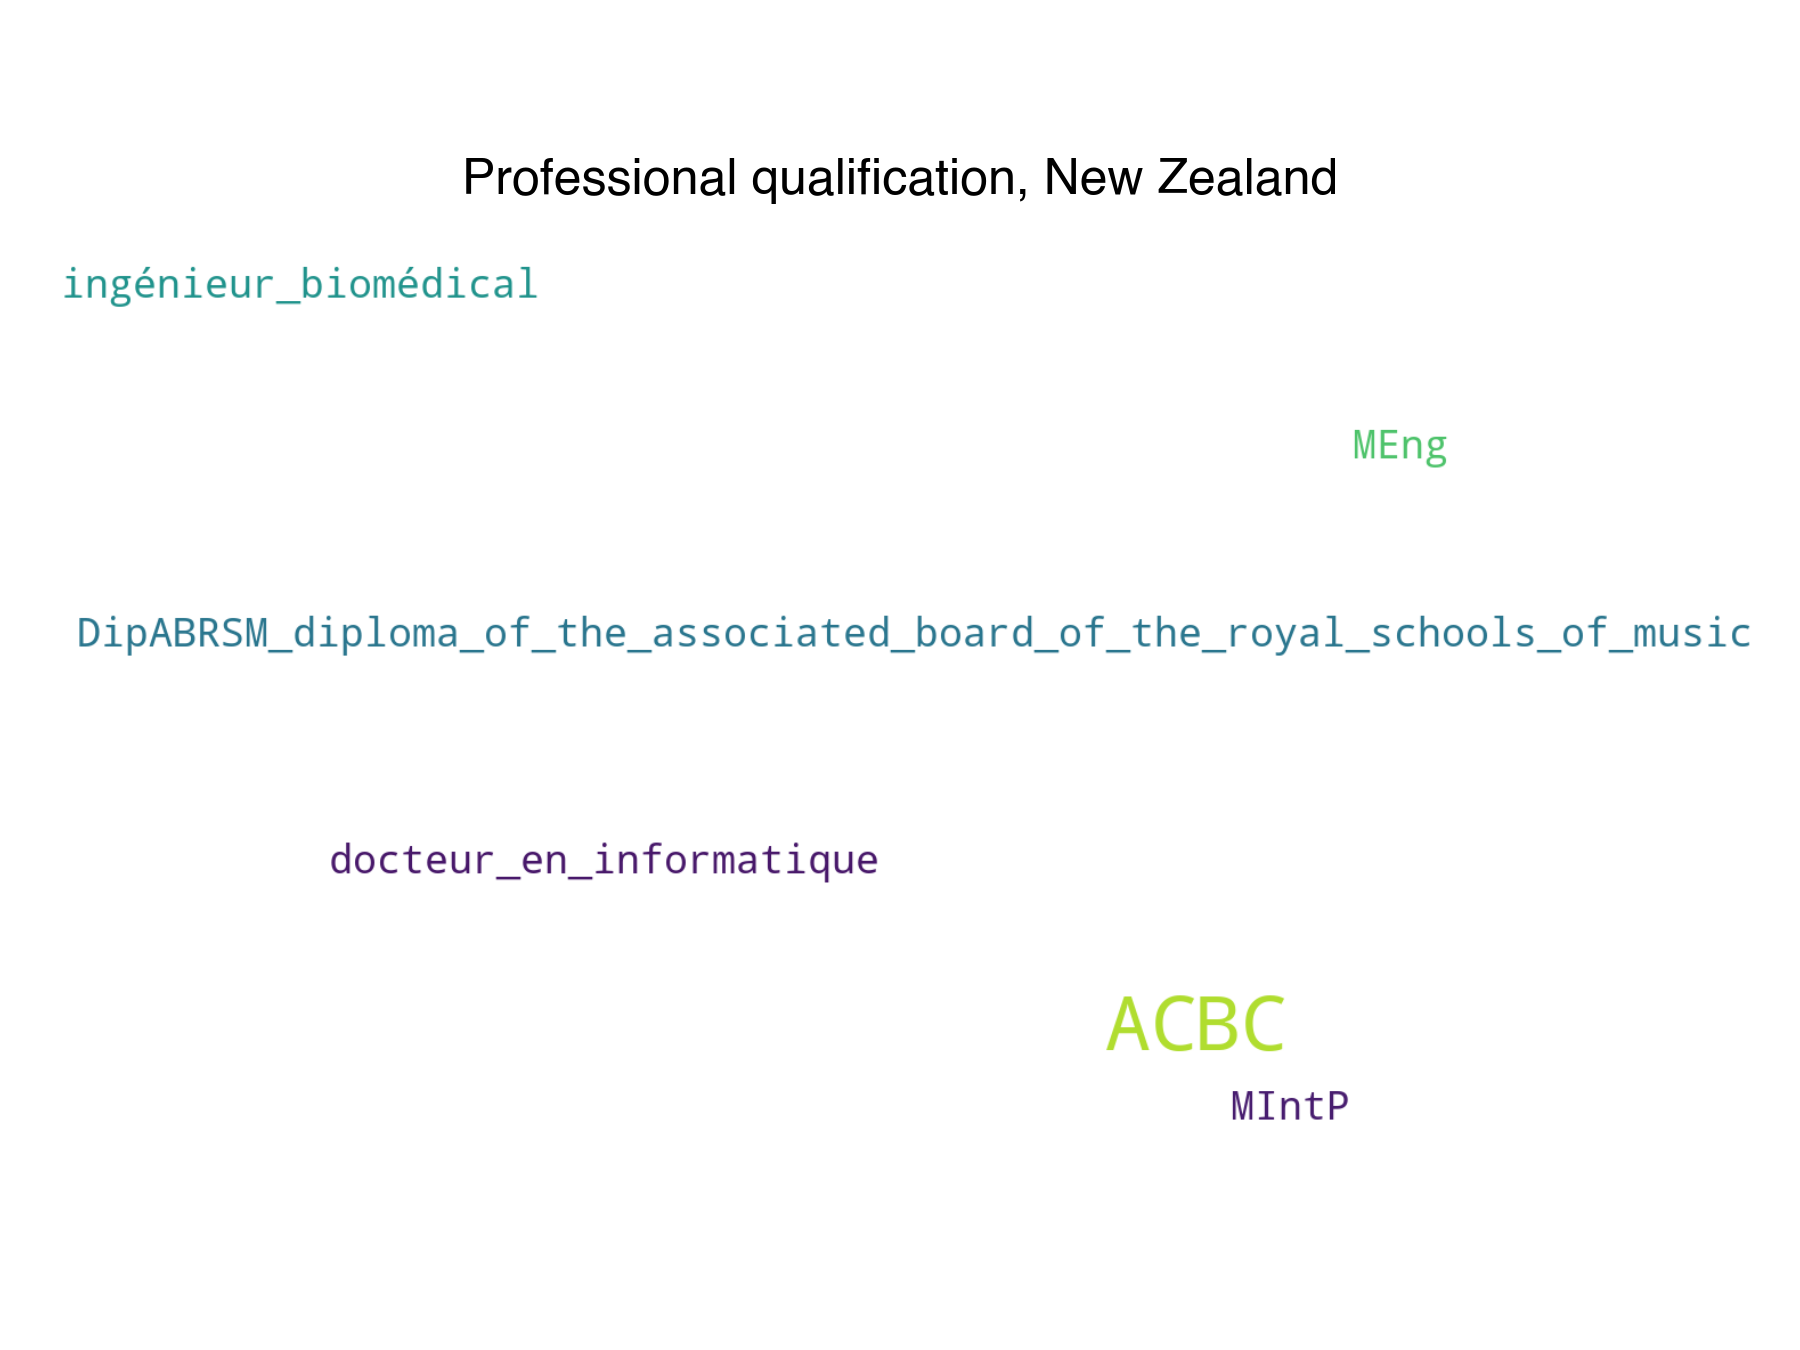
Highest level of education for New Zealand
Count
Percentage
Percentage in 2018
Difference with previous year
Doctorate
12
42.86
37.84
5.02
Master degree
8
28.57
27.03
1.54
Undergraduate degree
5
17.86
27.03
-9.17
Further Education
2
7.14
nan
nan
Other
1
3.57
2.7
0.87
Download CSV
2022-08-22T11:26:34.775842
image/svg+xml
Matplotlib v3.5.2, https://matplotlib.org/
PNG SVG
Highest level of education for South Africa
Count
Percentage
2
100
Download CSV
2022-08-22T11:26:35.020176
image/svg+xml
Matplotlib v3.5.2, https://matplotlib.org/
PNG SVG
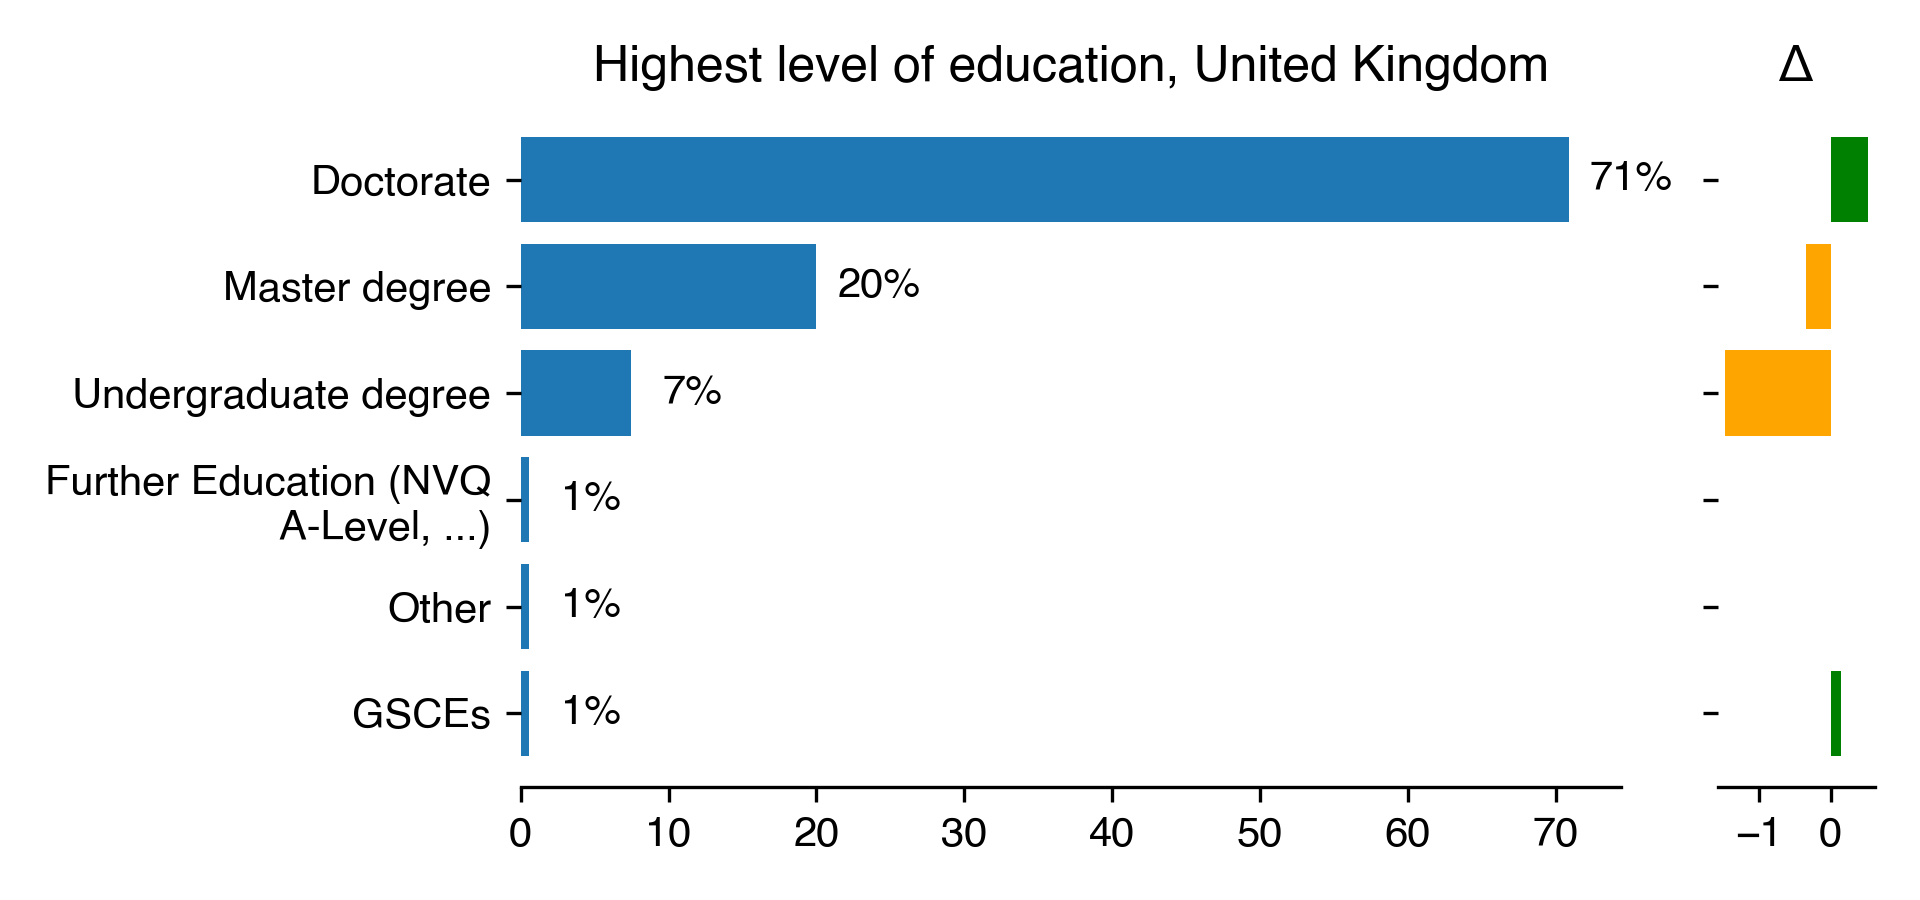
Highest level of education for United Kingdom
Count
Percentage
Percentage in 2018
Difference with previous year
Doctorate
124
70.86
70.34
0.52
Master degree
35
20
20.34
-0.34
Undergraduate degree
13
7.43
8.9
-1.47
Further Education (NVQ A-Level, …)
1
0.57
nan
nan
Other
1
0.57
nan
nan
GSCEs
1
0.57
0.42
0.15
Download CSV
2022-08-22T11:26:35.405927
image/svg+xml
Matplotlib v3.5.2, https://matplotlib.org/
PNG SVG
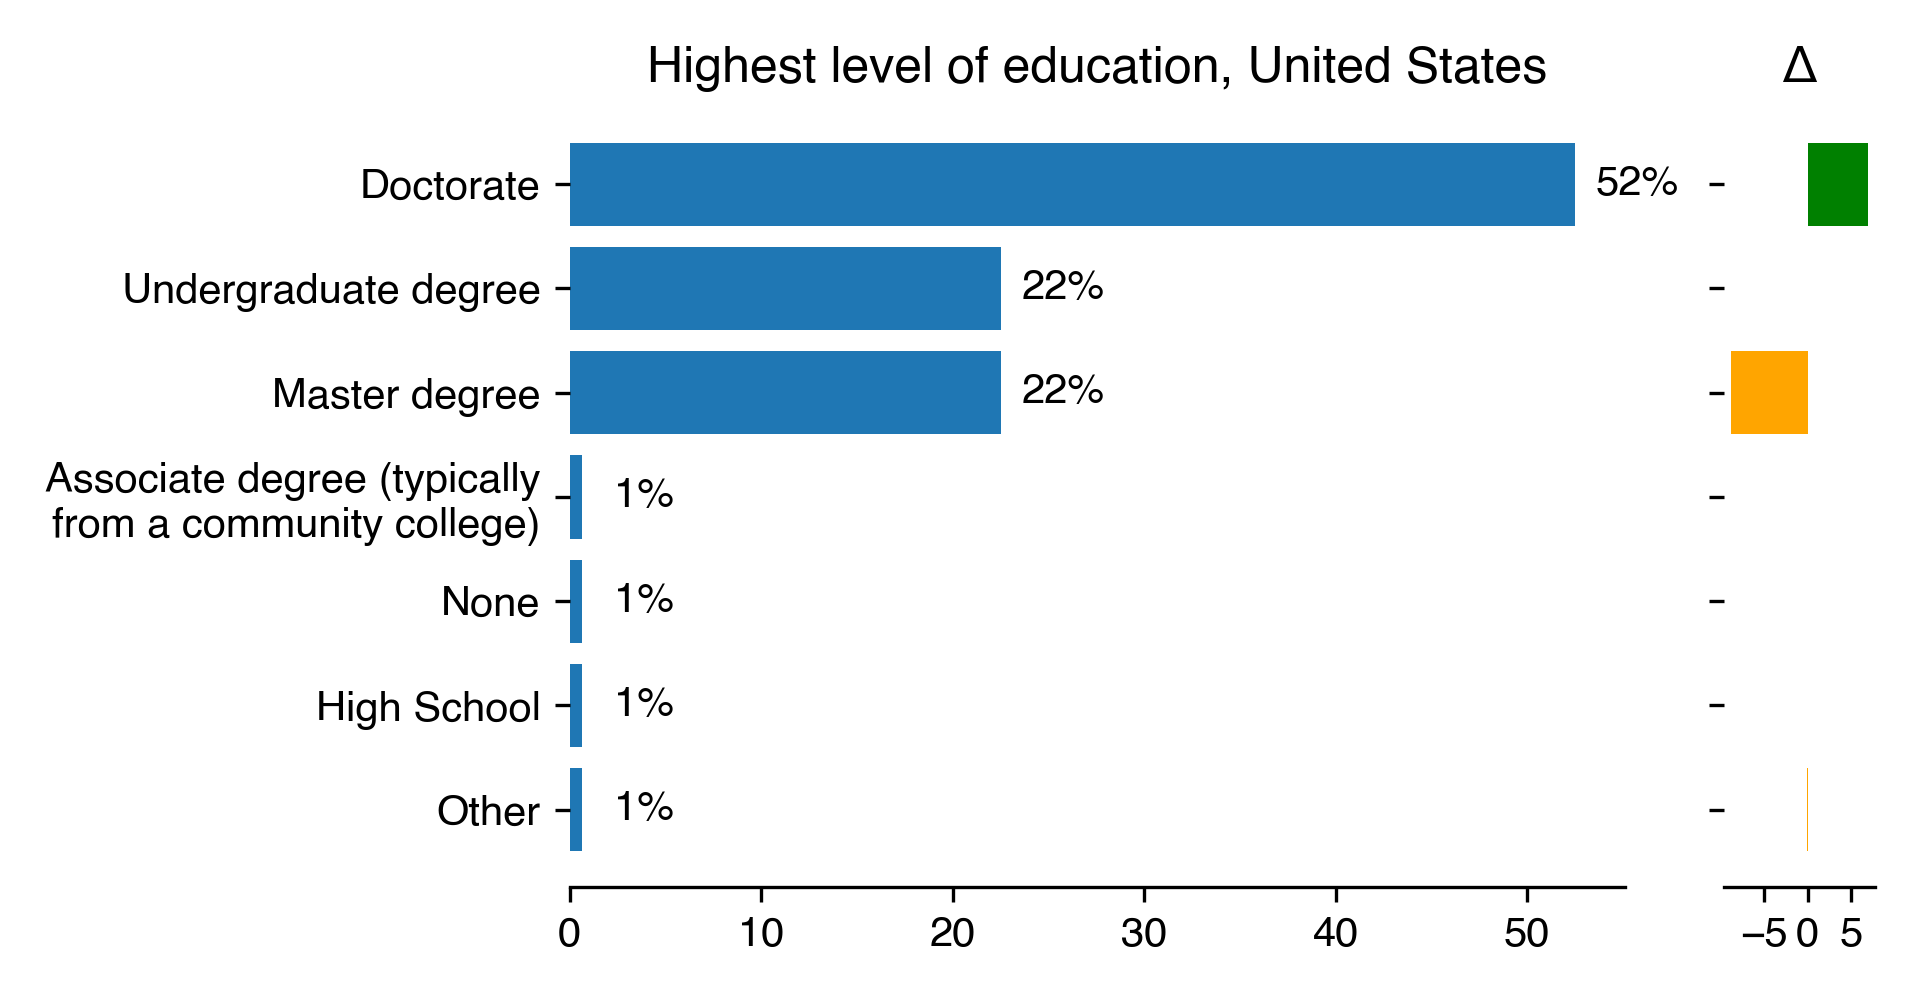
Highest level of education for United States
Count
Percentage
Percentage in 2018
Difference with previous year
Doctorate
84
52.5
45.58
6.92
Undergraduate degree
36
22.5
22.45
0.05
Master degree
36
22.5
31.29
-8.79
Associate degree (typically from a community college)
1
0.62
nan
nan
None
1
0.62
nan
nan
High School
1
0.62
nan
nan
Other
1
0.62
0.68
-0.06
Download CSV
2022-08-22T11:26:35.888588
image/svg+xml
Matplotlib v3.5.2, https://matplotlib.org/
PNG SVG
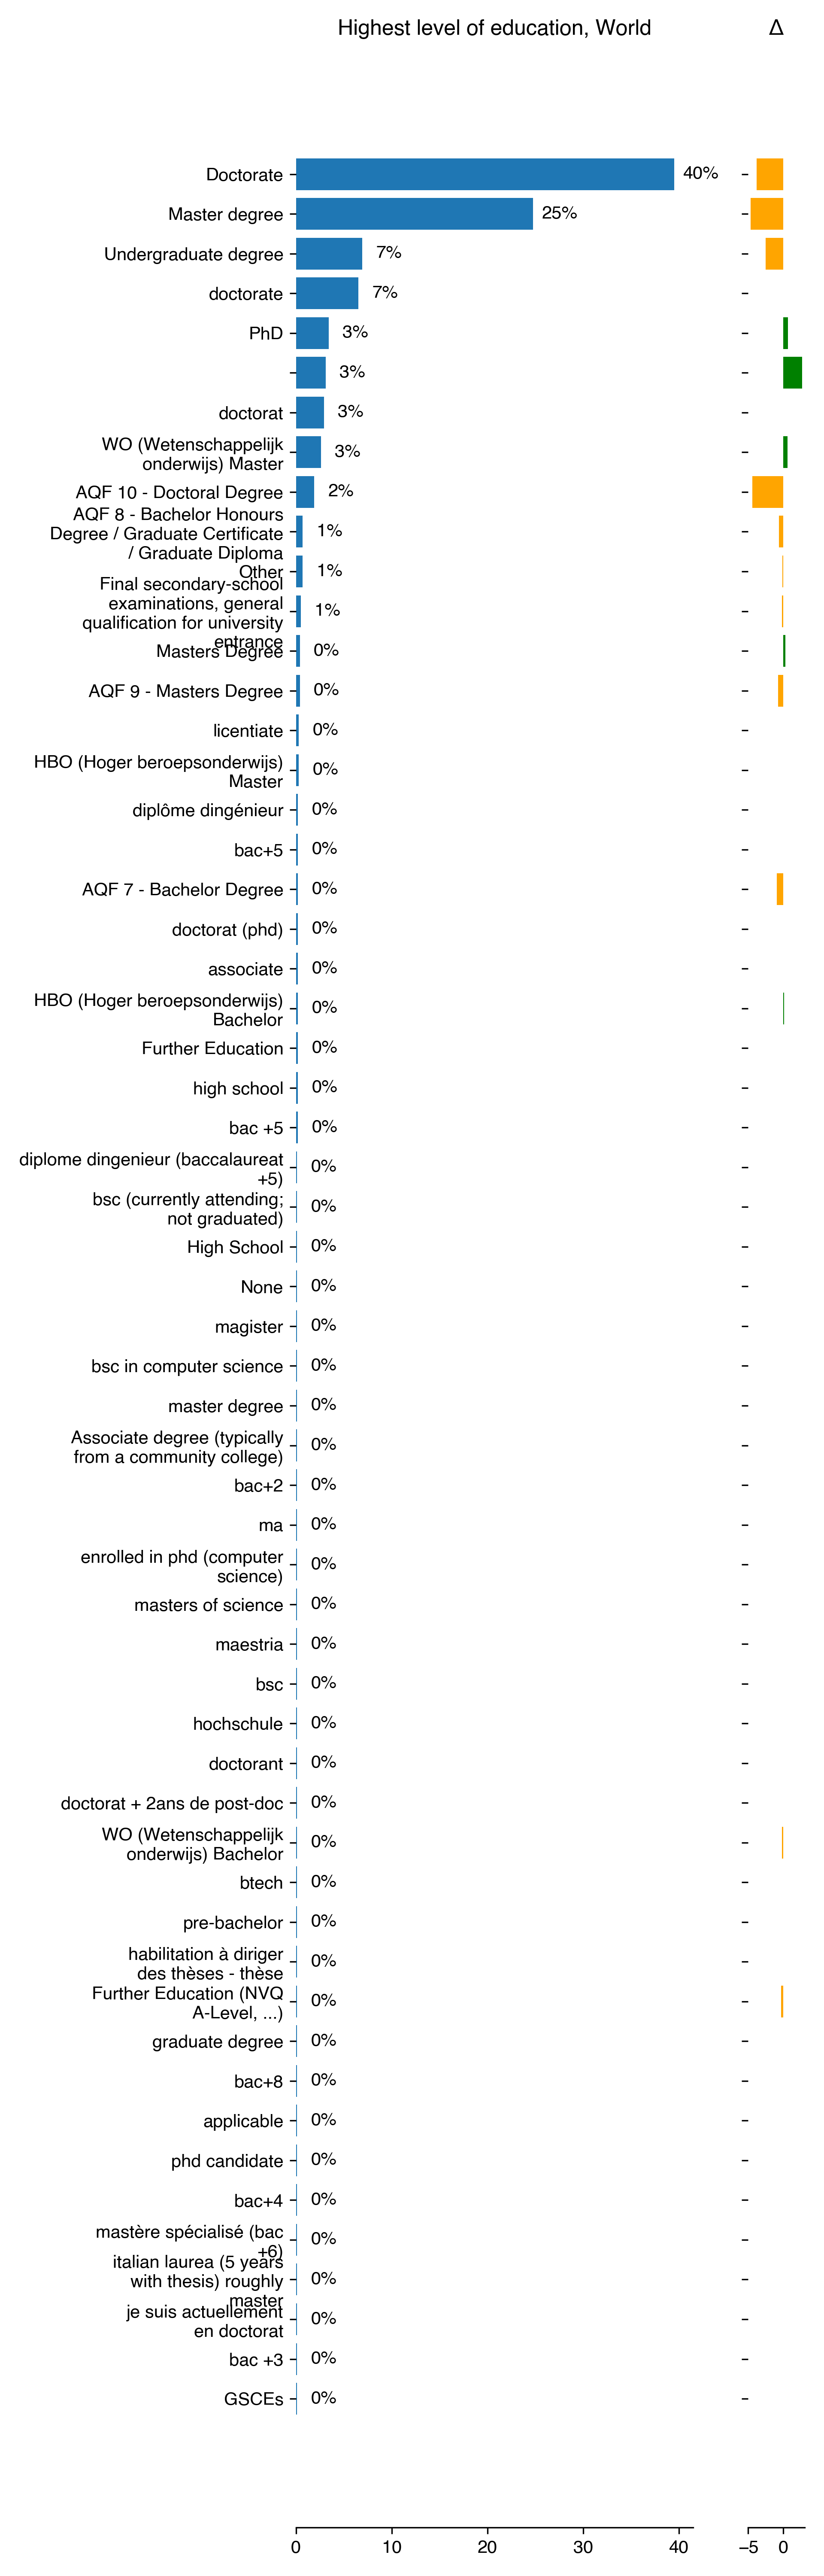
Highest level of education for World
Count
Percentage
Percentage in 2018
Difference with previous year
Doctorate
394
39.52
43.32
-3.8
Master degree
247
24.77
29.45
-4.67
Undergraduate degree
69
6.92
9.45
-2.53
doctorate
65
6.52
nan
nan
PhD
34
3.41
2.71
0.7
31
3.11
0.4
2.71
doctorat
29
2.91
nan
nan
WO (Wetenschappelijk onderwijs) Master
26
2.61
2.01
0.6
AQF 10 - Doctoral Degree
19
1.91
6.33
-4.43
AQF 8 - Bachelor Honours Degree / Graduate Certificate / Graduate Diploma
7
0.7
1.31
-0.6
Other
7
0.7
0.8
-0.1
Final secondary-school examinations, general qualification for university entrance
5
0.5
0.7
-0.2
Masters Degree
4
0.4
0.1
0.3
AQF 9 - Masters Degree
4
0.4
1.11
-0.7
licentiate
3
0.3
nan
nan
HBO (Hoger beroepsonderwijs) Master
3
0.3
0.3
-0
diplôme dingénieur
2
0.2
nan
nan
bac+5
2
0.2
nan
nan
AQF 7 - Bachelor Degree
2
0.2
1.11
-0.9
doctorat (phd)
2
0.2
nan
nan
associate
2
0.2
nan
nan
HBO (Hoger beroepsonderwijs) Bachelor
2
0.2
0.1
0.1
Further Education
2
0.2
nan
nan
high school
2
0.2
nan
nan
bac +5
2
0.2
nan
nan
diplome dingenieur (baccalaureat +5)
1
0.1
nan
nan
bsc (currently attending; not graduated)
1
0.1
nan
nan
High School
1
0.1
nan
nan
None
1
0.1
nan
nan
magister
1
0.1
nan
nan
bsc in computer science
1
0.1
nan
nan
master degree
1
0.1
nan
nan
Associate degree (typically from a community college)
1
0.1
nan
nan
bac+2
1
0.1
nan
nan
ma
1
0.1
nan
nan
enrolled in phd (computer science)
1
0.1
nan
nan
masters of science
1
0.1
nan
nan
maestria
1
0.1
nan
nan
bsc
1
0.1
nan
nan
hochschule
1
0.1
nan
nan
doctorant
1
0.1
nan
nan
doctorat + 2ans de post-doc
1
0.1
nan
nan
WO (Wetenschappelijk onderwijs) Bachelor
1
0.1
0.3
-0.2
btech
1
0.1
nan
nan
pre-bachelor
1
0.1
nan
nan
habilitation à diriger des thèses - thèse
1
0.1
nan
nan
Further Education (NVQ A-Level, …)
1
0.1
0.4
-0.3
graduate degree
1
0.1
nan
nan
bac+8
1
0.1
nan
nan
applicable
1
0.1
nan
nan
phd candidate
1
0.1
nan
nan
bac+4
1
0.1
nan
nan
mastère spécialisé (bac +6)
1
0.1
nan
nan
italian laurea (5 years with thesis) roughly master
1
0.1
nan
nan
je suis actuellement en doctorat
1
0.1
nan
nan
bac +3
1
0.1
nan
nan
GSCEs
1
0.1
0.1
-0
Download CSV
2022-08-22T11:26:38.186875
image/svg+xml
Matplotlib v3.5.2, https://matplotlib.org/
PNG SVG
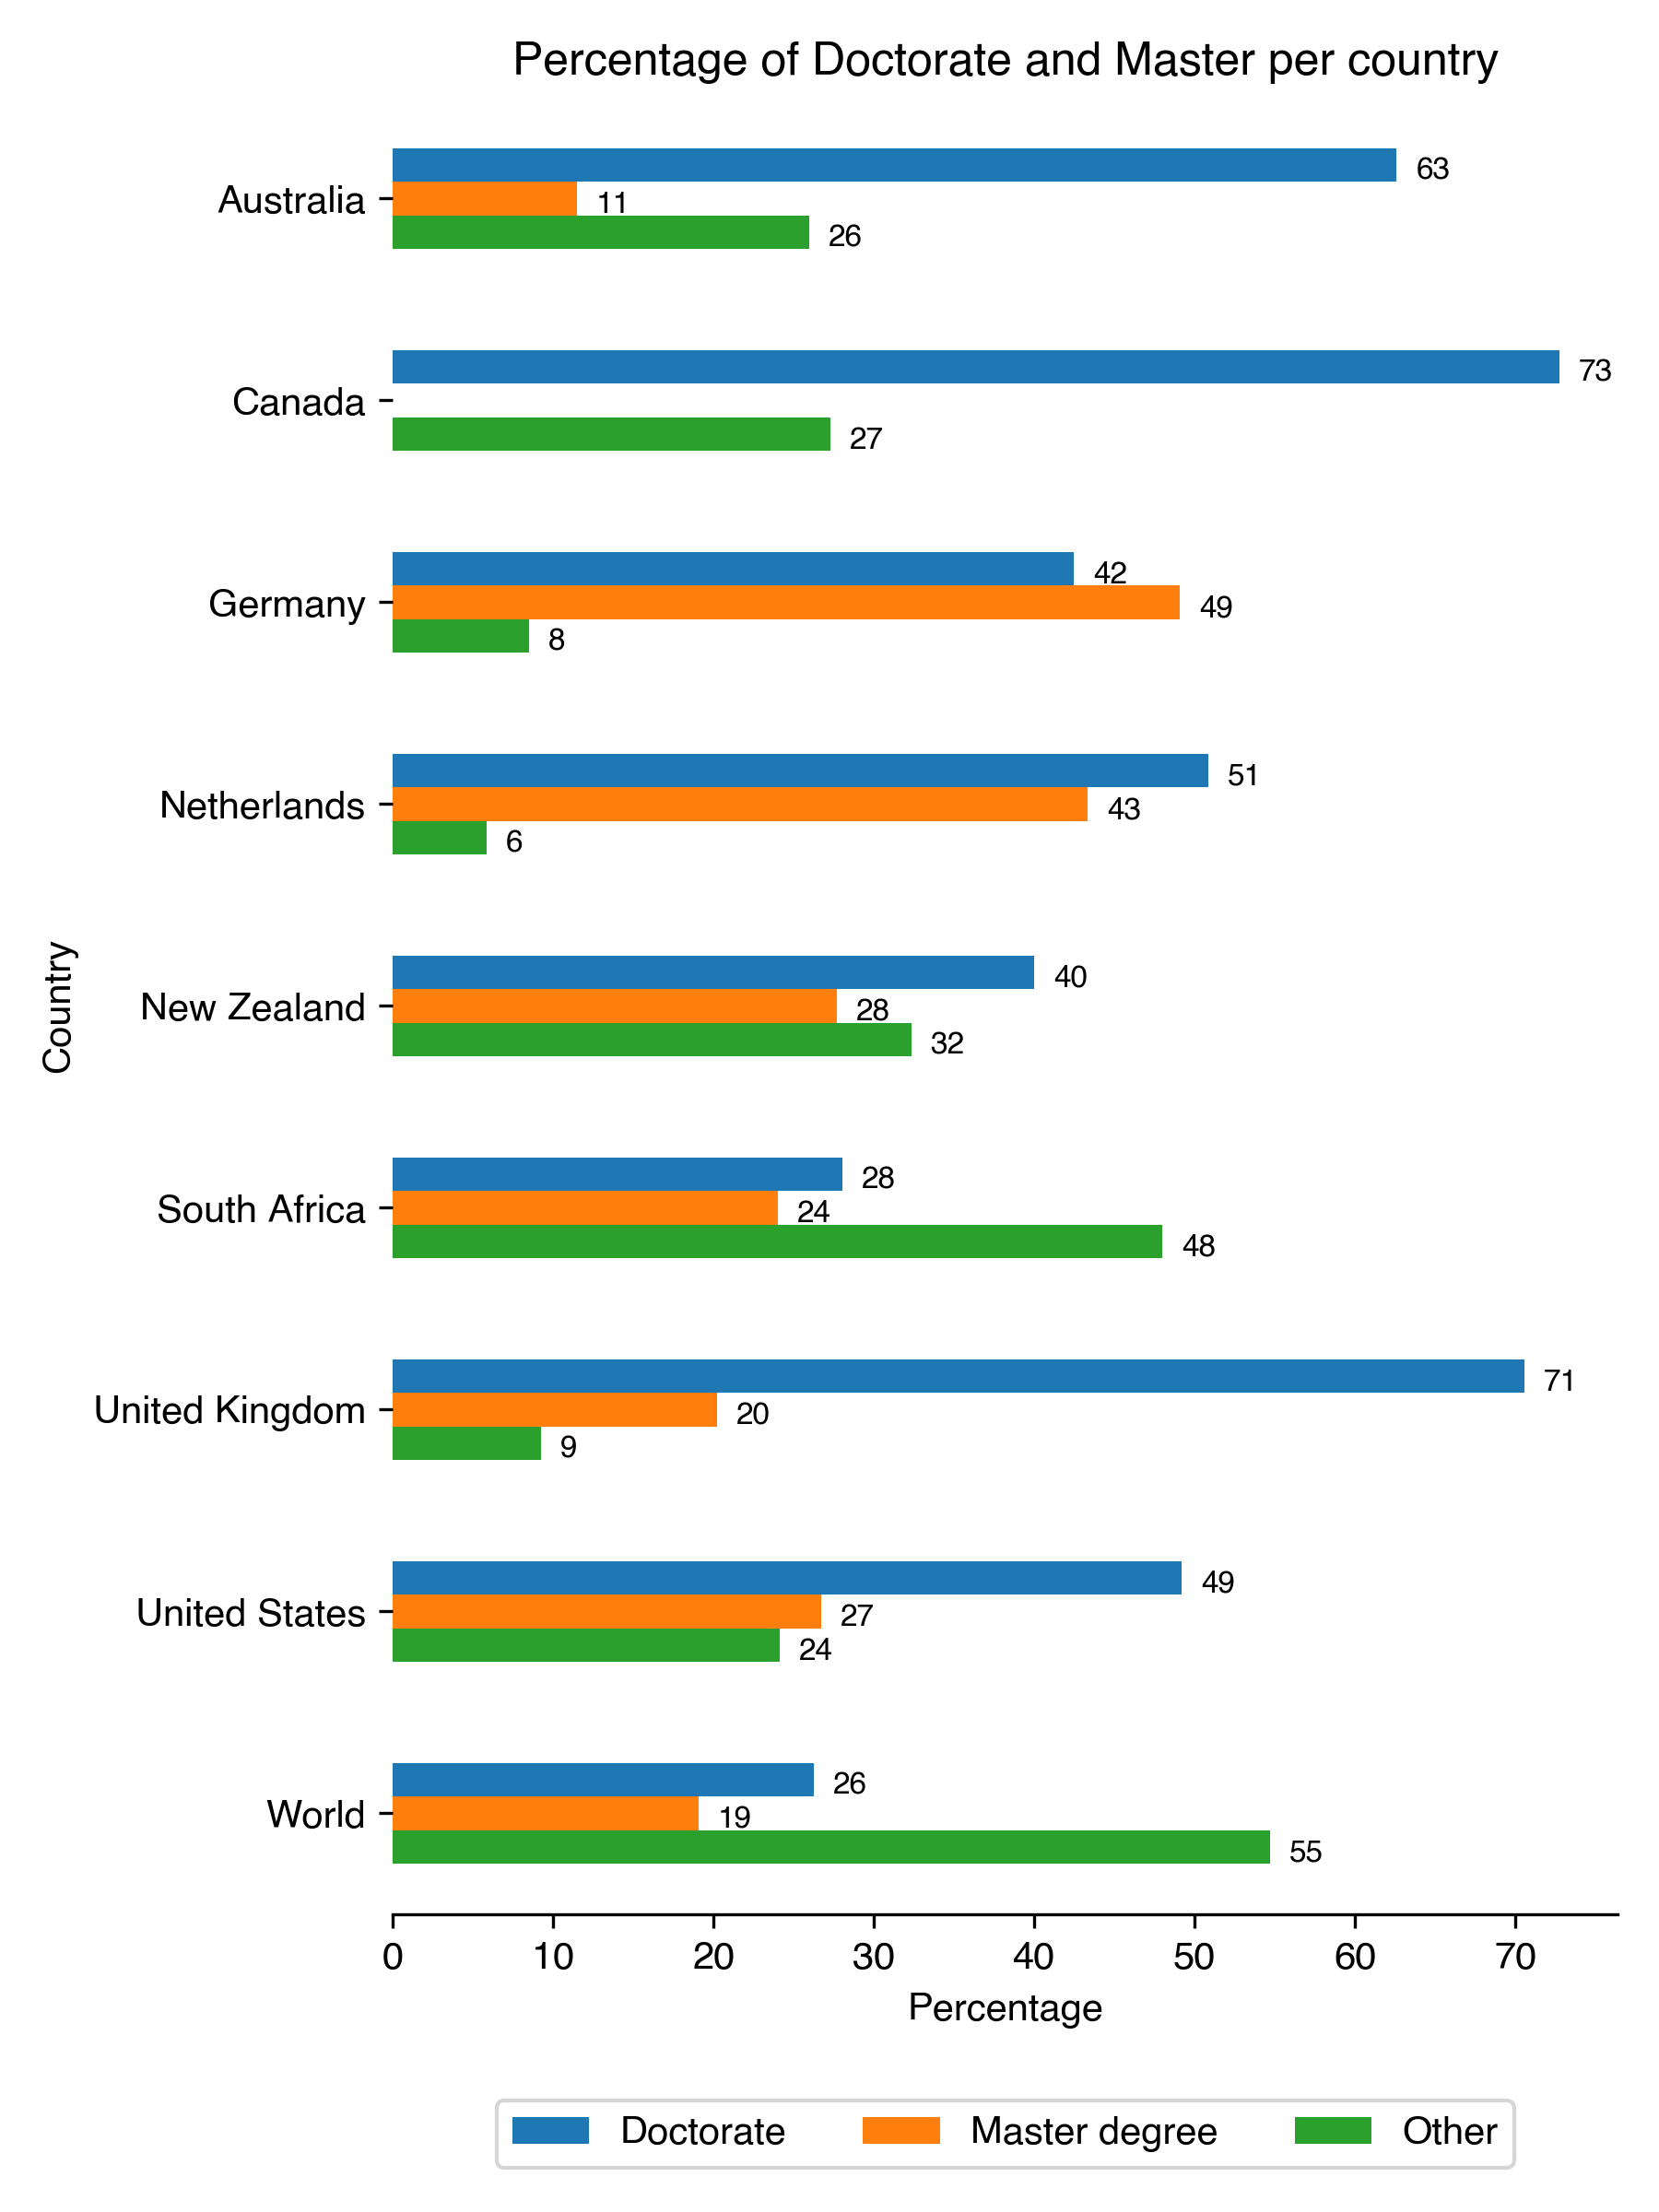
Even if the countries have different education levels, it is possible to match
them on the common “Doctorate” and “Master degree”. Therefore we compare them
with these two equivalent levels and merge all others under the category
“other”.
Country
education comparison
Total count
Percentage per countries
Australia
Doctorate
82
62.6
Australia
Other
34
25.95
Australia
Master degree
15
11.45
Canada
Doctorate
16
72.73
Canada
Other
6
27.27
Germany
Master degree
290
49.07
Germany
Doctorate
251
42.47
Germany
Other
50
8.46
Netherlands
Doctorate
61
50.83
Netherlands
Master degree
52
43.33
Netherlands
Other
7
5.83
New Zealand
Doctorate
26
40
New Zealand
Other
21
32.31
New Zealand
Master degree
18
27.69
South Africa
Other
12
48
South Africa
Doctorate
7
28
South Africa
Master degree
6
24
United Kingdom
Doctorate
290
70.56
United Kingdom
Master degree
83
20.19
United Kingdom
Other
38
9.25
United States
Doctorate
151
49.19
United States
Master degree
82
26.71
United States
Other
74
24.1
World
Other
175
54.69
World
Doctorate
84
26.25
World
Master degree
61
19.06
Download CSV
2022-08-22T11:26:39.524451
image/svg+xml
Matplotlib v3.5.2, https://matplotlib.org/
PNG SVG
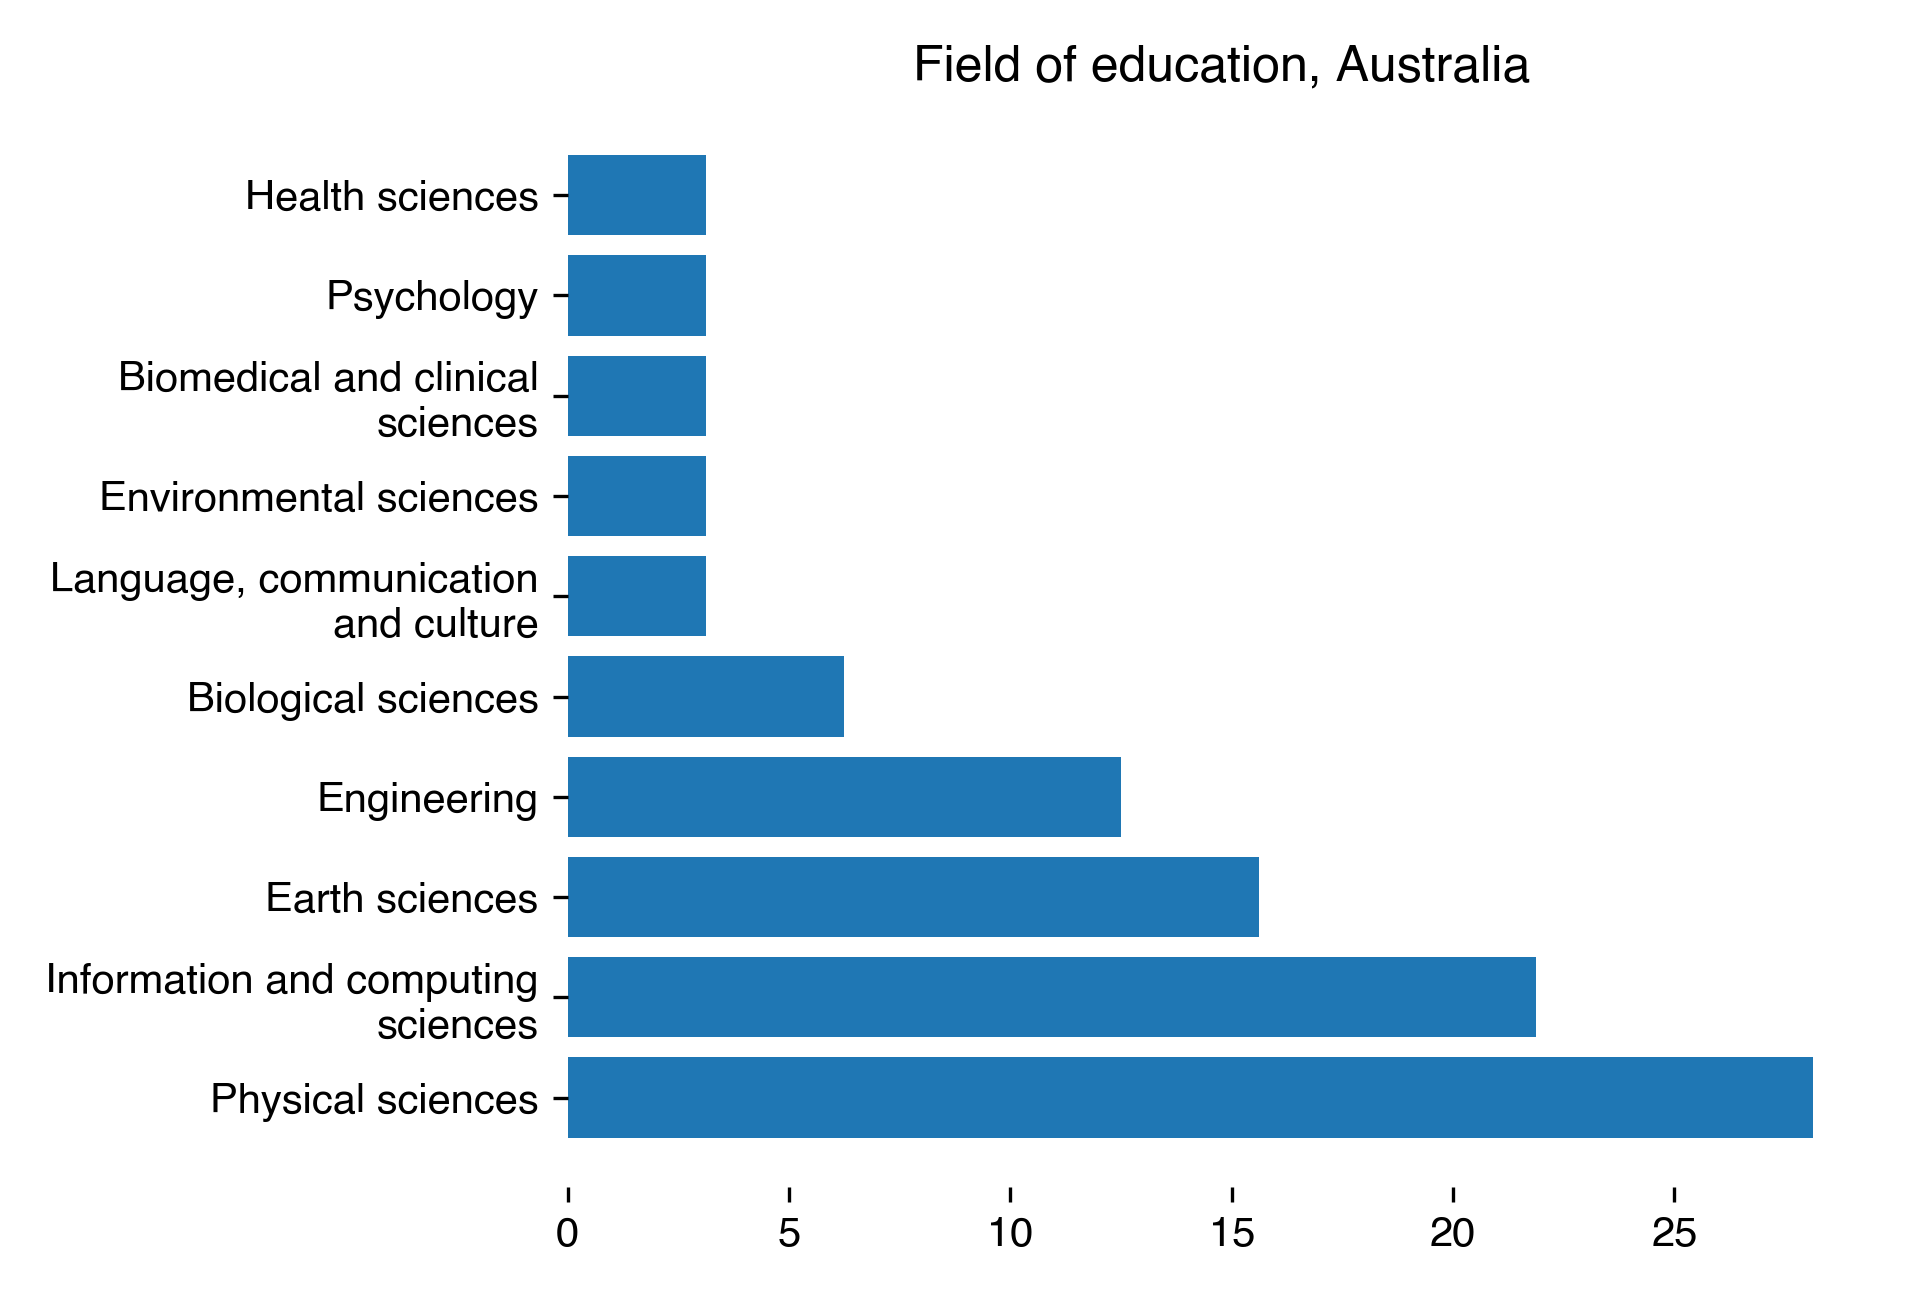
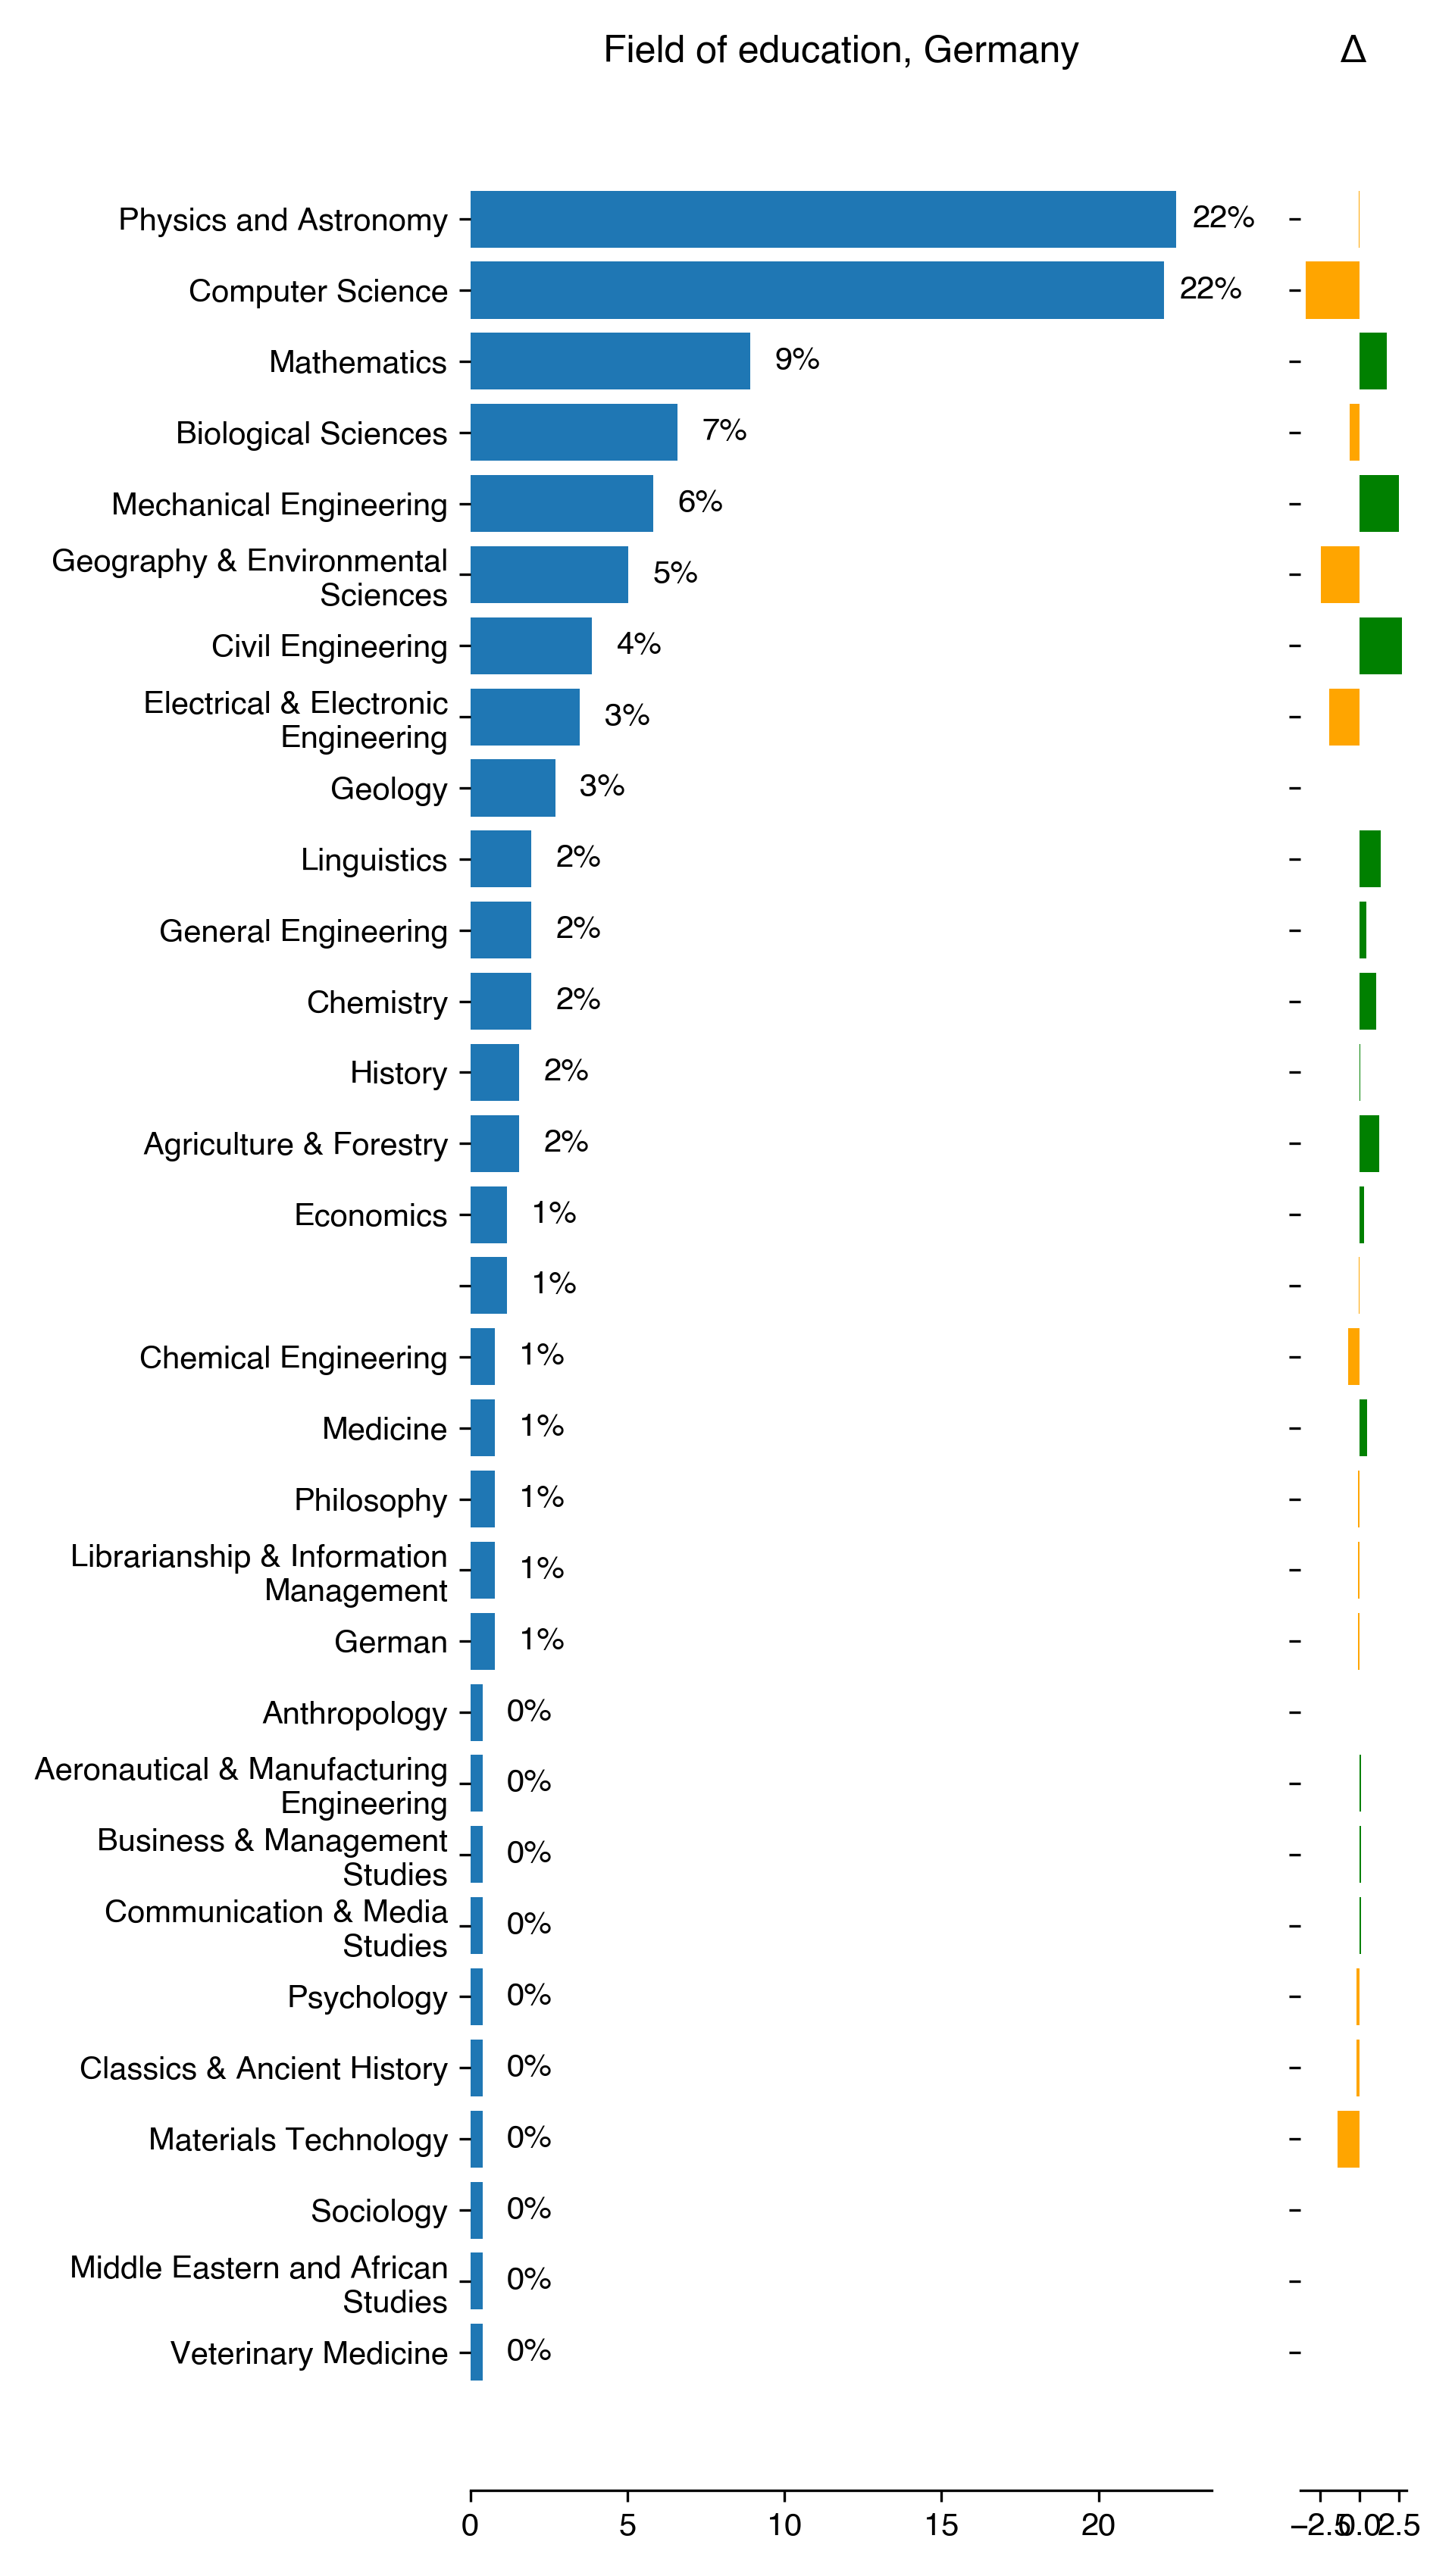
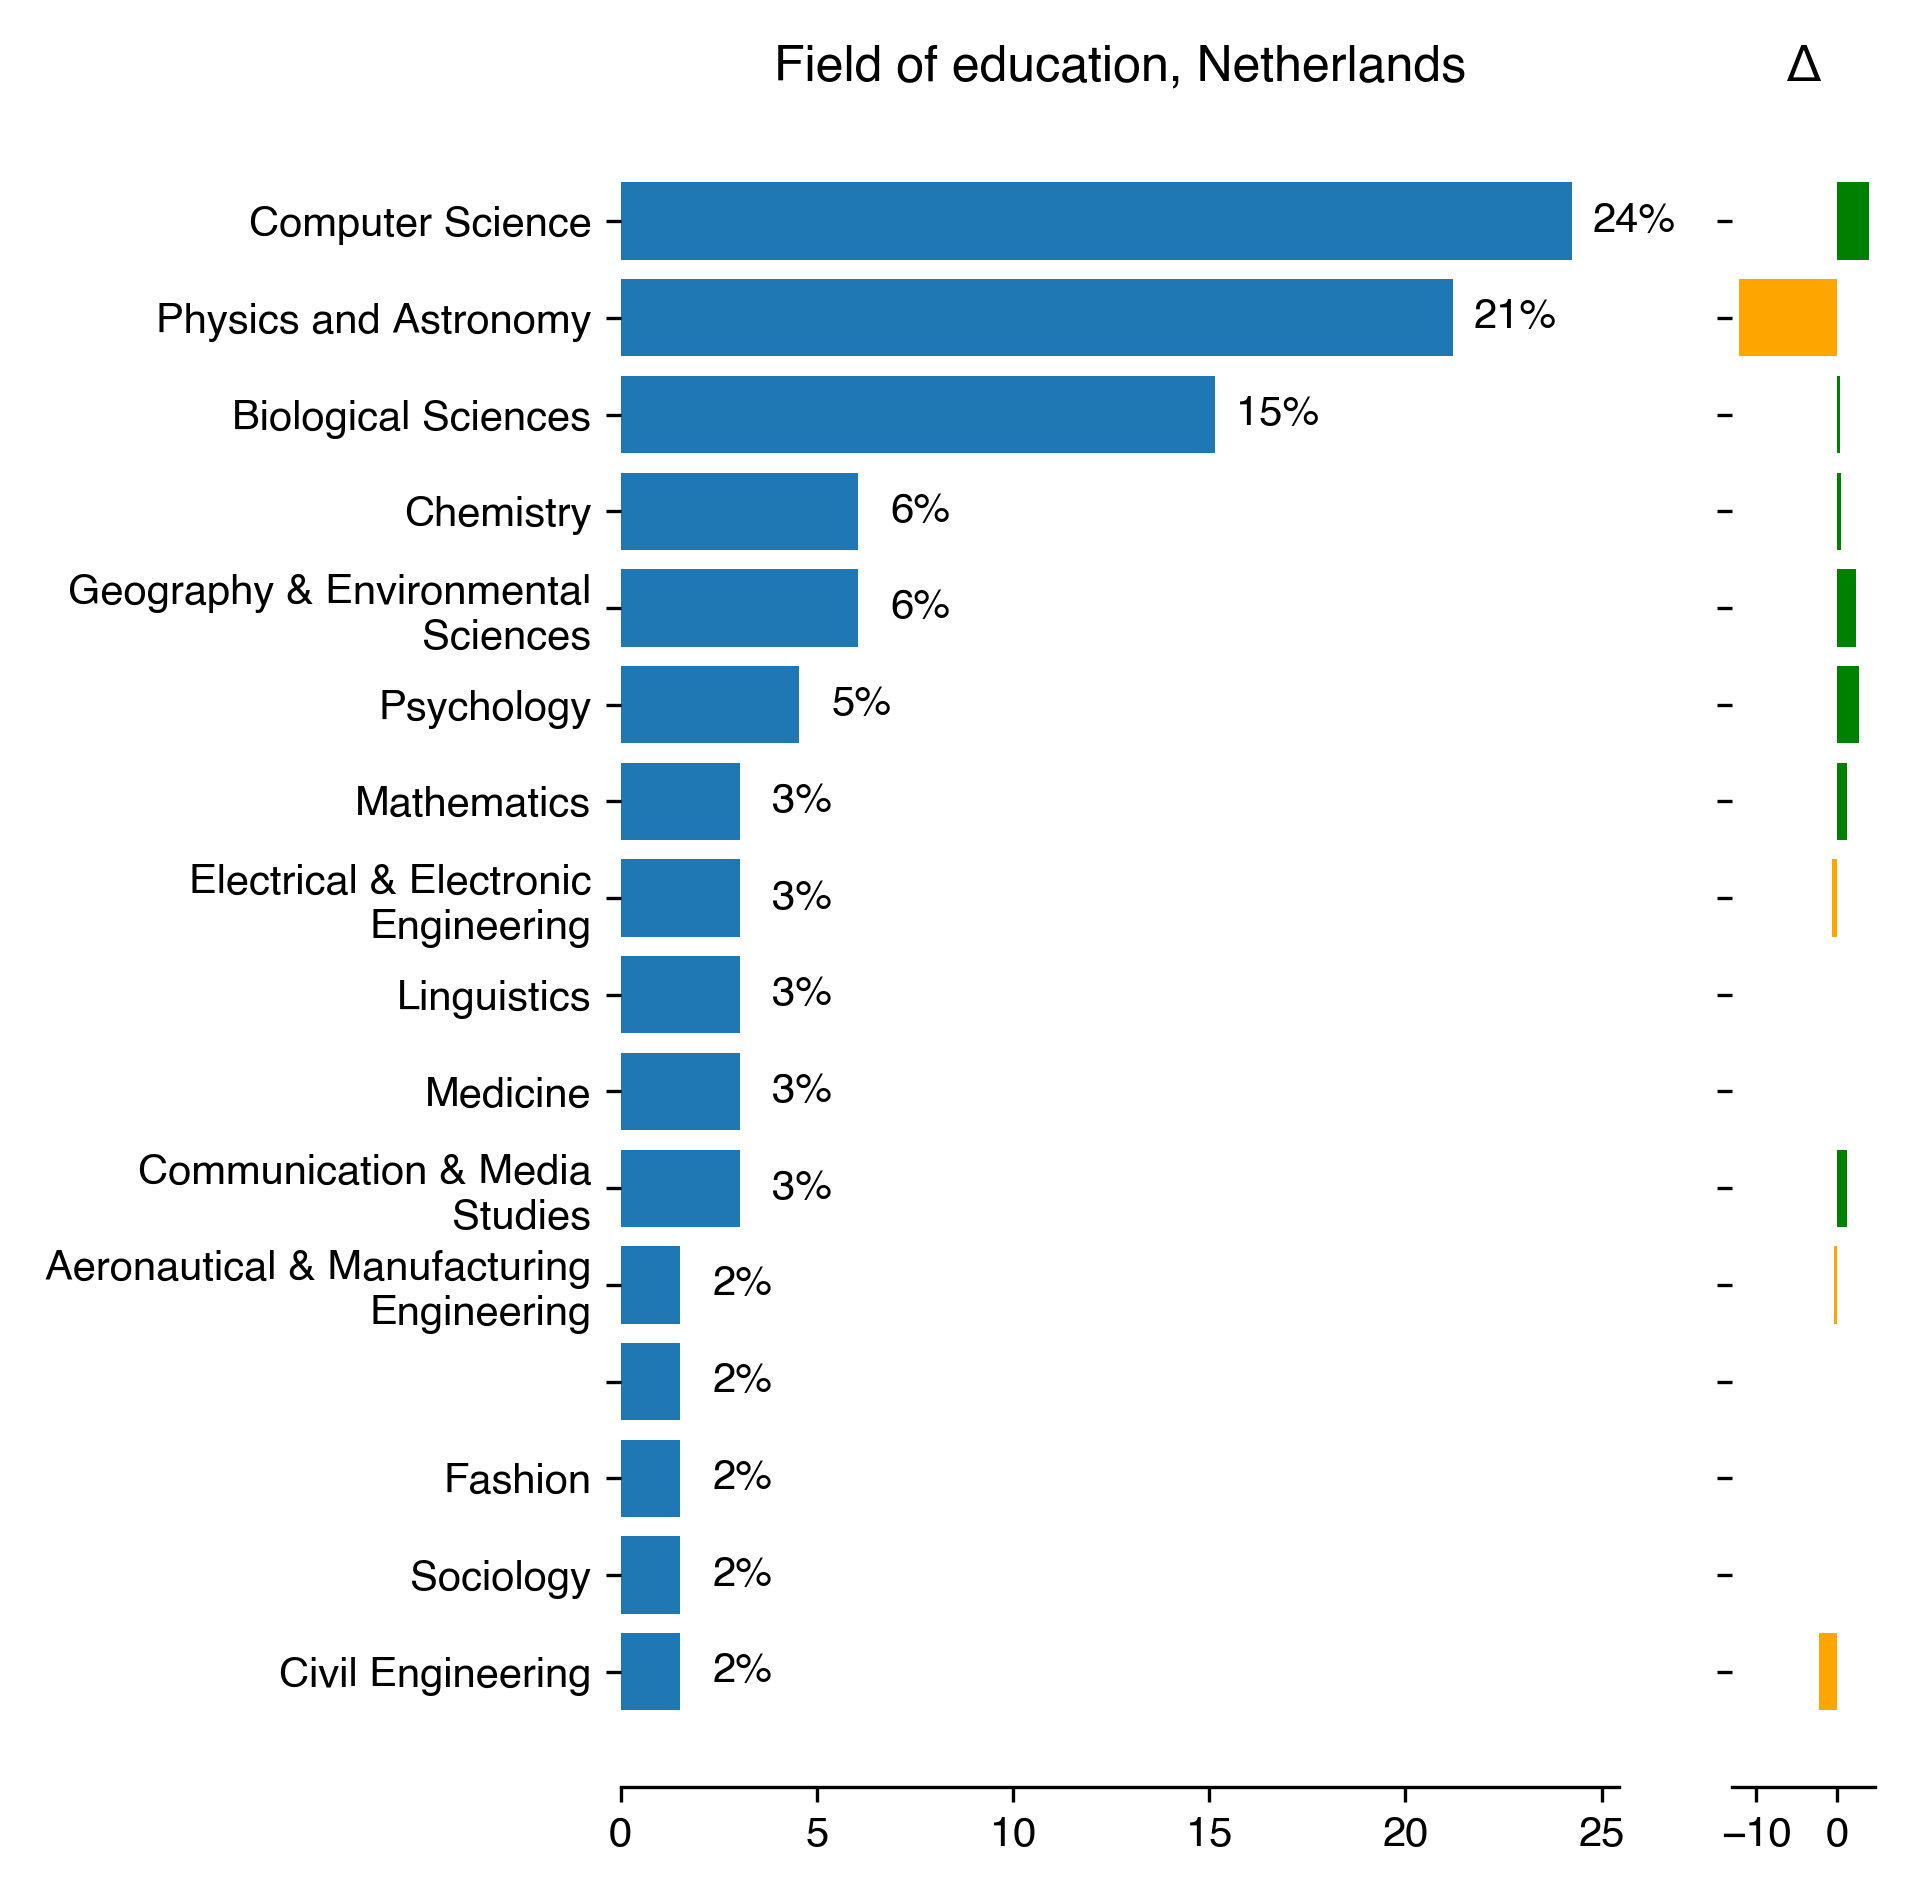
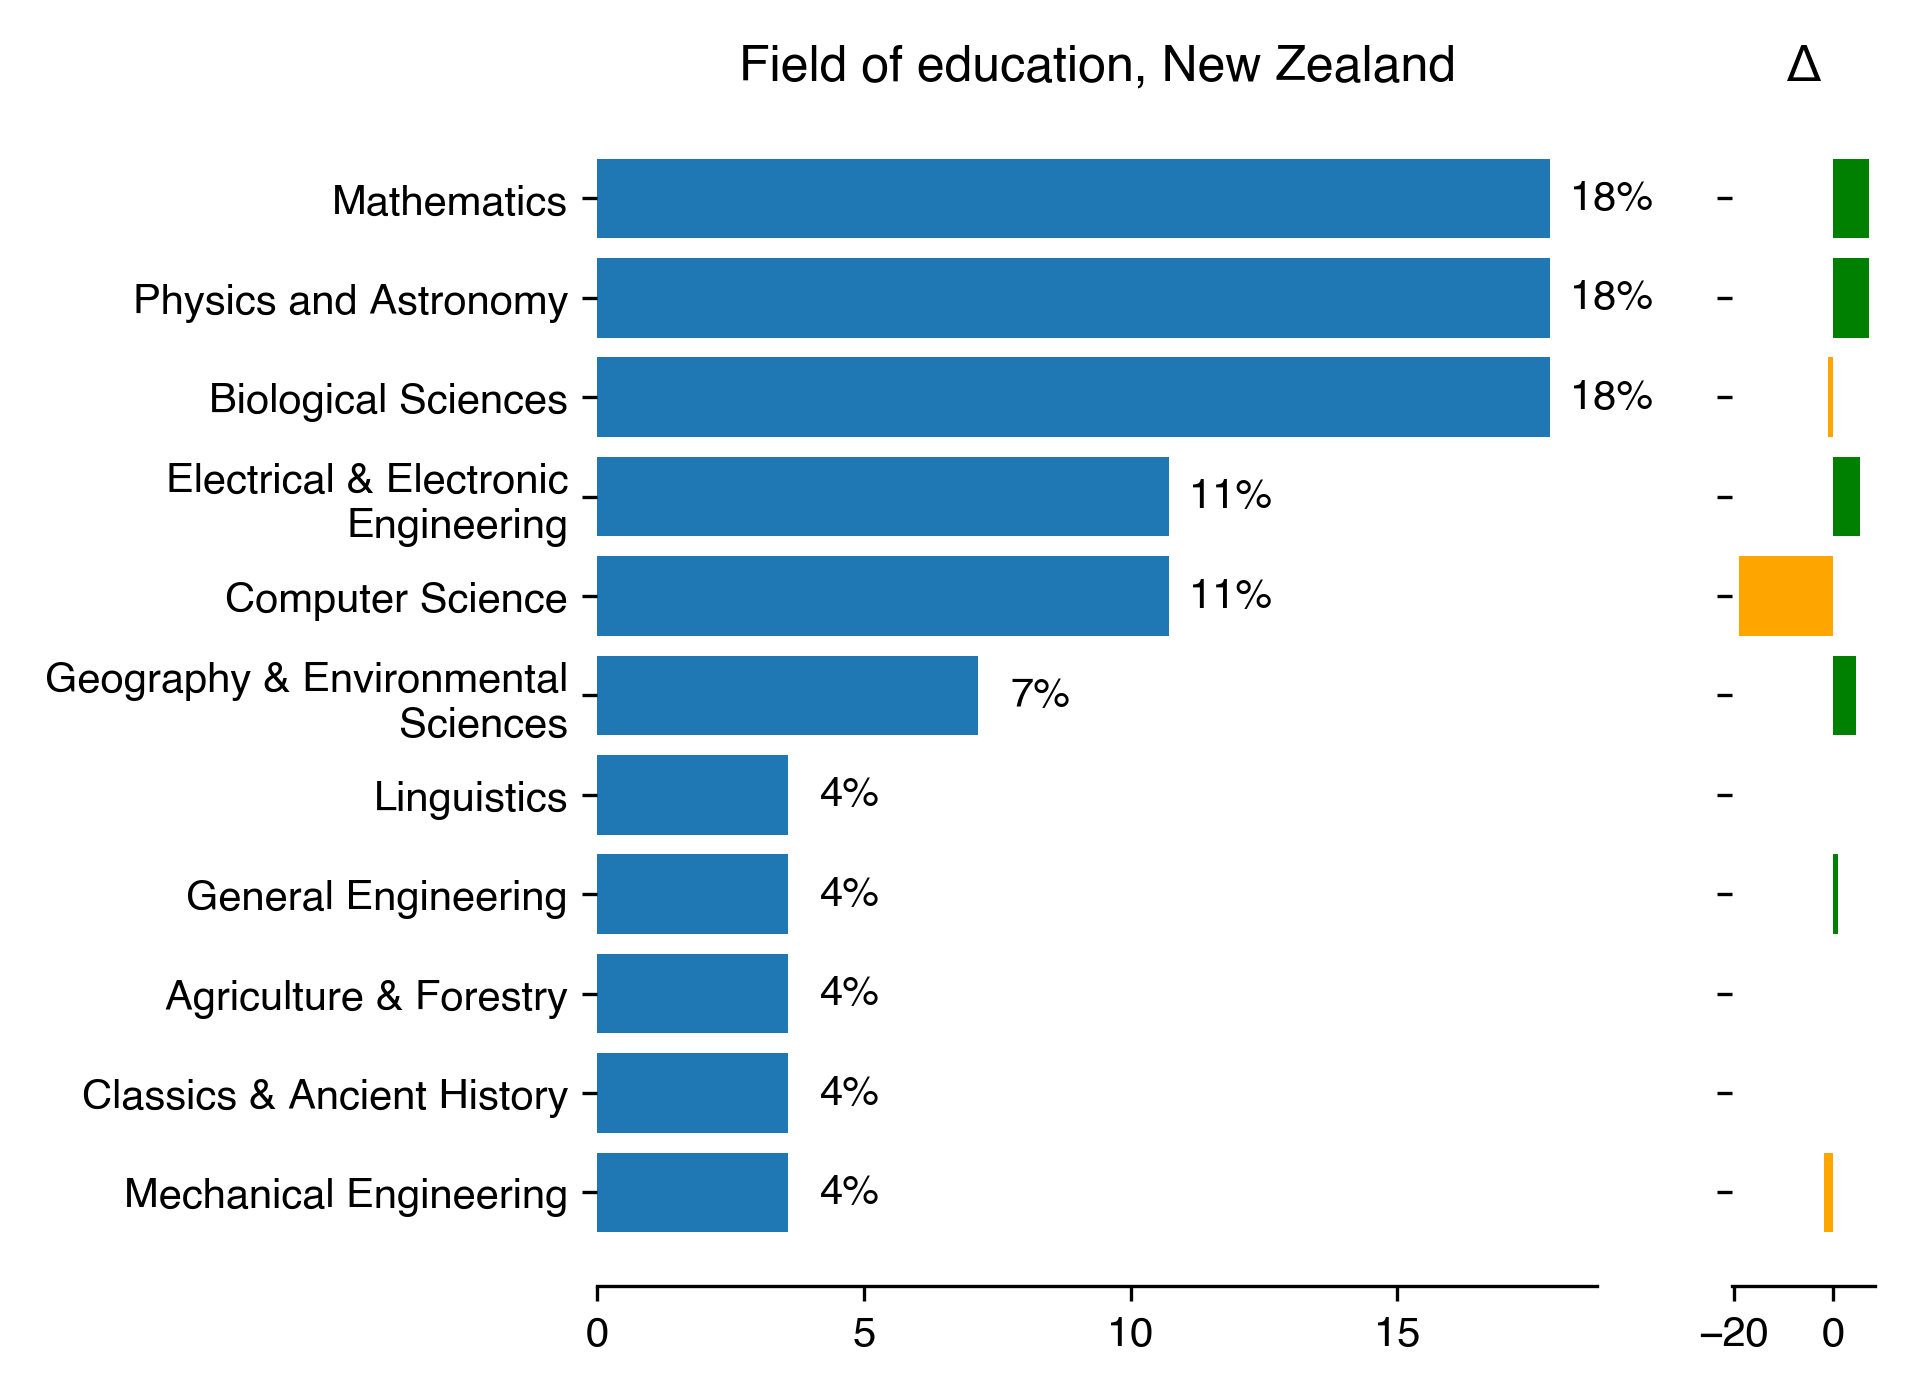
Alongside of question about education level we also asked the participants in
which field they finished their highest level of education. Here again the
propositions were specific to each countries so the comparison is difficult
despite lot of overlapping in the categories.
Field of education for Australia
Count
Percentage
Physical sciences
9
28.12
Information and computing sciences
7
21.88
Earth sciences
5
15.62
Engineering
4
12.5
Biological sciences
2
6.25
Health sciences
1
3.12
Psychology
1
3.12
Biomedical and clinical sciences
1
3.12
Environmental sciences
1
3.12
Language, communication and culture
1
3.12
Download CSV
2022-08-22T11:26:40.084933
image/svg+xml
Matplotlib v3.5.2, https://matplotlib.org/
PNG SVG
2022-08-22T11:26:41.085477
image/svg+xml
Matplotlib v3.5.2, https://matplotlib.org/
PNG SVG
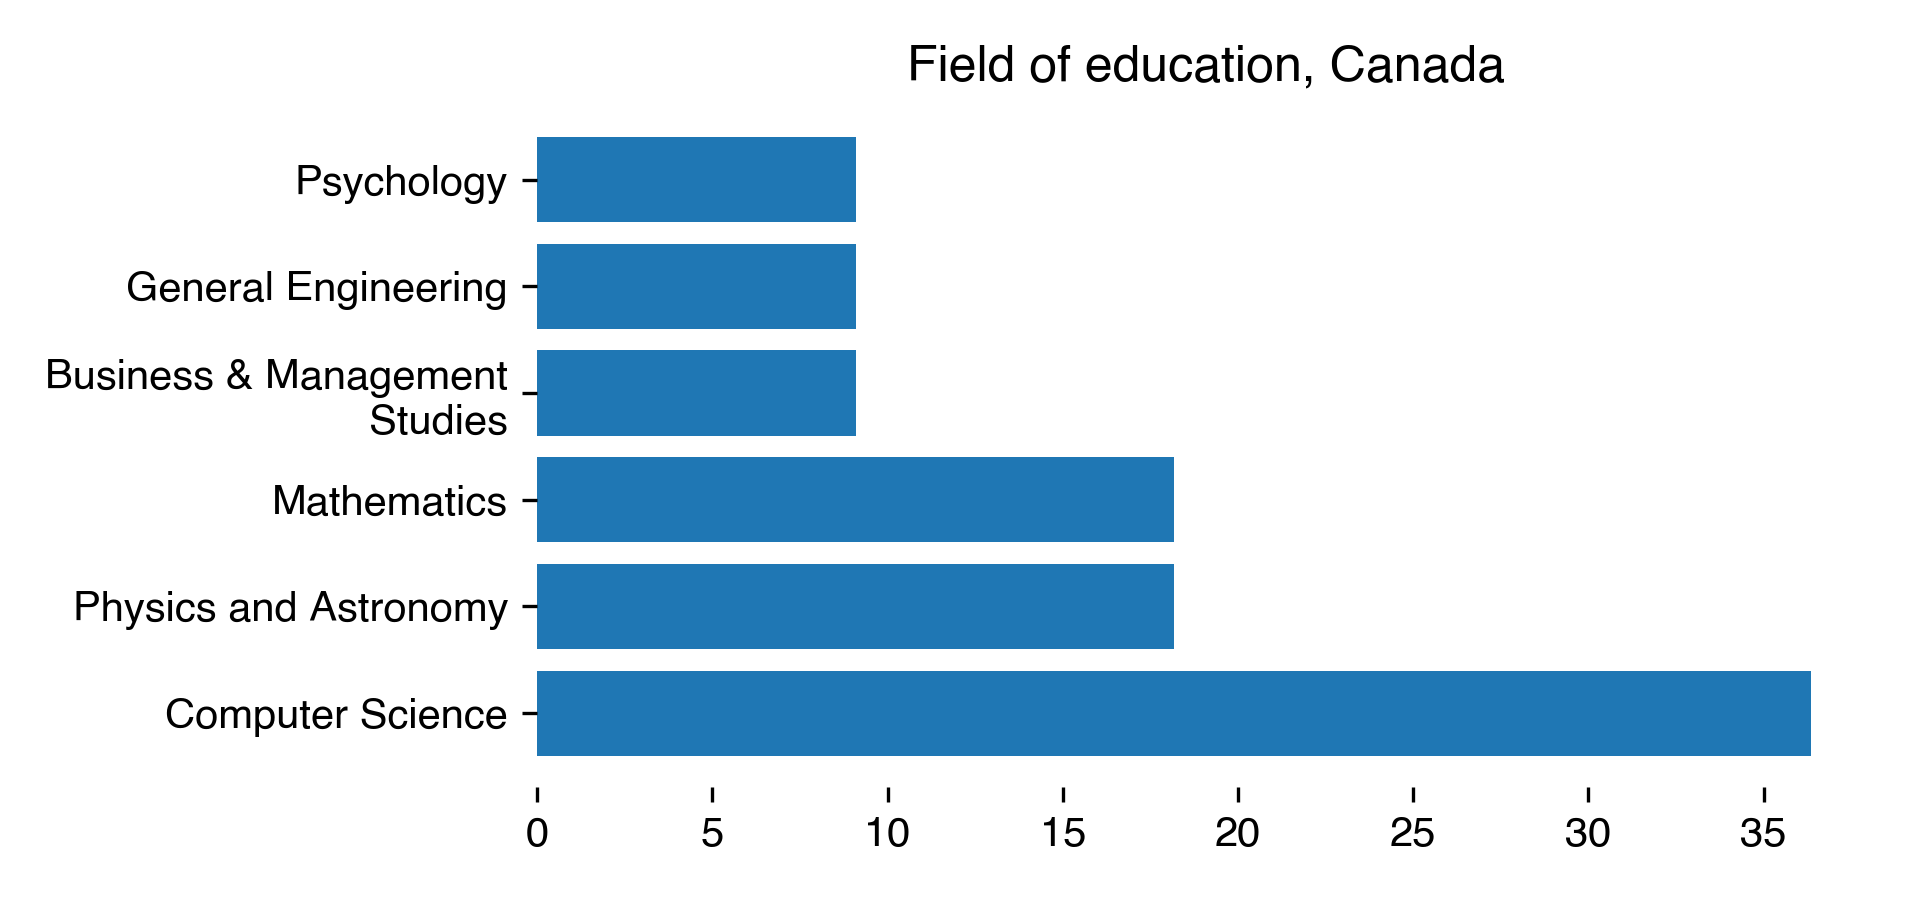
Field of education for Canada
Count
Percentage
Computer Science
4
36.36
Mathematics
2
18.18
Physics and Astronomy
2
18.18
Psychology
1
9.09
General Engineering
1
9.09
Business & Management Studies
1
9.09
Download CSV
2022-08-22T11:26:41.768242
image/svg+xml
Matplotlib v3.5.2, https://matplotlib.org/
PNG SVG
2022-08-22T11:26:42.560763
image/svg+xml
Matplotlib v3.5.2, https://matplotlib.org/
PNG SVG
Field of education for Germany
Count
Percentage
Percentage in 2018
Difference with previous year
Physics and Astronomy
58
22.48
22.52
-0.04
Computer Science
57
22.09
25.53
-3.43
Mathematics
23
8.91
7.21
1.71
Biological Sciences
17
6.59
7.21
-0.62
Mechanical Engineering
15
5.81
3.3
2.51
Geography & Environmental Sciences
13
5.04
7.51
-2.47
Civil Engineering
10
3.88
1.2
2.67
Electrical & Electronic Engineering
9
3.49
5.41
-1.92
Geology
7
2.71
2.7
0.01
Linguistics
5
1.94
0.6
1.34
General Engineering
5
1.94
1.5
0.44
Chemistry
5
1.94
0.9
1.04
History
4
1.55
1.5
0.05
Agriculture & Forestry
4
1.55
0.3
1.25
Economics
3
1.16
0.9
0.26
3
1.16
1.2
-0.04
Chemical Engineering
2
0.78
1.5
-0.73
Medicine
2
0.78
0.3
0.47
Philosophy
2
0.78
0.9
-0.13
Librarianship & Information Management
2
0.78
0.9
-0.13
German
2
0.78
0.9
-0.13
Anthropology
1
0.39
nan
nan
Aeronautical & Manufacturing Engineering
1
0.39
0.3
0.09
Business & Management Studies
1
0.39
0.3
0.09
Communication & Media Studies
1
0.39
0.3
0.09
Psychology
1
0.39
0.6
-0.21
Classics & Ancient History
1
0.39
0.6
-0.21
Materials Technology
1
0.39
1.8
-1.41
Sociology
1
0.39
nan
nan
Middle Eastern and African Studies
1
0.39
nan
nan
Veterinary Medicine
1
0.39
nan
nan
Download CSV
2022-08-22T11:26:43.976126
image/svg+xml
Matplotlib v3.5.2, https://matplotlib.org/
PNG SVG
2022-08-22T11:26:45.889175
image/svg+xml
Matplotlib v3.5.2, https://matplotlib.org/
PNG SVG
Field of education for Netherlands
Count
Percentage
Percentage in 2018
Difference with previous year
Computer Science
16
24.24
20.37
3.87
Physics and Astronomy
14
21.21
33.33
-12.12
Biological Sciences
10
15.15
14.81
0.34
Chemistry
4
6.06
5.56
0.51
Geography & Environmental Sciences
4
6.06
3.7
2.36
Psychology
3
4.55
1.85
2.69
Mathematics
2
3.03
1.85
1.18
Electrical & Electronic Engineering
2
3.03
3.7
-0.67
Linguistics
2
3.03
nan
nan
Medicine
2
3.03
nan
nan
Communication & Media Studies
2
3.03
1.85
1.18
Aeronautical & Manufacturing Engineering
1
1.52
1.85
-0.34
1
1.52
nan
nan
Fashion
1
1.52
nan
nan
Sociology
1
1.52
nan
nan
Civil Engineering
1
1.52
3.7
-2.19
Download CSV
2022-08-22T11:26:46.900336
image/svg+xml
Matplotlib v3.5.2, https://matplotlib.org/
PNG SVG
2022-08-22T11:26:48.000368
image/svg+xml
Matplotlib v3.5.2, https://matplotlib.org/
PNG SVG
Field of education for New Zealand
Count
Percentage
Percentage in 2018
Difference with previous year
Mathematics
5
17.86
10.81
7.05
Physics and Astronomy
5
17.86
10.81
7.05
Biological Sciences
5
17.86
18.92
-1.06
Electrical & Electronic Engineering
3
10.71
5.41
5.31
Computer Science
3
10.71
29.73
-19.02
Geography & Environmental Sciences
2
7.14
2.7
4.44
Linguistics
1
3.57
nan
nan
General Engineering
1
3.57
2.7
0.87
Agriculture & Forestry
1
3.57
nan
nan
Classics & Ancient History
1
3.57
nan
nan
Mechanical Engineering
1
3.57
5.41
-1.83
Download CSV
2022-08-22T11:26:48.841795
image/svg+xml
Matplotlib v3.5.2, https://matplotlib.org/
PNG SVG
2022-08-22T11:26:49.890394
image/svg+xml
Matplotlib v3.5.2, https://matplotlib.org/
PNG SVG
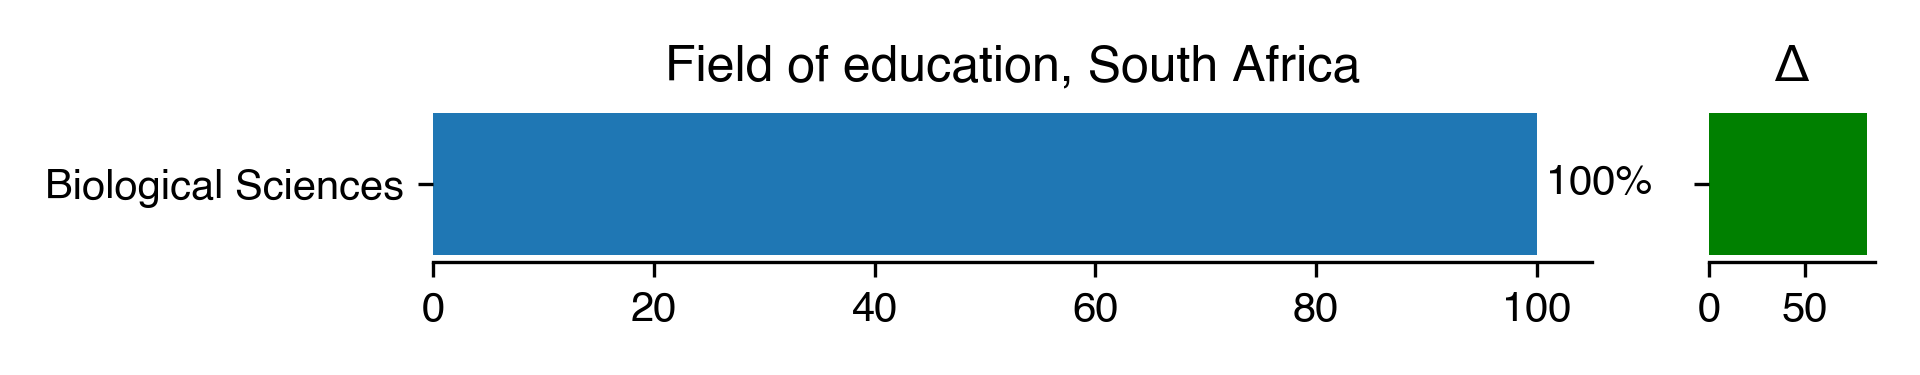
Field of education for South Africa
Count
Percentage
Percentage in 2018
Difference with previous year
Biological Sciences
2
100
17.39
82.61
Download CSV
2022-08-22T11:26:50.404526
image/svg+xml
Matplotlib v3.5.2, https://matplotlib.org/
PNG SVG
2022-08-22T11:26:51.232552
image/svg+xml
Matplotlib v3.5.2, https://matplotlib.org/
PNG SVG
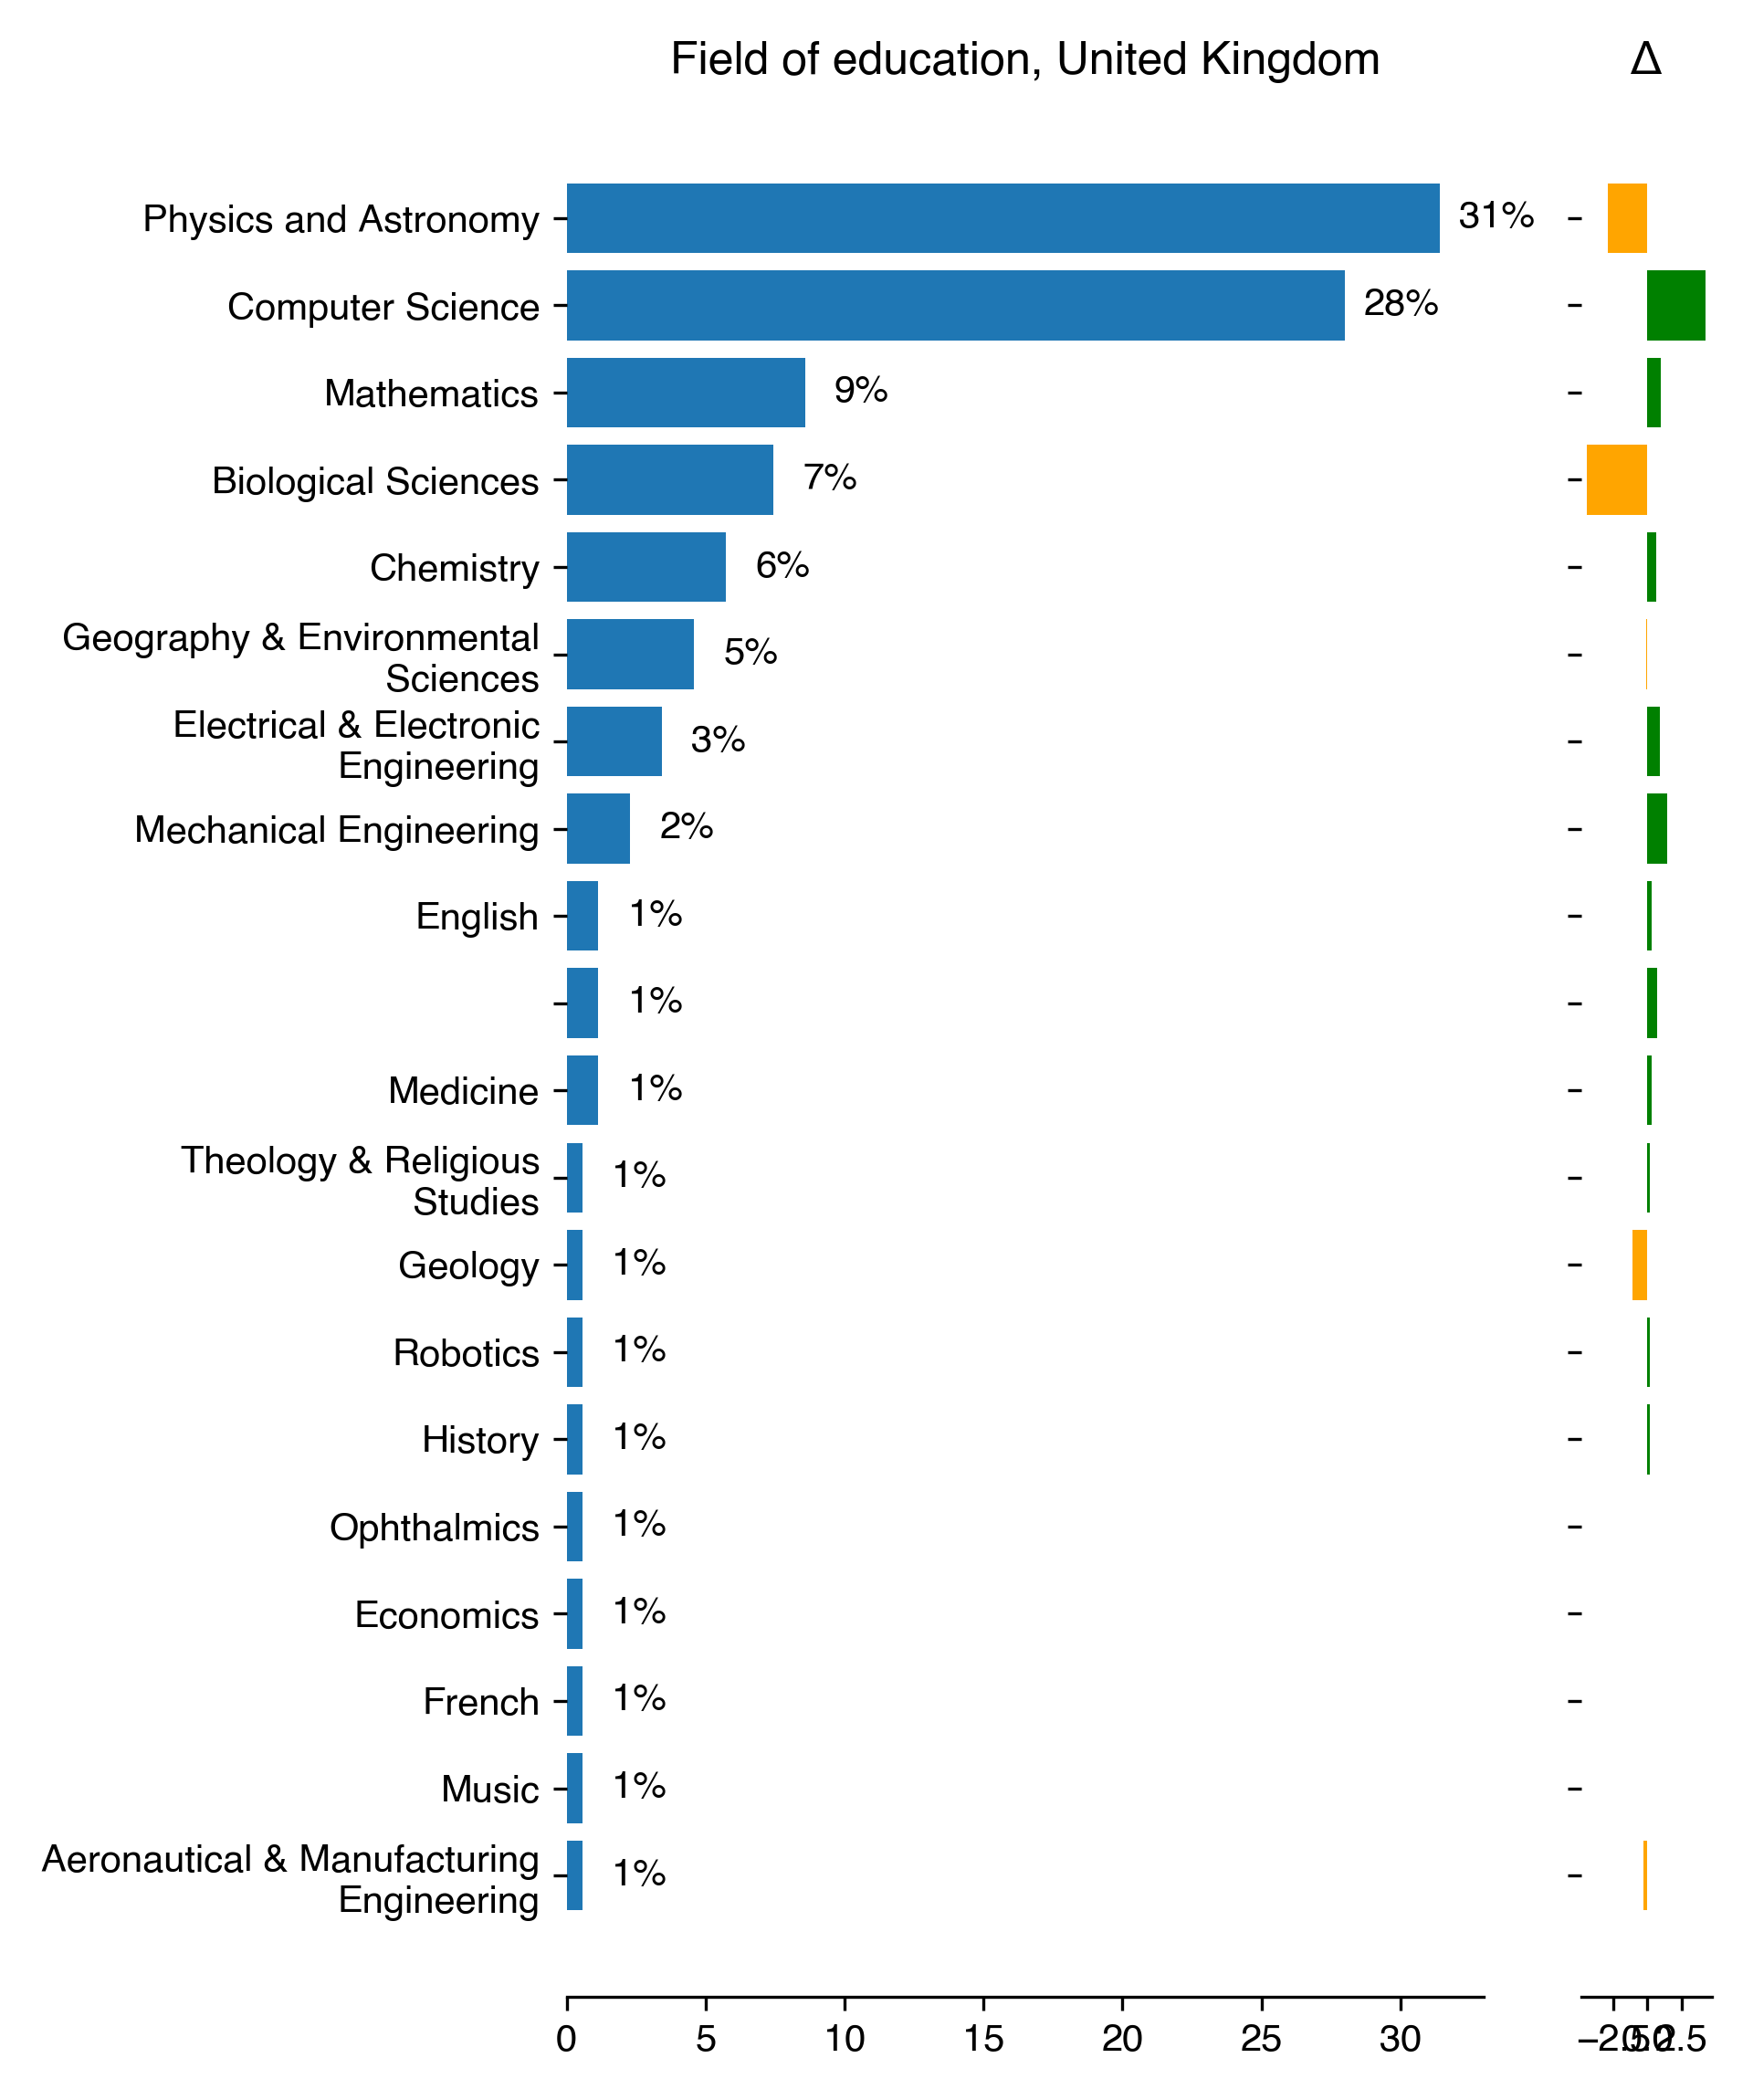
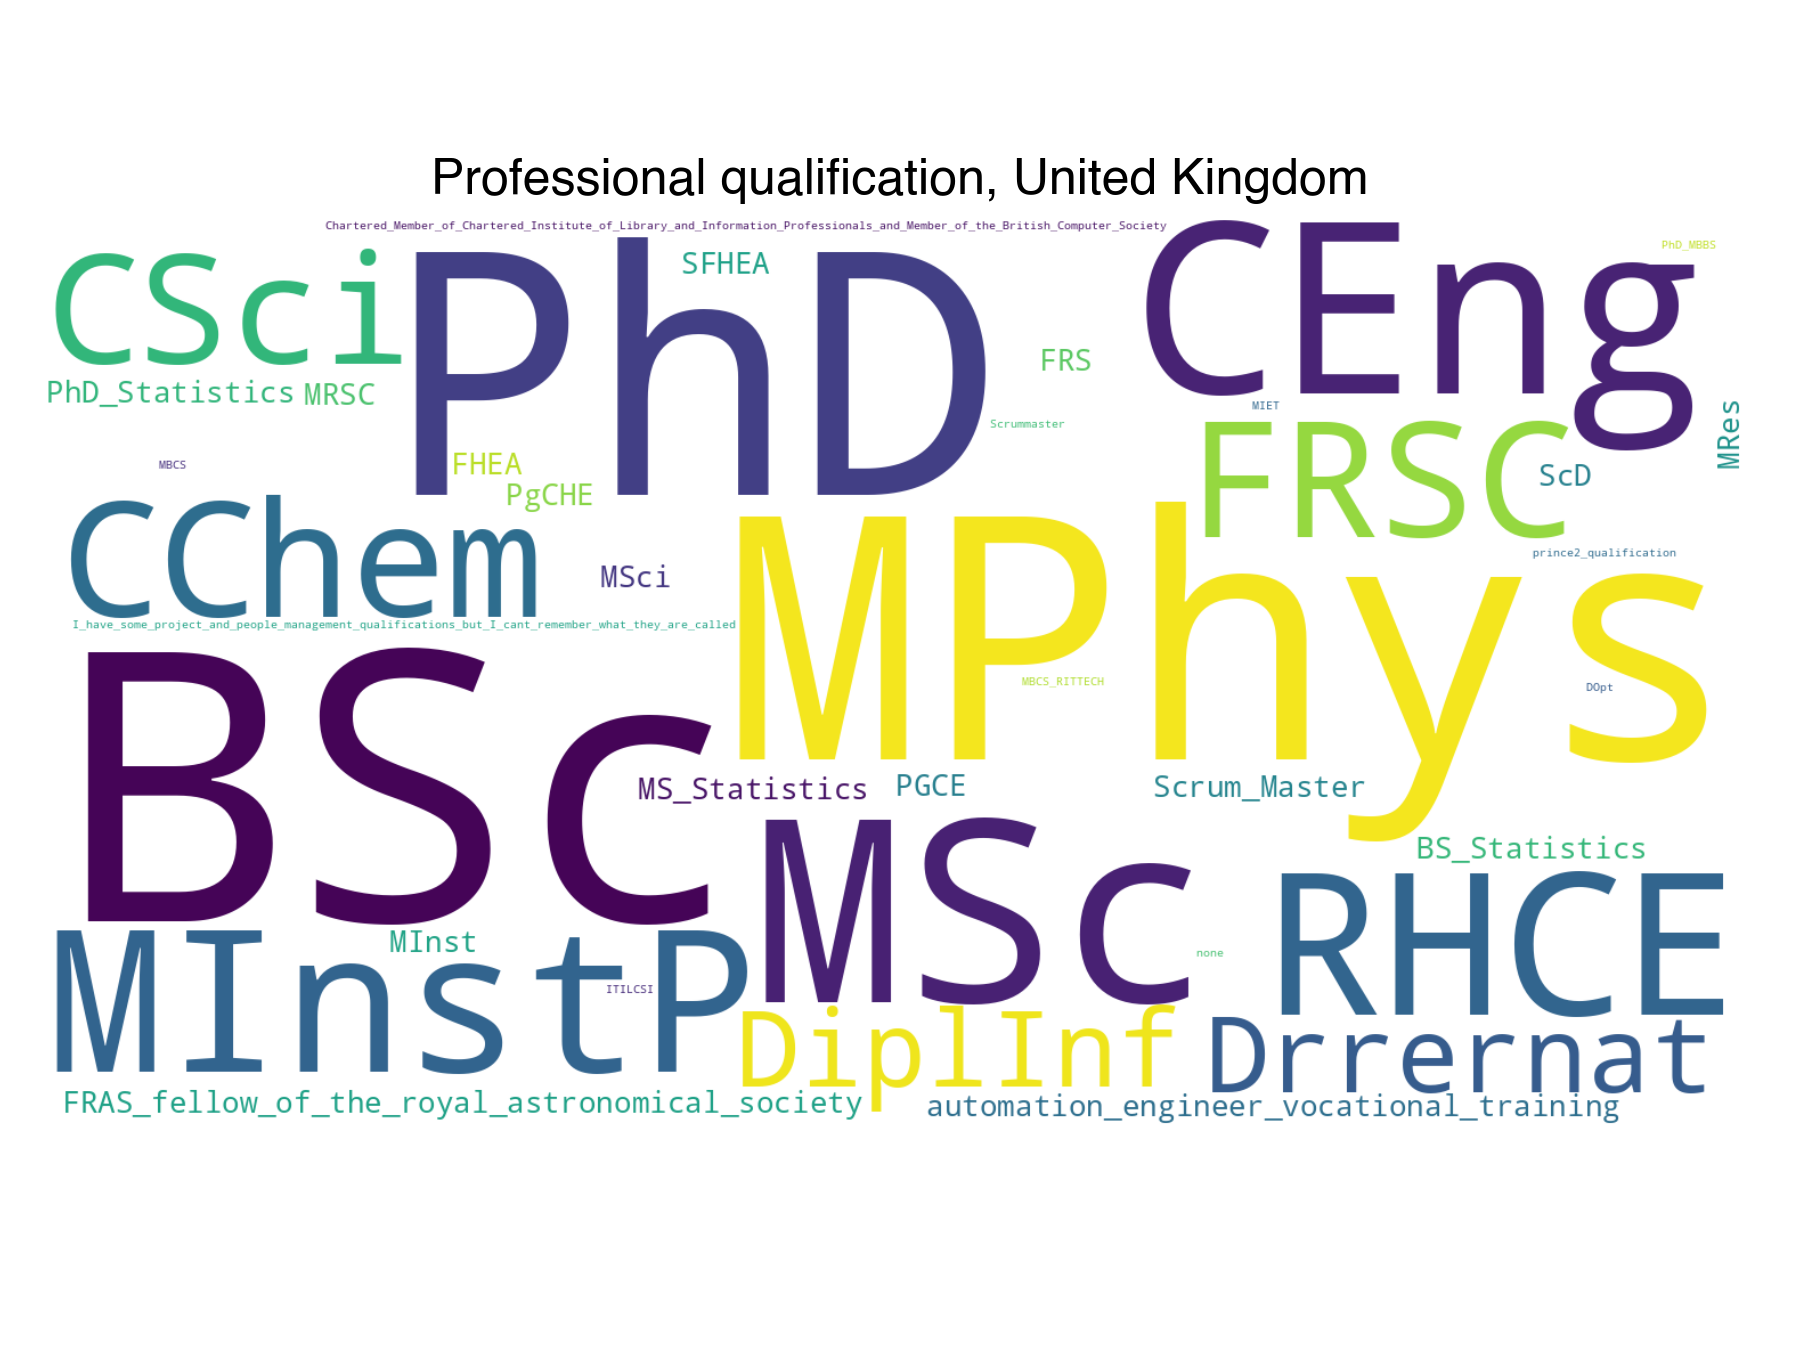
Field of education for United Kingdom
Count
Percentage
Percentage in 2018
Difference with previous year
Physics and Astronomy
55
31.43
34.32
-2.89
Computer Science
49
28
23.73
4.27
Mathematics
15
8.57
7.63
0.94
Biological Sciences
13
7.43
11.86
-4.44
Chemistry
10
5.71
5.08
0.63
Geography & Environmental Sciences
8
4.57
4.66
-0.09
Electrical & Electronic Engineering
6
3.43
2.54
0.89
Mechanical Engineering
4
2.29
0.85
1.44
English
2
1.14
0.85
0.3
2
1.14
0.42
0.72
Medicine
2
1.14
0.85
0.3
Theology & Religious Studies
1
0.57
0.42
0.15
Geology
1
0.57
1.69
-1.12
Robotics
1
0.57
0.42
0.15
History
1
0.57
0.42
0.15
Ophthalmics
1
0.57
nan
nan
Economics
1
0.57
nan
nan
French
1
0.57
nan
nan
Music
1
0.57
nan
nan
Aeronautical & Manufacturing Engineering
1
0.57
0.85
-0.28
Download CSV
2022-08-22T11:26:52.280838
image/svg+xml
Matplotlib v3.5.2, https://matplotlib.org/
PNG SVG
2022-08-22T11:26:53.918496
image/svg+xml
Matplotlib v3.5.2, https://matplotlib.org/
PNG SVG
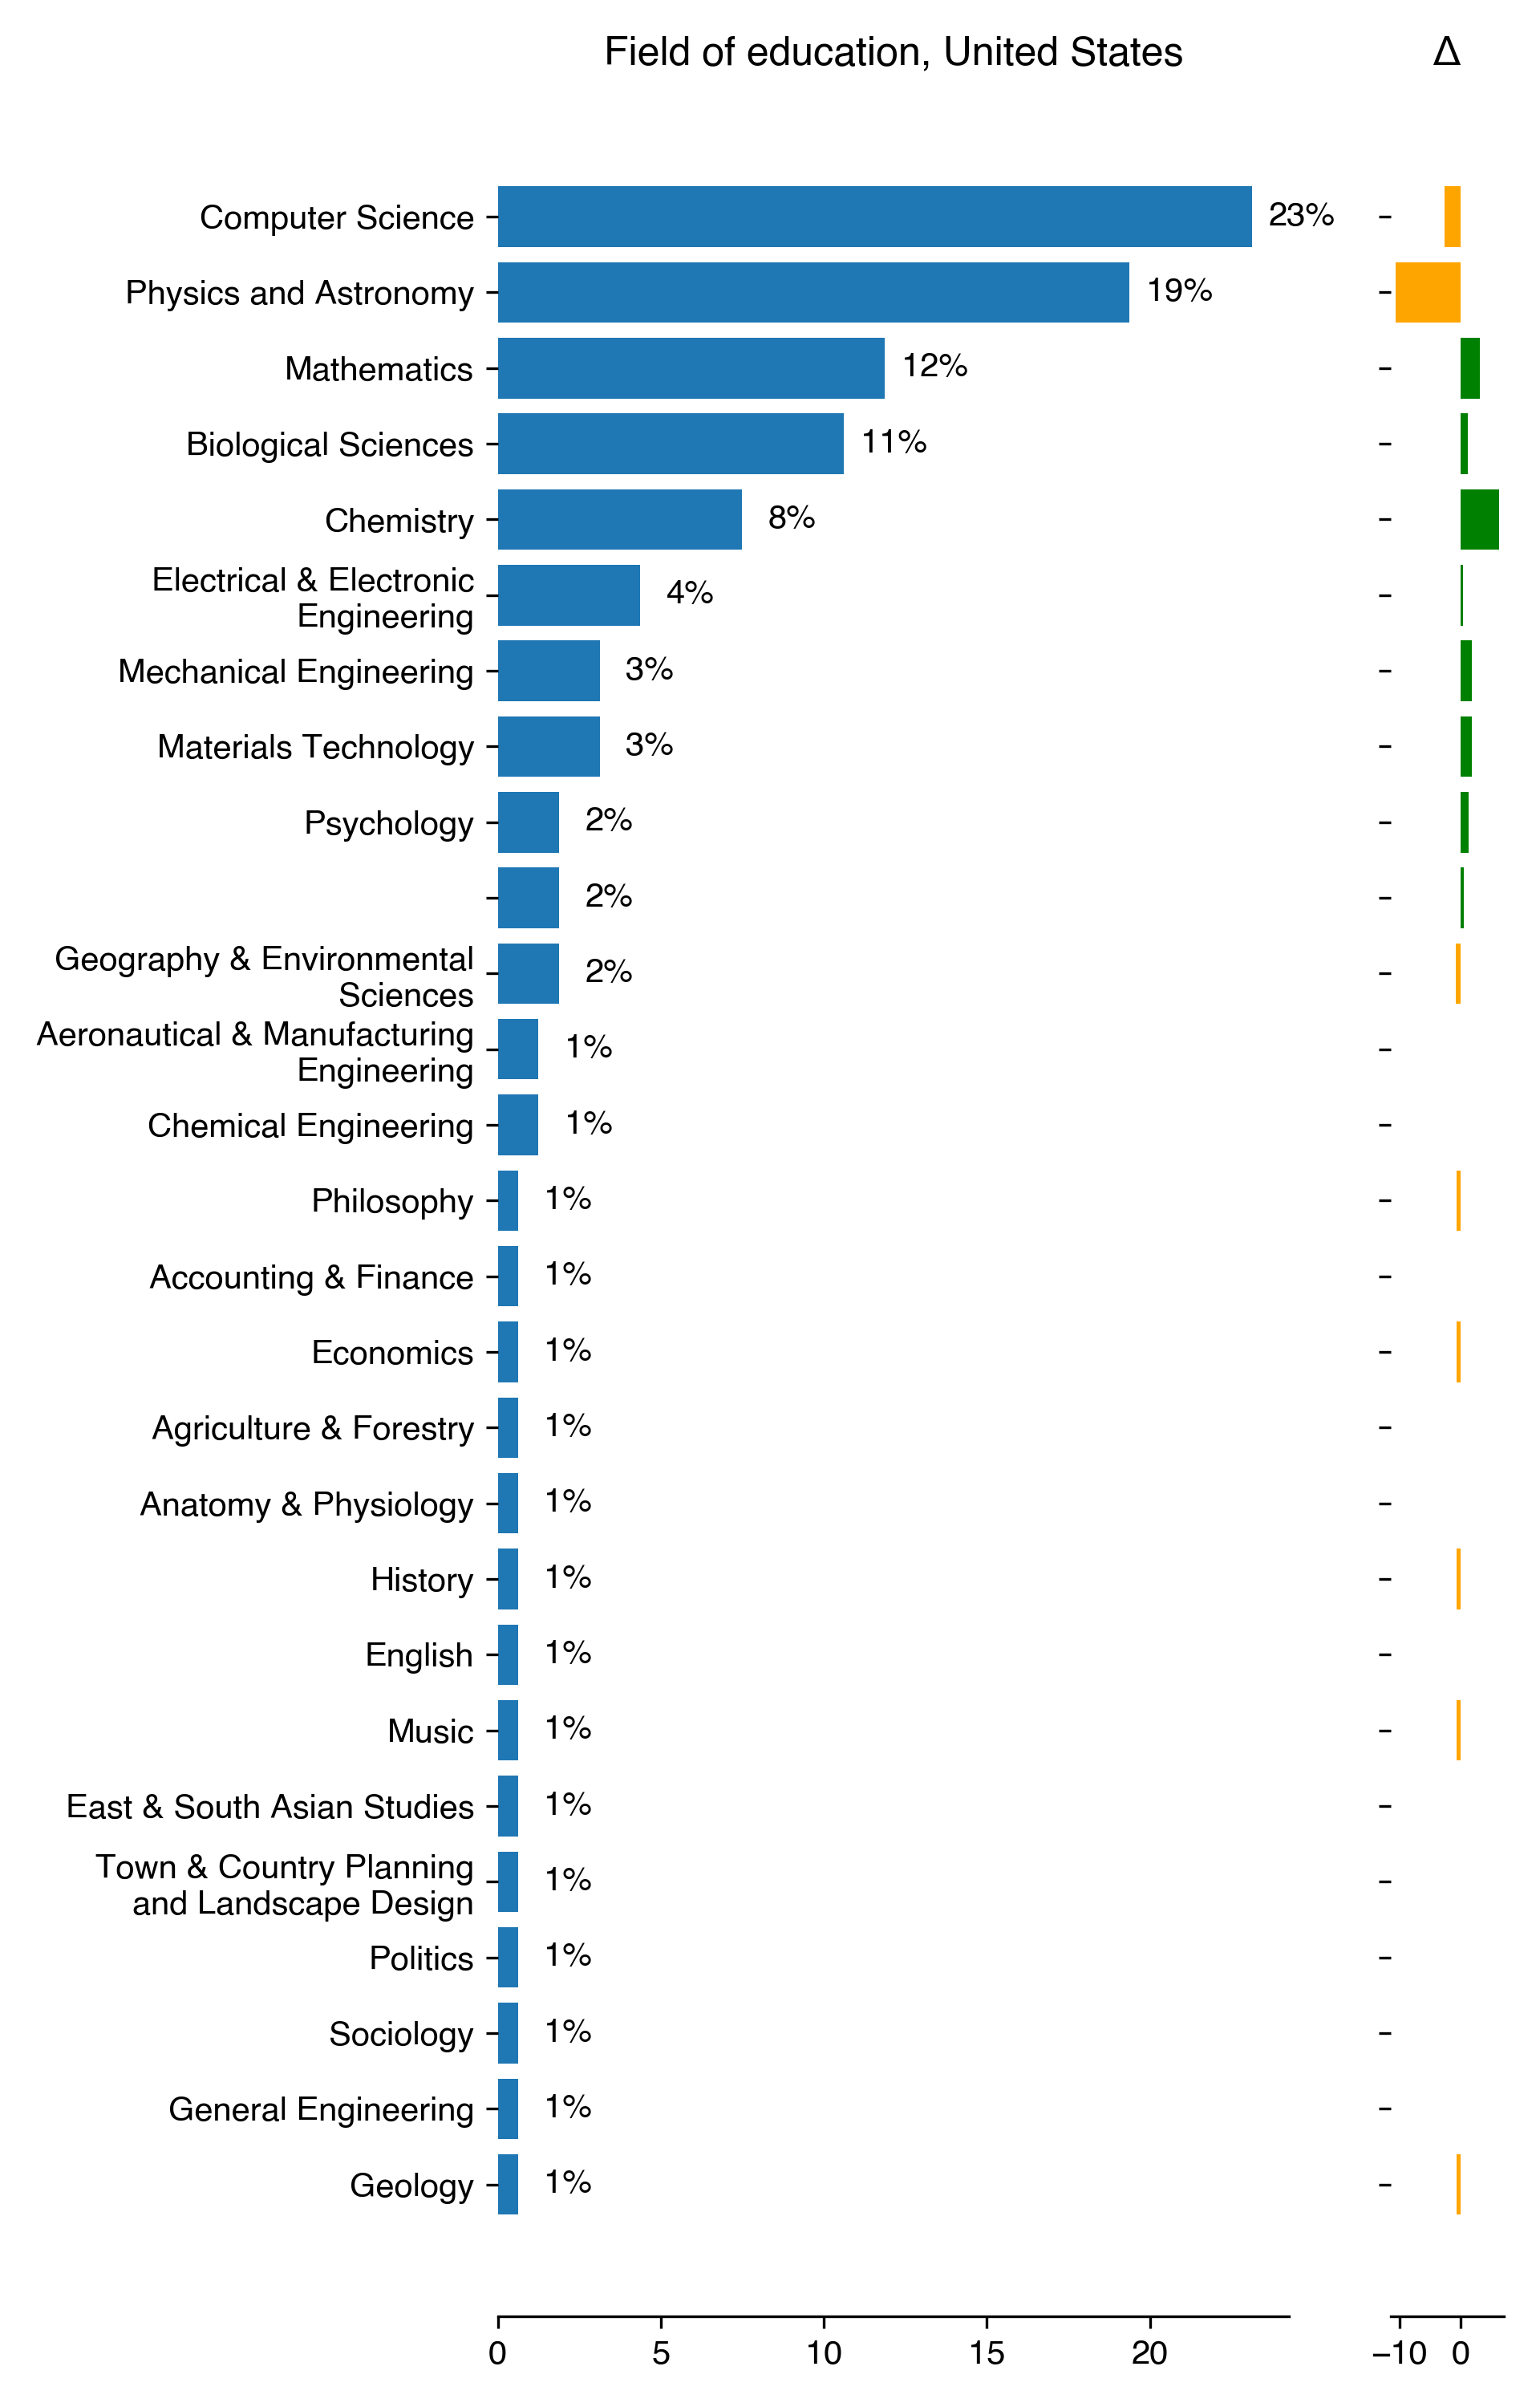
Field of education for United States
Count
Percentage
Percentage in 2018
Difference with previous year
Computer Science
37
23.12
25.85
-2.73
Physics and Astronomy
31
19.38
29.93
-10.56
Mathematics
19
11.88
8.84
3.03
Biological Sciences
17
10.62
9.52
1.1
Chemistry
12
7.5
1.36
6.14
Electrical & Electronic Engineering
7
4.38
4.08
0.29
Mechanical Engineering
5
3.12
1.36
1.76
Materials Technology
5
3.12
1.36
1.76
Psychology
3
1.88
0.68
1.19
3
1.88
1.36
0.51
Geography & Environmental Sciences
3
1.88
2.72
-0.85
Aeronautical & Manufacturing Engineering
2
1.25
nan
nan
Chemical Engineering
2
1.25
1.36
-0.11
Philosophy
1
0.62
1.36
-0.74
Accounting & Finance
1
0.62
0.68
-0.06
Economics
1
0.62
1.36
-0.74
Agriculture & Forestry
1
0.62
nan
nan
Anatomy & Physiology
1
0.62
nan
nan
History
1
0.62
1.36
-0.74
English
1
0.62
nan
nan
Music
1
0.62
1.36
-0.74
East & South Asian Studies
1
0.62
0.68
-0.06
Town & Country Planning and Landscape Design
1
0.62
nan
nan
Politics
1
0.62
0.68
-0.06
Sociology
1
0.62
nan
nan
General Engineering
1
0.62
nan
nan
Geology
1
0.62
1.36
-0.74
Download CSV
2022-08-22T11:26:55.318472
image/svg+xml
Matplotlib v3.5.2, https://matplotlib.org/
PNG SVG
2022-08-22T11:26:56.715824
image/svg+xml
Matplotlib v3.5.2, https://matplotlib.org/
PNG SVG
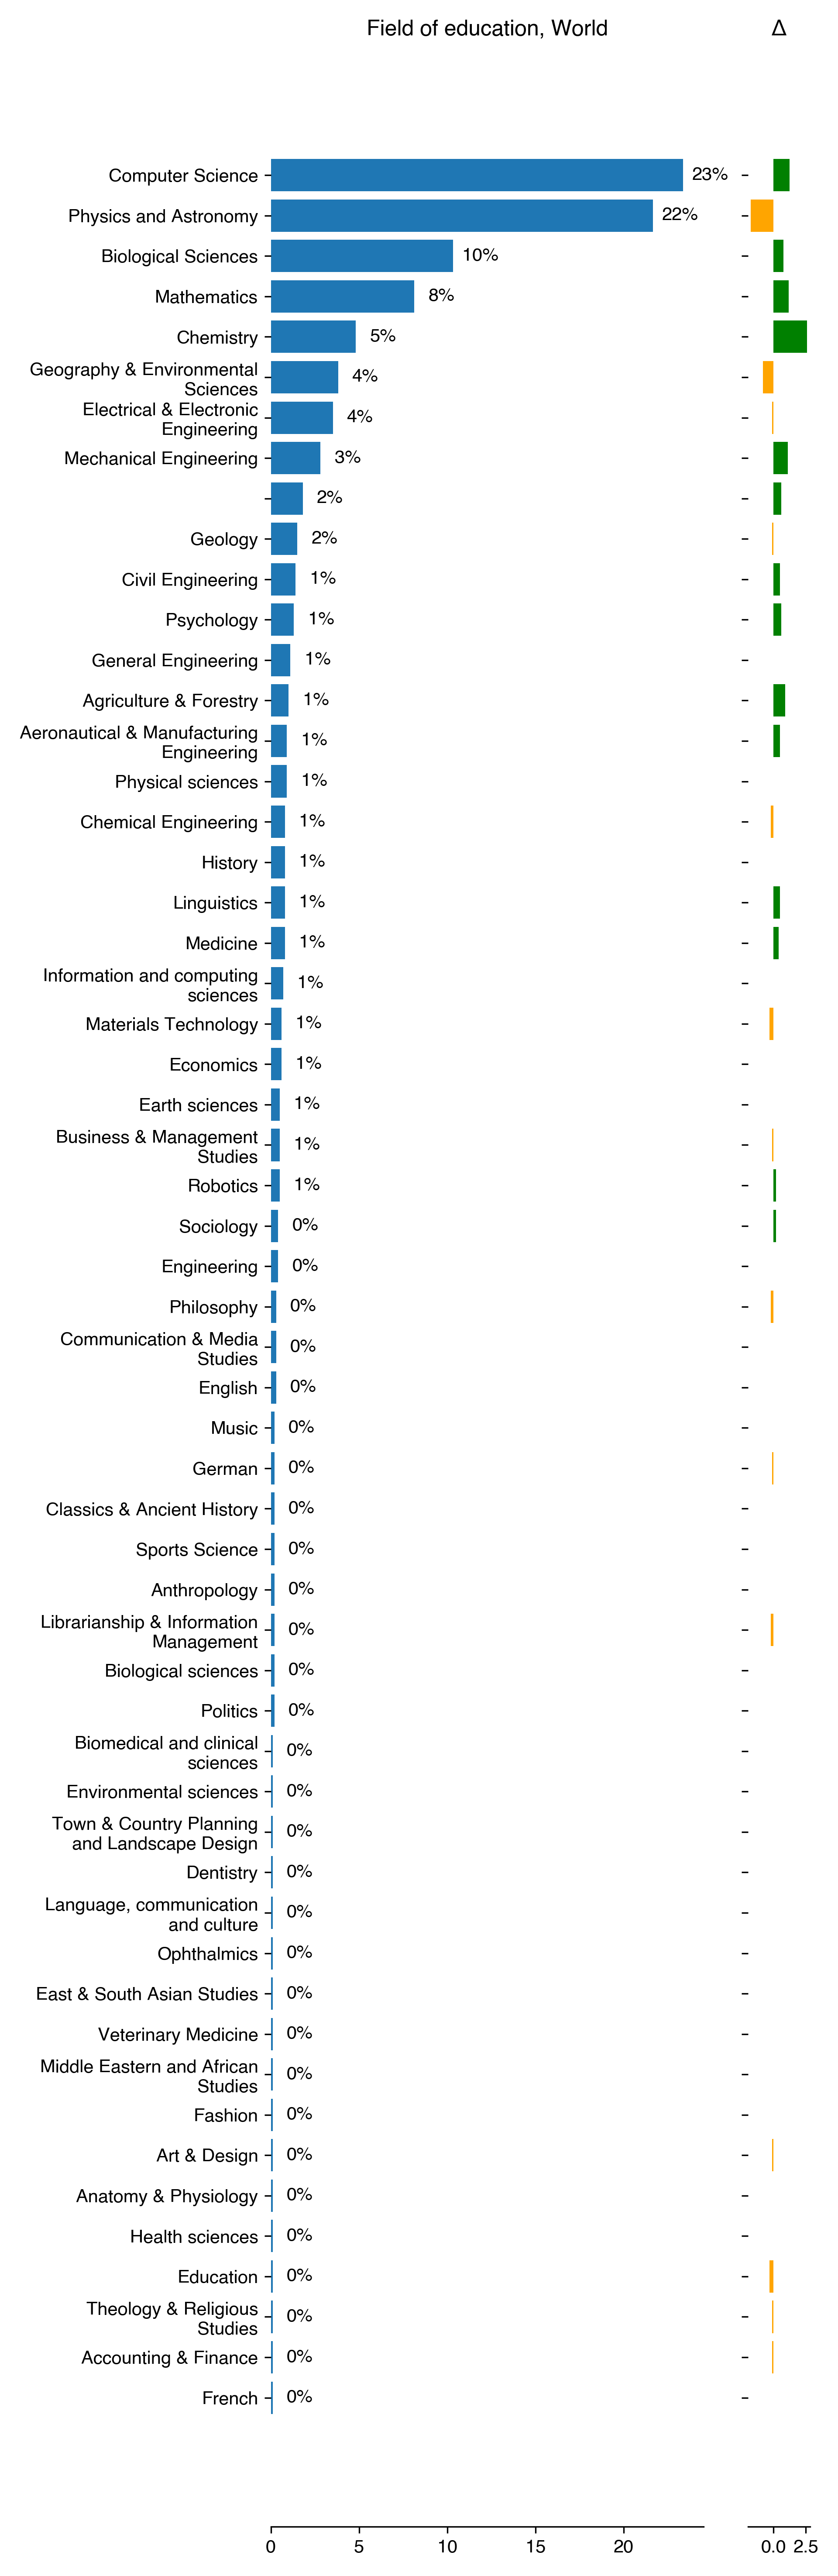
Field of education for World
Count
Percentage
Percentage in 2018
Difference with previous year
Computer Science
233
23.37
22.11
1.26
Physics and Astronomy
216
21.66
23.42
-1.75
Biological Sciences
103
10.33
9.55
0.78
Mathematics
81
8.12
6.93
1.19
Chemistry
48
4.81
2.21
2.6
Geography & Environmental Sciences
38
3.81
4.62
-0.81
Electrical & Electronic Engineering
35
3.51
3.62
-0.11
Mechanical Engineering
28
2.81
1.71
1.1
18
1.81
1.21
0.6
Geology
15
1.5
1.61
-0.1
Civil Engineering
14
1.4
0.9
0.5
Psychology
13
1.3
0.7
0.6
General Engineering
11
1.1
1.11
-0
Agriculture & Forestry
10
1
0.1
0.9
Aeronautical & Manufacturing Engineering
9
0.9
0.4
0.5
Physical sciences
9
0.9
nan
nan
Chemical Engineering
8
0.8
1.01
-0.2
History
8
0.8
0.8
-0
Linguistics
8
0.8
0.3
0.5
Medicine
8
0.8
0.4
0.4
Information and computing sciences
7
0.7
nan
nan
Materials Technology
6
0.6
0.9
-0.3
Economics
6
0.6
0.6
-0
Earth sciences
5
0.5
nan
nan
Business & Management Studies
5
0.5
0.6
-0.1
Robotics
5
0.5
0.3
0.2
Sociology
4
0.4
0.2
0.2
Engineering
4
0.4
nan
nan
Philosophy
3
0.3
0.5
-0.2
Communication & Media Studies
3
0.3
0.3
-0
English
3
0.3
0.3
-0
Music
2
0.2
0.2
-0
German
2
0.2
0.3
-0.1
Classics & Ancient History
2
0.2
0.2
-0
Sports Science
2
0.2
nan
nan
Anthropology
2
0.2
nan
nan
Librarianship & Information Management
2
0.2
0.4
-0.2
Biological sciences
2
0.2
nan
nan
Politics
2
0.2
0.2
-0
Biomedical and clinical sciences
1
0.1
nan
nan
Environmental sciences
1
0.1
nan
nan
Town & Country Planning and Landscape Design
1
0.1
nan
nan
Dentistry
1
0.1
nan
nan
Language, communication and culture
1
0.1
nan
nan
Ophthalmics
1
0.1
nan
nan
East & South Asian Studies
1
0.1
0.1
-0
Veterinary Medicine
1
0.1
nan
nan
Middle Eastern and African Studies
1
0.1
nan
nan
Fashion
1
0.1
nan
nan
Art & Design
1
0.1
0.2
-0.1
Anatomy & Physiology
1
0.1
nan
nan
Health sciences
1
0.1
nan
nan
Education
1
0.1
0.4
-0.3
Theology & Religious Studies
1
0.1
0.2
-0.1
Accounting & Finance
1
0.1
0.2
-0.1
French
1
0.1
nan
nan
Download CSV
2022-08-22T11:26:59.111952
image/svg+xml
Matplotlib v3.5.2, https://matplotlib.org/
PNG SVG
2022-08-22T11:27:01.443415
image/svg+xml
Matplotlib v3.5.2, https://matplotlib.org/
PNG SVG
field of work for Australia
Count
Percentage
Percentage in 2018
Difference with previous year
Information and computing sciences
12
37.5
0
37.5
Biomedical and clinical sciences
7
21.88
0
21.88
Biological sciences
6
18.75
0
18.75
Earth sciences
6
18.75
0
18.75
Physical sciences
6
18.75
0
18.75
Health sciences
6
18.75
0
18.75
Language, communication and culture
5
15.62
0
15.62
Built environment and design
5
15.62
0
15.62
Engineering
5
15.62
0
15.62
Human society
4
12.5
0
12.5
Chemical sciences
4
12.5
0
12.5
Environmental sciences
4
12.5
0
12.5
History, heritage and archaeology
4
12.5
0
12.5
Commerce, management, tourism and services
4
12.5
0
12.5
Education.1
3
9.38
0
9.38
Economics.1
3
9.38
0
9.38
Indigenous studies
2
6.25
0
6.25
Mathematical sciences
2
6.25
0
6.25
Psychology.1
2
6.25
0
6.25
Law and legal studies
1
3.12
0
3.12
Philosophy and religious studies
1
3.12
0
3.12
Creative arts and writing
1
3.12
0
3.12
12 Built Environment and Design
0
0
2.02
-2.02
03 Chemical Sciences
0
0
10.1
-10.1
04 Earth Sciences
0
0
22.22
-22.22
05 Environmental Sciences
0
0
21.21
-21.21
06 Biological Sciences
0
0
34.34
-34.34
07 Agricultural and Veterinary Sciences
0
0
10.1
-10.1
08 Information and Computing Sciences
0
0
45.45
-45.45
09 Engineering
0
0
23.23
-23.23
10 Technology
0
0
26.26
-26.26
11 Medical and Health Sciences
0
0
24.24
-24.24
13 Education
0
0
9.09
-9.09
14 Economics
0
0
2.02
-2.02
15 Commerce, Management, Tourism and Services
0
0
2.02
-2.02
16 Studies in Human Society
0
0
4.04
-4.04
17 Psychology and Cognitive Sciences
0
0
3.03
-3.03
18 Law and Legal Studies
0
0
1.01
-1.01
19 Studies in Creative Arts and Writing
0
0
3.03
-3.03
20 Language, Communication and Culture
0
0
5.05
-5.05
21 History and Archaeology
0
0
3.03
-3.03
22 Philosophy and Religious Studies
0
0
3.03
-3.03
02 Physical Sciences
0
0
36.36
-36.36
01 Mathematical Sciences
0
0
24.24
-24.24
Download CSV
2022-08-22T11:27:03.660588
image/svg+xml
Matplotlib v3.5.2, https://matplotlib.org/
PNG SVG
field of work for Canada
Count
Percentage
Percentage in 2018
Difference with previous year
Computer Science
7
63.64
0
63.64
Mathematics
4
36.36
0
36.36
Psychology
3
27.27
0
27.27
Biological Sciences
3
27.27
0
27.27
Physics and Astronomy
3
27.27
0
27.27
Medicine
2
18.18
0
18.18
Mechanical Engineering
1
9.09
0
9.09
Geography & Environmental Sciences
1
9.09
0
9.09
Accounting & Finance
1
9.09
0
9.09
Art & Design
1
9.09
0
9.09
General Engineering
1
9.09
0
9.09
Chemistry
1
9.09
0
9.09
Social Work
1
9.09
0
9.09
History of Art, Architecture & Design
1
9.09
0
9.09
CONDENSED MATTERPHYSICS
0
0
9.09
-9.09
EARTH SCIENCE
0
0
9.09
-9.09
ASTRONOMY AND ASTROPHYSICS
0
0
27.27
-27.27
PHYSICAL GEOGRAPHY
0
0
9.09
-9.09
STATISTICS AND PROBABILITY
0
0
36.36
-36.36
THEORETICAL PHYSICS AND CHEMISTRY
0
0
9.09
-9.09
FLUID MECHANICS
0
0
9.09
-9.09
ENVIRONMENTAL ENGINEERING
0
0
9.09
-9.09
INDUSTRIAL ENGINEERING
0
0
9.09
-9.09
DESIGN AND MANUFACTURING
0
0
9.09
-9.09
BIOMEDICAL ENGINEERING
0
0
9.09
-9.09
PHYSICS
0
0
9.09
-9.09
INFORMATION TECHNOLOGY
0
0
18.18
-18.18
ARTIFICIAL INTELLIGENCE
0
0
18.18
-18.18
APPLIED MATHEMATICS
0
0
9.09
-9.09
HYDROLOGY
0
0
9.09
-9.09
EVOLUTION AND ECOLOGY
0
0
18.18
-18.18
MICROBIOLOGY
0
0
9.09
-9.09
PSYCHOLOGY
0
0
18.18
-18.18
LIFE SCIENCES RESEARCH RELATED TO HUMAN HEALTH AND DISEASE
0
0
18.18
-18.18
OTHER STUDIES IN NATURAL SCIENCES AND ENGINEERING
0
0
18.18
-18.18
HEALTH SCIENCES
0
0
9.09
-9.09
Download CSV
2022-08-22T11:27:05.665053
image/svg+xml
Matplotlib v3.5.2, https://matplotlib.org/
PNG SVG
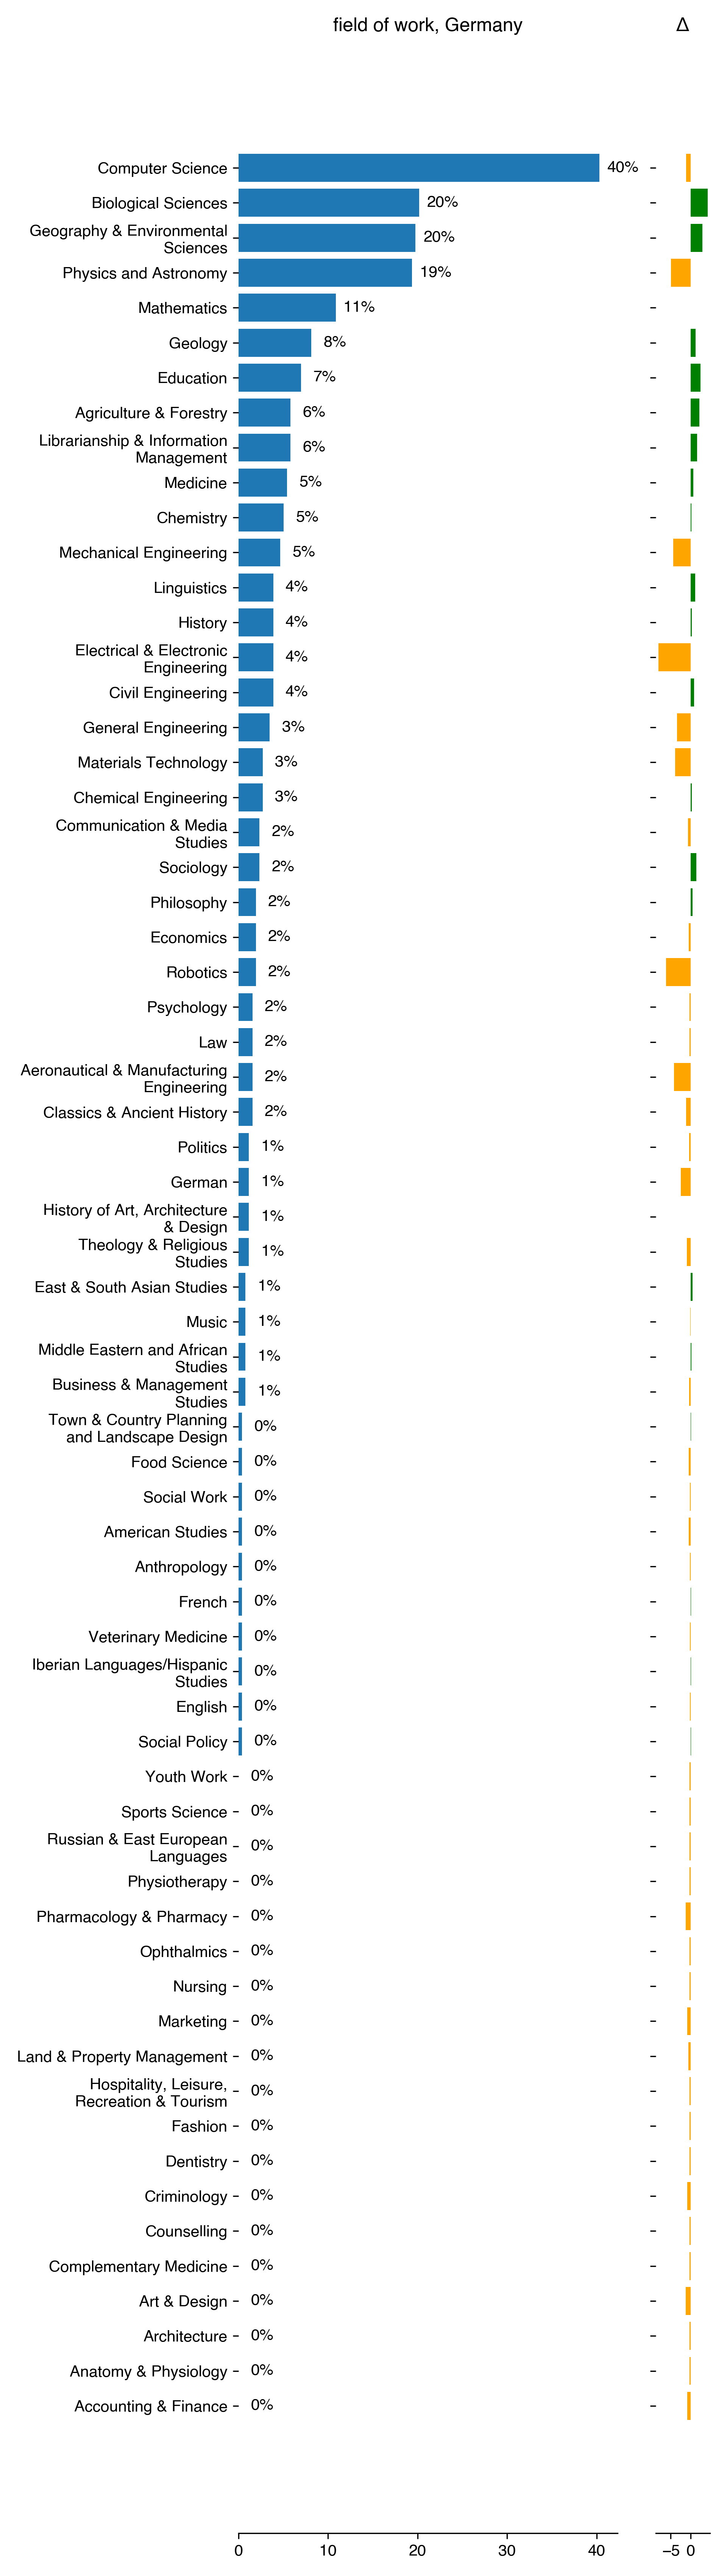
field of work for Germany
Count
Percentage
Percentage in 2018
Difference with previous year
Computer Science
104
40.31
41.44
-1.13
Biological Sciences
52
20.16
15.92
4.24
Geography & Environmental Sciences
51
19.77
16.82
2.95
Physics and Astronomy
50
19.38
24.32
-4.94
Mathematics
28
10.85
10.81
0.04
Geology
21
8.14
6.91
1.23
Education
18
6.98
4.5
2.47
Agriculture & Forestry
15
5.81
3.6
2.21
Librarianship & Information Management
15
5.81
4.2
1.61
Medicine
14
5.43
4.8
0.62
Chemistry
13
5.04
4.8
0.23
Mechanical Engineering
12
4.65
9.01
-4.36
Linguistics
10
3.88
2.7
1.17
History
10
3.88
3.6
0.27
Electrical & Electronic Engineering
10
3.88
12.01
-8.14
Civil Engineering
10
3.88
3
0.87
General Engineering
9
3.49
6.91
-3.42
Materials Technology
7
2.71
6.61
-3.89
Chemical Engineering
7
2.71
2.4
0.31
Communication & Media Studies
6
2.33
3
-0.68
Sociology
6
2.33
0.9
1.42
Philosophy
5
1.94
1.5
0.44
Economics
5
1.94
2.4
-0.46
Robotics
5
1.94
8.11
-6.17
Psychology
4
1.55
1.8
-0.25
Law
4
1.55
1.8
-0.25
Aeronautical & Manufacturing Engineering
4
1.55
5.71
-4.16
Classics & Ancient History
4
1.55
2.7
-1.15
Politics
3
1.16
1.5
-0.34
German
3
1.16
3.6
-2.44
History of Art, Architecture & Design
3
1.16
1.2
-0.04
Theology & Religious Studies
3
1.16
2.1
-0.94
East & South Asian Studies
2
0.78
0.3
0.47
Music
2
0.78
0.9
-0.13
Middle Eastern and African Studies
2
0.78
0.6
0.17
Business & Management Studies
2
0.78
1.2
-0.43
Town & Country Planning and Landscape Design
1
0.39
0.3
0.09
Food Science
1
0.39
0.9
-0.51
Social Work
1
0.39
0.6
-0.21
American Studies
1
0.39
0.9
-0.51
Anthropology
1
0.39
0.6
-0.21
French
1
0.39
0.3
0.09
Veterinary Medicine
1
0.39
0.6
-0.21
Iberian Languages/Hispanic Studies
1
0.39
0.3
0.09
English
1
0.39
0.6
-0.21
Social Policy
1
0.39
0.3
0.09
Youth Work
0
0
0.3
-0.3
Sports Science
0
0
0.3
-0.3
Russian & East European Languages
0
0
0.3
-0.3
Physiotherapy
0
0
0.3
-0.3
Pharmacology & Pharmacy
0
0
1.2
-1.2
Ophthalmics
0
0
0.3
-0.3
Nursing
0
0
0.3
-0.3
Marketing
0
0
0.9
-0.9
Land & Property Management
0
0
0.6
-0.6
Hospitality, Leisure, Recreation & Tourism
0
0
0.3
-0.3
Fashion
0
0
0.3
-0.3
Dentistry
0
0
0.3
-0.3
Criminology
0
0
0.9
-0.9
Counselling
0
0
0.3
-0.3
Complementary Medicine
0
0
0.3
-0.3
Art & Design
0
0
1.2
-1.2
Architecture
0
0
0.3
-0.3
Anatomy & Physiology
0
0
0.3
-0.3
Accounting & Finance
0
0
0.9
-0.9
Download CSV
2022-08-22T11:27:08.572376
image/svg+xml
Matplotlib v3.5.2, https://matplotlib.org/
PNG SVG
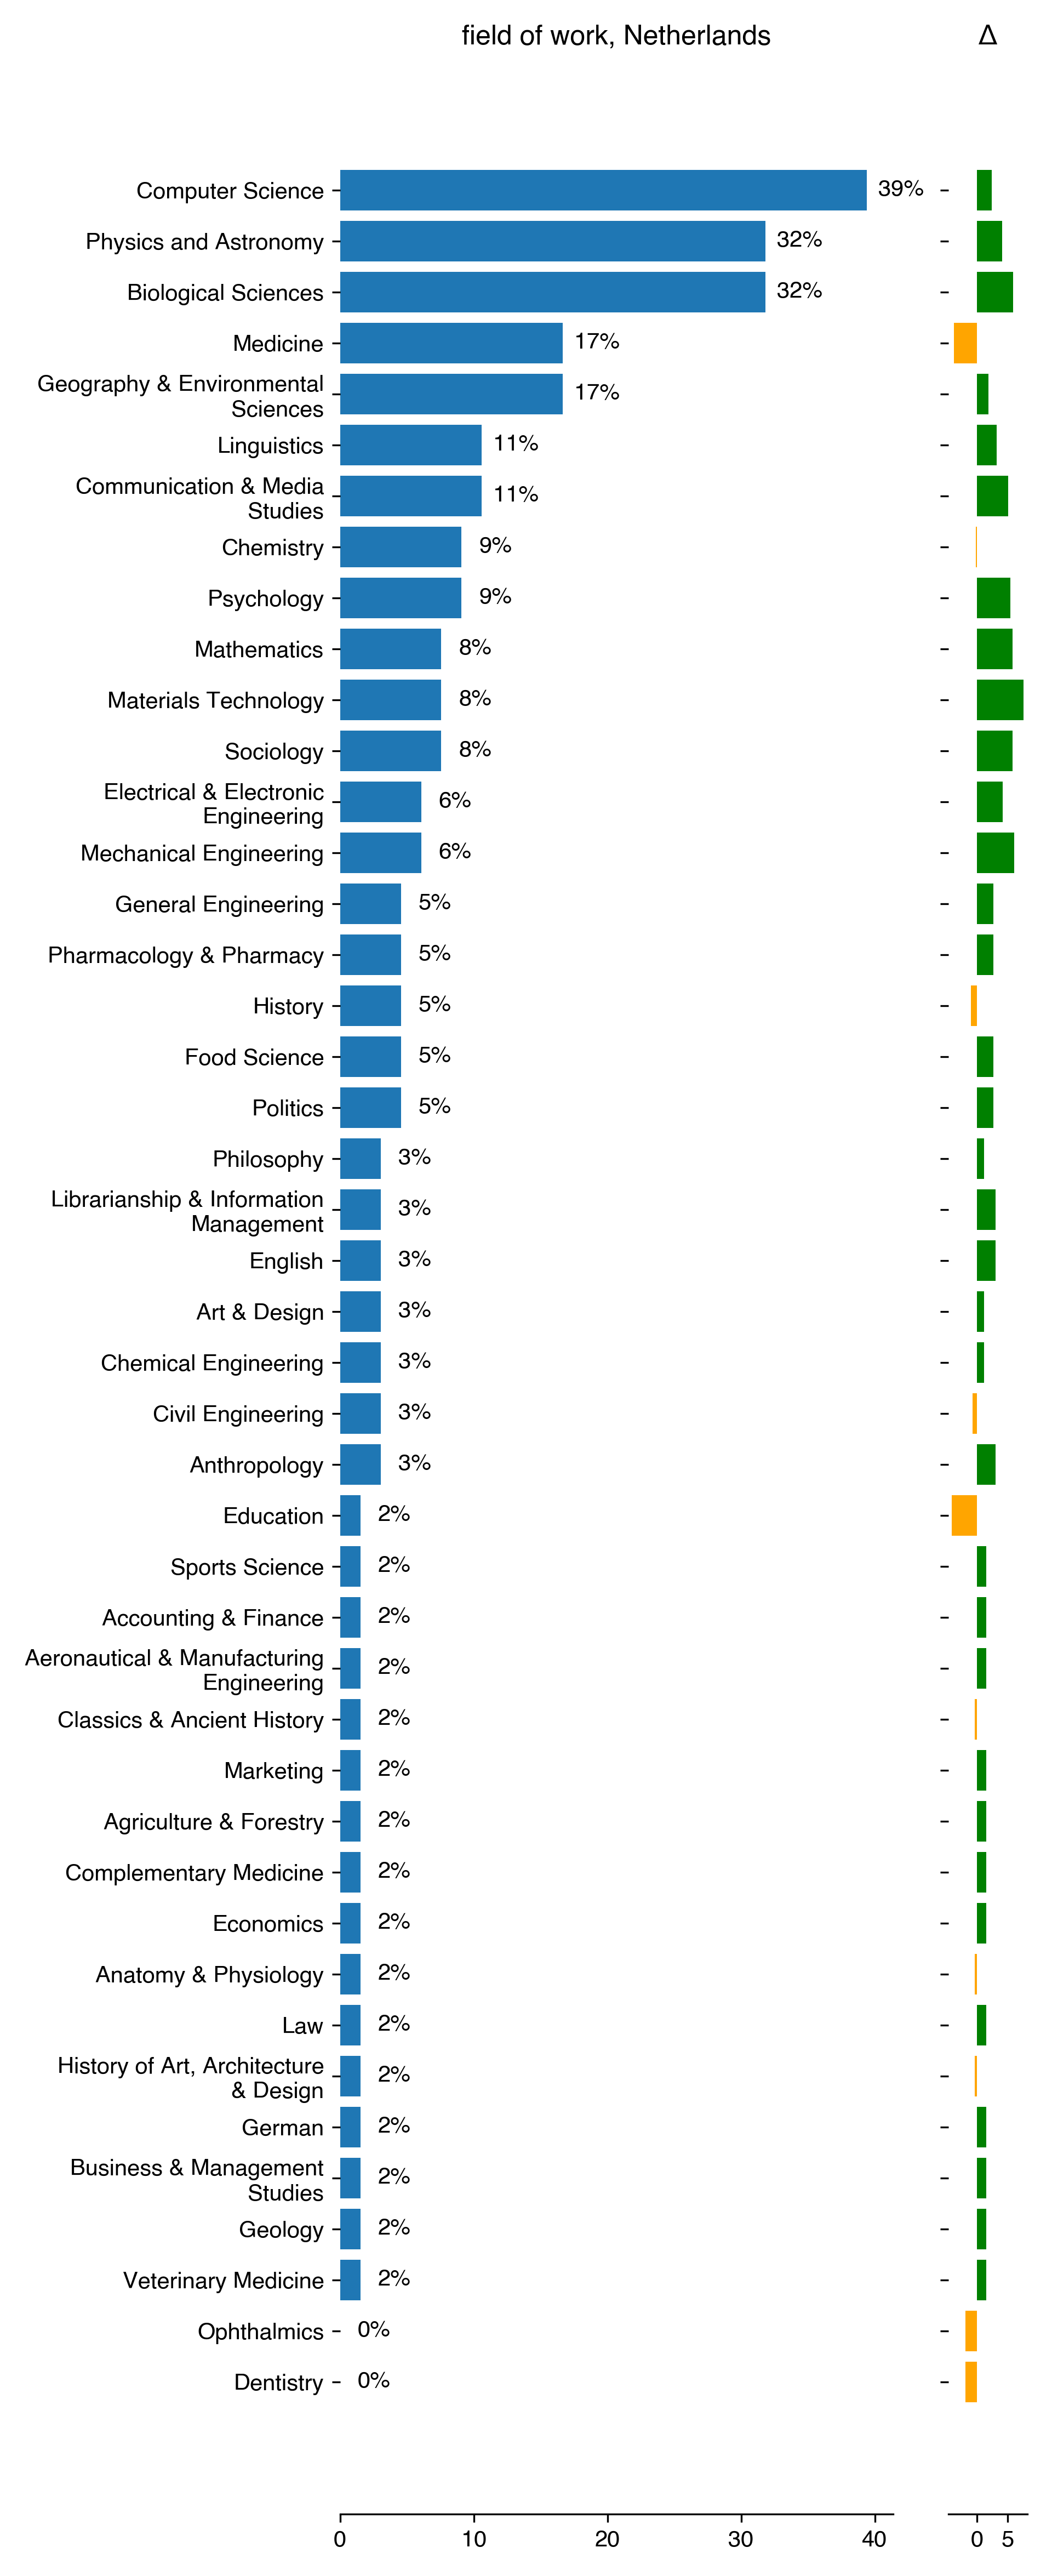
field of work for Netherlands
Count
Percentage
Percentage in 2018
Difference with previous year
Computer Science
26
39.39
37.04
2.36
Physics and Astronomy
21
31.82
27.78
4.04
Biological Sciences
21
31.82
25.93
5.89
Medicine
11
16.67
20.37
-3.7
Geography & Environmental Sciences
11
16.67
14.81
1.85
Linguistics
7
10.61
7.41
3.2
Communication & Media Studies
7
10.61
5.56
5.05
Chemistry
6
9.09
9.26
-0.17
Psychology
6
9.09
3.7
5.39
Mathematics
5
7.58
1.85
5.72
Materials Technology
5
7.58
0
7.58
Sociology
5
7.58
1.85
5.72
Electrical & Electronic Engineering
4
6.06
1.85
4.21
Mechanical Engineering
4
6.06
0
6.06
General Engineering
3
4.55
1.85
2.69
Pharmacology & Pharmacy
3
4.55
1.85
2.69
History
3
4.55
5.56
-1.01
Food Science
3
4.55
1.85
2.69
Politics
3
4.55
1.85
2.69
Philosophy
2
3.03
1.85
1.18
Librarianship & Information Management
2
3.03
0
3.03
English
2
3.03
0
3.03
Art & Design
2
3.03
1.85
1.18
Chemical Engineering
2
3.03
1.85
1.18
Civil Engineering
2
3.03
3.7
-0.67
Anthropology
2
3.03
0
3.03
Education
1
1.52
5.56
-4.04
Sports Science
1
1.52
0
1.52
Accounting & Finance
1
1.52
0
1.52
Aeronautical & Manufacturing Engineering
1
1.52
0
1.52
Classics & Ancient History
1
1.52
1.85
-0.34
Marketing
1
1.52
0
1.52
Agriculture & Forestry
1
1.52
0
1.52
Complementary Medicine
1
1.52
0
1.52
Economics
1
1.52
0
1.52
Anatomy & Physiology
1
1.52
1.85
-0.34
Law
1
1.52
0
1.52
History of Art, Architecture & Design
1
1.52
1.85
-0.34
German
1
1.52
0
1.52
Business & Management Studies
1
1.52
0
1.52
Geology
1
1.52
0
1.52
Veterinary Medicine
1
1.52
0
1.52
Ophthalmics
0
0
1.85
-1.85
Dentistry
0
0
1.85
-1.85
Download CSV
2022-08-22T11:27:11.168272
image/svg+xml
Matplotlib v3.5.2, https://matplotlib.org/
PNG SVG
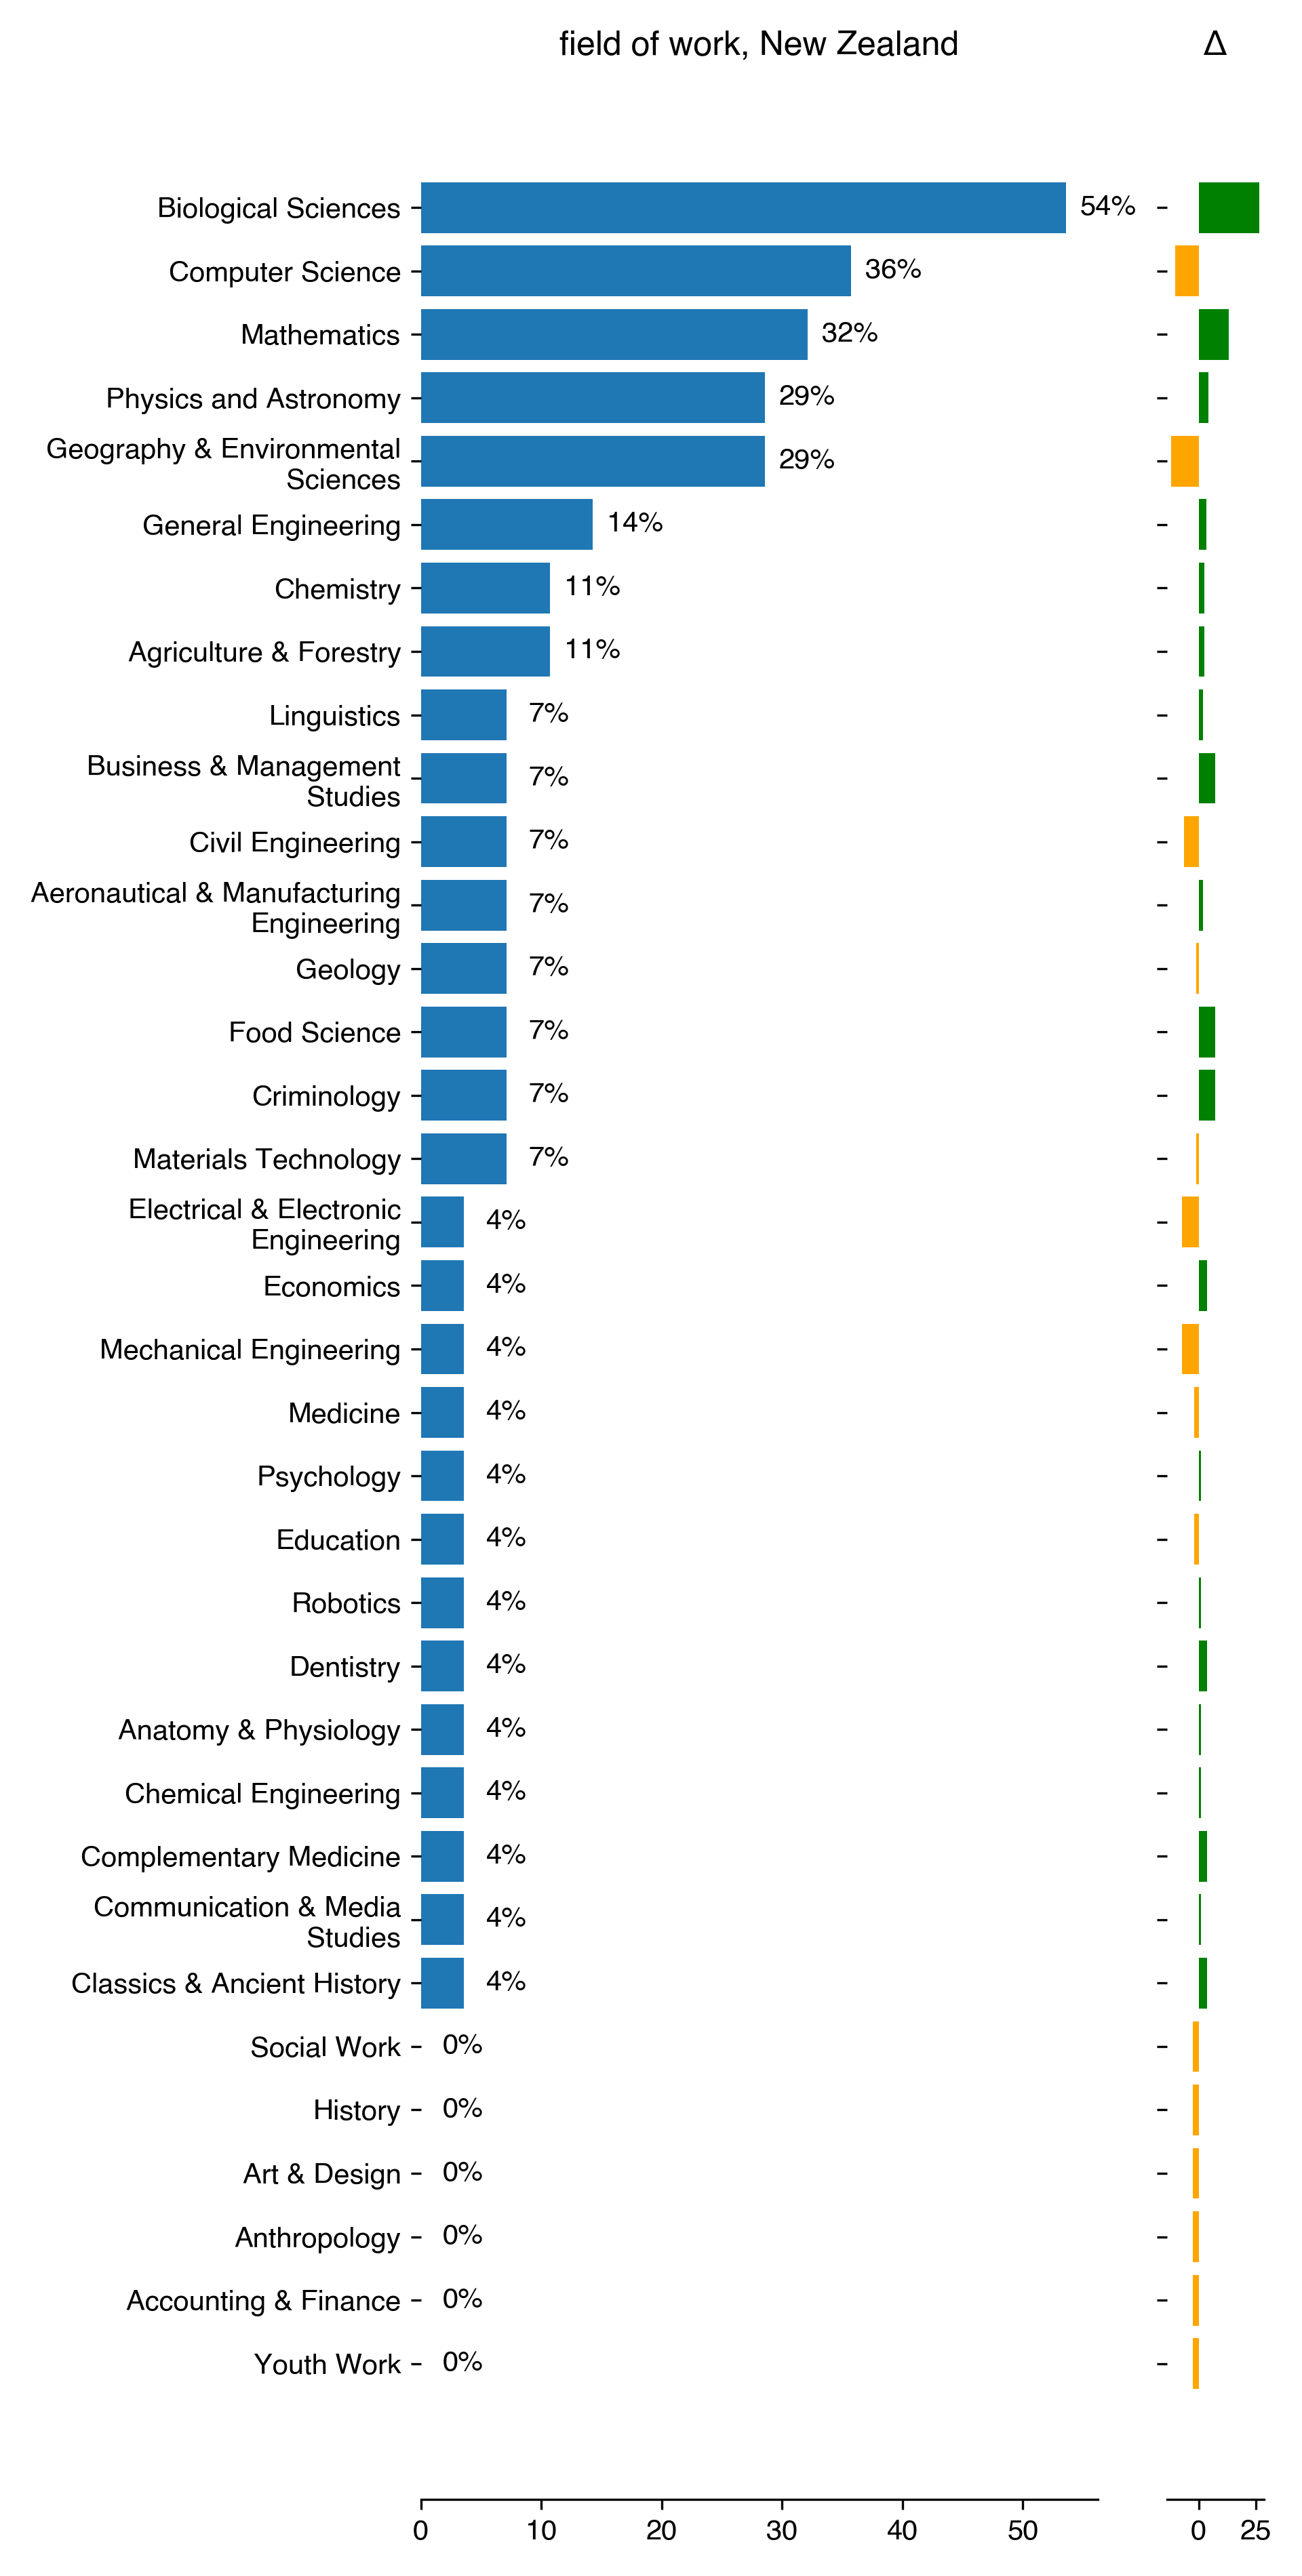
field of work for New Zealand
Count
Percentage
Percentage in 2018
Difference with previous year
Biological Sciences
15
53.57
27.03
26.54
Computer Science
10
35.71
45.95
-10.23
Mathematics
9
32.14
18.92
13.22
Physics and Astronomy
8
28.57
24.32
4.25
Geography & Environmental Sciences
8
28.57
40.54
-11.97
General Engineering
4
14.29
10.81
3.47
Chemistry
3
10.71
8.11
2.61
Agriculture & Forestry
3
10.71
8.11
2.61
Linguistics
2
7.14
5.41
1.74
Business & Management Studies
2
7.14
0
7.14
Civil Engineering
2
7.14
13.51
-6.37
Aeronautical & Manufacturing Engineering
2
7.14
5.41
1.74
Geology
2
7.14
8.11
-0.97
Food Science
2
7.14
0
7.14
Criminology
2
7.14
0
7.14
Materials Technology
2
7.14
8.11
-0.97
Electrical & Electronic Engineering
1
3.57
10.81
-7.24
Economics
1
3.57
0
3.57
Mechanical Engineering
1
3.57
10.81
-7.24
Medicine
1
3.57
5.41
-1.83
Psychology
1
3.57
2.7
0.87
Education
1
3.57
5.41
-1.83
Robotics
1
3.57
2.7
0.87
Dentistry
1
3.57
0
3.57
Anatomy & Physiology
1
3.57
2.7
0.87
Chemical Engineering
1
3.57
2.7
0.87
Complementary Medicine
1
3.57
0
3.57
Communication & Media Studies
1
3.57
2.7
0.87
Classics & Ancient History
1
3.57
0
3.57
Social Work
0
0
2.7
-2.7
History
0
0
2.7
-2.7
Art & Design
0
0
2.7
-2.7
Anthropology
0
0
2.7
-2.7
Accounting & Finance
0
0
2.7
-2.7
Youth Work
0
0
2.7
-2.7
Download CSV
2022-08-22T11:27:13.117166
image/svg+xml
Matplotlib v3.5.2, https://matplotlib.org/
PNG SVG
field of work for South Africa
Count
Percentage
Percentage in 2018
Difference with previous year
Agriculture & Forestry
2
100
0
100
Biological Sciences
2
100
43.48
56.52
Education
0
0
17.39
-17.39
Librarianship & Information Management
0
0
4.35
-4.35
Linguistics
0
0
4.35
-4.35
Electrical & Electronic Engineering
0
0
8.7
-8.7
Economics
0
0
4.35
-4.35
Communication & Media Studies
0
0
4.35
-4.35
Computer Science
0
0
52.17
-52.17
Mathematics
0
0
8.7
-8.7
Physics and Astronomy
0
0
17.39
-17.39
Psychology
0
0
4.35
-4.35
Download CSV
2022-08-22T11:27:14.238551
image/svg+xml
Matplotlib v3.5.2, https://matplotlib.org/
PNG SVG
field of work for United Kingdom
Count
Percentage
Percentage in 2018
Difference with previous year
Computer Science
83
47.43
37.29
10.14
Physics and Astronomy
59
33.71
38.14
-4.42
Biological Sciences
54
30.86
28.39
2.47
Medicine
48
27.43
16.53
10.9
Mathematics
42
24
12.71
11.29
Geography & Environmental Sciences
37
21.14
18.22
2.92
Chemistry
28
16
15.68
0.32
Mechanical Engineering
23
13.14
8.47
4.67
Education
23
13.14
7.2
5.94
General Engineering
19
10.86
7.2
3.65
Materials Technology
19
10.86
7.2
3.65
Aeronautical & Manufacturing Engineering
19
10.86
6.78
4.08
Psychology
18
10.29
3.39
6.9
Electrical & Electronic Engineering
17
9.71
5.08
4.63
Civil Engineering
14
8
5.51
2.49
Geology
11
6.29
5.08
1.2
Chemical Engineering
11
6.29
5.93
0.35
Librarianship & Information Management
11
6.29
3.39
2.9
History
10
5.71
4.24
1.48
Robotics
10
5.71
4.66
1.05
English
9
5.14
2.54
2.6
Linguistics
9
5.14
3.81
1.33
Sociology
9
5.14
4.66
0.48
Economics
7
4
4.66
-0.66
Business & Management Studies
7
4
1.27
2.73
Agriculture & Forestry
7
4
5.08
-1.08
Classics & Ancient History
6
3.43
3.39
0.04
Pharmacology & Pharmacy
6
3.43
3.39
0.04
Art & Design
6
3.43
2.54
0.89
Architecture
6
3.43
1.27
2.16
Accounting & Finance
6
3.43
2.12
1.31
Sports Science
5
2.86
1.27
1.59
Music
5
2.86
1.69
1.16
Anthropology
5
2.86
0.85
2.01
Anatomy & Physiology
5
2.86
2.12
0.74
Social Work
5
2.86
0.85
2.01
Ophthalmics
4
2.29
1.27
1.01
Social Policy
4
2.29
2.97
-0.68
Criminology
4
2.29
1.69
0.59
Food Science
4
2.29
1.27
1.01
Law
3
1.71
0.85
0.87
Nursing
3
1.71
1.27
0.44
Theology & Religious Studies
3
1.71
1.27
0.44
Dentistry
3
1.71
1.69
0.02
Politics
3
1.71
0.42
1.29
Physiotherapy
3
1.71
0.42
1.29
Philosophy
3
1.71
0.85
0.87
Veterinary Medicine
3
1.71
0.85
0.87
History of Art, Architecture & Design
3
1.71
2.12
-0.4
Marketing
3
1.71
0.85
0.87
Town & Country Planning and Landscape Design
2
1.14
1.69
-0.55
Complementary Medicine
2
1.14
1.27
-0.13
French
1
0.57
1.69
-1.12
Counselling
1
0.57
0.42
0.15
American Studies
1
0.57
0.42
0.15
Middle Eastern and African Studies
1
0.57
0.85
-0.28
Youth Work
1
0.57
0.85
-0.28
Land & Property Management
1
0.57
1.27
-0.7
Communication & Media Studies
1
0.57
2.12
-1.55
Iberian Languages/Hispanic Studies
1
0.57
1.27
-0.7
Russian & East European Languages
1
0.57
0.42
0.15
Hospitality, Leisure, Recreation & Tourism
1
0.57
0.42
0.15
German
1
0.57
0.85
-0.28
East & South Asian Studies
1
0.57
0.85
-0.28
Fashion
1
0.57
0.42
0.15
Download CSV
2022-08-22T11:27:17.047924
image/svg+xml
Matplotlib v3.5.2, https://matplotlib.org/
PNG SVG
field of work for United States
Count
Percentage
Percentage in 2018
Difference with previous year
Computer Science
75
46.88
40.14
6.74
Biological Sciences
43
26.88
26.53
0.34
Physics and Astronomy
42
26.25
42.86
-16.61
Geography & Environmental Sciences
23
14.37
15.65
-1.27
Mathematics
21
13.12
10.2
2.92
Materials Technology
16
10
3.4
6.6
Medicine
13
8.12
6.12
2
Chemistry
13
8.12
2.72
5.4
Sociology
12
7.5
3.4
4.1
Psychology
12
7.5
2.04
5.46
Economics
11
6.88
5.44
1.43
Librarianship & Information Management
10
6.25
2.04
4.21
Agriculture & Forestry
9
5.62
1.36
4.26
Mechanical Engineering
9
5.62
2.72
2.9
Civil Engineering
9
5.62
1.36
4.26
Geology
9
5.62
4.08
1.54
Politics
8
5
2.04
2.96
History
8
5
2.04
2.96
General Engineering
8
5
1.36
3.64
Linguistics
8
5
2.04
2.96
Chemical Engineering
8
5
4.08
0.92
Education
7
4.38
3.4
0.97
Electrical & Electronic Engineering
7
4.38
5.44
-1.07
Anthropology
6
3.75
2.72
1.03
English
5
3.12
0.68
2.44
Law
5
3.12
0.68
2.44
Aeronautical & Manufacturing Engineering
4
2.5
0
2.5
Robotics
4
2.5
1.36
1.14
Social Policy
4
2.5
3.4
-0.9
Business & Management Studies
4
2.5
2.04
0.46
Accounting & Finance
4
2.5
1.36
1.14
Criminology
4
2.5
0.68
1.82
French
3
1.88
0
1.88
East & South Asian Studies
3
1.88
0
1.88
Communication & Media Studies
2
1.25
2.04
-0.79
History of Art, Architecture & Design
2
1.25
0
1.25
Town & Country Planning and Landscape Design
2
1.25
0.68
0.57
American Studies
2
1.25
1.36
-0.11
Anatomy & Physiology
2
1.25
2.04
-0.79
Philosophy
2
1.25
0.68
0.57
Art & Design
2
1.25
1.36
-0.11
Classics & Ancient History
2
1.25
0.68
0.57
Social Work
1
0.62
0
0.62
Middle Eastern and African Studies
1
0.62
1.36
-0.74
Russian & East European Languages
1
0.62
0
0.62
Music
1
0.62
0
0.62
Dentistry
1
0.62
0
0.62
Architecture
1
0.62
1.36
-0.74
Food Science
1
0.62
0
0.62
Marketing
1
0.62
0.68
-0.06
Counselling
1
0.62
0
0.62
Complementary Medicine
1
0.62
0.68
-0.06
German
1
0.62
0
0.62
Veterinary Medicine
0
0
1.36
-1.36
Theology & Religious Studies
0
0
1.36
-1.36
Pharmacology & Pharmacy
0
0
2.72
-2.72
Land & Property Management
0
0
0.68
-0.68
Download CSV
2022-08-22T11:27:20.152303
image/svg+xml
Matplotlib v3.5.2, https://matplotlib.org/
PNG SVG
field of work for World
Count
Percentage
Percentage in 2018
Difference with previous year
Computer Science
425
42.63
35.58
7.05
Biological Sciences
273
27.38
21.61
5.77
Physics and Astronomy
248
24.87
27.14
-2.26
Geography & Environmental Sciences
159
15.95
15.38
0.57
Mathematics
147
14.74
10.05
4.69
Medicine
111
11.13
8.34
2.79
Chemistry
95
9.53
6.73
2.79
Mechanical Engineering
66
6.62
5.83
0.79
Education
65
6.52
5.13
1.39
Materials Technology
59
5.92
4.92
0.99
Agriculture & Forestry
59
5.92
3.22
2.7
General Engineering
57
5.72
5.13
0.59
Geology
54
5.42
4.62
0.79
Psychology
51
5.12
2.41
2.7
Electrical & Electronic Engineering
47
4.71
6.93
-2.22
Civil Engineering
46
4.61
3.42
1.2
Linguistics
45
4.51
2.91
1.6
Librarianship & Information Management
45
4.51
2.71
1.8
Chemical Engineering
40
4.01
3.02
1
History
39
3.91
3.12
0.8
Sociology
37
3.71
2.31
1.4
Aeronautical & Manufacturing Engineering
31
3.11
3.72
-0.61
Robotics
30
3.01
4.12
-1.11
Economics
30
3.01
3.02
-0.01
Business & Management Studies
23
2.31
1.11
1.2
Communication & Media Studies
22
2.21
2.51
-0.31
English
20
2.01
1.01
1
Politics
20
2.01
1.21
0.8
Classics & Ancient History
19
1.91
2.11
-0.2
Anthropology
17
1.71
0.9
0.8
Accounting & Finance
16
1.6
1.11
0.5
Food Science
15
1.5
0.7
0.8
Philosophy
15
1.5
1.01
0.5
Law
15
1.5
0.9
0.6
Art & Design
13
1.3
1.51
-0.2
History of Art, Architecture & Design
12
1.2
1.11
0.1
Music
12
1.2
0.7
0.5
Information and computing sciences
12
1.2
0
1.2
Pharmacology & Pharmacy
11
1.1
1.91
-0.81
Social Policy
11
1.1
1.41
-0.3
Anatomy & Physiology
10
1
1.31
-0.3
Criminology
10
1
0.8
0.2
Sports Science
9
0.9
0.4
0.5
Social Work
9
0.9
0.6
0.3
German
9
0.9
1.51
-0.6
East & South Asian Studies
9
0.9
0.3
0.6
Architecture
8
0.8
0.7
0.1
Biomedical and clinical sciences
7
0.7
0
0.7
Middle Eastern and African Studies
7
0.7
0.7
-0
Veterinary Medicine
7
0.7
0.6
0.1
French
7
0.7
0.6
0.1
Theology & Religious Studies
7
0.7
1.21
-0.5
Earth sciences
6
0.6
0
0.6
Biological sciences
6
0.6
0
0.6
Health sciences
6
0.6
0
0.6
Complementary Medicine
6
0.6
0.5
0.1
Physical sciences
6
0.6
0
0.6
Built environment and design
5
0.5
0
0.5
Engineering
5
0.5
0
0.5
Language, communication and culture
5
0.5
0
0.5
Town & Country Planning and Landscape Design
5
0.5
0.6
-0.1
Ophthalmics
5
0.5
0.6
-0.1
American Studies
5
0.5
0.6
-0.1
Dentistry
5
0.5
0.6
-0.1
Marketing
5
0.5
0.8
-0.3
Counselling
4
0.4
0.2
0.2
History, heritage and archaeology
4
0.4
0
0.4
Environmental sciences
4
0.4
0
0.4
Iberian Languages/Hispanic Studies
4
0.4
0.5
-0.1
Commerce, management, tourism and services
4
0.4
0
0.4
Chemical sciences
4
0.4
0
0.4
Nursing
4
0.4
0.4
-0
Human society
4
0.4
0
0.4
Economics.1
3
0.3
0
0.3
Education.1
3
0.3
0
0.3
Physiotherapy
3
0.3
0.2
0.1
Mathematical sciences
2
0.2
0
0.2
Psychology.1
2
0.2
0
0.2
Indigenous studies
2
0.2
0
0.2
Russian & East European Languages
2
0.2
0.2
-0
Land & Property Management
2
0.2
0.6
-0.4
Fashion
1
0.1
0.2
-0.1
Creative arts and writing
1
0.1
0
0.1
Law and legal studies
1
0.1
0
0.1
Philosophy and religious studies
1
0.1
0
0.1
Youth Work
1
0.1
0.4
-0.3
Hospitality, Leisure, Recreation & Tourism
1
0.1
0.2
-0.1
02 Physical Sciences
0
0
3.62
-3.62
01 Mathematical Sciences
0
0
2.41
-2.41
HEALTH SCIENCES
0
0
0.1
-0.1
OTHER STUDIES IN NATURAL SCIENCES AND ENGINEERING
0
0
0.2
-0.2
LIFE SCIENCES RESEARCH RELATED TO HUMAN HEALTH AND DISEASE
0
0
0.2
-0.2
PSYCHOLOGY
0
0
0.2
-0.2
EVOLUTION AND ECOLOGY
0
0
0.2
-0.2
MICROBIOLOGY
0
0
0.1
-0.1
04 Earth Sciences
0
0
2.21
-2.21
03 Chemical Sciences
0
0
1.01
-1.01
17 Psychology and Cognitive Sciences
0
0
0.3
-0.3
05 Environmental Sciences
0
0
2.11
-2.11
15 Commerce, Management, Tourism and Services
0
0
0.2
-0.2
HYDROLOGY
0
0
0.1
-0.1
22 Philosophy and Religious Studies
0
0
0.3
-0.3
21 History and Archaeology
0
0
0.3
-0.3
20 Language, Communication and Culture
0
0
0.5
-0.5
19 Studies in Creative Arts and Writing
0
0
0.3
-0.3
18 Law and Legal Studies
0
0
0.1
-0.1
16 Studies in Human Society
0
0
0.4
-0.4
14 Economics
0
0
0.2
-0.2
06 Biological Sciences
0
0
3.42
-3.42
13 Education
0
0
0.9
-0.9
12 Built Environment and Design
0
0
0.2
-0.2
11 Medical and Health Sciences
0
0
2.41
-2.41
10 Technology
0
0
2.61
-2.61
09 Engineering
0
0
2.31
-2.31
08 Information and Computing Sciences
0
0
4.52
-4.52
07 Agricultural and Veterinary Sciences
0
0
1.01
-1.01
FLUID MECHANICS
0
0
0.1
-0.1
BIOMEDICAL ENGINEERING
0
0
0.1
-0.1
DESIGN AND MANUFACTURING
0
0
0.1
-0.1
INDUSTRIAL ENGINEERING
0
0
0.1
-0.1
ENVIRONMENTAL ENGINEERING
0
0
0.1
-0.1
INFORMATION TECHNOLOGY
0
0
0.2
-0.2
ARTIFICIAL INTELLIGENCE
0
0
0.2
-0.2
PHYSICAL GEOGRAPHY
0
0
0.1
-0.1
EARTH SCIENCE
0
0
0.1
-0.1
CONDENSED MATTERPHYSICS
0
0
0.1
-0.1
ASTRONOMY AND ASTROPHYSICS
0
0
0.3
-0.3
THEORETICAL PHYSICS AND CHEMISTRY
0
0
0.1
-0.1
PHYSICS
0
0
0.1
-0.1
STATISTICS AND PROBABILITY
0
0
0.4
-0.4
APPLIED MATHEMATICS
0
0
0.1
-0.1
Download CSV
2022-08-22T11:27:25.870371
image/svg+xml
Matplotlib v3.5.2, https://matplotlib.org/
PNG SVG