Australia Canada Germany Netherlands New Zealand South Africa United Kingdom United States World
In this section we investigate the relationship between RSEs/RSDs and their own
experience in software development Understandably, we expect them having
several years of software development experience. However, as shown in previous
years, it is not necessarily reflected upon their own feeling of being
considered as professional.
Questions in this section:
Do you consider yourself a professional software developer? (Yes/No)
How many years of software development experience do you have? (integer)
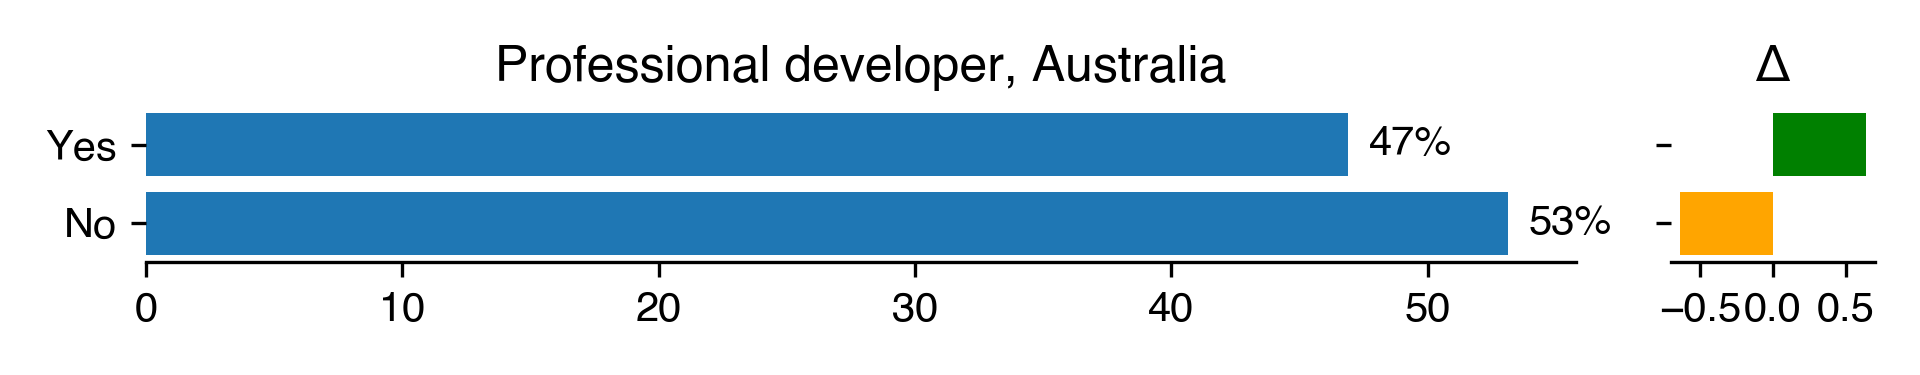
Professional developer for Australia
Count
Percentage
Percentage in 2018
Difference with previous year
Yes
15
46.88
46.24
0.64
No
17
53.12
53.76
-0.64
Download CSV
2022-08-22T11:30:02.429429
image/svg+xml
Matplotlib v3.5.2, https://matplotlib.org/
PNG SVG
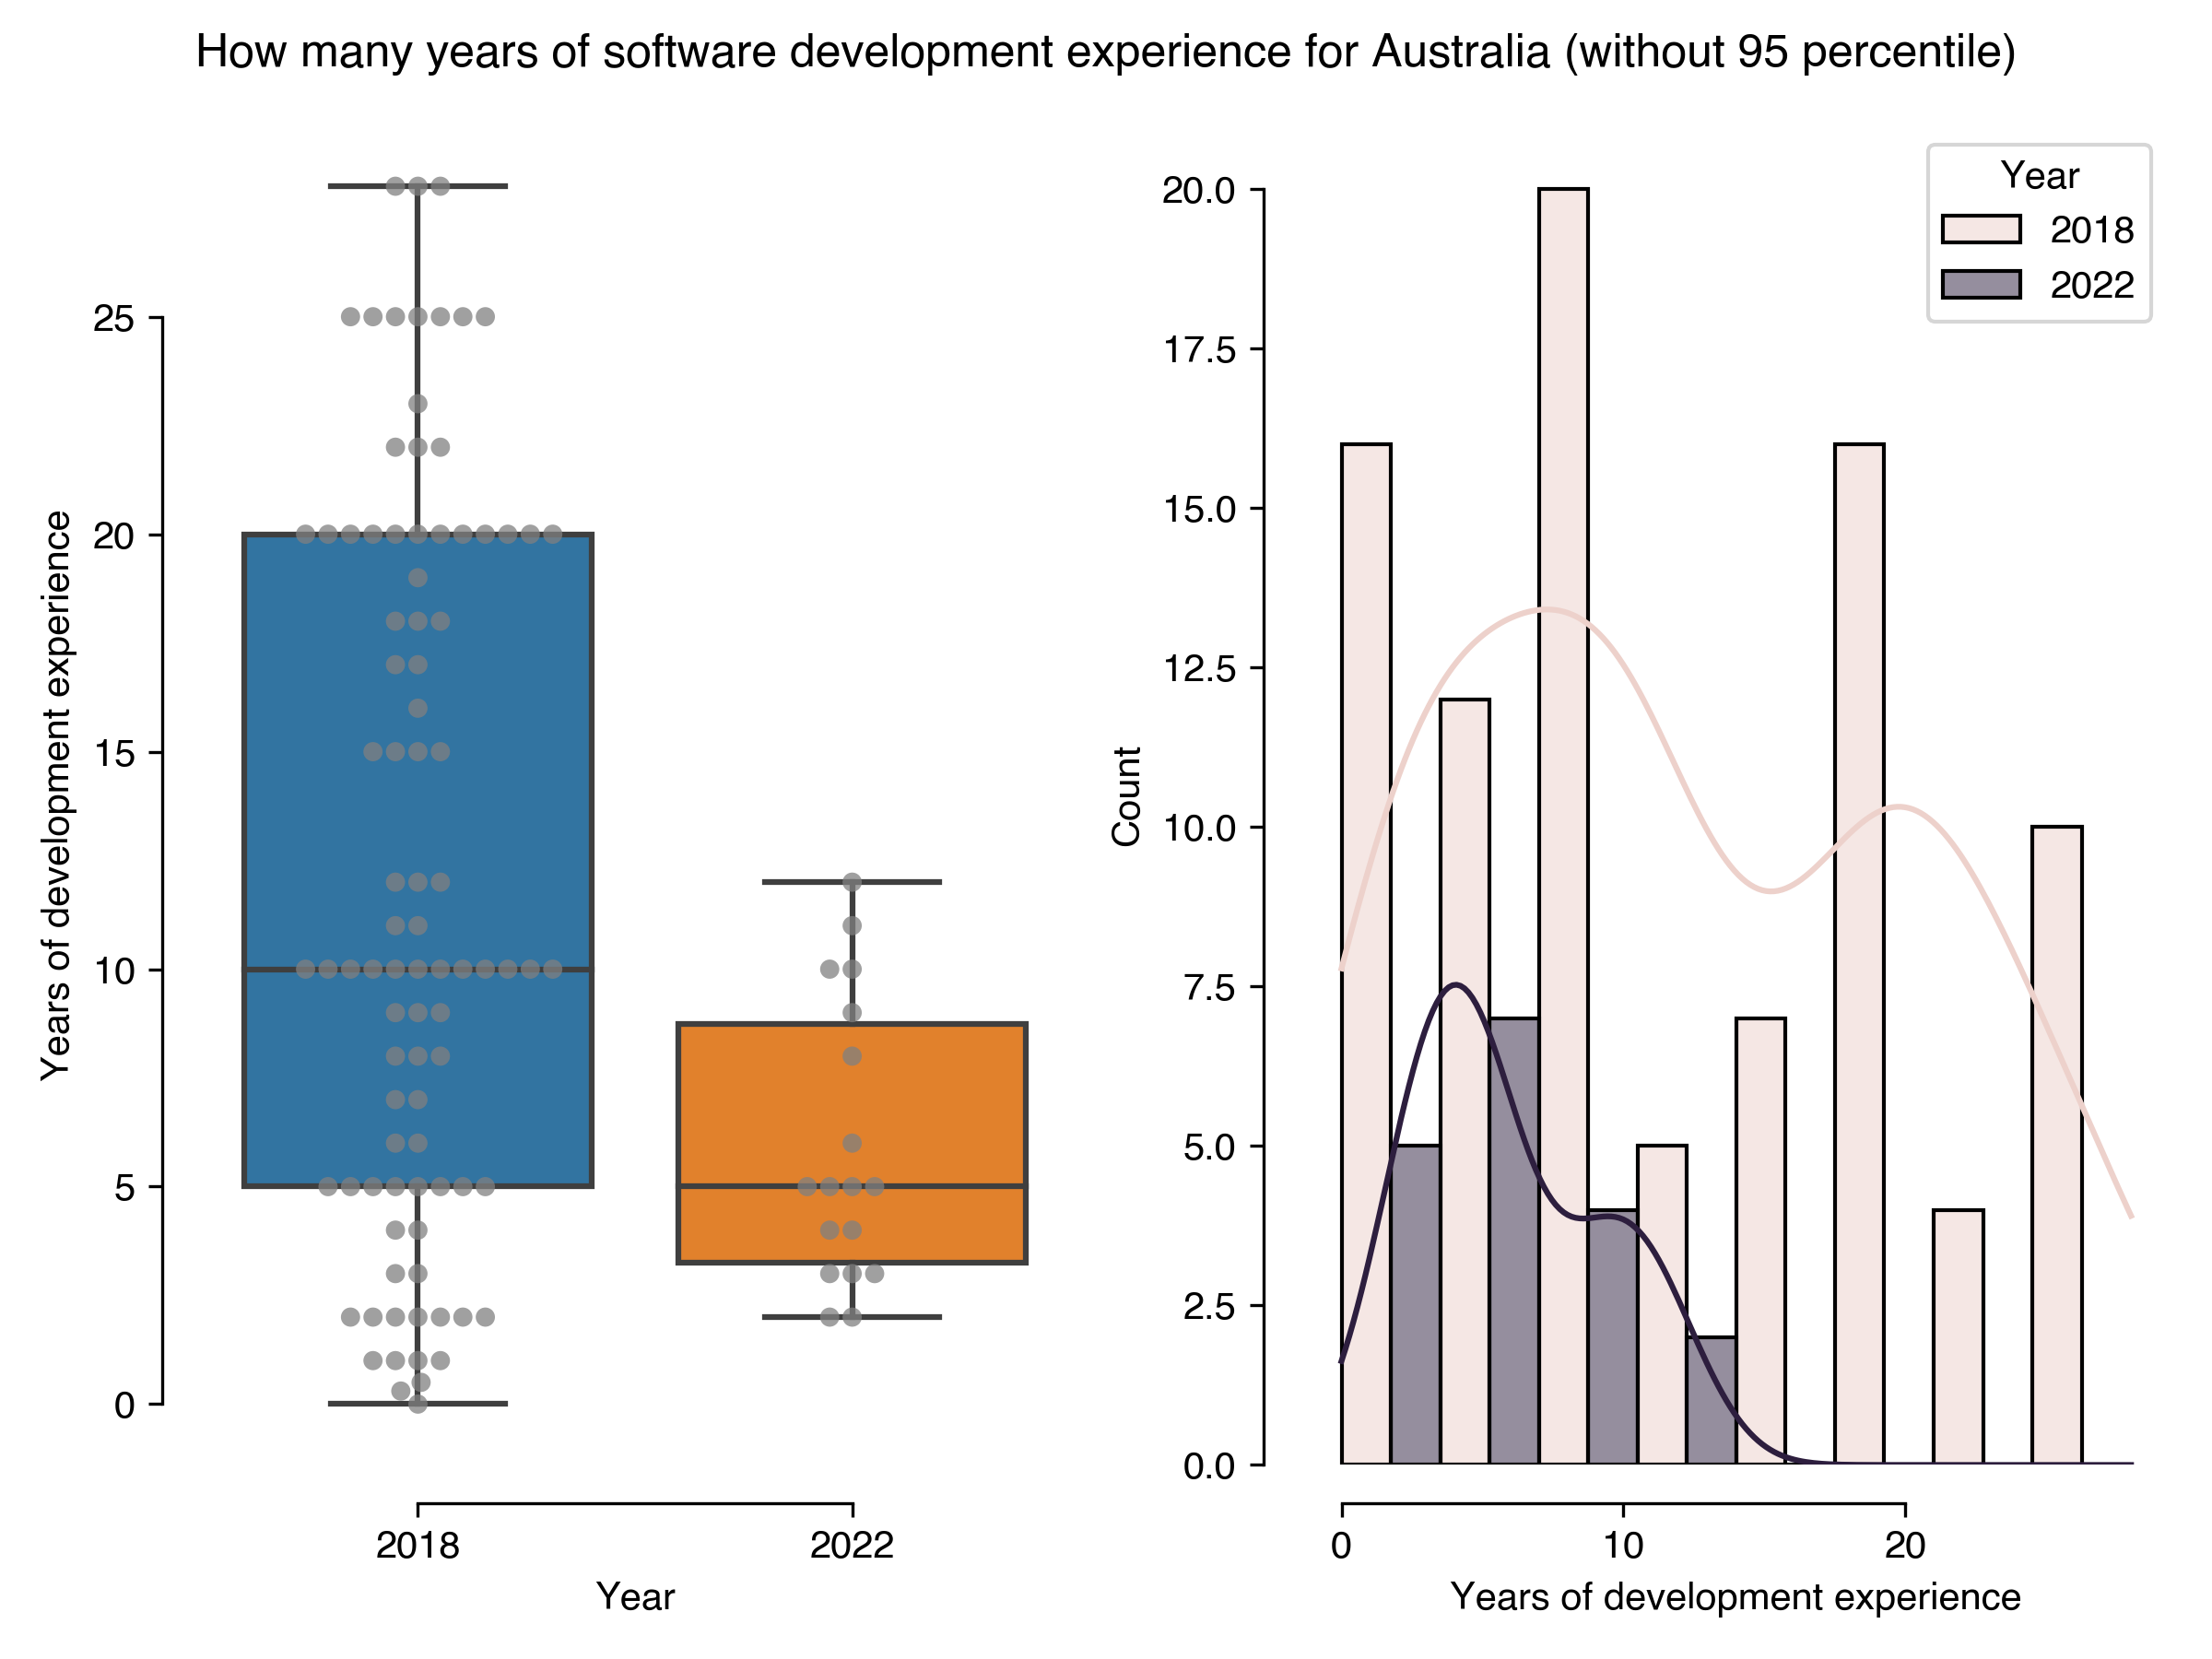
How many years of software development experience for Australia (without 95 percentile)
Results in 2022
Results in 2018
count
18
90
mean
5.94
12.21
std
3.23
8.16
min
2
0
25%
3.25
5
50%
5
10
75%
8.75
20
max
12
28
Download CSV
2022-08-22T11:30:03.248976
image/svg+xml
Matplotlib v3.5.2, https://matplotlib.org/
PNG SVG
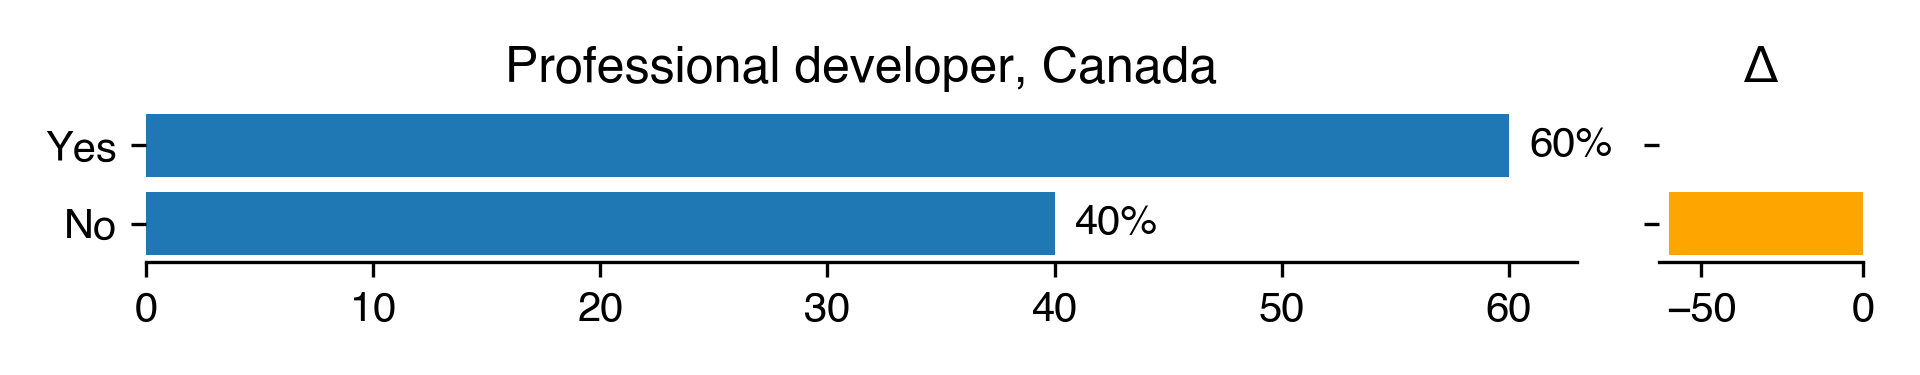
Professional developer for Canada
Count
Percentage
Percentage in 2018
Difference with previous year
Yes
6
60
nan
nan
No
4
40
100
-60
Download CSV
2022-08-22T11:30:03.586826
image/svg+xml
Matplotlib v3.5.2, https://matplotlib.org/
PNG SVG
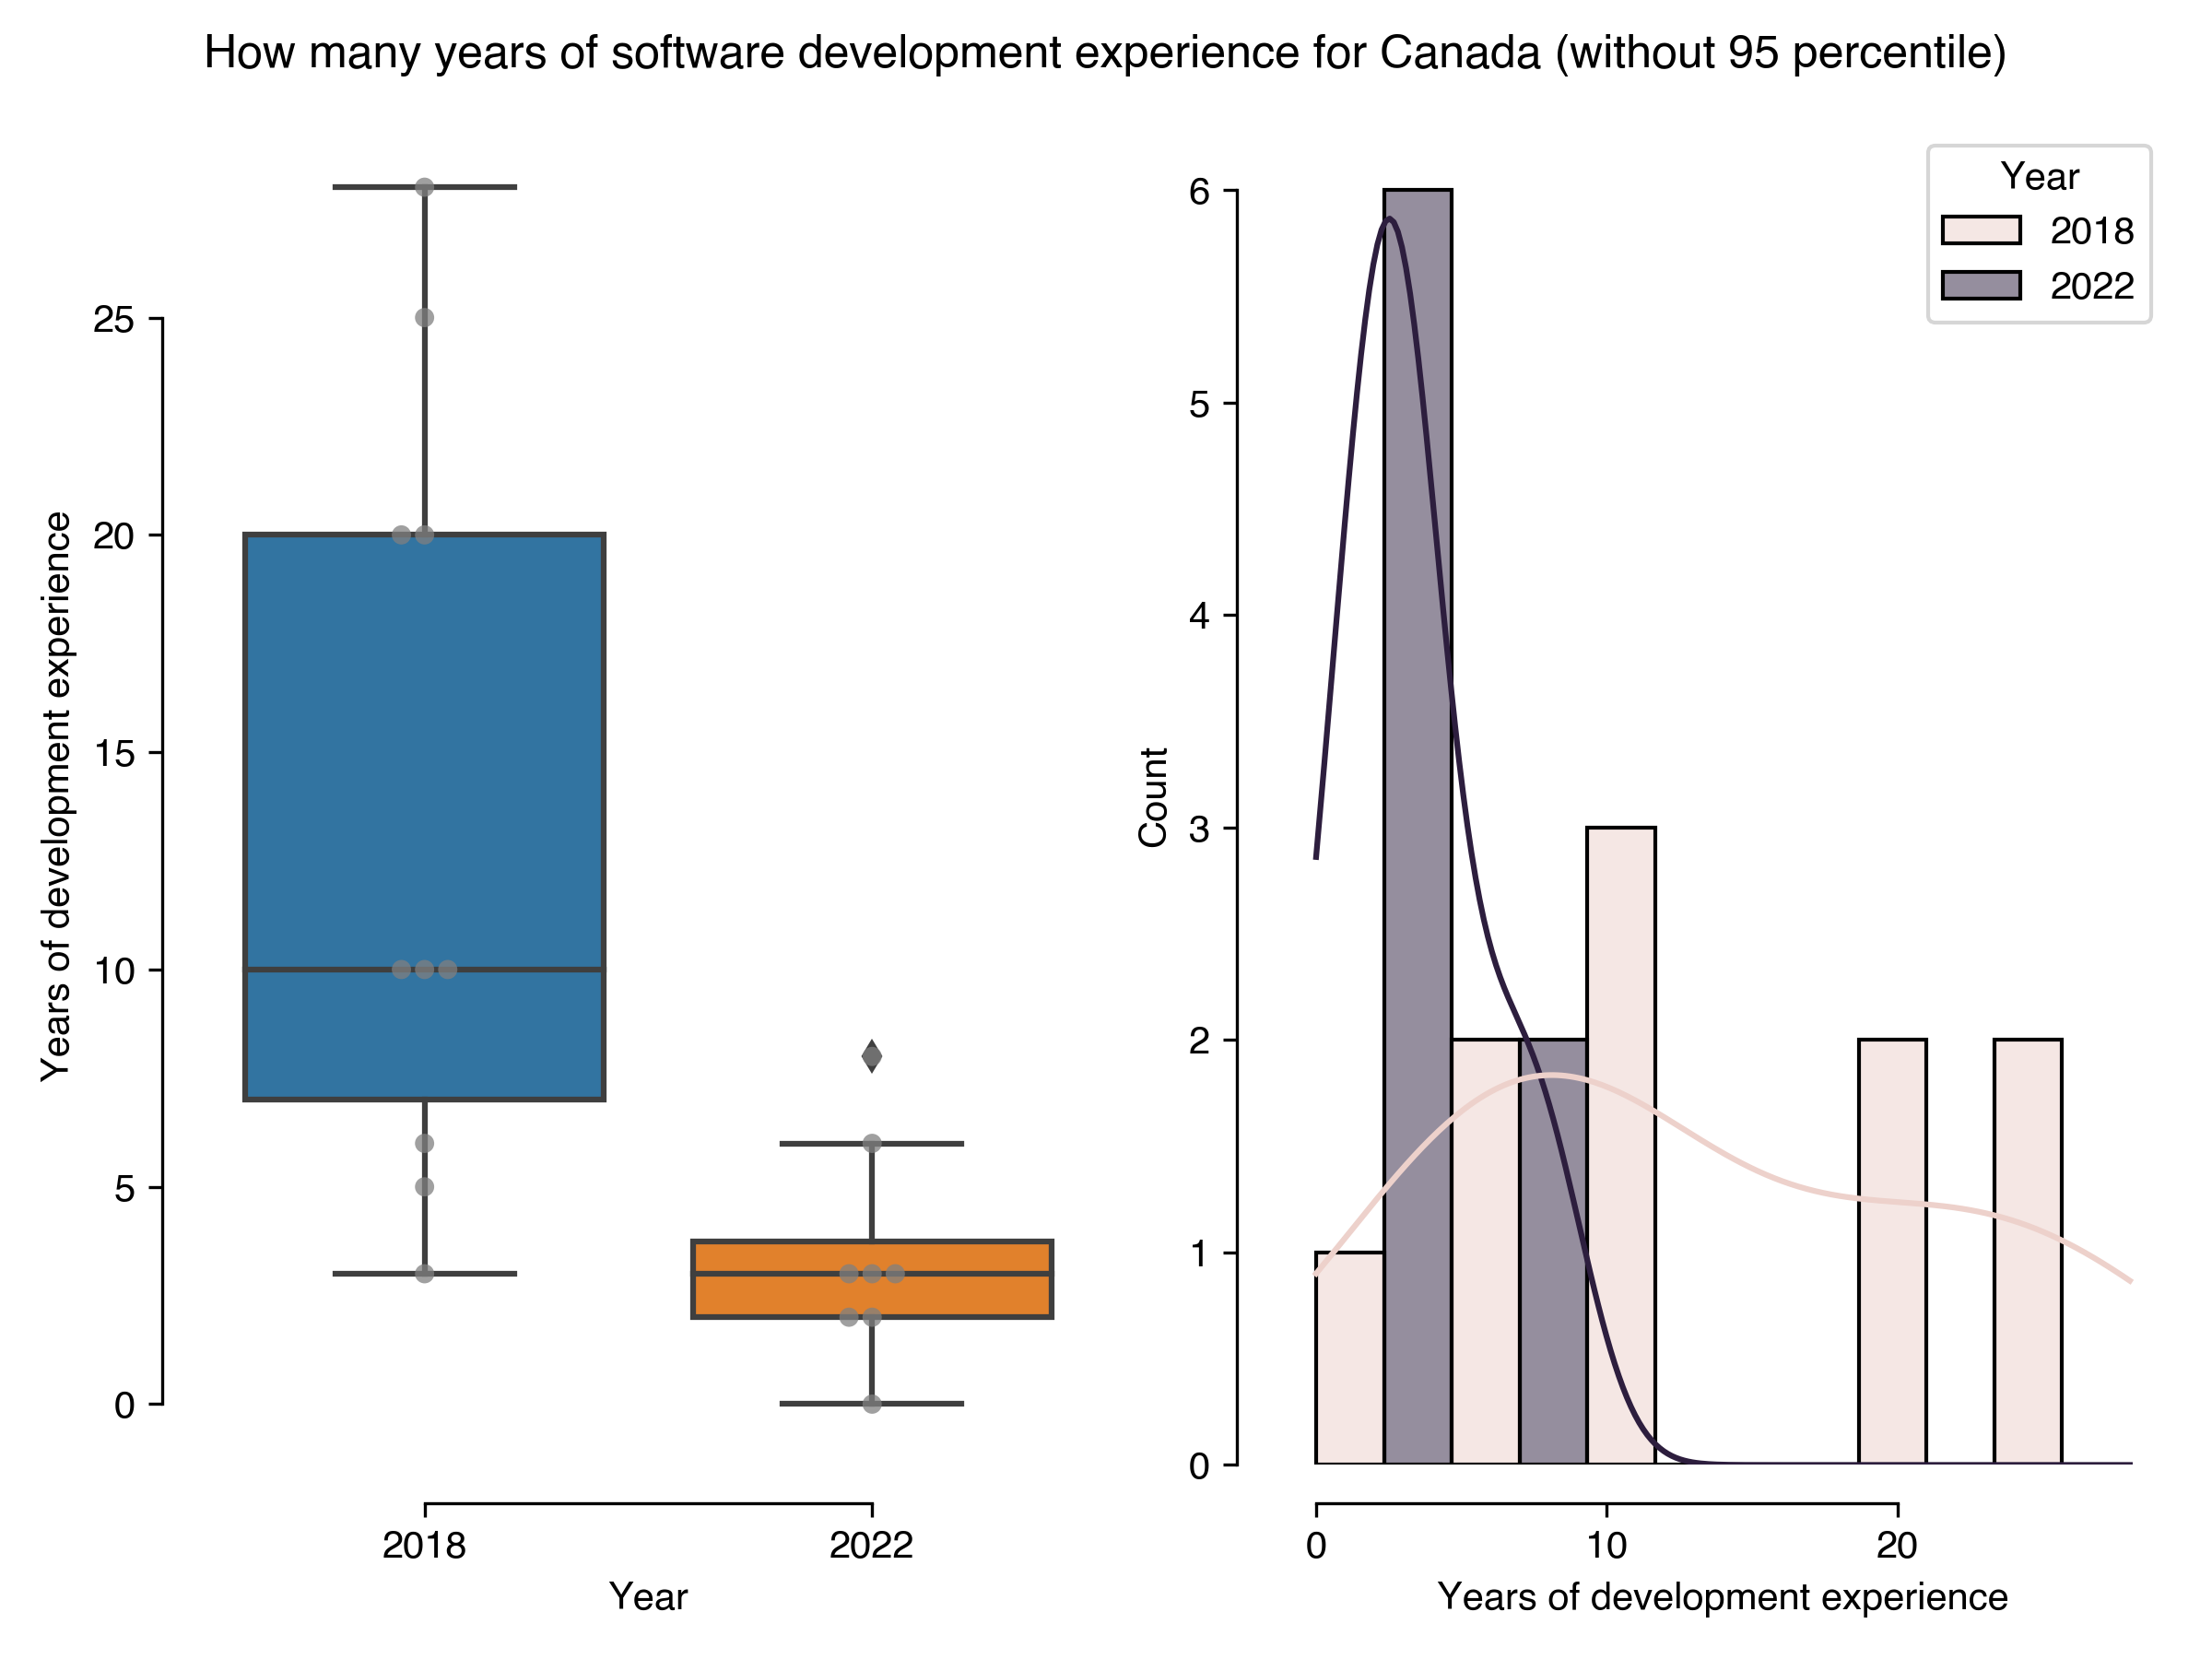
How many years of software development experience for Canada (without 95 percentile)
Results in 2022
Results in 2018
count
8
10
mean
3.38
13.7
std
2.5
8.83
min
0
3
25%
2
7
50%
3
10
75%
3.75
20
max
8
28
Download CSV
2022-08-22T11:30:04.366604
image/svg+xml
Matplotlib v3.5.2, https://matplotlib.org/
PNG SVG
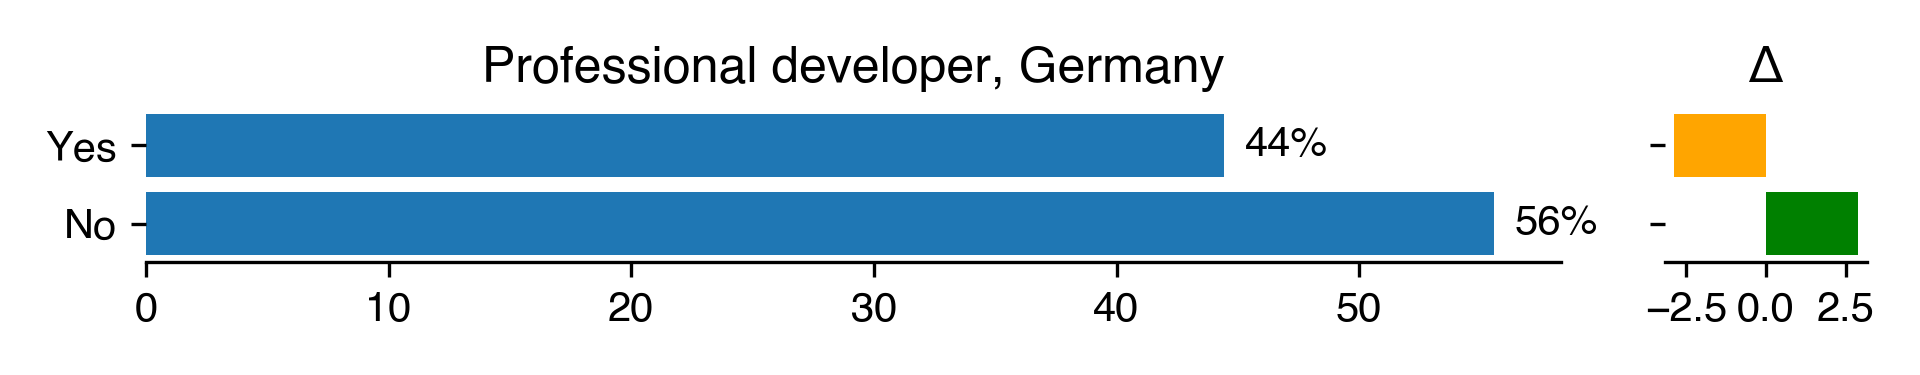
Professional developer for Germany
Count
Percentage
Percentage in 2018
Difference with previous year
Yes
112
44.44
47.32
-2.87
No
140
55.56
52.68
2.87
Download CSV
2022-08-22T11:30:04.816661
image/svg+xml
Matplotlib v3.5.2, https://matplotlib.org/
PNG SVG
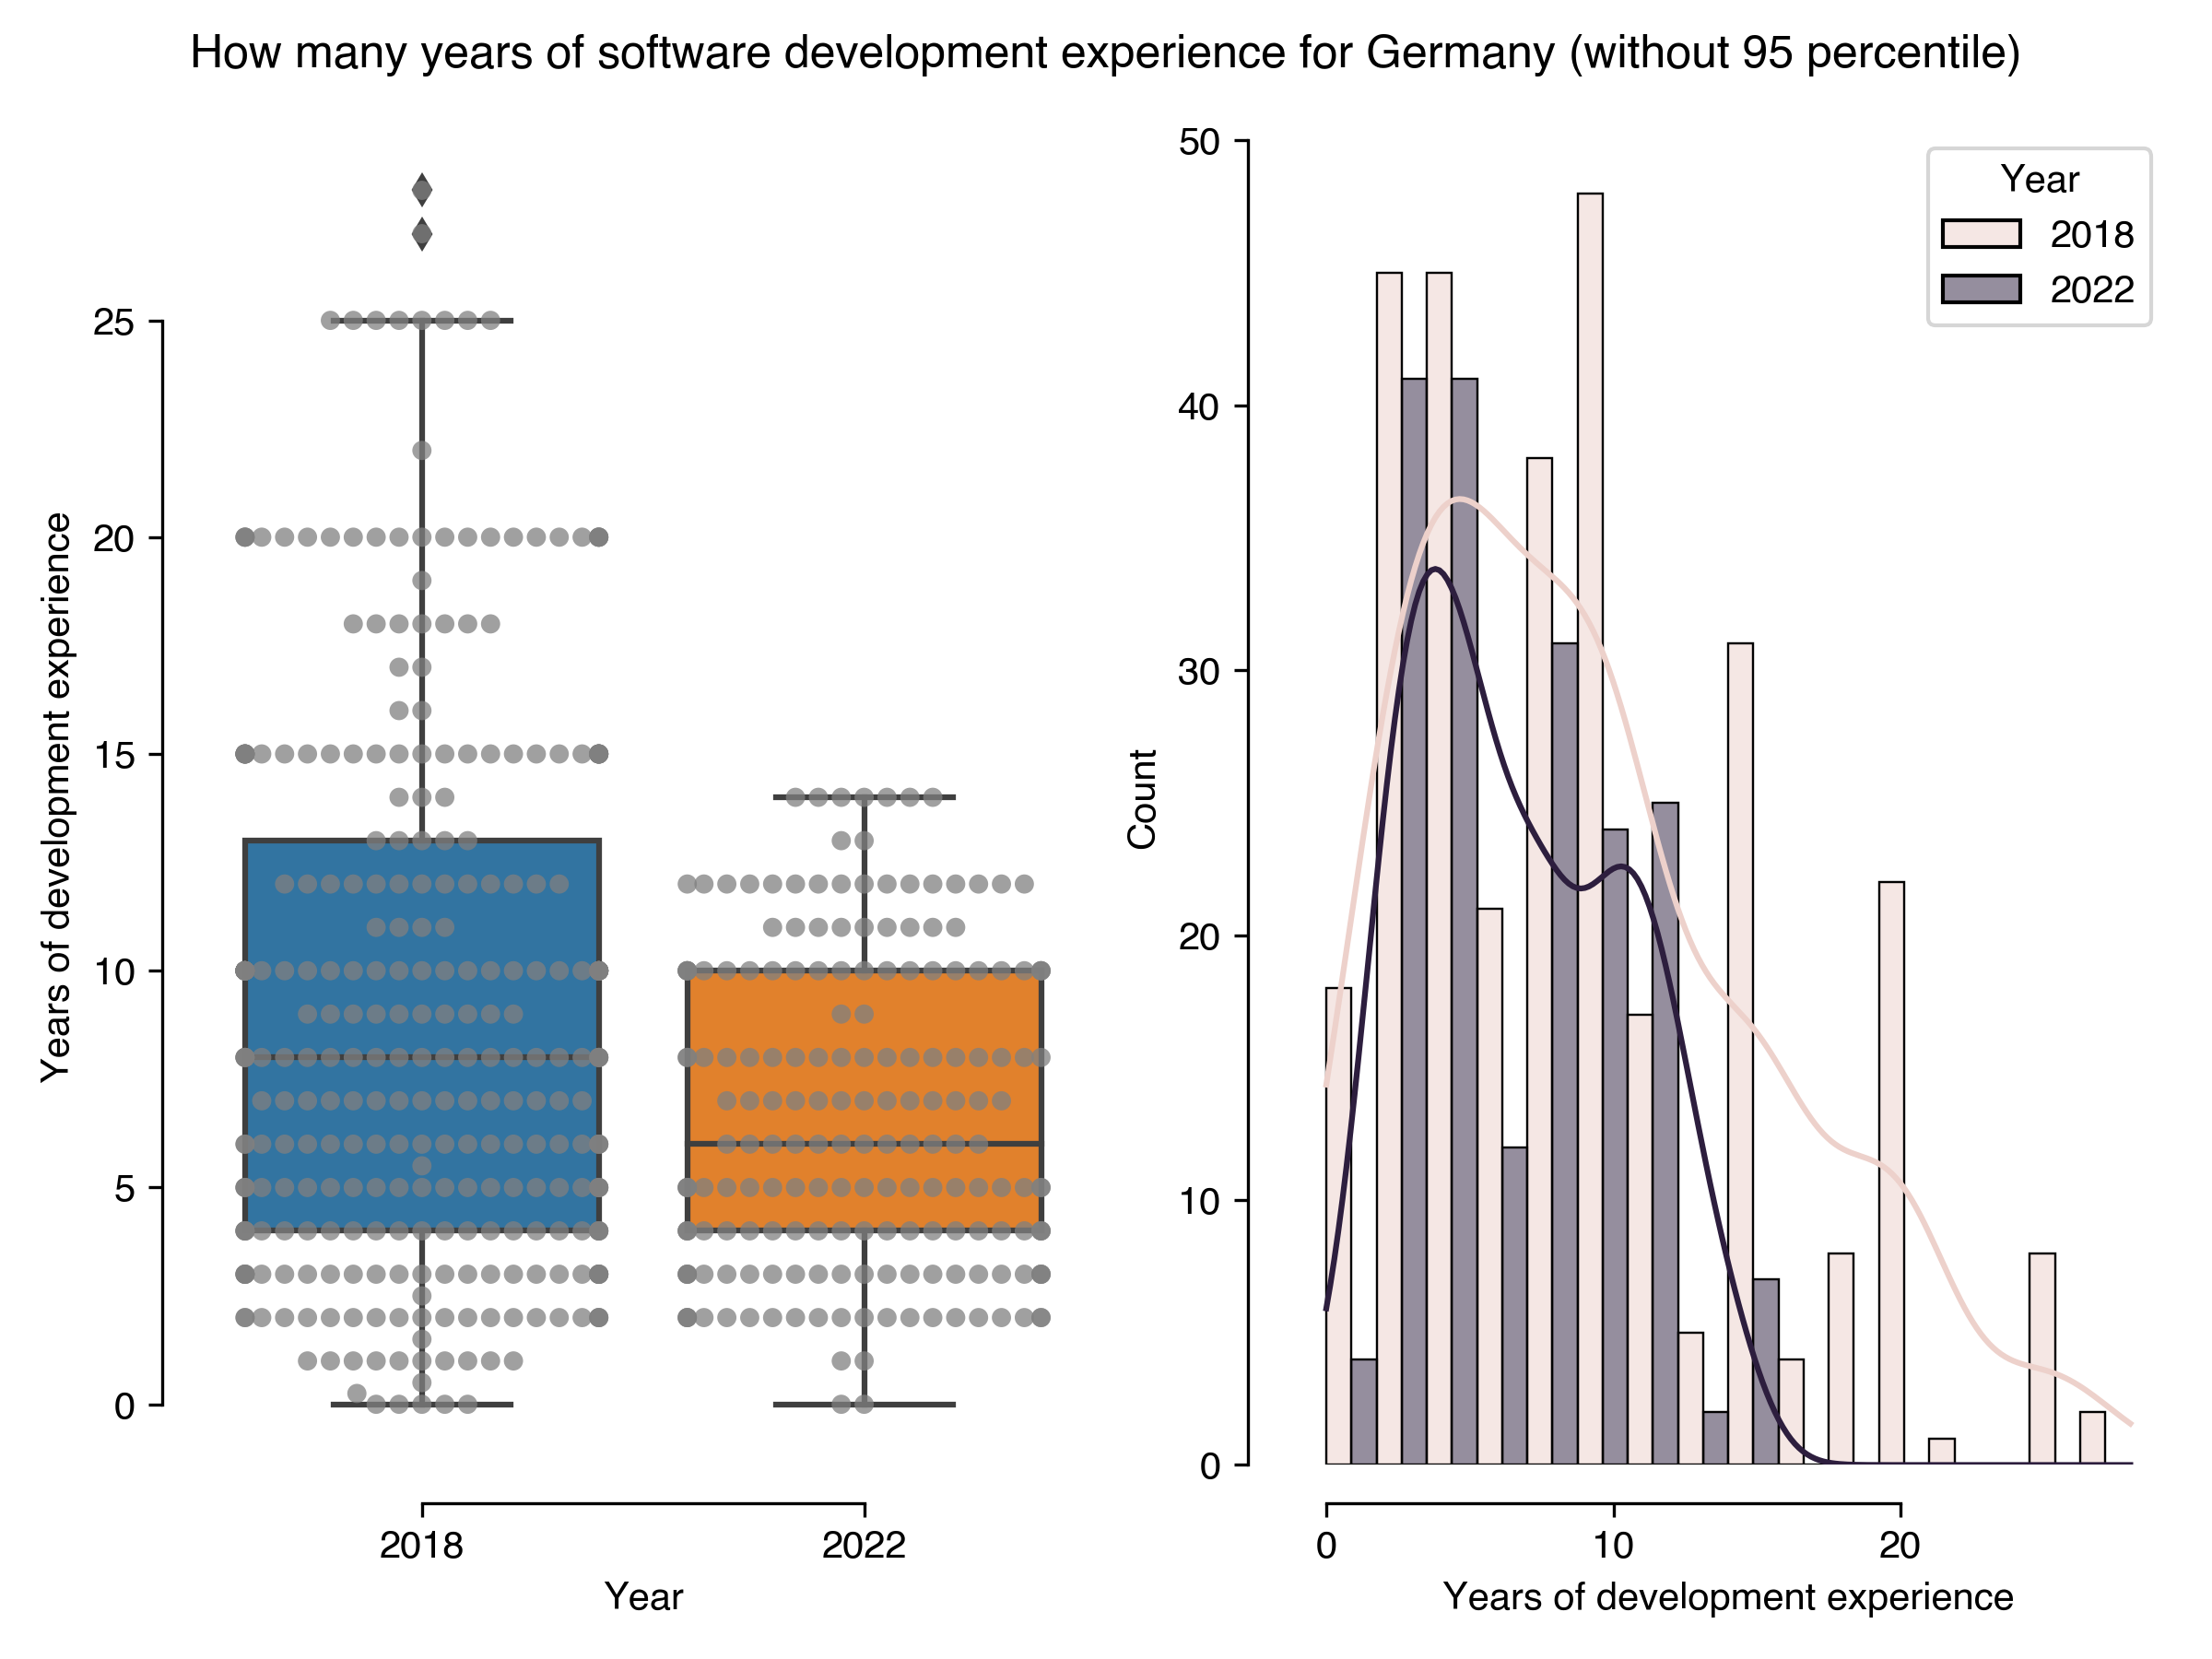
How many years of software development experience for Germany (without 95 percentile)
Results in 2022
Results in 2018
count
187
313
mean
6.68
9.16
std
3.63
6.23
min
0
0
25%
4
4
50%
6
8
75%
10
13
max
14
28
Download CSV
2022-08-22T11:30:05.814302
image/svg+xml
Matplotlib v3.5.2, https://matplotlib.org/
PNG SVG
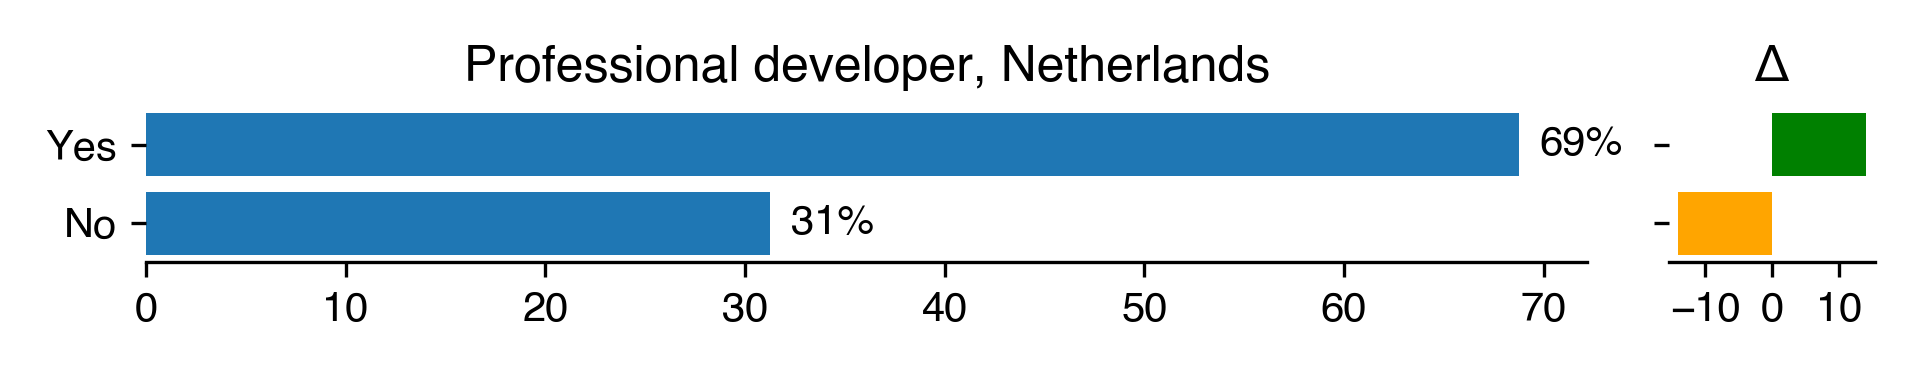
Professional developer for Netherlands
Count
Percentage
Percentage in 2018
Difference with previous year
Yes
44
68.75
54.72
14.03
No
20
31.25
45.28
-14.03
Download CSV
2022-08-22T11:30:06.192861
image/svg+xml
Matplotlib v3.5.2, https://matplotlib.org/
PNG SVG
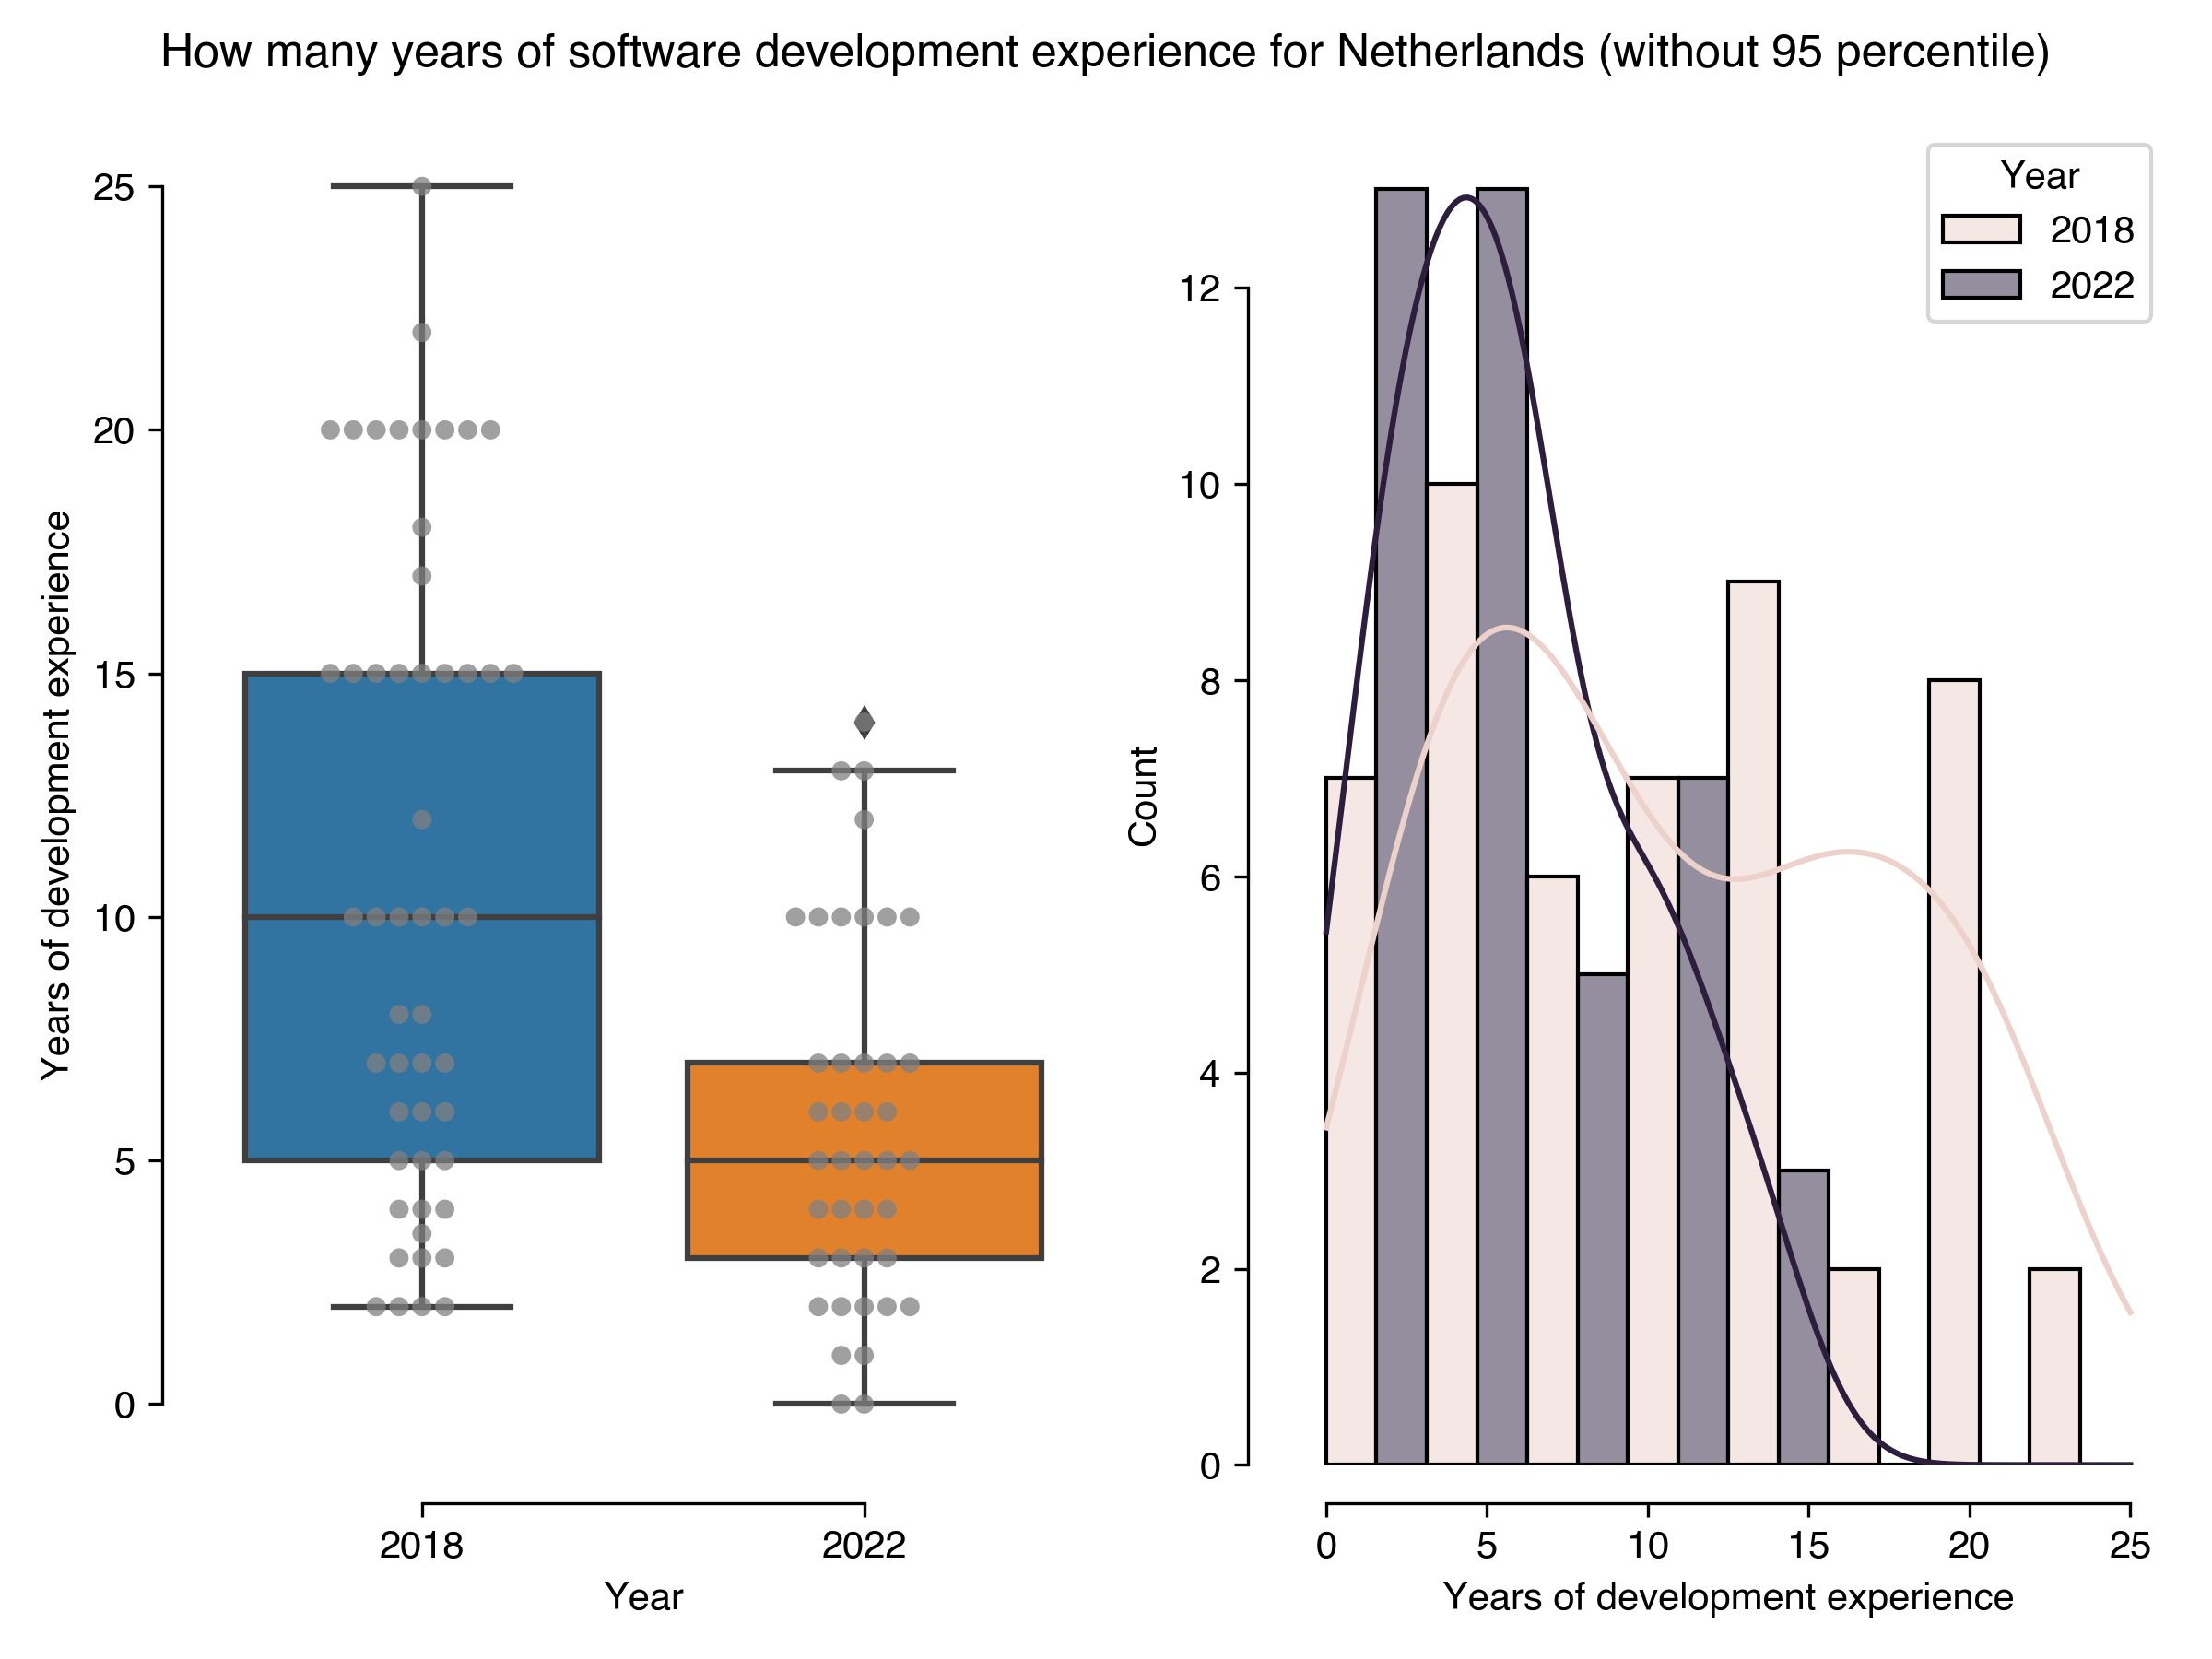
How many years of software development experience for Netherlands (without 95 percentile)
Results in 2022
Results in 2018
count
41
51
mean
5.76
10.95
std
3.73
6.61
min
0
2
25%
3
5
50%
5
10
75%
7
15
max
14
25
Download CSV
2022-08-22T11:30:07.013863
image/svg+xml
Matplotlib v3.5.2, https://matplotlib.org/
PNG SVG
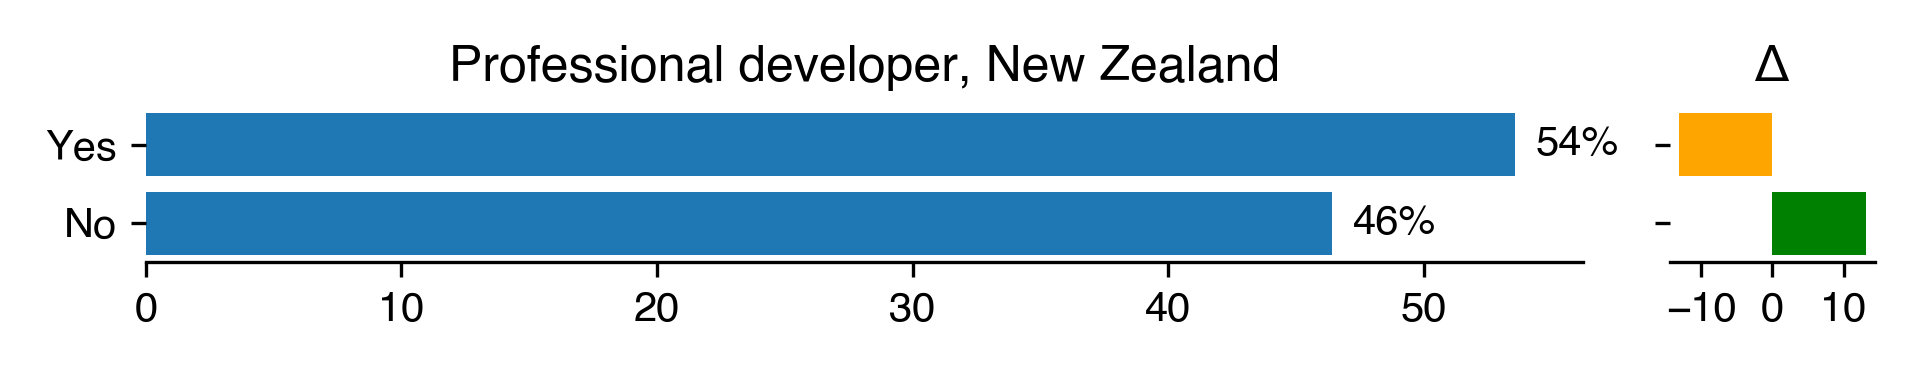
Professional developer for New Zealand
Count
Percentage
Percentage in 2018
Difference with previous year
Yes
15
53.57
66.67
-13.1
No
13
46.43
33.33
13.1
Download CSV
2022-08-22T11:30:07.364095
image/svg+xml
Matplotlib v3.5.2, https://matplotlib.org/
PNG SVG
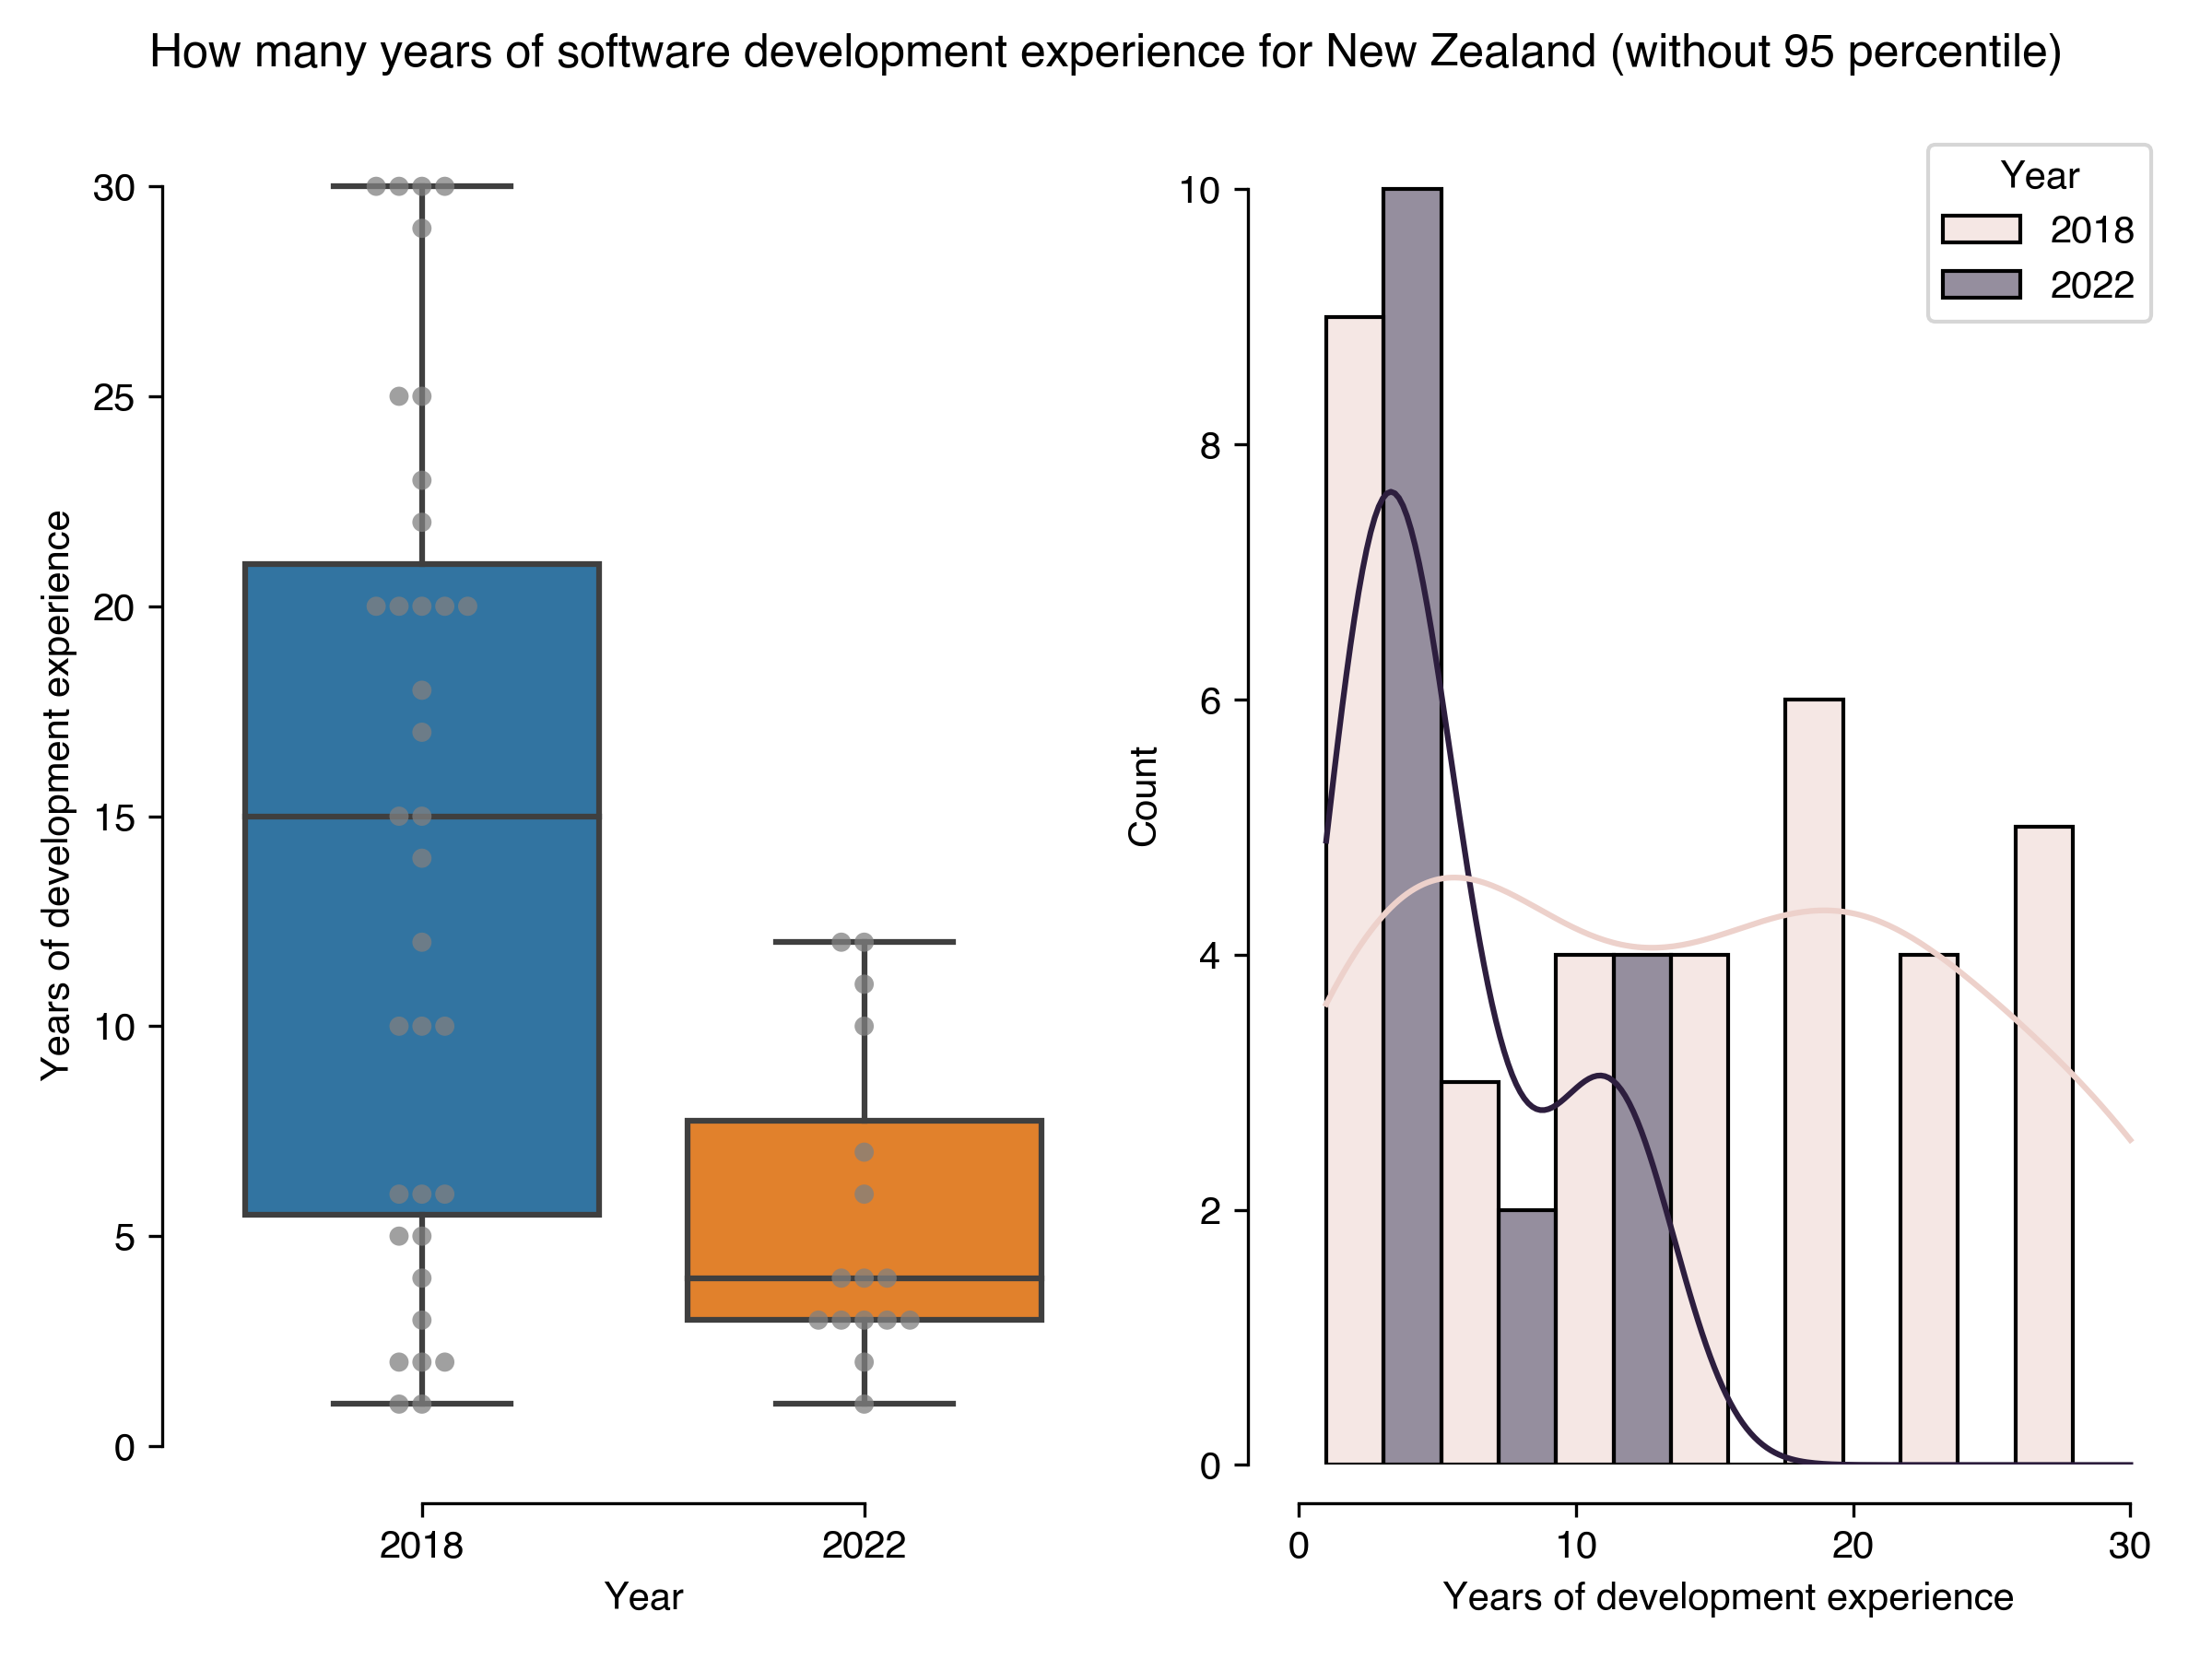
How many years of software development experience for New Zealand (without 95 percentile)
Results in 2022
Results in 2018
count
16
35
mean
5.5
14.51
std
3.72
9.75
min
1
1
25%
3
5.5
50%
4
15
75%
7.75
21
max
12
30
Download CSV
2022-08-22T11:30:08.146300
image/svg+xml
Matplotlib v3.5.2, https://matplotlib.org/
PNG SVG
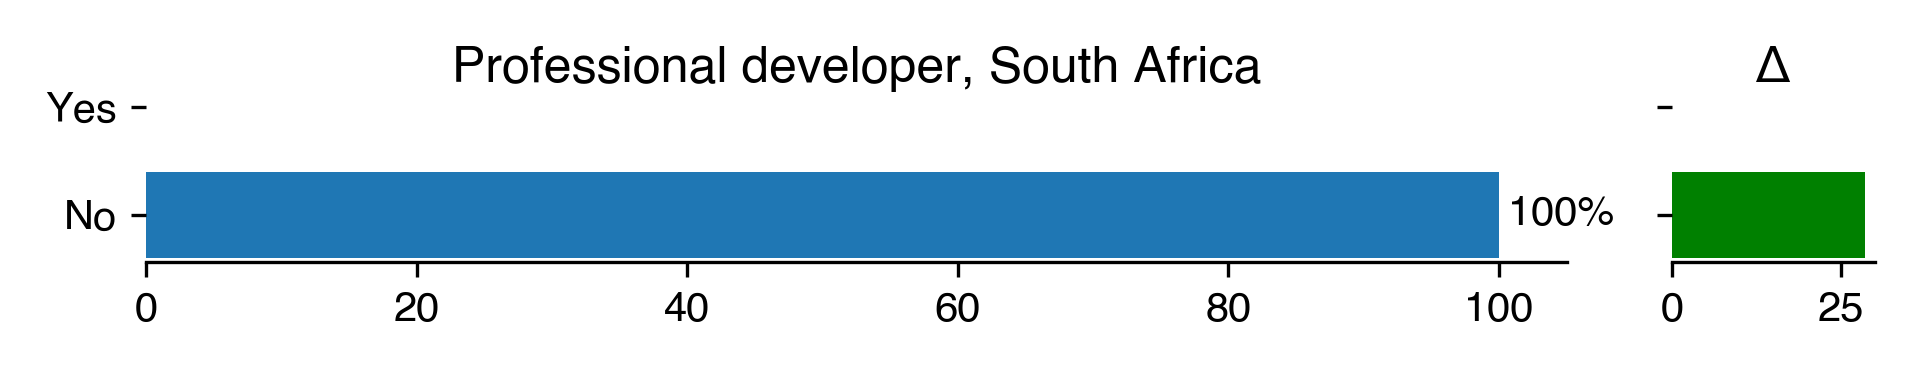
Professional developer for South Africa
Count
Percentage
Percentage in 2018
Difference with previous year
Yes
nan
nan
28.57
nan
No
2
100
71.43
28.57
Download CSV
2022-08-22T11:30:08.471321
image/svg+xml
Matplotlib v3.5.2, https://matplotlib.org/
PNG SVG
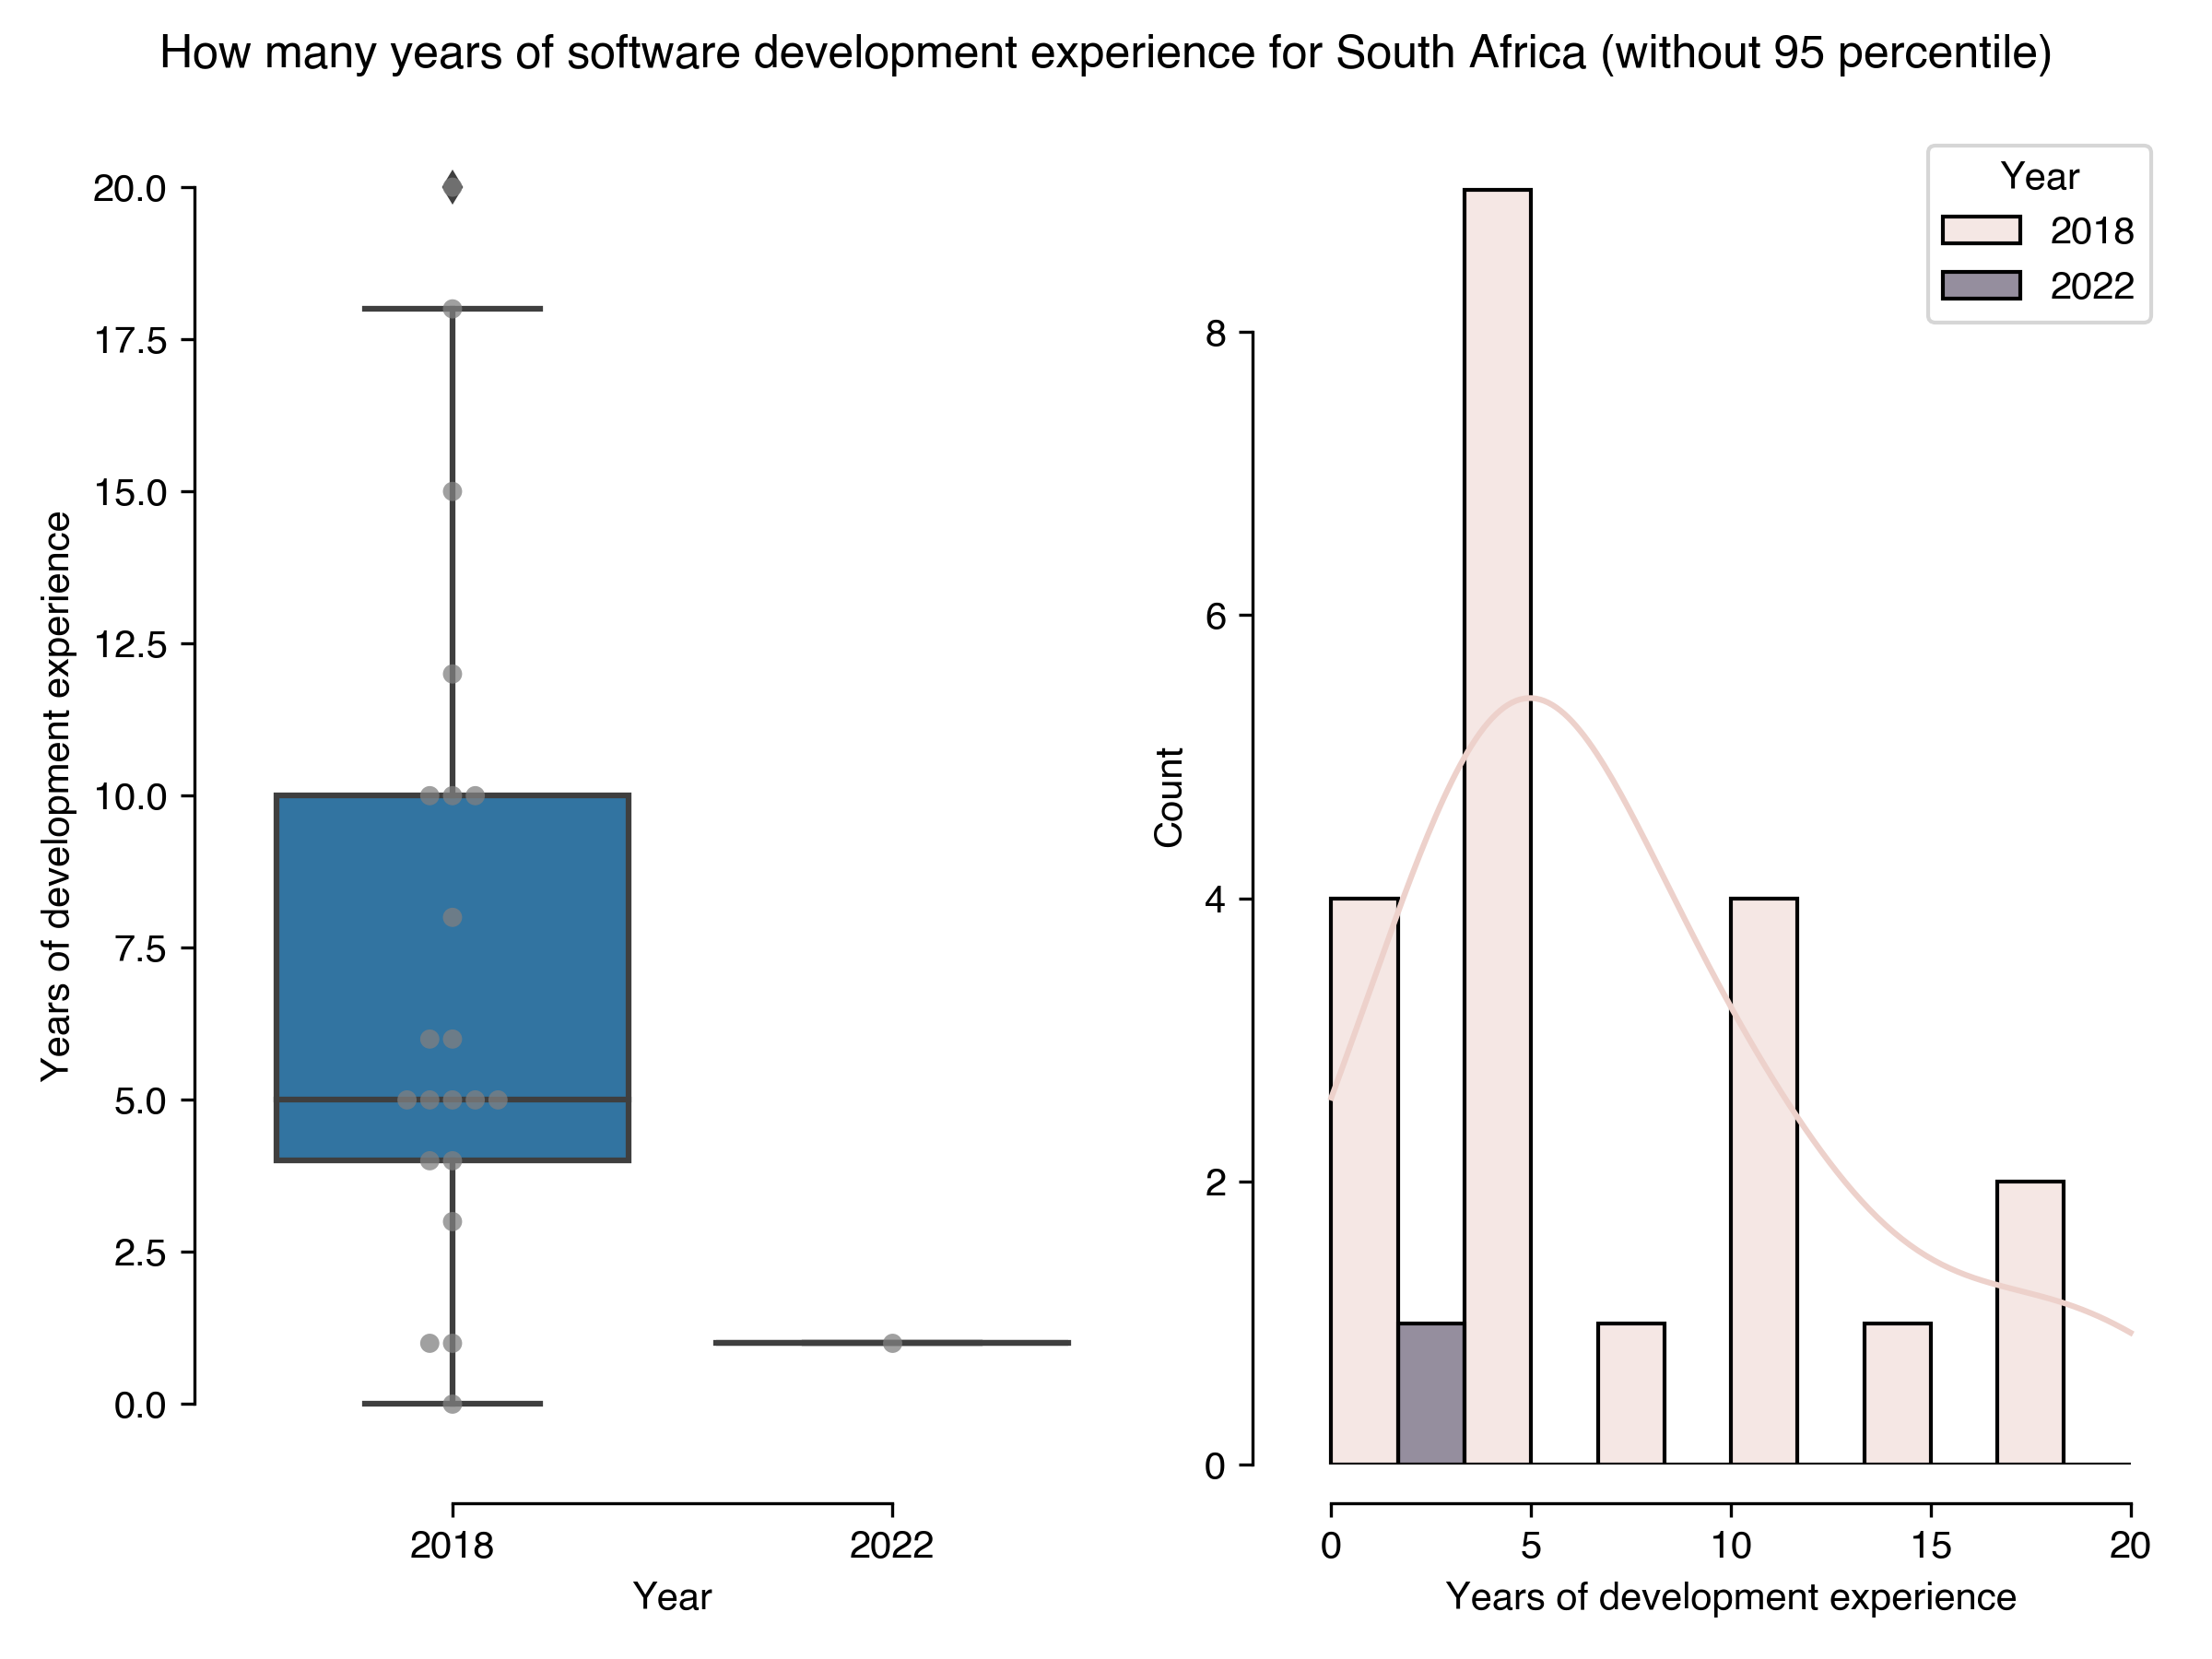
How many years of software development experience for South Africa (without 95 percentile)
Results in 2022
Results in 2018
count
1
21
mean
1
7.29
std
nan
5.4
min
1
0
25%
1
4
50%
1
5
75%
1
10
max
1
20
Download CSV
2022-08-22T11:30:09.254416
image/svg+xml
Matplotlib v3.5.2, https://matplotlib.org/
PNG SVG
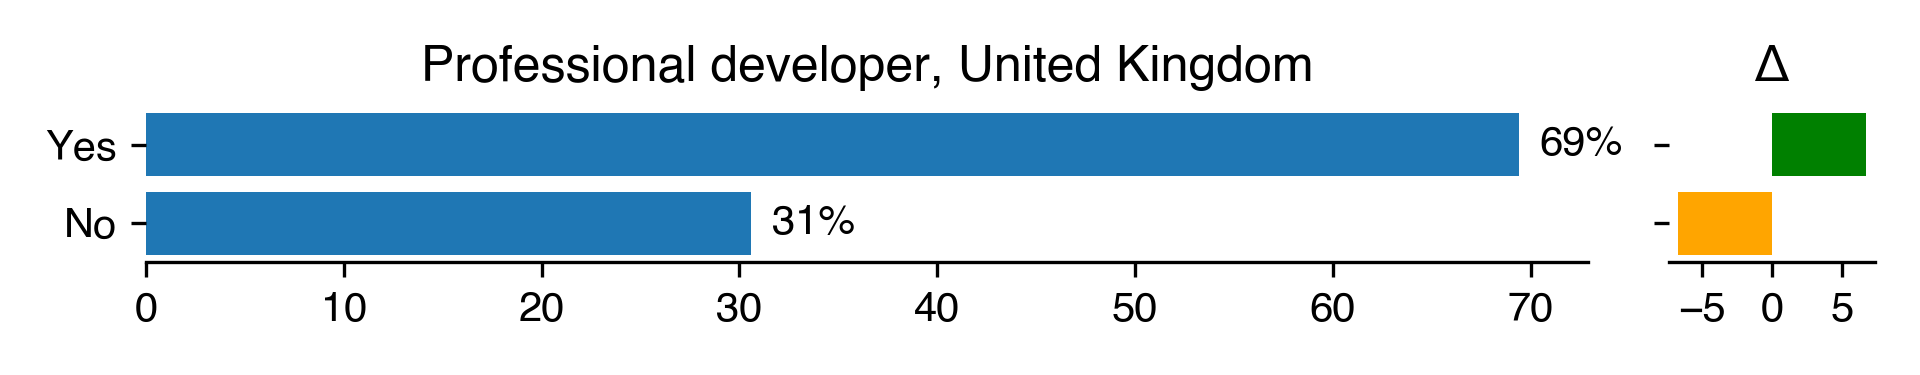
Professional developer for United Kingdom
Count
Percentage
Percentage in 2018
Difference with previous year
Yes
118
69.41
62.72
6.69
No
52
30.59
37.28
-6.69
Download CSV
2022-08-22T11:30:09.600028
image/svg+xml
Matplotlib v3.5.2, https://matplotlib.org/
PNG SVG
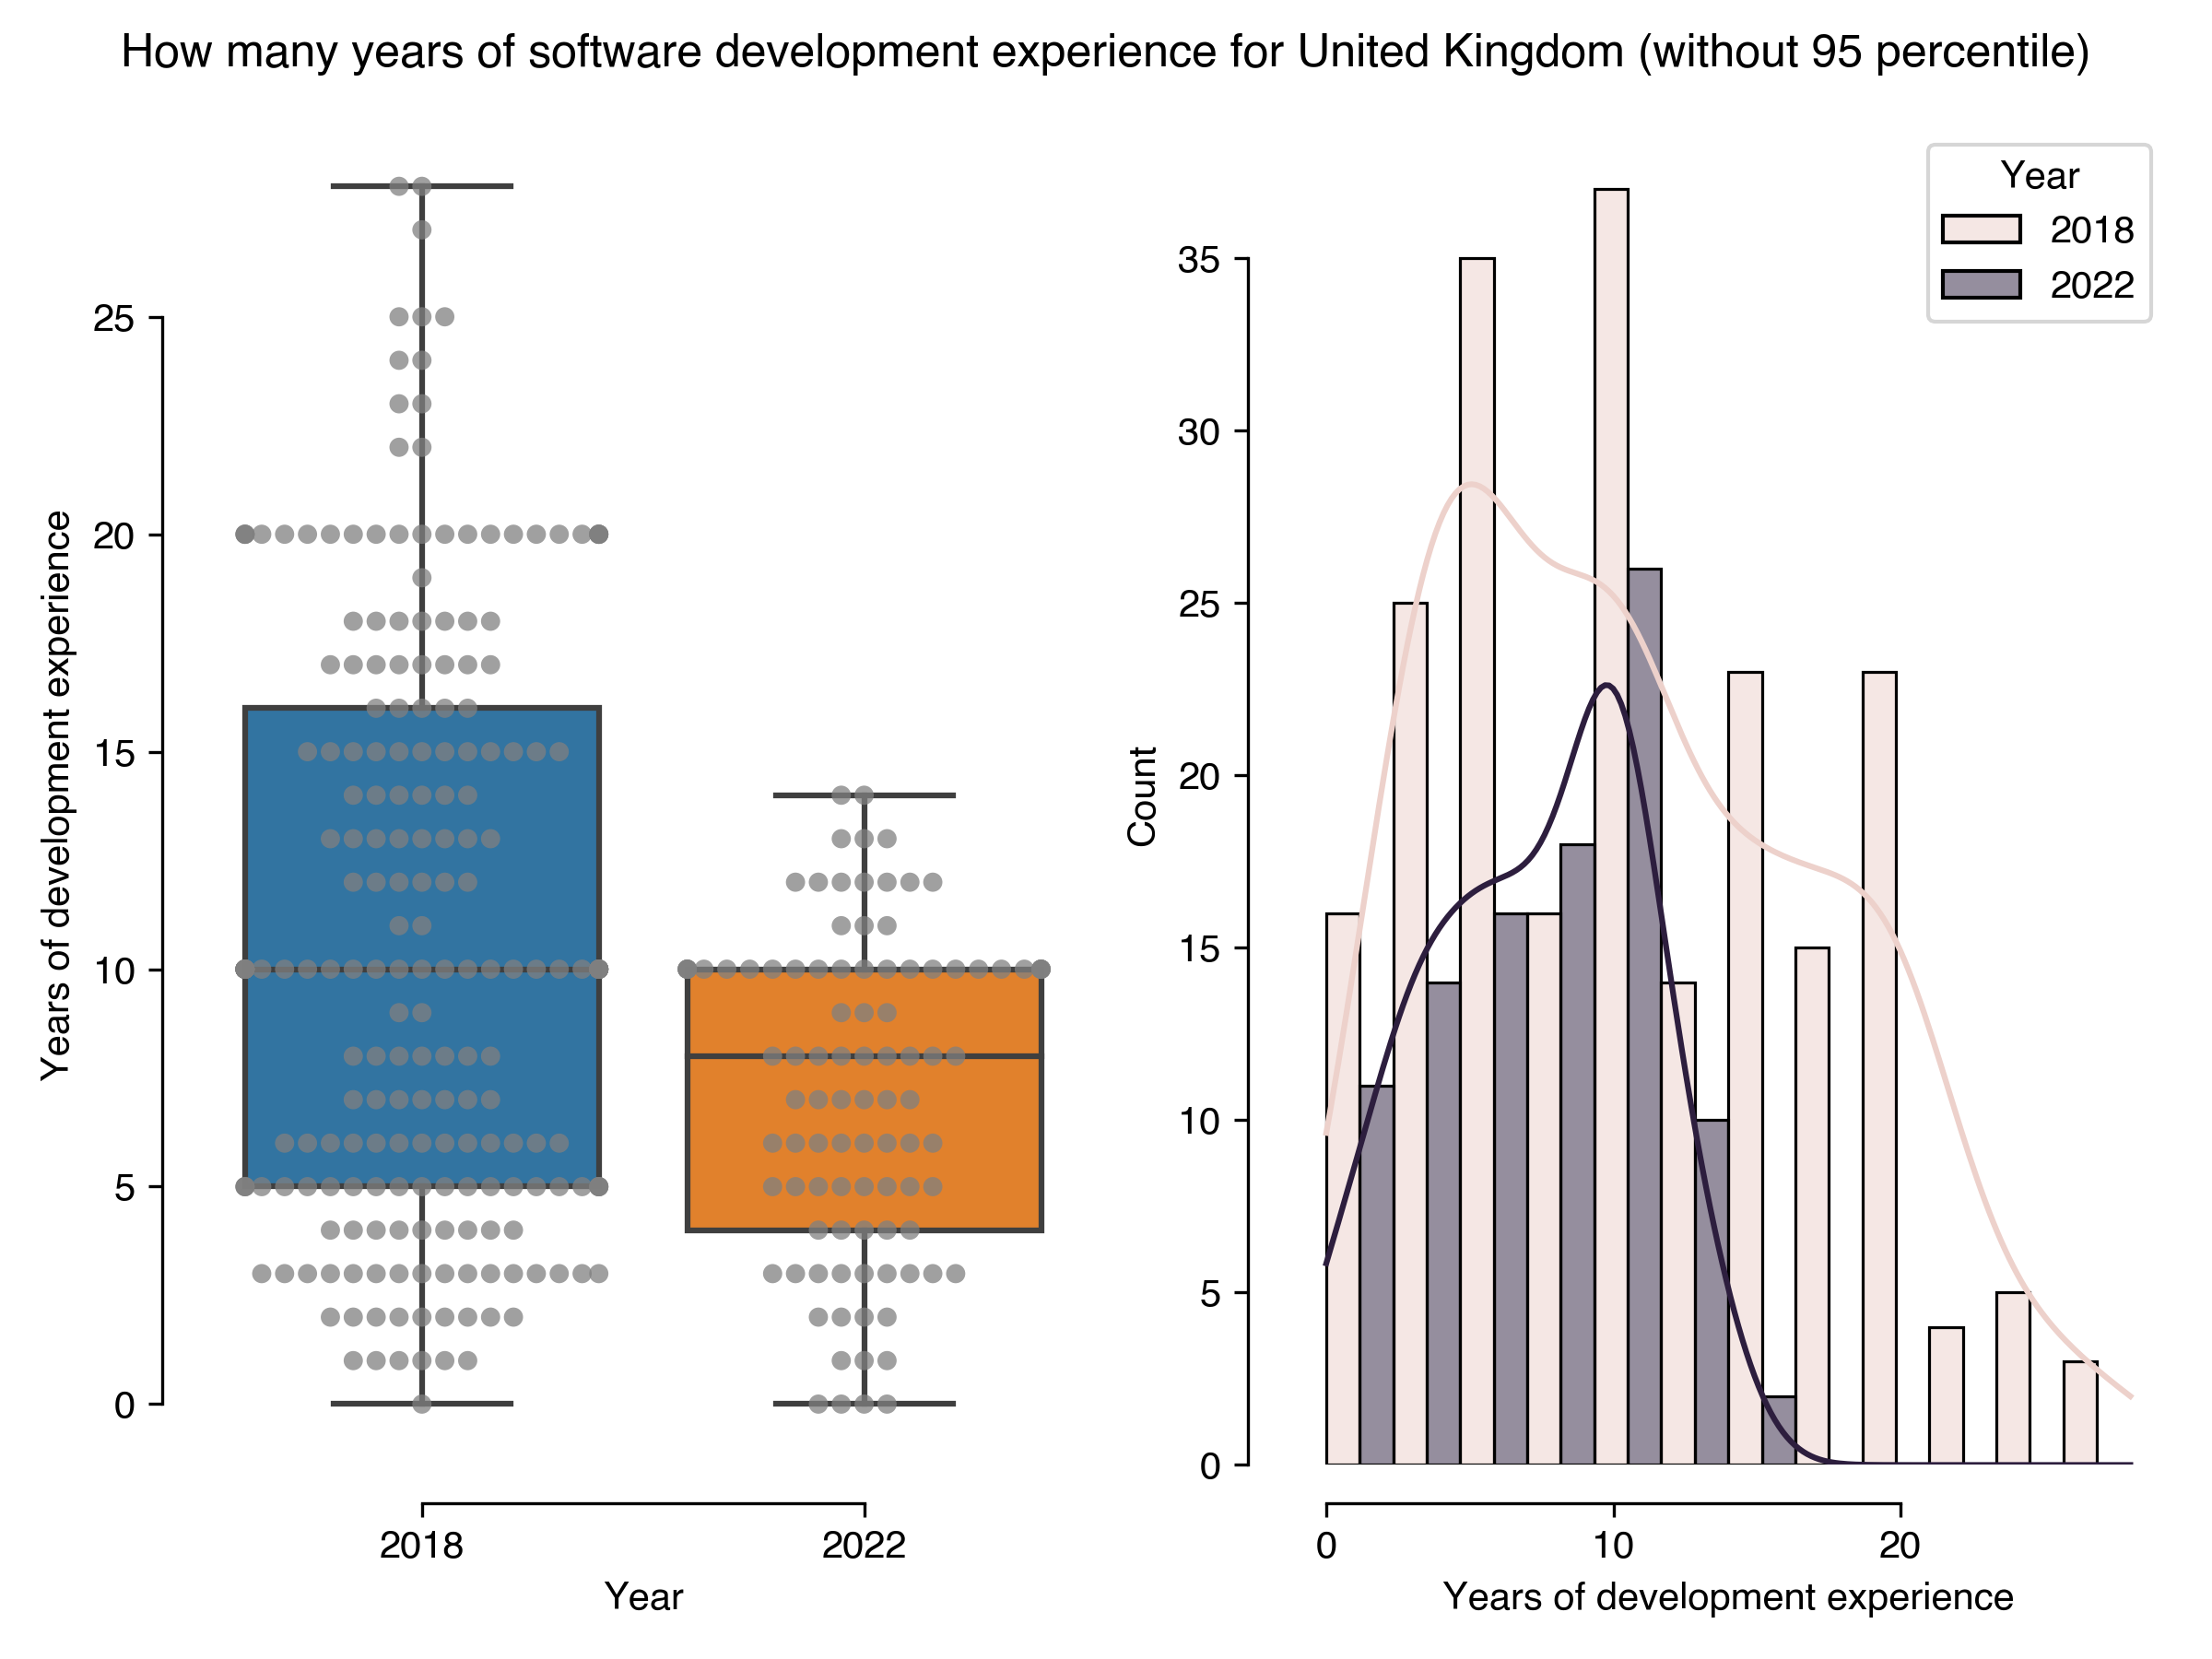
How many years of software development experience for United Kingdom (without 95 percentile)
Results in 2022
Results in 2018
count
97
216
mean
7.23
10.78
std
3.66
6.62
min
0
0
25%
4
5
50%
8
10
75%
10
16
max
14
28
Download CSV
2022-08-22T11:30:10.591486
image/svg+xml
Matplotlib v3.5.2, https://matplotlib.org/
PNG SVG
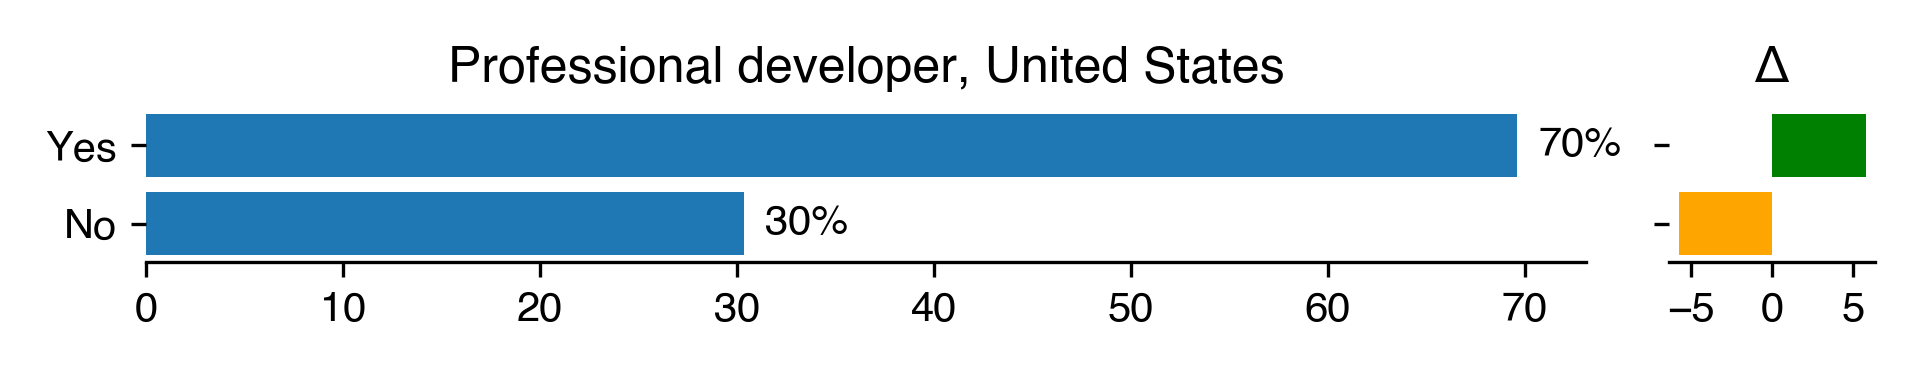
Professional developer for United States
Count
Percentage
Percentage in 2018
Difference with previous year
Yes
110
69.62
63.83
5.79
No
48
30.38
36.17
-5.79
Download CSV
2022-08-22T11:30:10.944608
image/svg+xml
Matplotlib v3.5.2, https://matplotlib.org/
PNG SVG
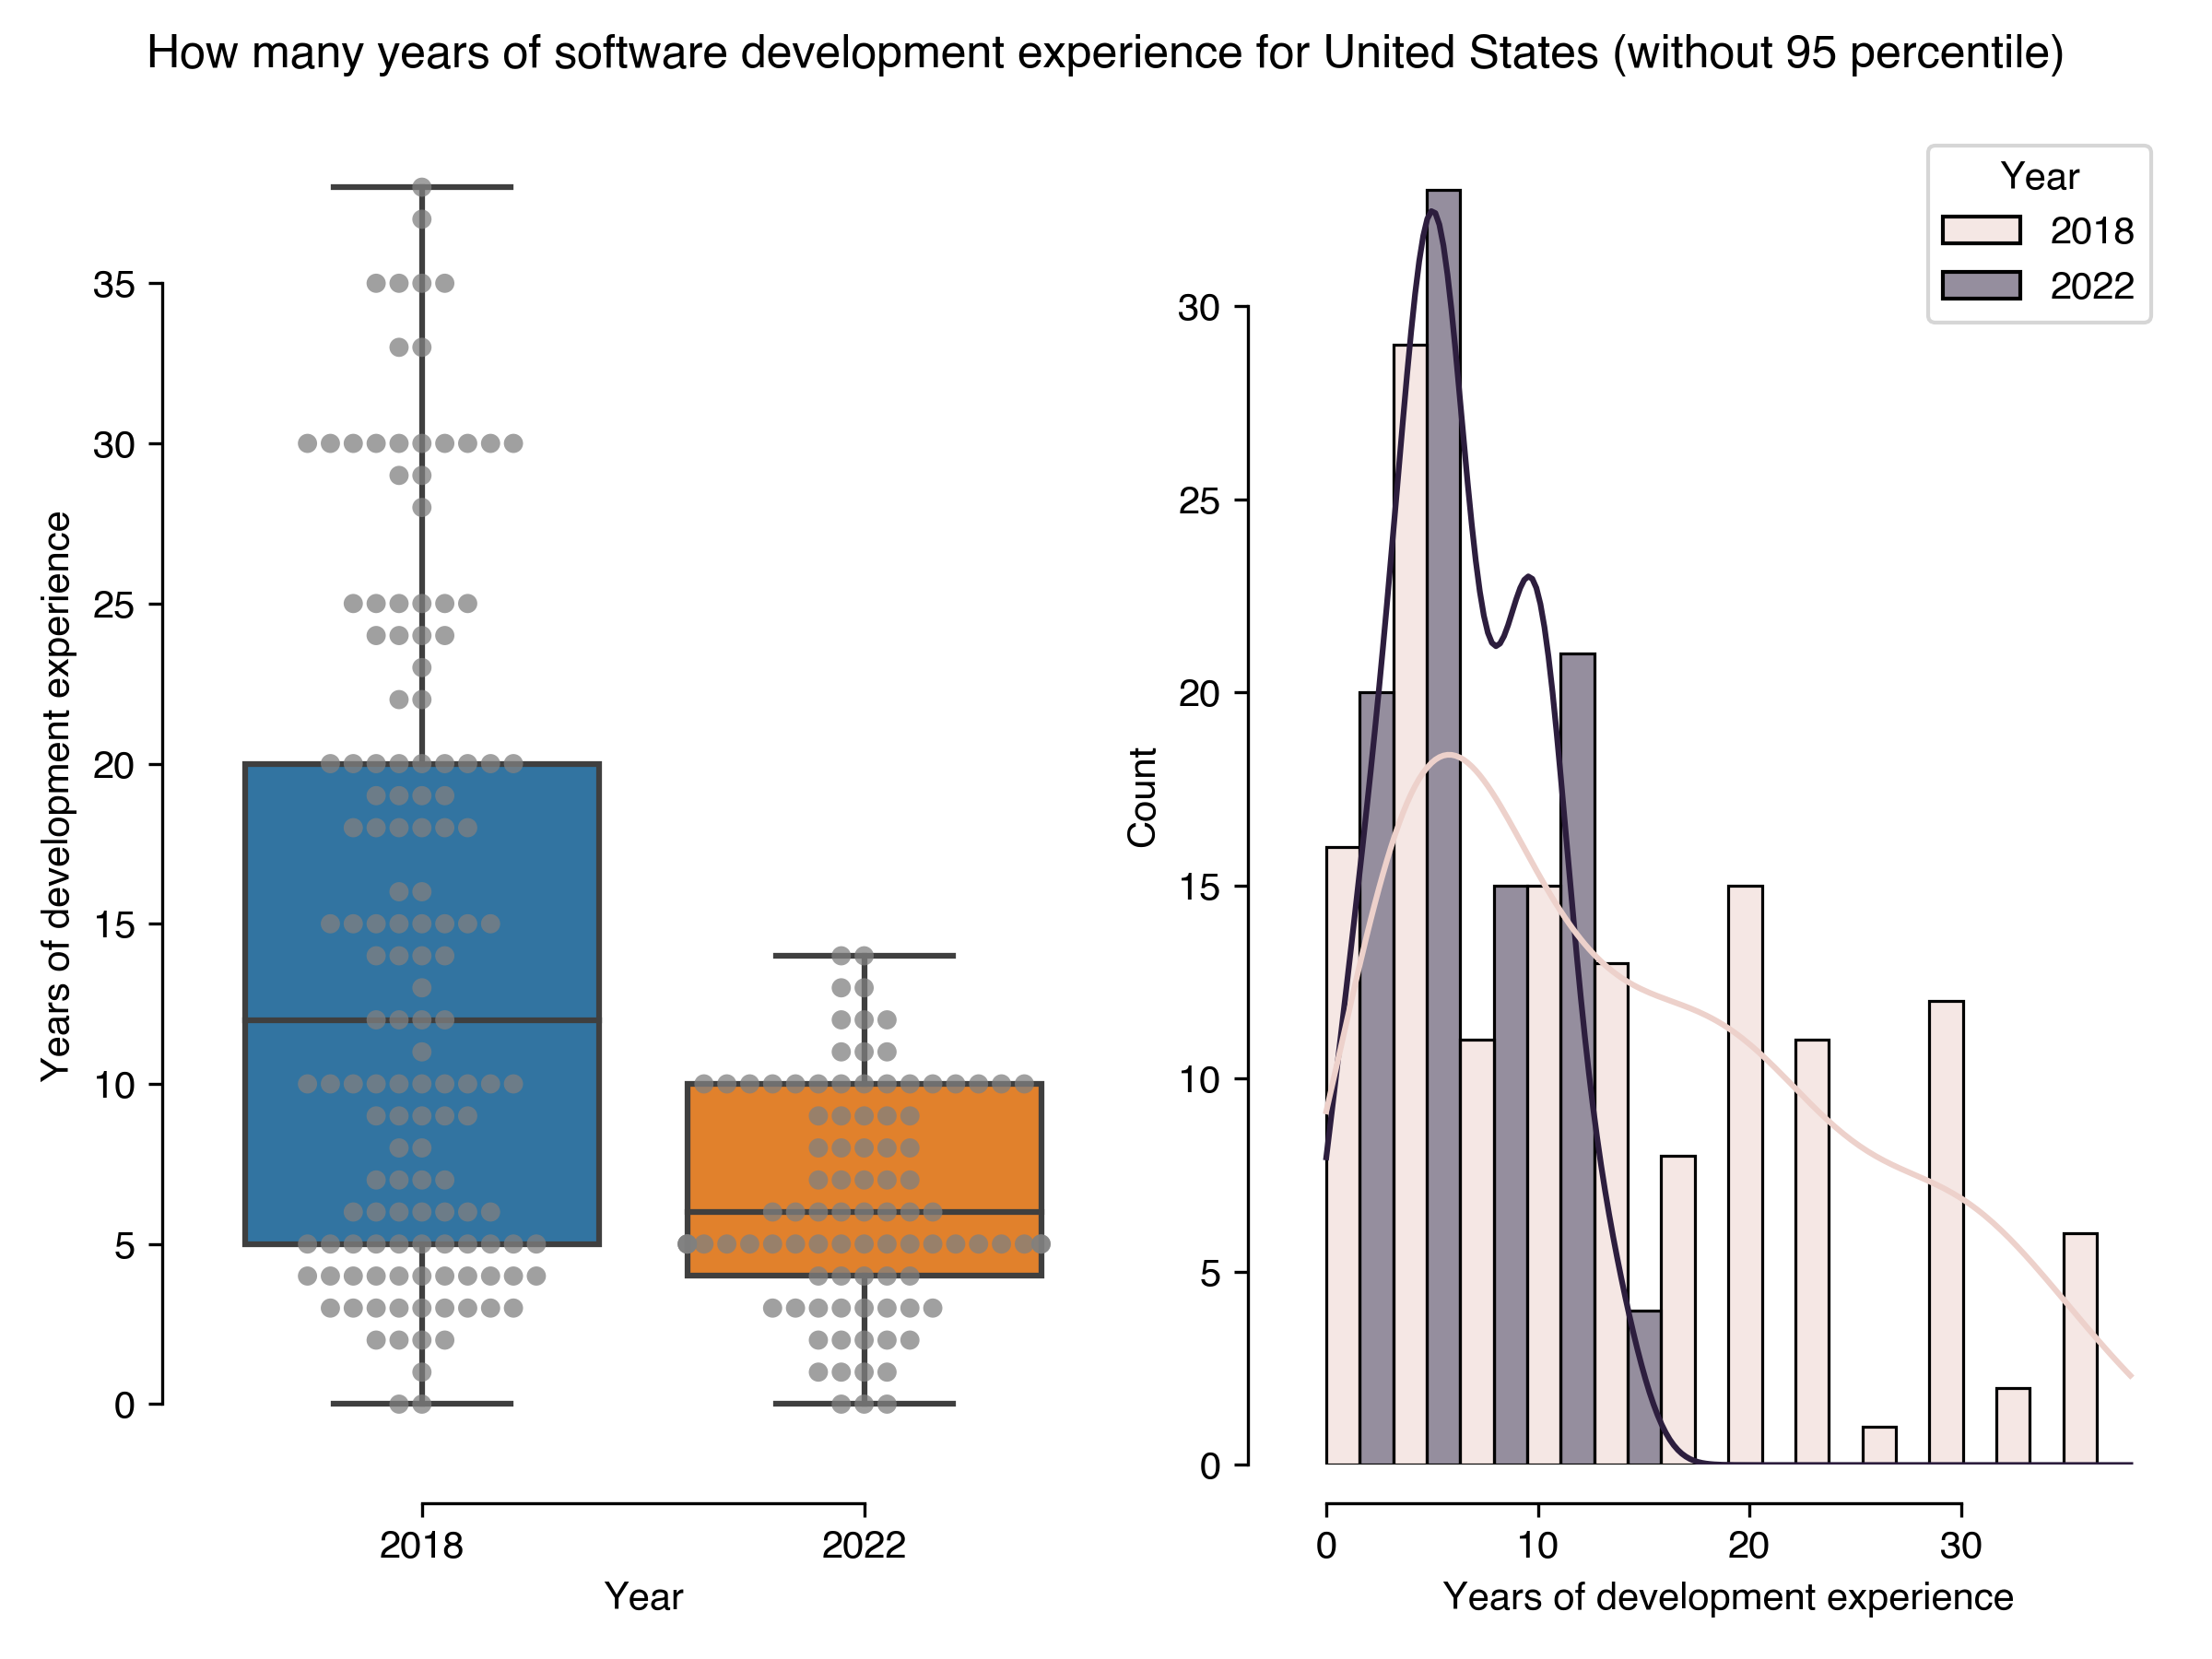
How many years of software development experience for United States (without 95 percentile)
Results in 2022
Results in 2018
count
93
139
mean
6.44
14.32
std
3.46
10.04
min
0
0
25%
4
5
50%
6
12
75%
10
20
max
14
38
Download CSV
2022-08-22T11:30:11.812417
image/svg+xml
Matplotlib v3.5.2, https://matplotlib.org/
PNG SVG
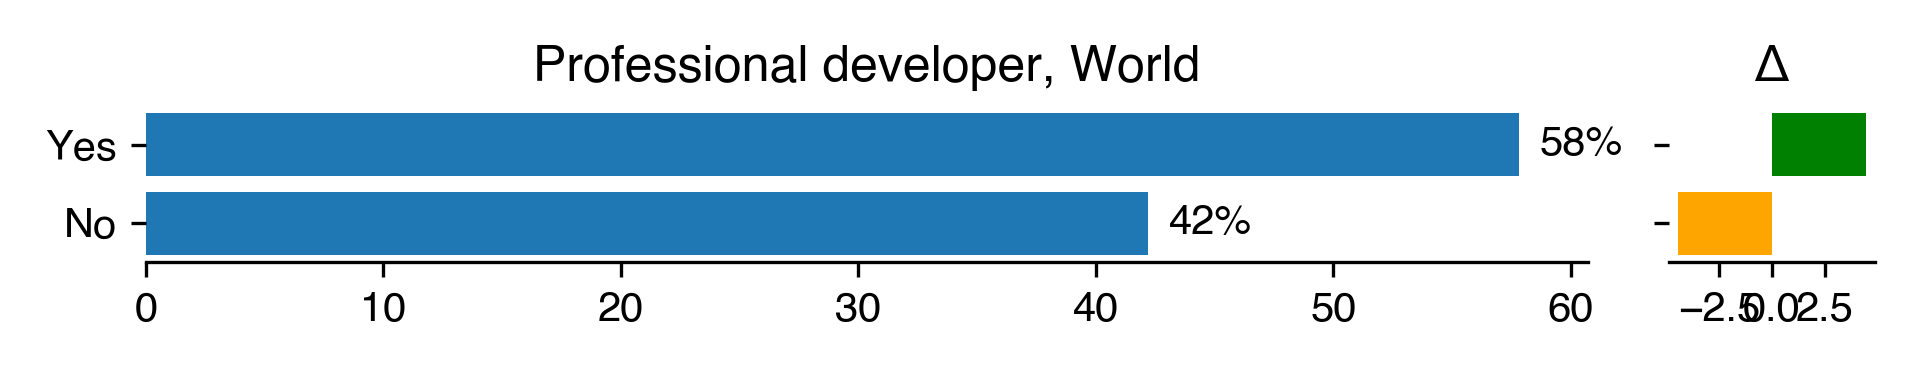
Professional developer for World
Count
Percentage
Percentage in 2018
Difference with previous year
Yes
555
57.81
53.37
4.44
No
405
42.19
46.63
-4.44
Download CSV
2022-08-22T11:30:12.172677
image/svg+xml
Matplotlib v3.5.2, https://matplotlib.org/
PNG SVG
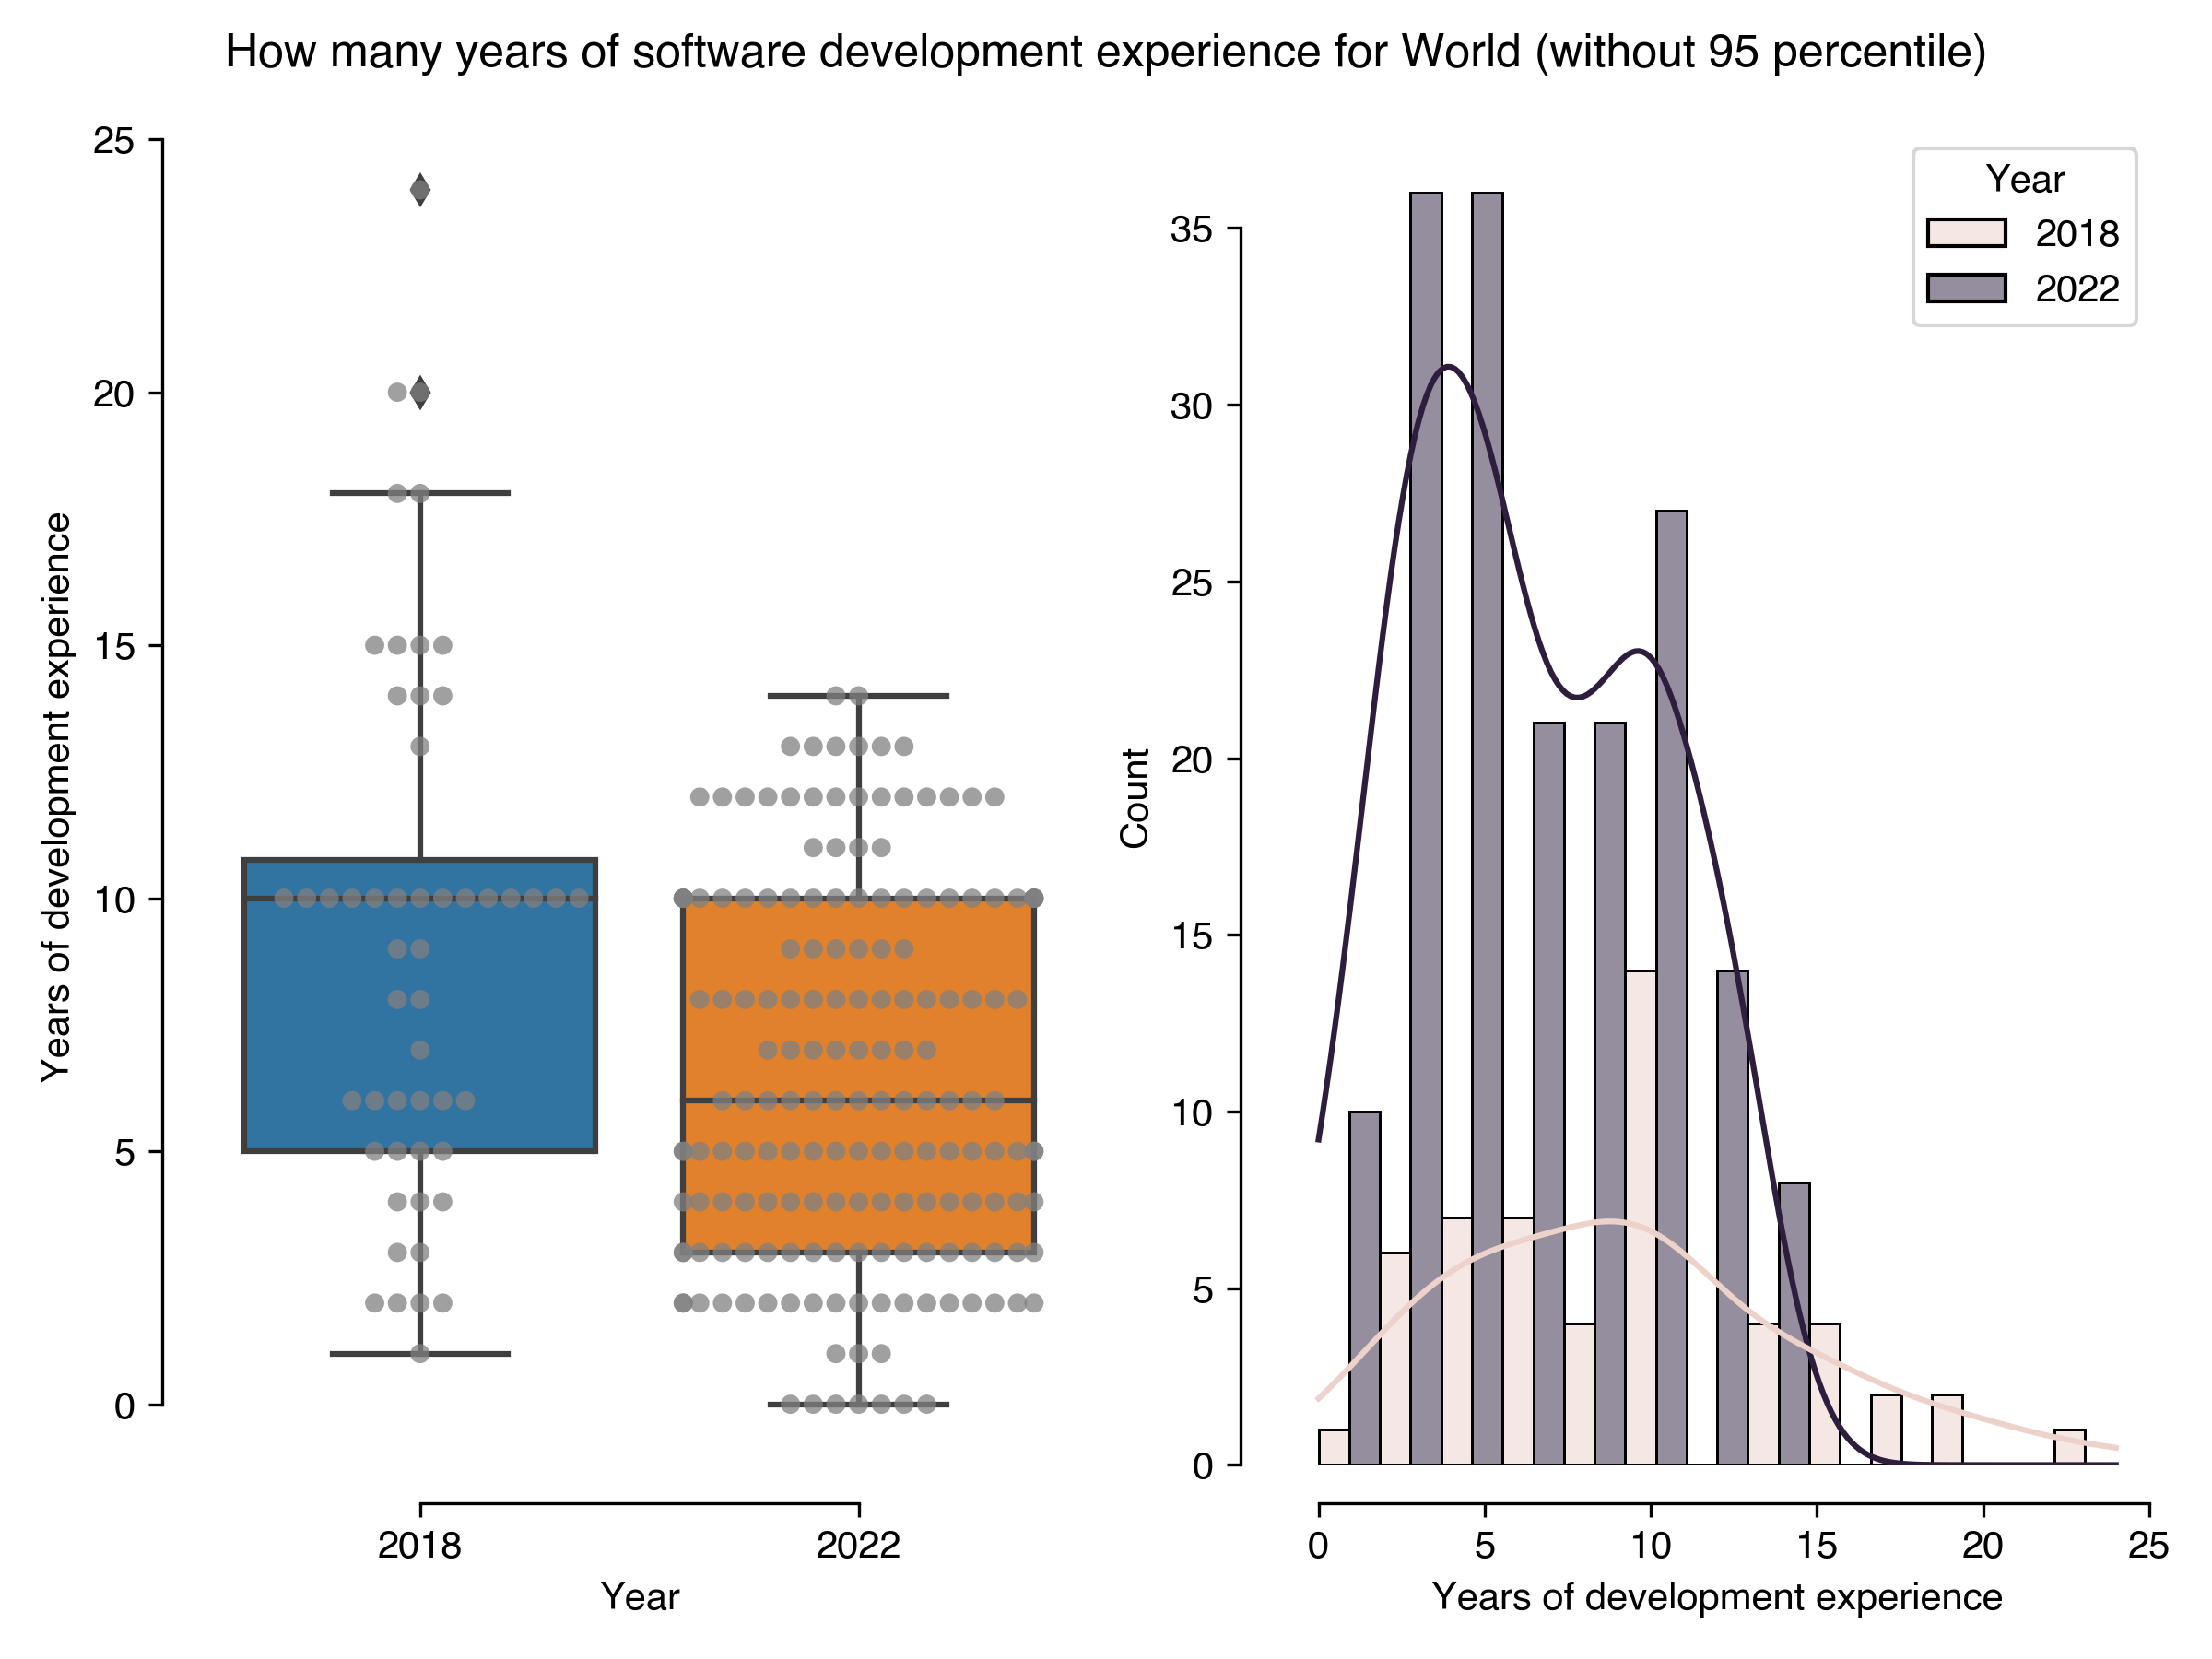
How many years of software development experience for World (without 95 percentile)
Results in 2022
Results in 2018
count
173
52
mean
6.43
9.21
std
3.7
5.25
min
0
1
25%
3
5
50%
6
10
75%
10
10.75
max
14
24
Download CSV
2022-08-22T11:30:13.051371
image/svg+xml
Matplotlib v3.5.2, https://matplotlib.org/
PNG SVG