Current employment
Questions in the sections:
- Please select your organization type (one choice)
- Please select the discipline in which you work. Please select all that apply. (multiple choice)
- Which university do you work for? (one choice)
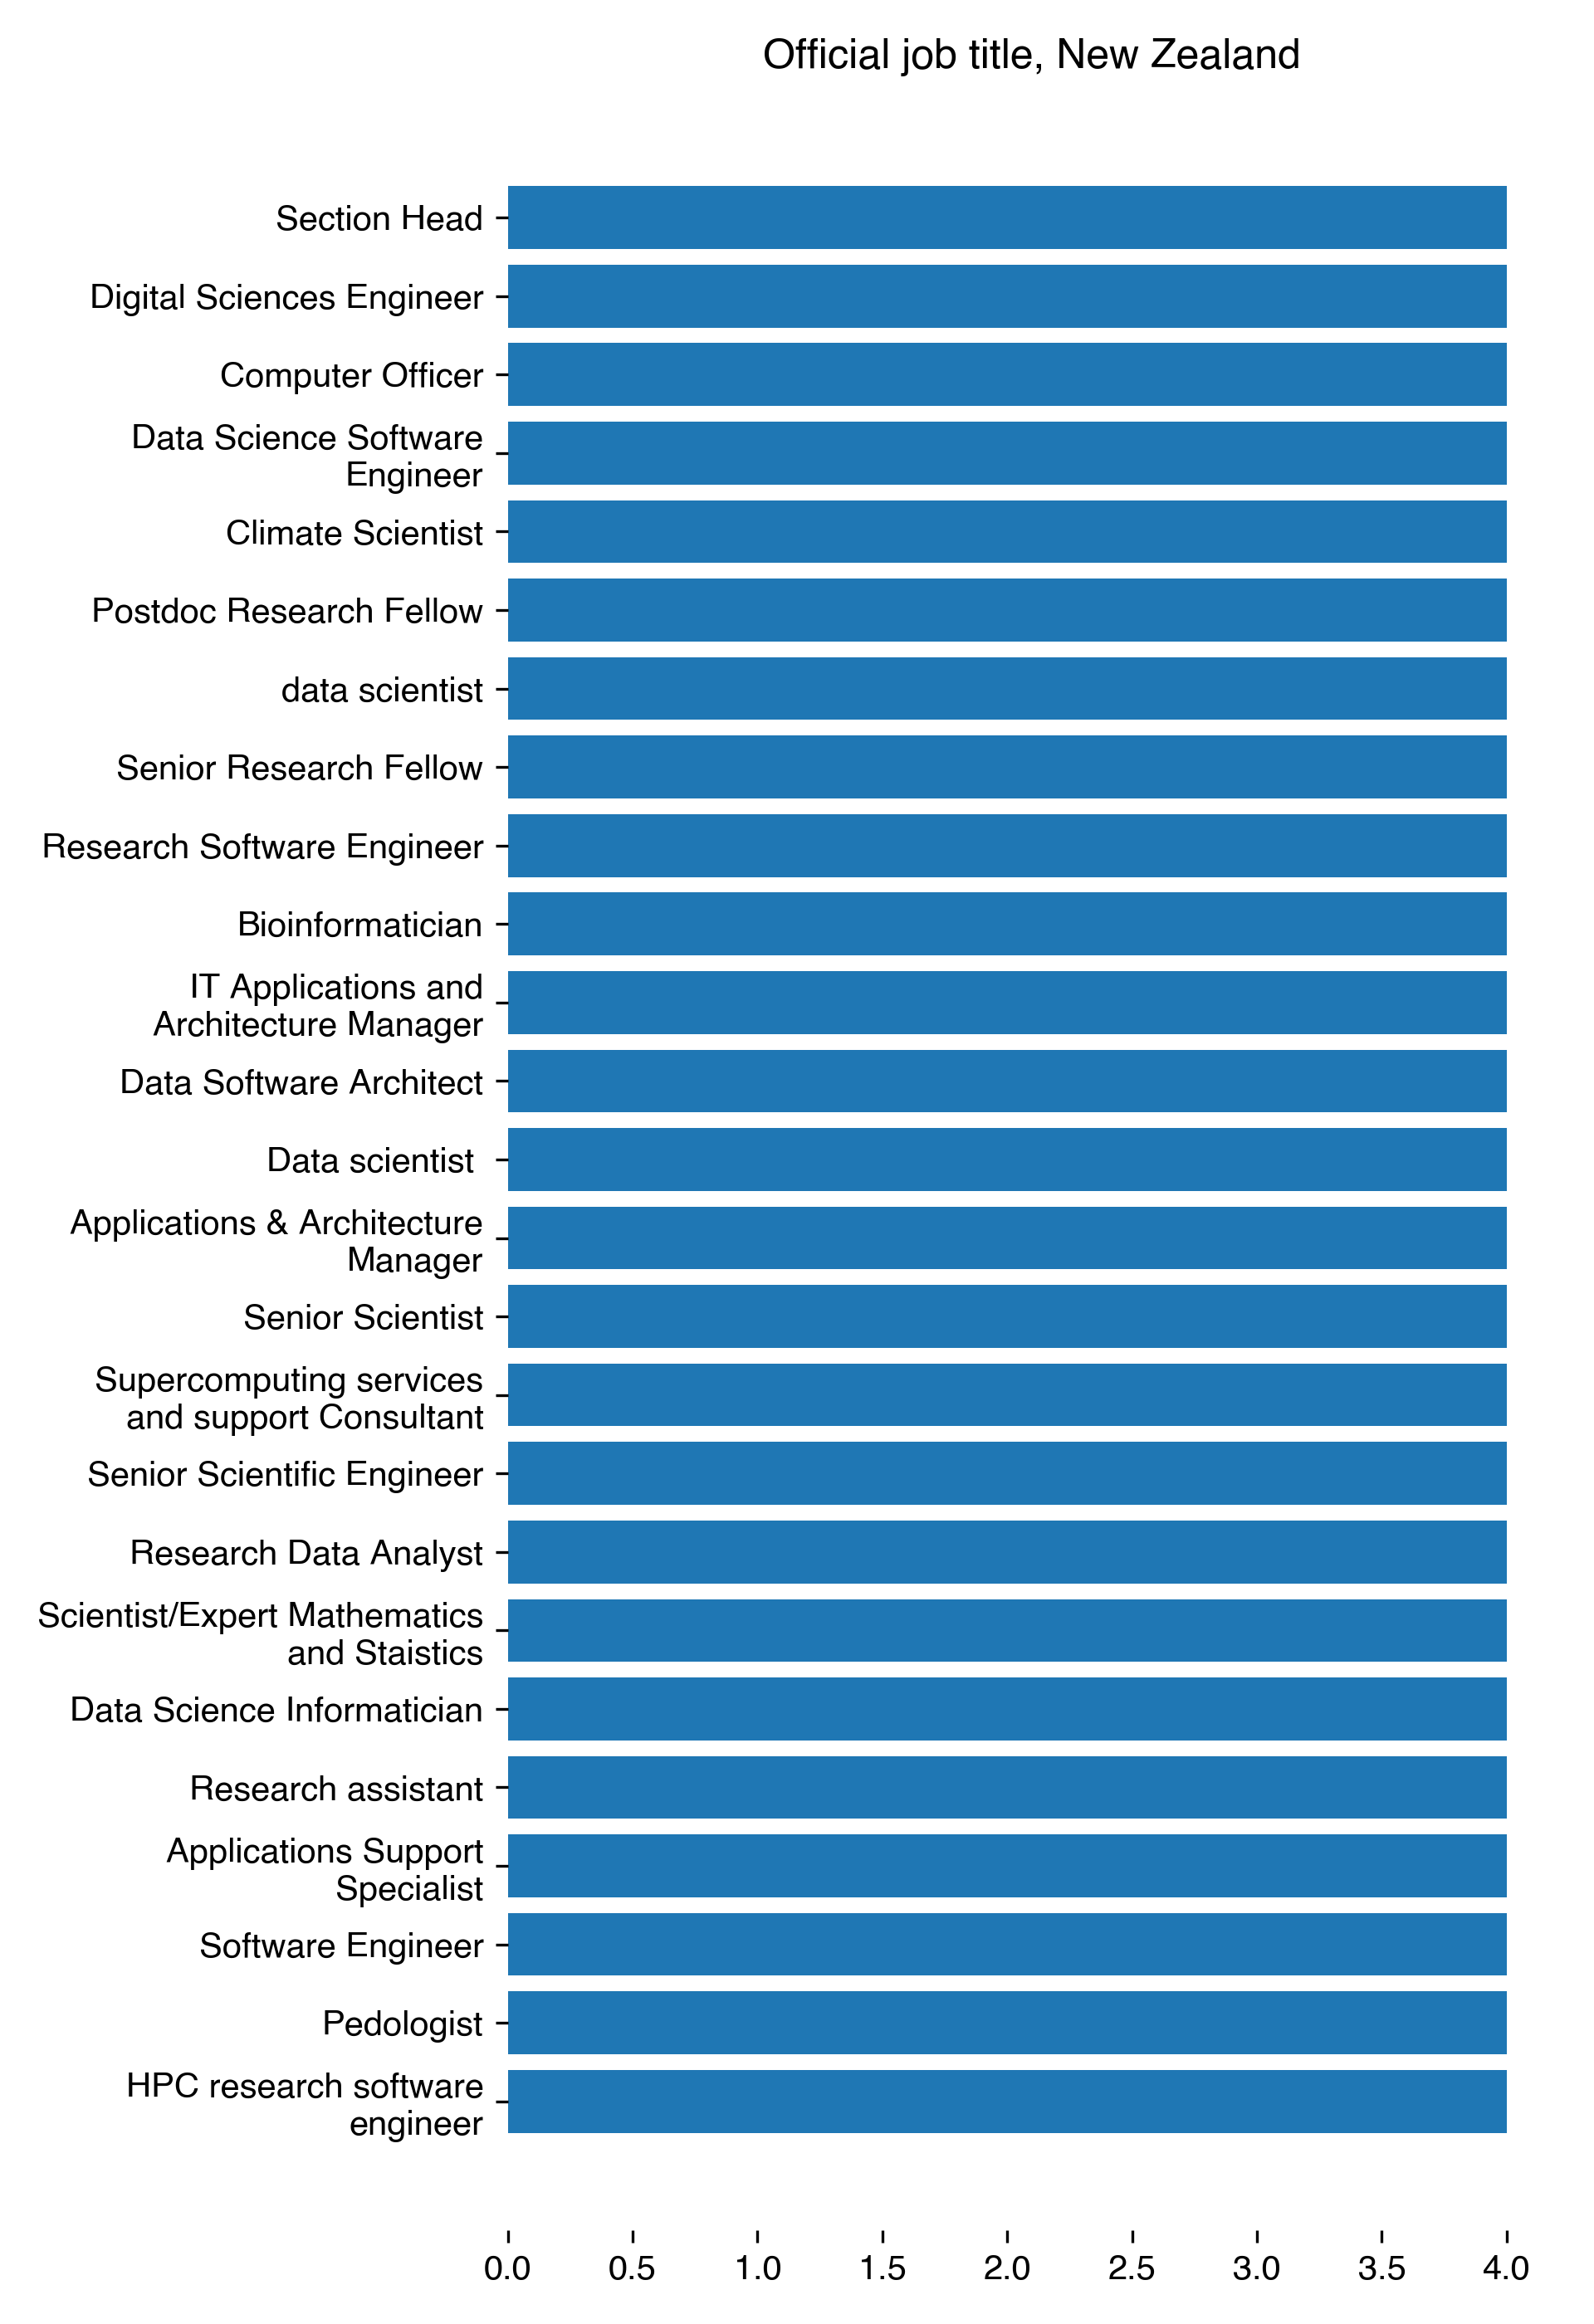
- What is your official job title? (free text)
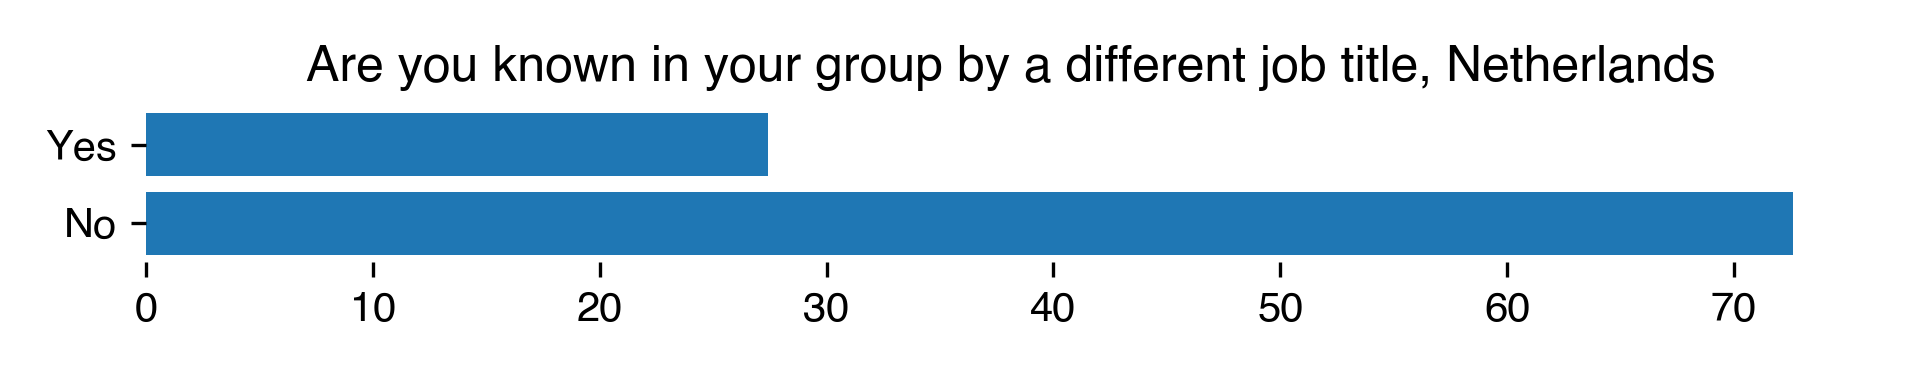
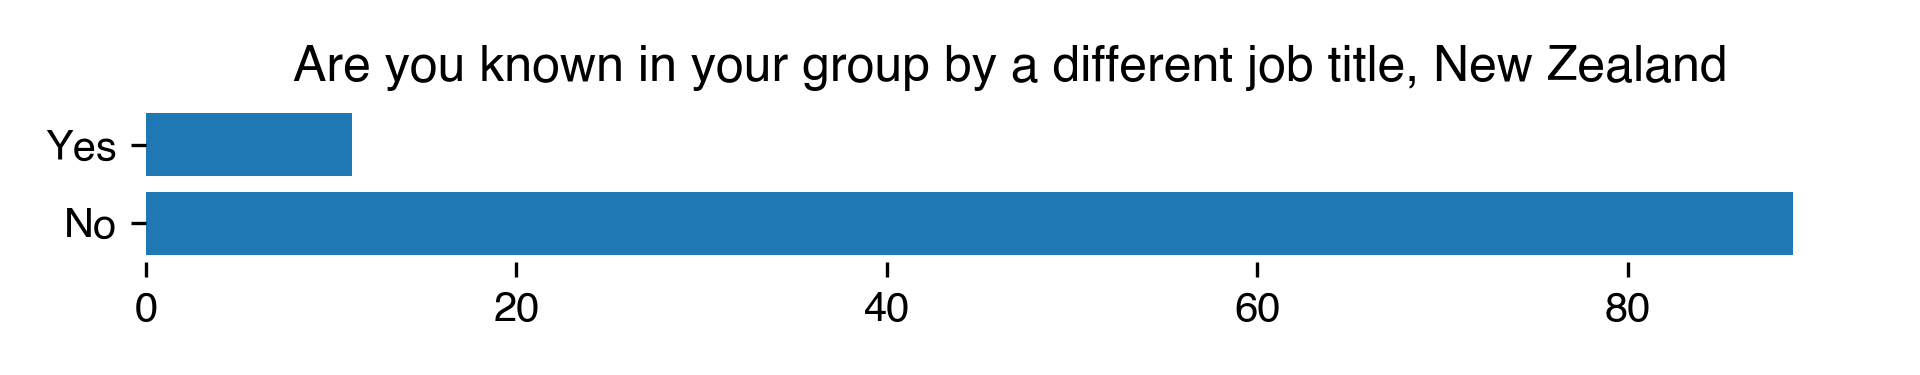
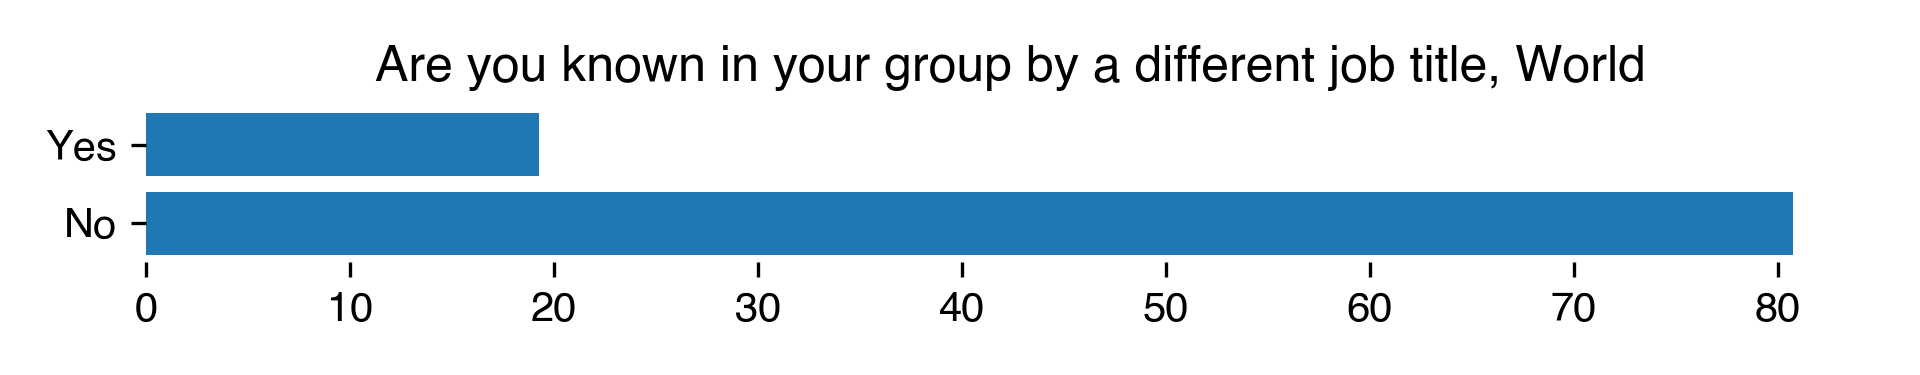
- Are you known in your group by a different job title? If so, please enter the job title you use (free text)
- Do you work full time or part time (free text)
- What is the nature of your current employment? (one choice)
- When did you start your current position? (numeric)
- What is the expected duration (in years) of your current position (in total)? (numeric)
- Please select the range of your (gross) salary (one choice)
- Which of the following sources are used to pay for your effort as a Research Software Engineer? (multiple choice)
Australia
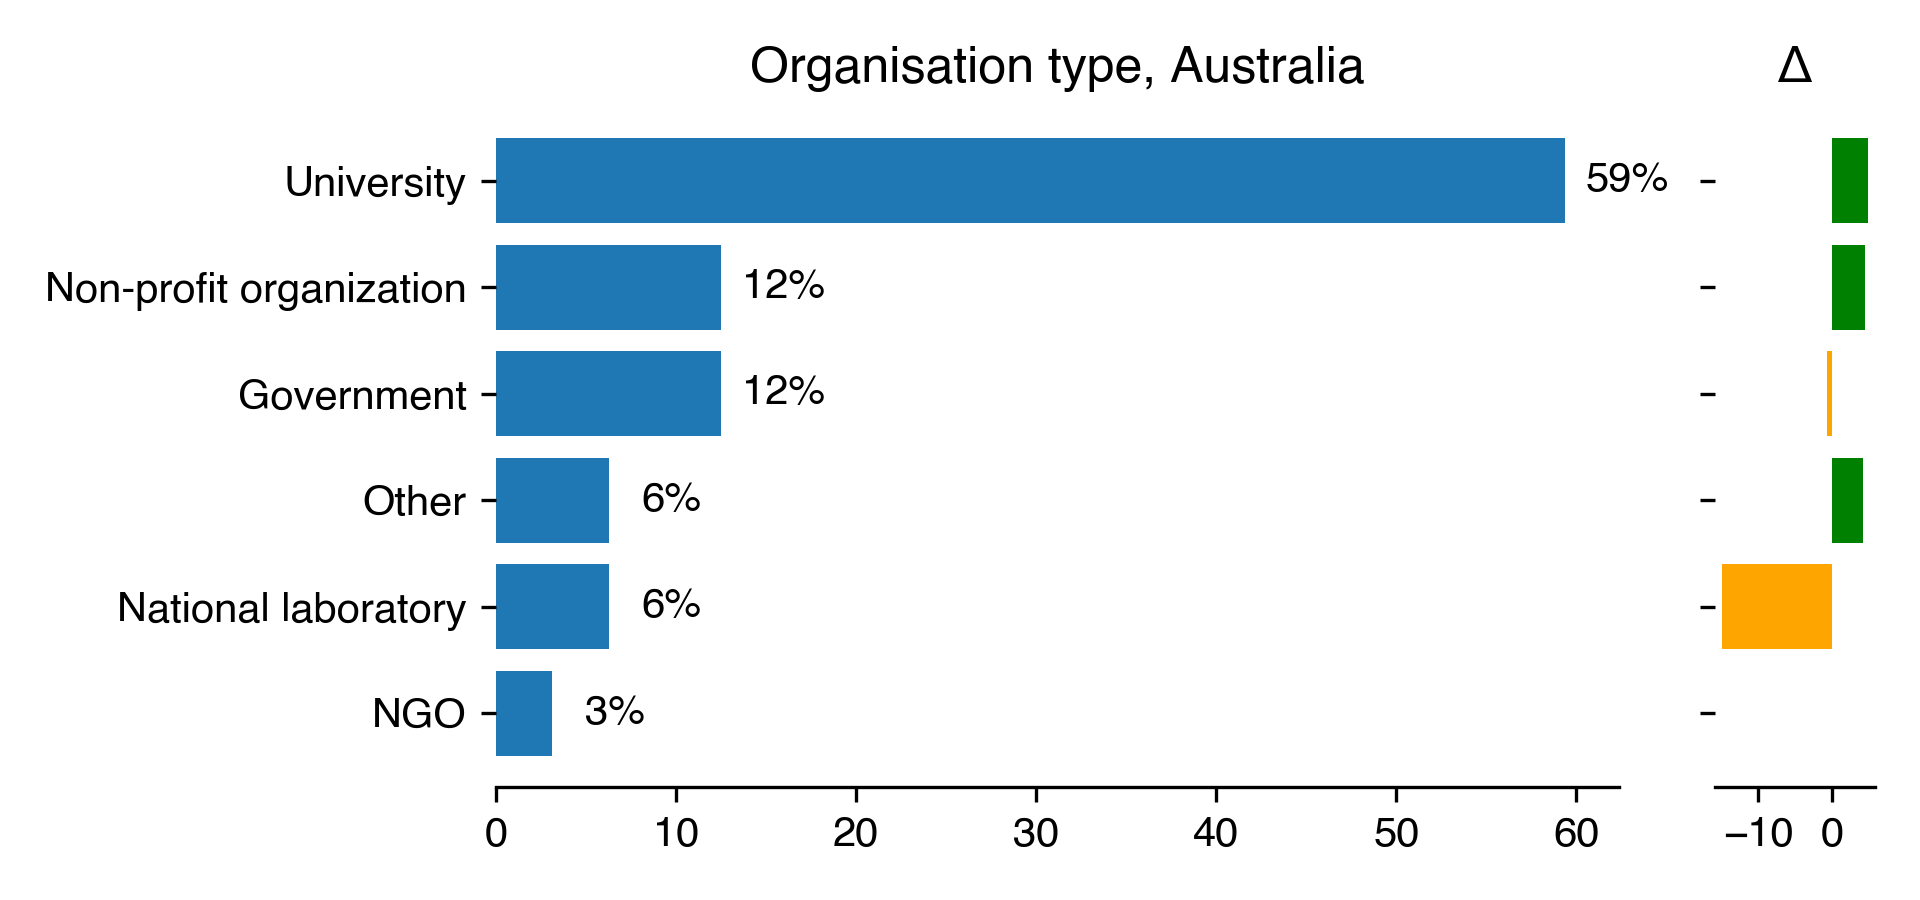
Type of organization
| Organisation type for Australia | Count | Percentage | Percentage in 2018 | Difference with previous year |
|---|---|---|---|---|
| University | 19 | 59.38 | 54.55 | 4.83 |
| Non-profit organization | 4 | 12.5 | 8.08 | 4.42 |
| Government | 4 | 12.5 | 13.13 | -0.63 |
| Other | 2 | 6.25 | 2.02 | 4.23 |
| National laboratory | 2 | 6.25 | 21.21 | -14.96 |
| NGO | 1 | 3.12 | nan | nan |
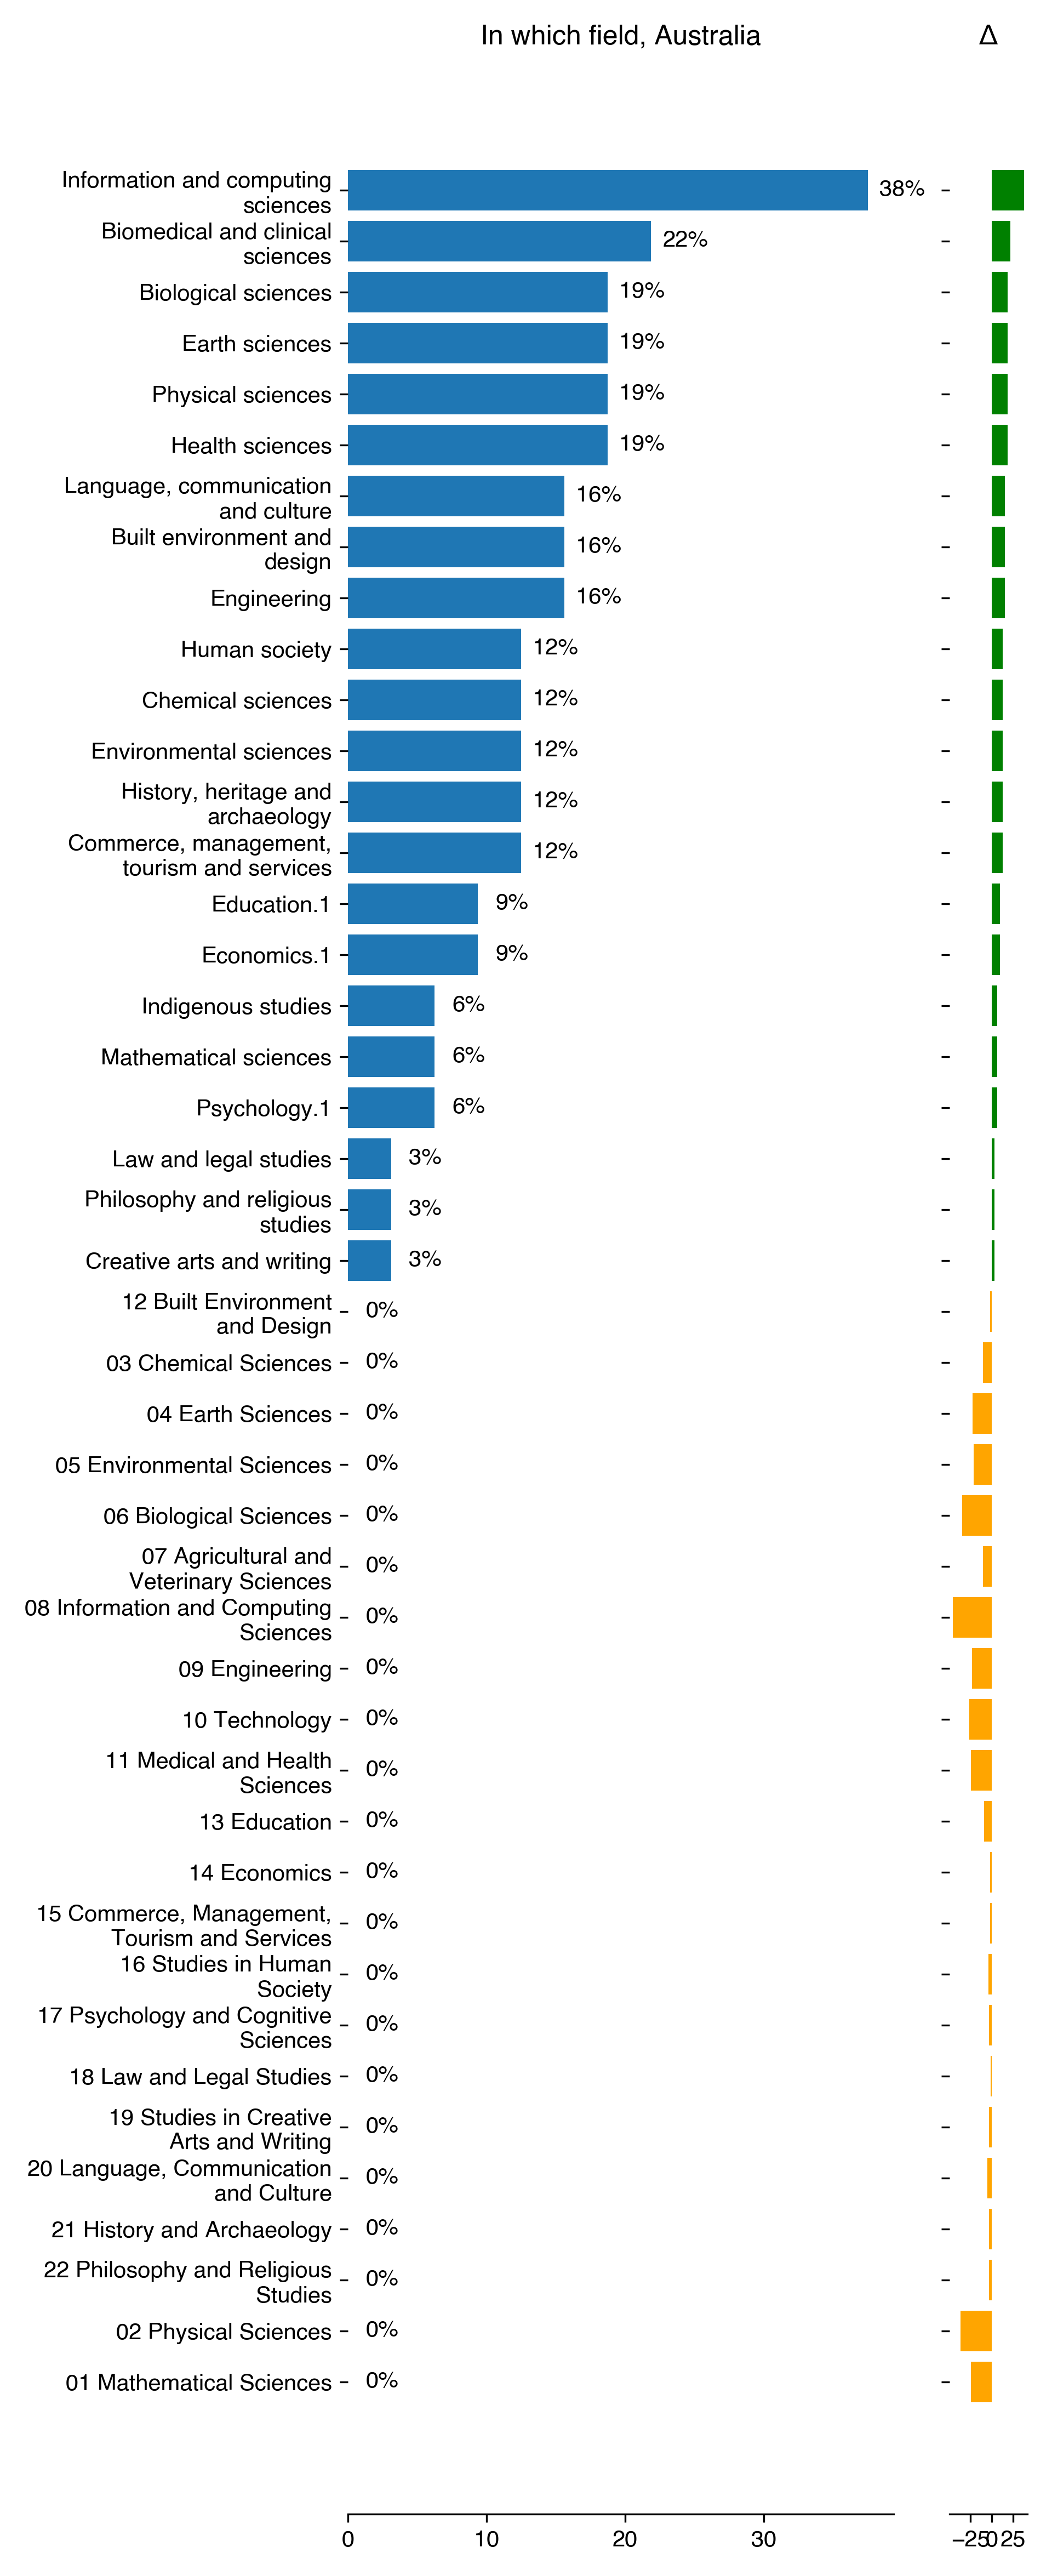
In which field are you working
| In which field for Australia | Count | Percentage | Percentage in 2018 | Difference with previous year |
|---|---|---|---|---|
| Information and computing sciences | 12 | 37.5 | 0 | 37.5 |
| Biomedical and clinical sciences | 7 | 21.88 | 0 | 21.88 |
| Biological sciences | 6 | 18.75 | 0 | 18.75 |
| Earth sciences | 6 | 18.75 | 0 | 18.75 |
| Physical sciences | 6 | 18.75 | 0 | 18.75 |
| Health sciences | 6 | 18.75 | 0 | 18.75 |
| Language, communication and culture | 5 | 15.62 | 0 | 15.62 |
| Built environment and design | 5 | 15.62 | 0 | 15.62 |
| Engineering | 5 | 15.62 | 0 | 15.62 |
| Human society | 4 | 12.5 | 0 | 12.5 |
| Chemical sciences | 4 | 12.5 | 0 | 12.5 |
| Environmental sciences | 4 | 12.5 | 0 | 12.5 |
| History, heritage and archaeology | 4 | 12.5 | 0 | 12.5 |
| Commerce, management, tourism and services | 4 | 12.5 | 0 | 12.5 |
| Education.1 | 3 | 9.38 | 0 | 9.38 |
| Economics.1 | 3 | 9.38 | 0 | 9.38 |
| Indigenous studies | 2 | 6.25 | 0 | 6.25 |
| Mathematical sciences | 2 | 6.25 | 0 | 6.25 |
| Psychology.1 | 2 | 6.25 | 0 | 6.25 |
| Law and legal studies | 1 | 3.12 | 0 | 3.12 |
| Philosophy and religious studies | 1 | 3.12 | 0 | 3.12 |
| Creative arts and writing | 1 | 3.12 | 0 | 3.12 |
| 12 Built Environment and Design | 0 | 0 | 2.02 | -2.02 |
| 03 Chemical Sciences | 0 | 0 | 10.1 | -10.1 |
| 04 Earth Sciences | 0 | 0 | 22.22 | -22.22 |
| 05 Environmental Sciences | 0 | 0 | 21.21 | -21.21 |
| 06 Biological Sciences | 0 | 0 | 34.34 | -34.34 |
| 07 Agricultural and Veterinary Sciences | 0 | 0 | 10.1 | -10.1 |
| 08 Information and Computing Sciences | 0 | 0 | 45.45 | -45.45 |
| 09 Engineering | 0 | 0 | 23.23 | -23.23 |
| 10 Technology | 0 | 0 | 26.26 | -26.26 |
| 11 Medical and Health Sciences | 0 | 0 | 24.24 | -24.24 |
| 13 Education | 0 | 0 | 9.09 | -9.09 |
| 14 Economics | 0 | 0 | 2.02 | -2.02 |
| 15 Commerce, Management, Tourism and Services | 0 | 0 | 2.02 | -2.02 |
| 16 Studies in Human Society | 0 | 0 | 4.04 | -4.04 |
| 17 Psychology and Cognitive Sciences | 0 | 0 | 3.03 | -3.03 |
| 18 Law and Legal Studies | 0 | 0 | 1.01 | -1.01 |
| 19 Studies in Creative Arts and Writing | 0 | 0 | 3.03 | -3.03 |
| 20 Language, Communication and Culture | 0 | 0 | 5.05 | -5.05 |
| 21 History and Archaeology | 0 | 0 | 3.03 | -3.03 |
| 22 Philosophy and Religious Studies | 0 | 0 | 3.03 | -3.03 |
| 02 Physical Sciences | 0 | 0 | 36.36 | -36.36 |
| 01 Mathematical Sciences | 0 | 0 | 24.24 | -24.24 |
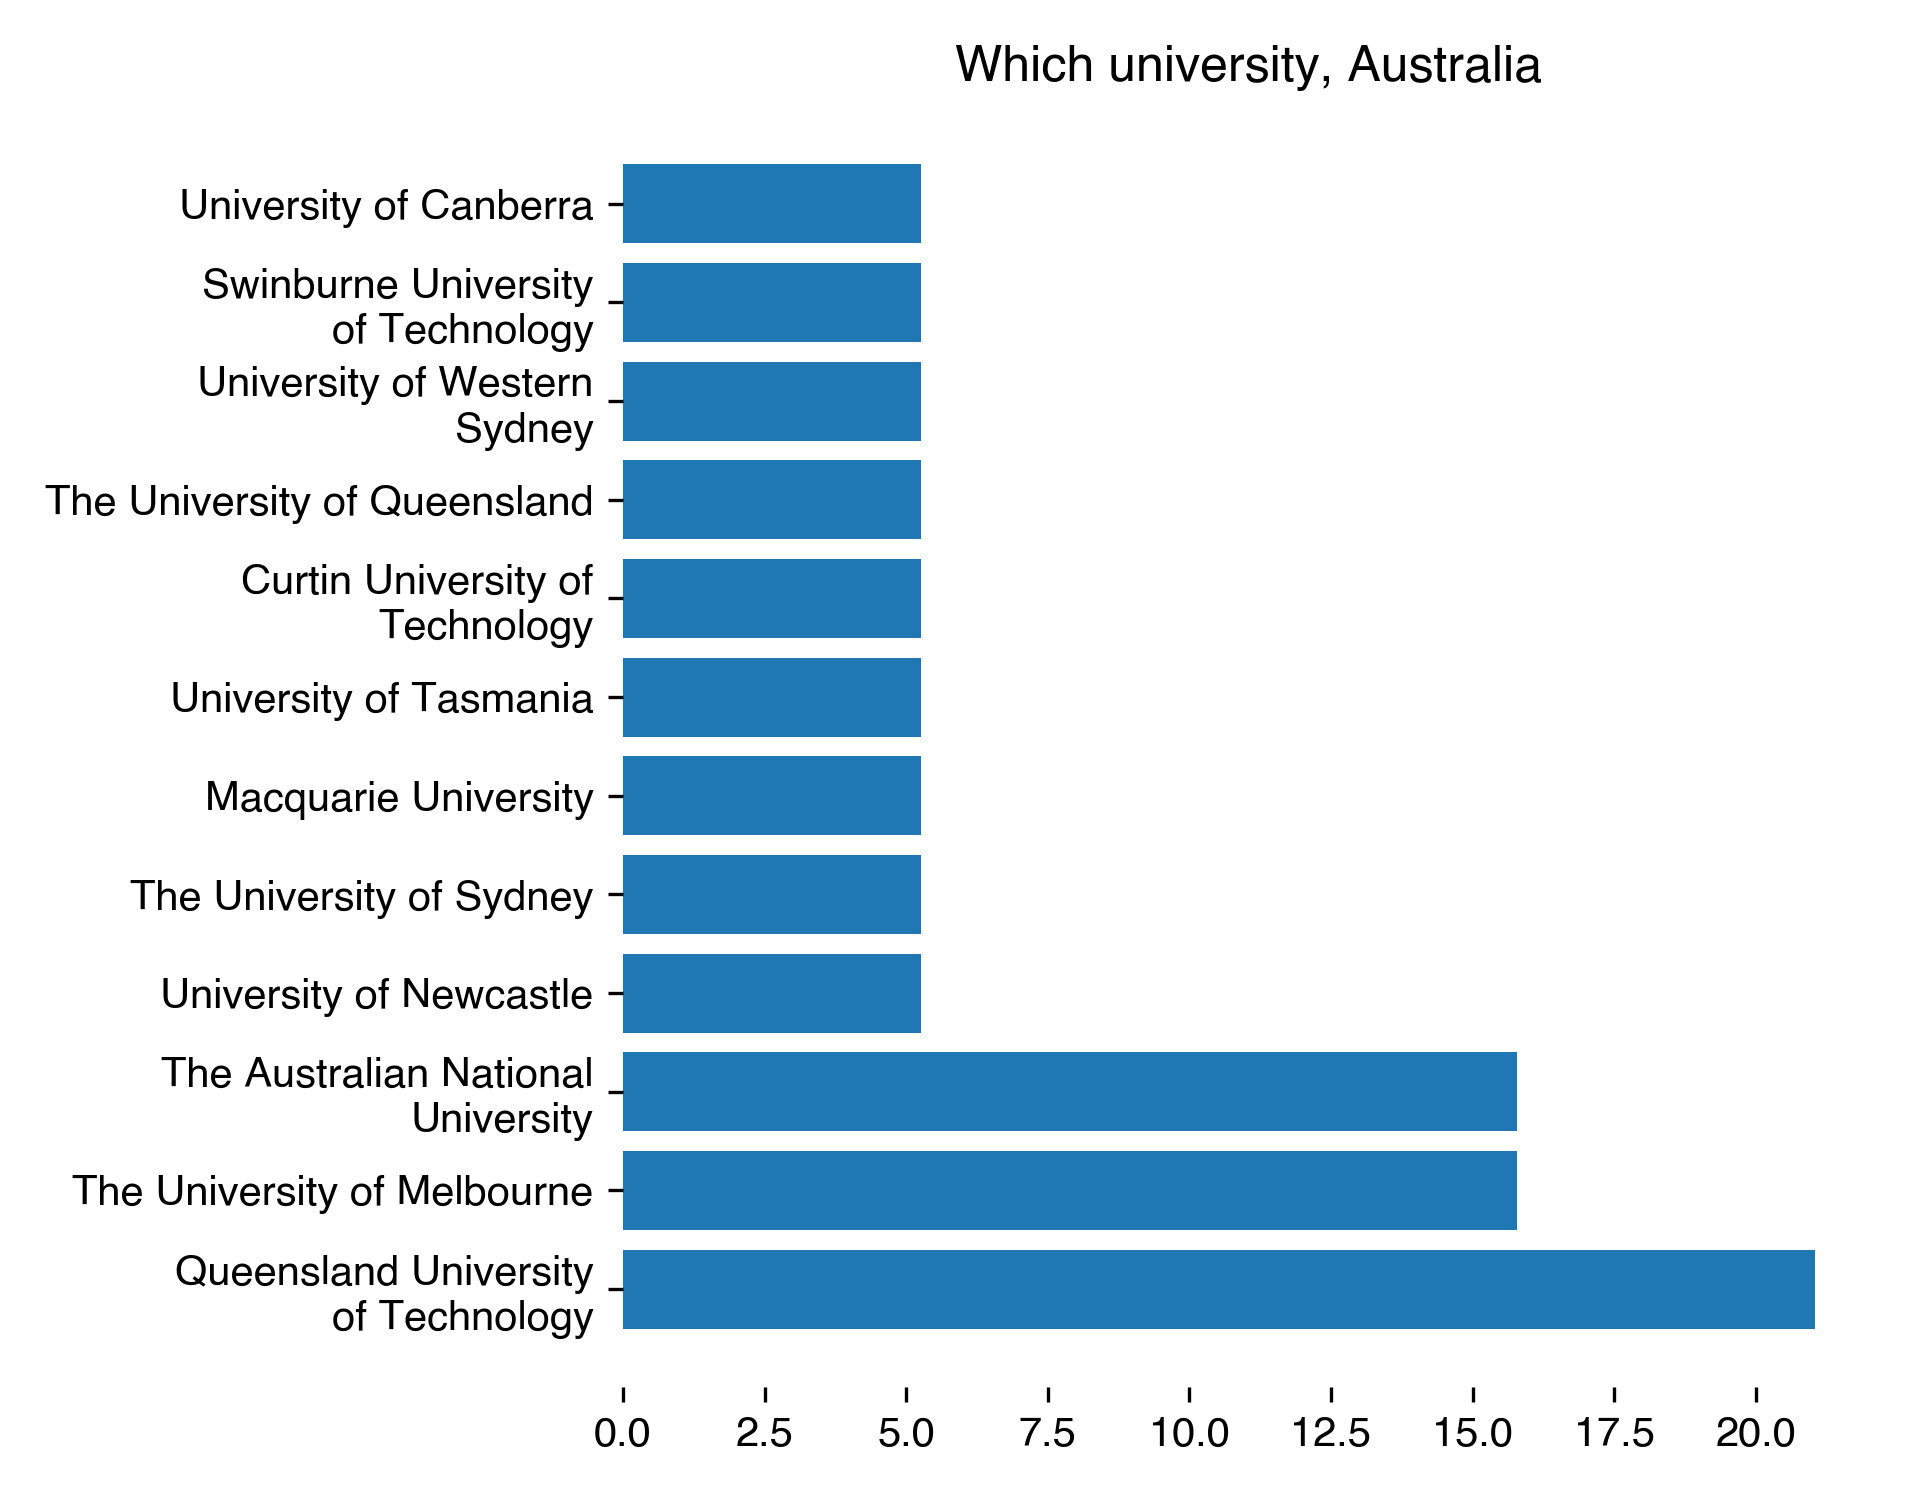
Which university or organization
| Which university for Australia | Count | Percentage |
|---|---|---|
| Queensland University of Technology | 4 | 21.05 |
| The Australian National University | 3 | 15.79 |
| The University of Melbourne | 3 | 15.79 |
| University of Canberra | 1 | 5.26 |
| Swinburne University of Technology | 1 | 5.26 |
| University of Western Sydney | 1 | 5.26 |
| The University of Queensland | 1 | 5.26 |
| Curtin University of Technology | 1 | 5.26 |
| University of Tasmania | 1 | 5.26 |
| Macquarie University | 1 | 5.26 |
| The University of Sydney | 1 | 5.26 |
| University of Newcastle | 1 | 5.26 |
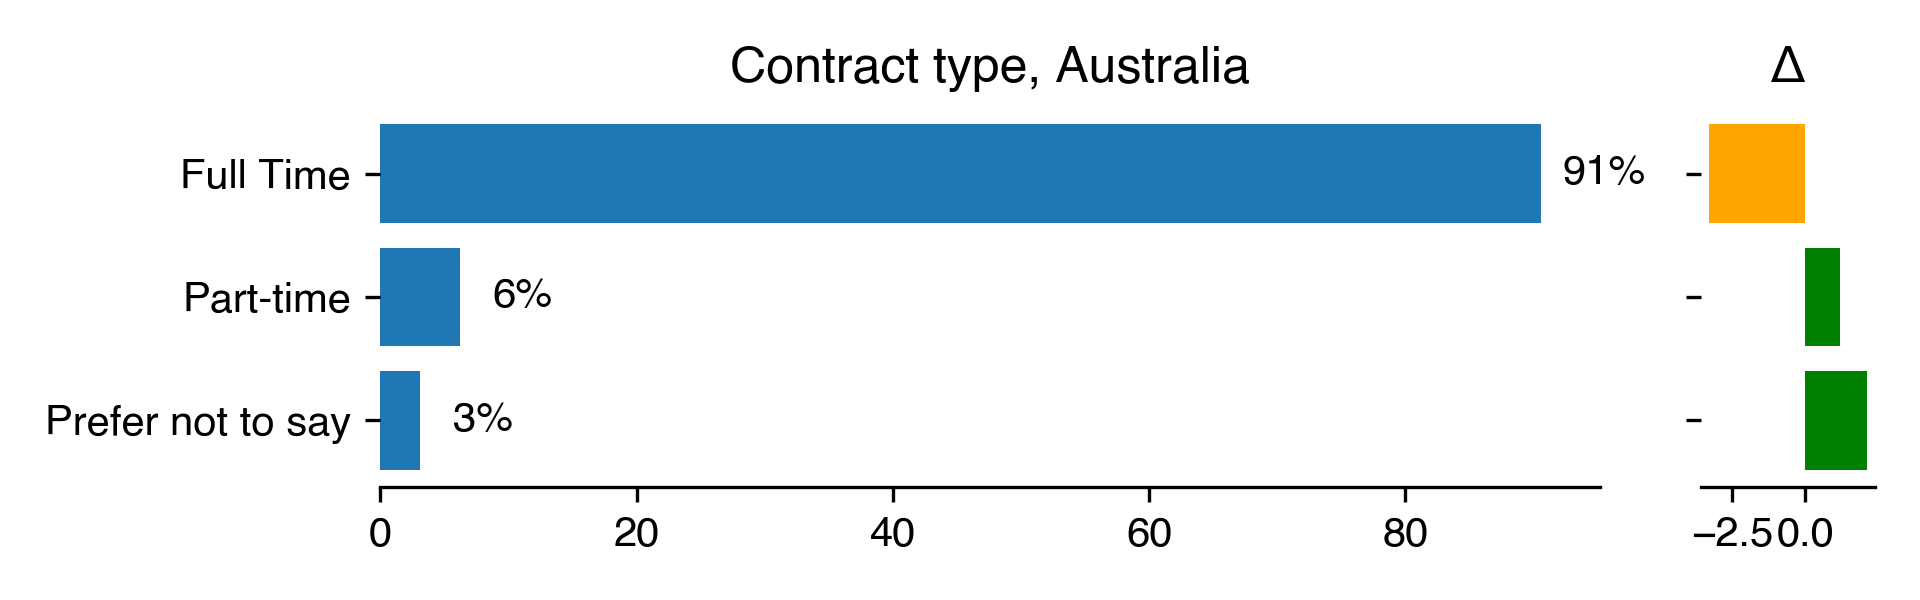
Full time or part-time
| Contract type for Australia | Count | Percentage | Percentage in 2018 | Difference with previous year |
|---|---|---|---|---|
| Full Time | 29 | 90.62 | 93.94 | -3.31 |
| Part-time | 2 | 6.25 | 5.05 | 1.2 |
| Prefer not to say | 1 | 3.12 | 1.01 | 2.11 |
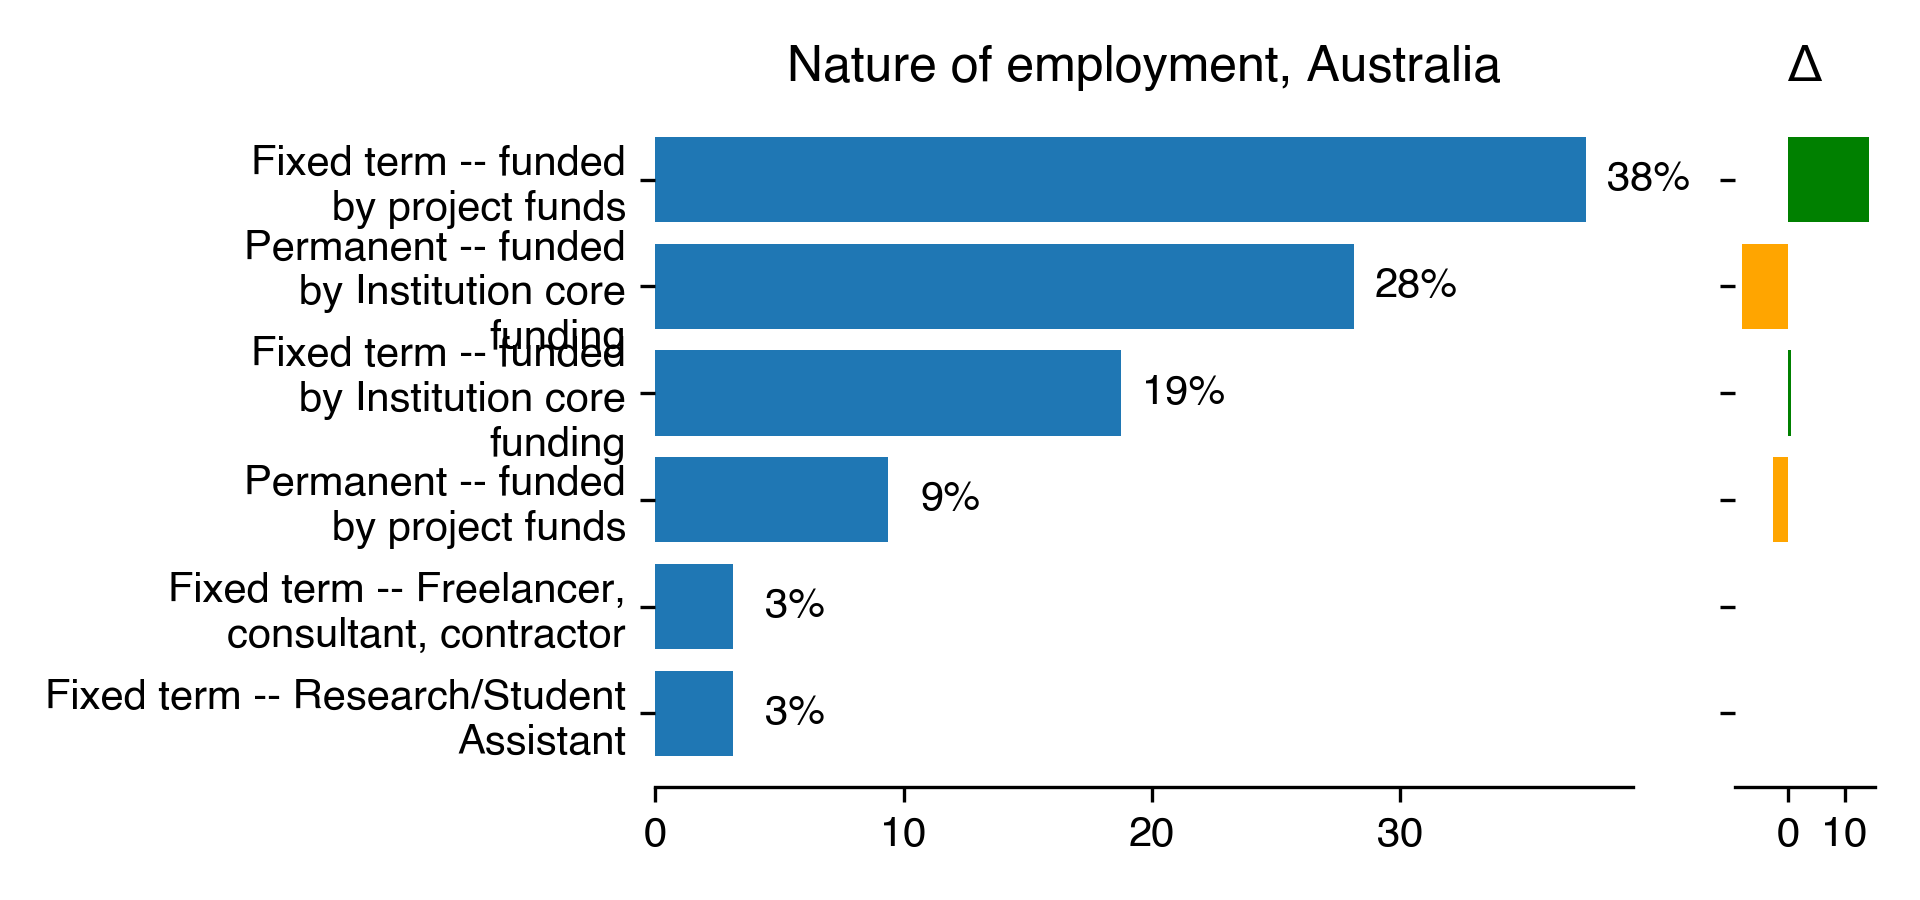
Type of contract
| Nature of employment for Australia | Count | Percentage | Percentage in 2018 | Difference with previous year |
|---|---|---|---|---|
| Fixed term – funded by project funds | 12 | 37.5 | 23.23 | 14.27 |
| Permanent – funded by Institution core funding | 9 | 28.12 | 36.36 | -8.24 |
| Fixed term – funded by Institution core funding | 6 | 18.75 | 18.18 | 0.57 |
| Permanent – funded by project funds | 3 | 9.38 | 12.12 | -2.75 |
| Fixed term – Freelancer, consultant, contractor | 1 | 3.12 | nan | nan |
| Fixed term – Research/Student Assistant | 1 | 3.12 | nan | nan |
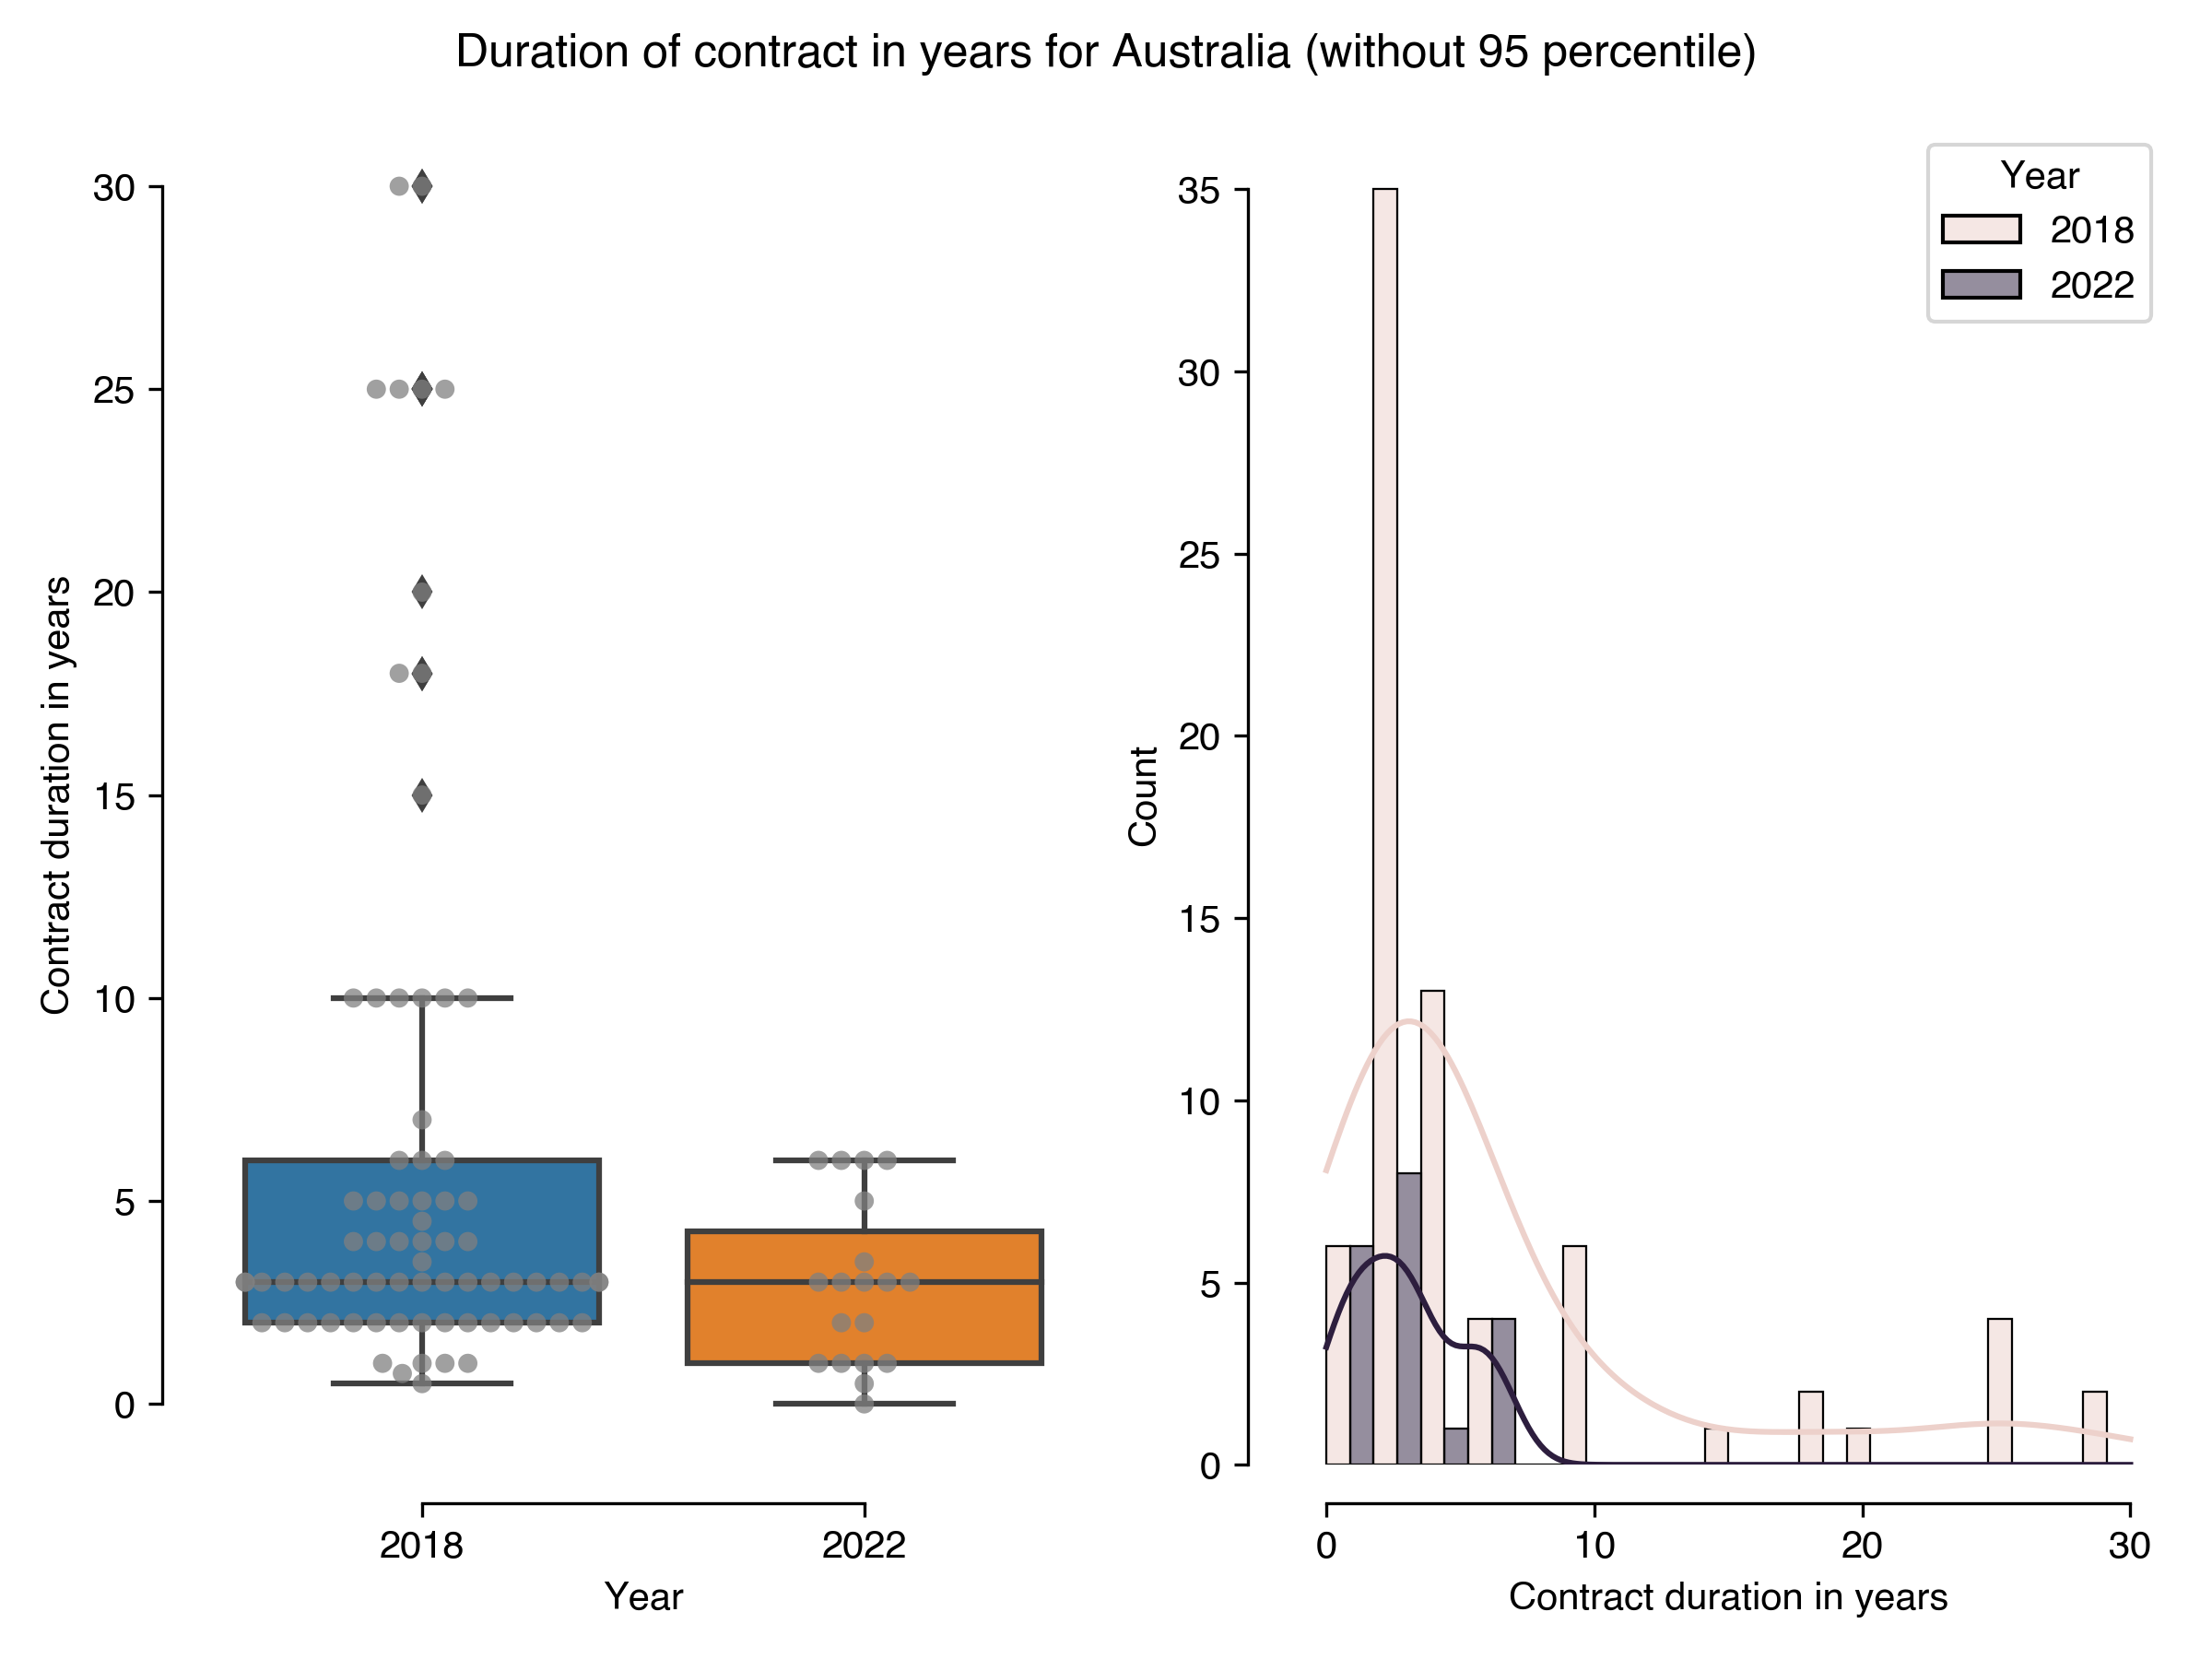
Length of current position
| Duration of contract in years for Australia (without 95 percentile) | Results in 2022 | Results in 2018 |
|---|---|---|
| count | 19 | 74 |
| mean | 2.95 | 6.35 |
| std | 2.02 | 7.27 |
| min | 0 | 0.5 |
| 25% | 1 | 2 |
| 50% | 3 | 3 |
| 75% | 4.25 | 6 |
| max | 6 | 30 |
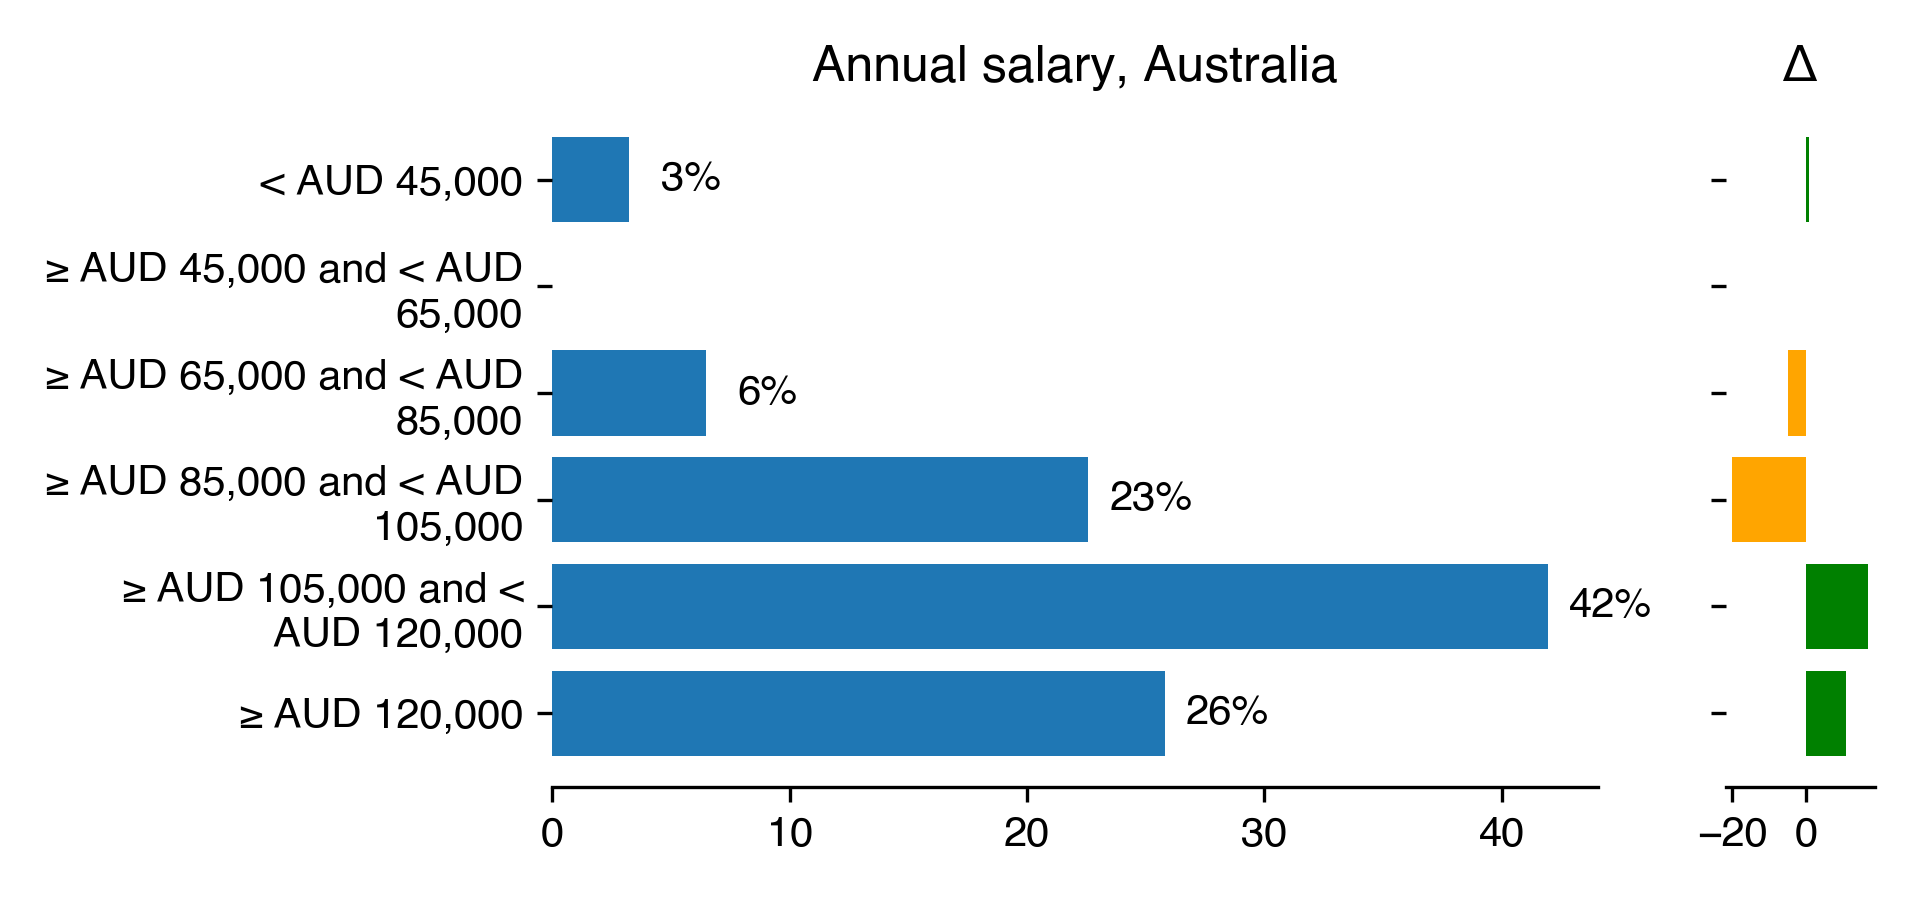
Salary
| Annual salary for Australia | Count | Percentage | Percentage in 2018 | Difference with previous year |
|---|---|---|---|---|
| < AUD 45,000 | 1 | 3.23 | 2.5 | 0.73 |
| ≥ AUD 45,000 and < AUD 65,000 | nan | nan | nan | nan |
| ≥ AUD 65,000 and < AUD 85,000 | 2 | 6.45 | 11.25 | -4.8 |
| ≥ AUD 85,000 and < AUD 105,000 | 7 | 22.58 | 42.5 | -19.92 |
| ≥ AUD 105,000 and < AUD 120,000 | 13 | 41.94 | 25 | 16.94 |
| ≥ AUD 120,000 | 8 | 25.81 | 15 | 10.81 |
Funding
| Type of funding for Australia | Count | Percentage | Percentage in 2018 | Difference with previous year |
|---|---|---|---|---|
| Institutional support | 19 | 59.38 | 52.53 | 6.85 |
| Grants | 13 | 40.62 | 32.32 | 8.3 |
| Consulting & services | 5 | 15.62 | 16.16 | -0.54 |
| other. Which of the following sources are used to pay for your effort as a Research Software Engineer? | 2 | 6.25 | 0 | 6.25 |
| Industry support | 1 | 3.12 | 10.1 | -6.98 |
| Foundations & consortiums | 1 | 3.12 | 1.01 | 2.11 |
| I volunteer my time | 0 | 0 | 20.2 | -20.2 |
| Venture capital | 0 | 0 | 1.01 | -1.01 |
| Open core | 0 | 0 | 1.01 | -1.01 |
| Membership | 0 | 0 | 1.01 | -1.01 |
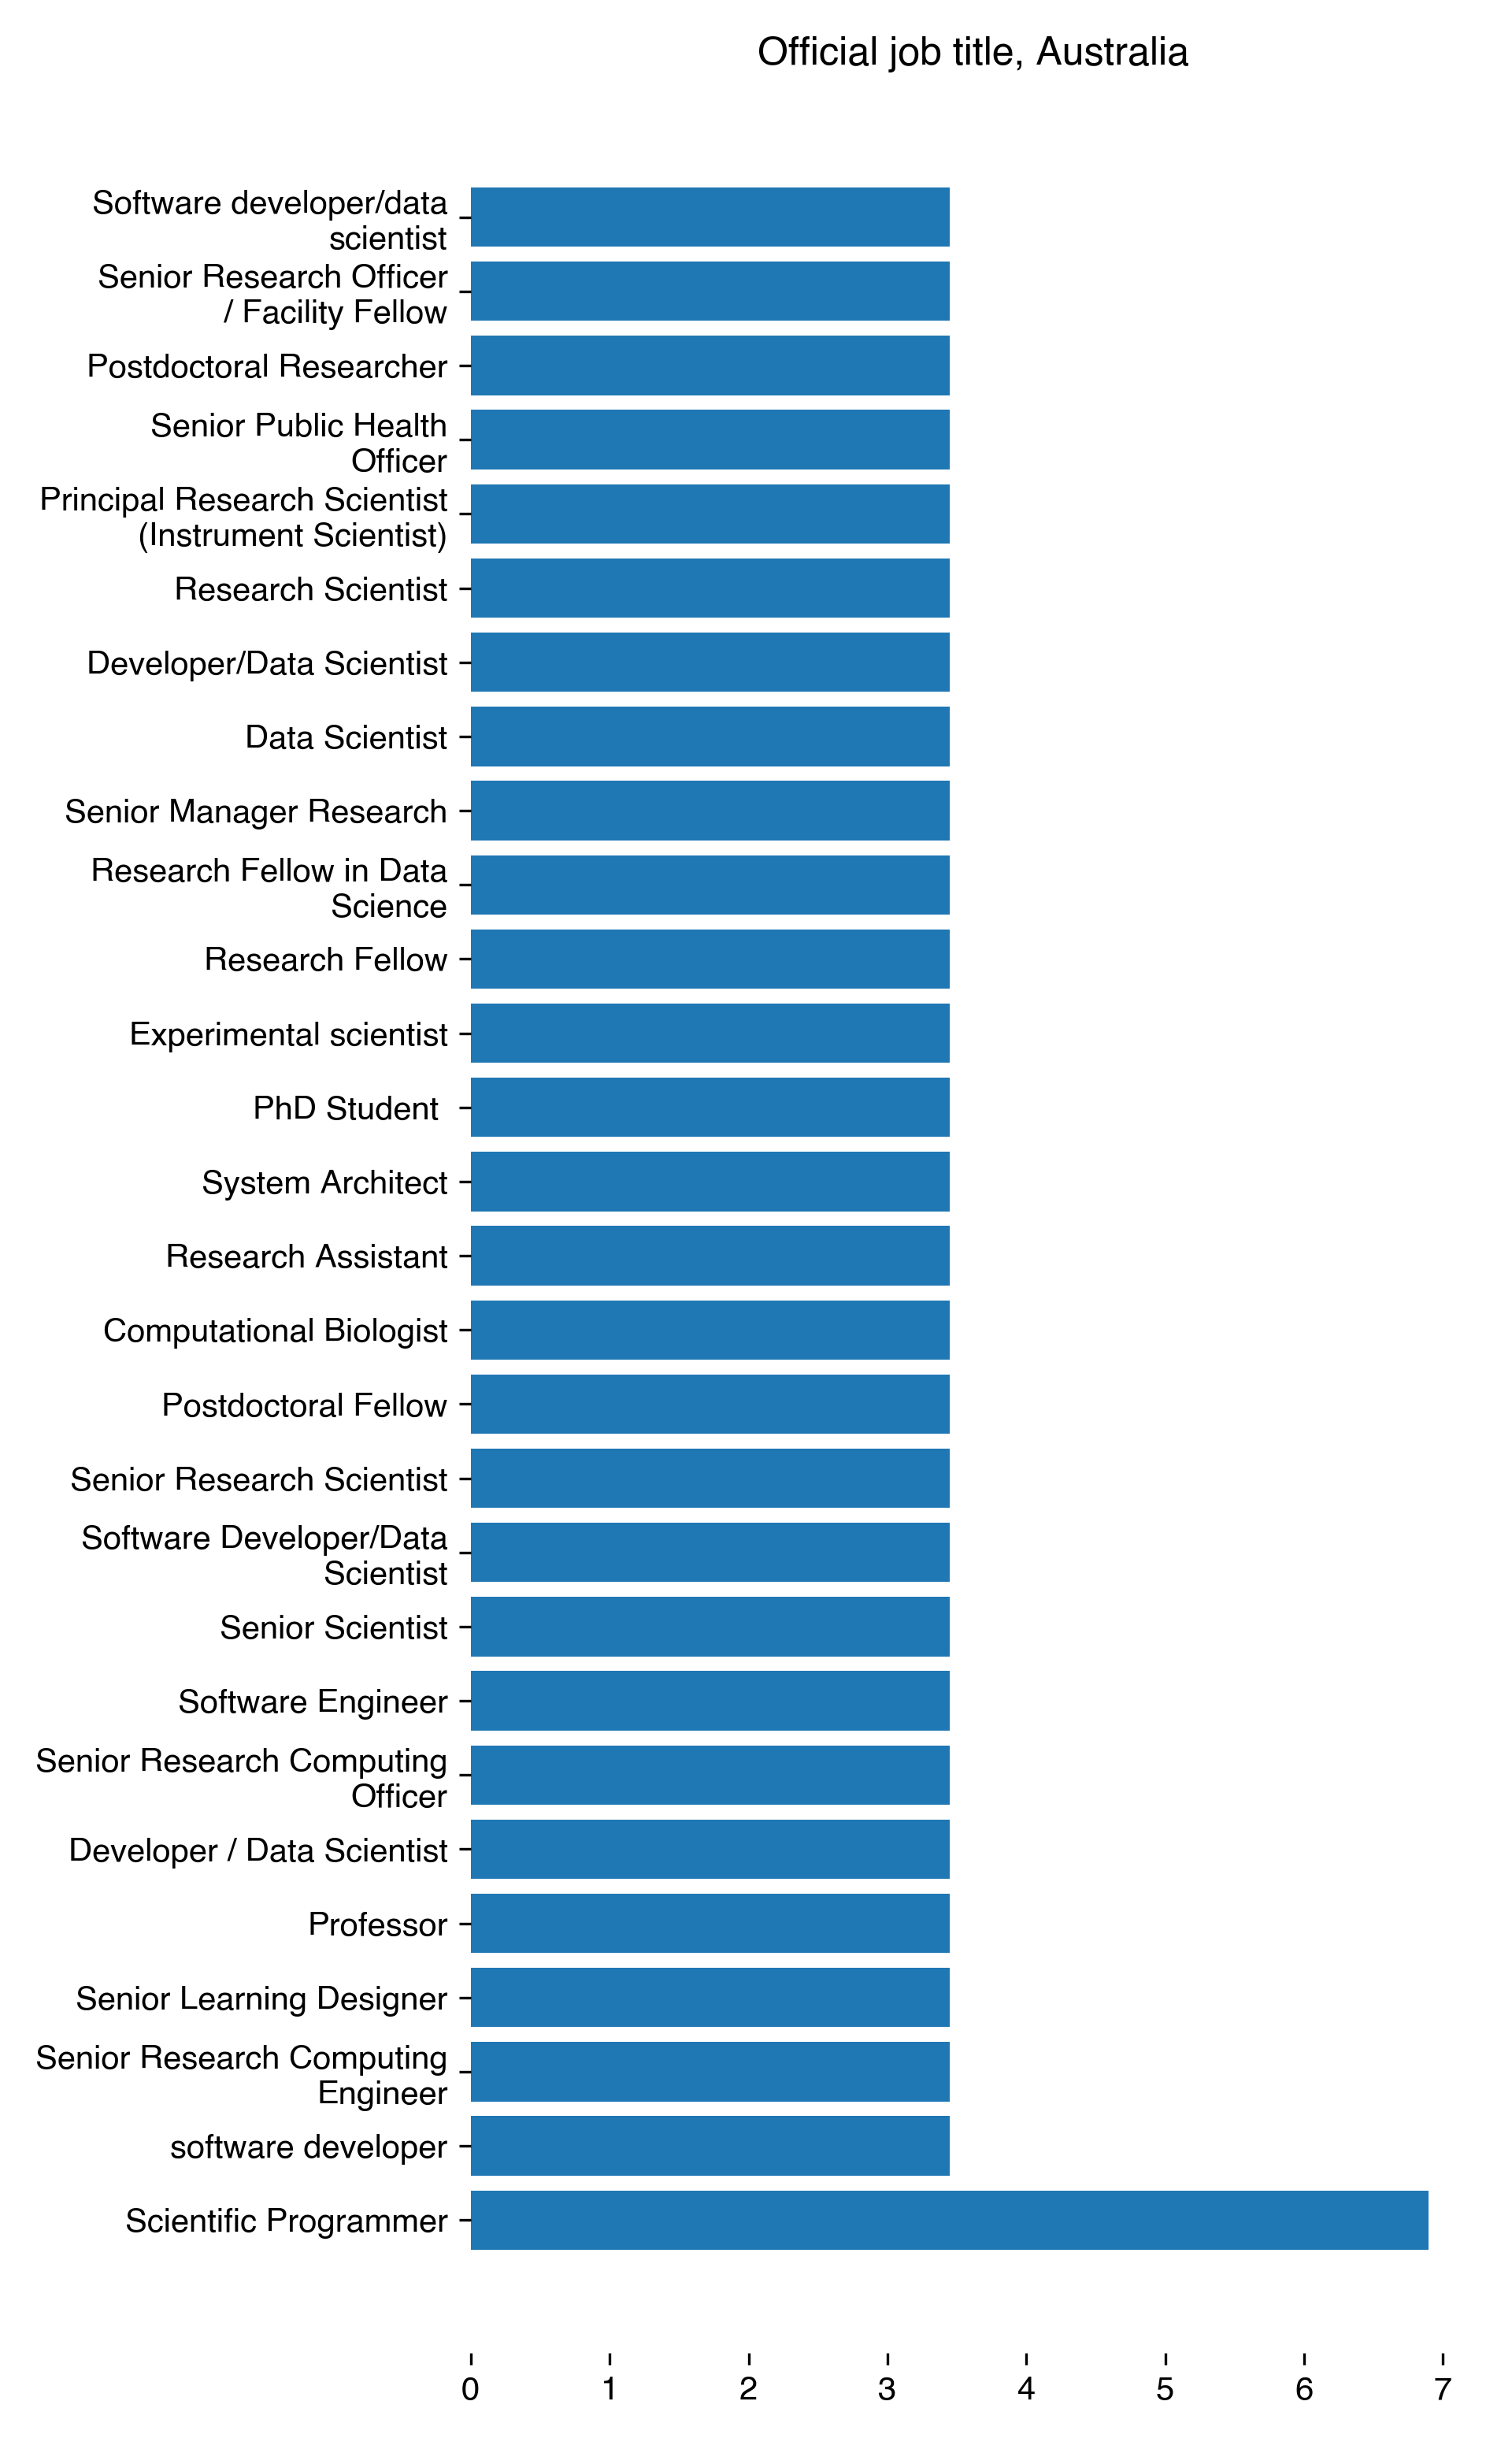
Job title
Canada
Type of organization
| Organisation type for Canada | Count | Percentage | Percentage in 2018 | Difference with previous year |
|---|---|---|---|---|
| University | 6 | 54.55 | 81.82 | -27.27 |
| Private company | 3 | 27.27 | 9.09 | 18.18 |
| Government | 1 | 9.09 | nan | nan |
| Non-profit organization | 1 | 9.09 | 9.09 | 0 |
In which field are you working
| In which field for Canada | Count | Percentage | Percentage in 2018 | Difference with previous year |
|---|---|---|---|---|
| Computer Science | 7 | 63.64 | 0 | 63.64 |
| Mathematics | 4 | 36.36 | 0 | 36.36 |
| Psychology | 3 | 27.27 | 0 | 27.27 |
| Biological Sciences | 3 | 27.27 | 0 | 27.27 |
| Physics and Astronomy | 3 | 27.27 | 0 | 27.27 |
| Medicine | 2 | 18.18 | 0 | 18.18 |
| Mechanical Engineering | 1 | 9.09 | 0 | 9.09 |
| Geography & Environmental Sciences | 1 | 9.09 | 0 | 9.09 |
| Accounting & Finance | 1 | 9.09 | 0 | 9.09 |
| Art & Design | 1 | 9.09 | 0 | 9.09 |
| General Engineering | 1 | 9.09 | 0 | 9.09 |
| Chemistry | 1 | 9.09 | 0 | 9.09 |
| Social Work | 1 | 9.09 | 0 | 9.09 |
| History of Art, Architecture & Design | 1 | 9.09 | 0 | 9.09 |
| CONDENSED MATTERPHYSICS | 0 | 0 | 9.09 | -9.09 |
| EARTH SCIENCE | 0 | 0 | 9.09 | -9.09 |
| ASTRONOMY AND ASTROPHYSICS | 0 | 0 | 27.27 | -27.27 |
| PHYSICAL GEOGRAPHY | 0 | 0 | 9.09 | -9.09 |
| STATISTICS AND PROBABILITY | 0 | 0 | 36.36 | -36.36 |
| THEORETICAL PHYSICS AND CHEMISTRY | 0 | 0 | 9.09 | -9.09 |
| FLUID MECHANICS | 0 | 0 | 9.09 | -9.09 |
| ENVIRONMENTAL ENGINEERING | 0 | 0 | 9.09 | -9.09 |
| INDUSTRIAL ENGINEERING | 0 | 0 | 9.09 | -9.09 |
| DESIGN AND MANUFACTURING | 0 | 0 | 9.09 | -9.09 |
| BIOMEDICAL ENGINEERING | 0 | 0 | 9.09 | -9.09 |
| PHYSICS | 0 | 0 | 9.09 | -9.09 |
| INFORMATION TECHNOLOGY | 0 | 0 | 18.18 | -18.18 |
| ARTIFICIAL INTELLIGENCE | 0 | 0 | 18.18 | -18.18 |
| APPLIED MATHEMATICS | 0 | 0 | 9.09 | -9.09 |
| HYDROLOGY | 0 | 0 | 9.09 | -9.09 |
| EVOLUTION AND ECOLOGY | 0 | 0 | 18.18 | -18.18 |
| MICROBIOLOGY | 0 | 0 | 9.09 | -9.09 |
| PSYCHOLOGY | 0 | 0 | 18.18 | -18.18 |
| LIFE SCIENCES RESEARCH RELATED TO HUMAN HEALTH AND DISEASE | 0 | 0 | 18.18 | -18.18 |
| OTHER STUDIES IN NATURAL SCIENCES AND ENGINEERING | 0 | 0 | 18.18 | -18.18 |
| HEALTH SCIENCES | 0 | 0 | 9.09 | -9.09 |
Which university or organization
No data found in survey.
Full time or part-time
No data found in survey.
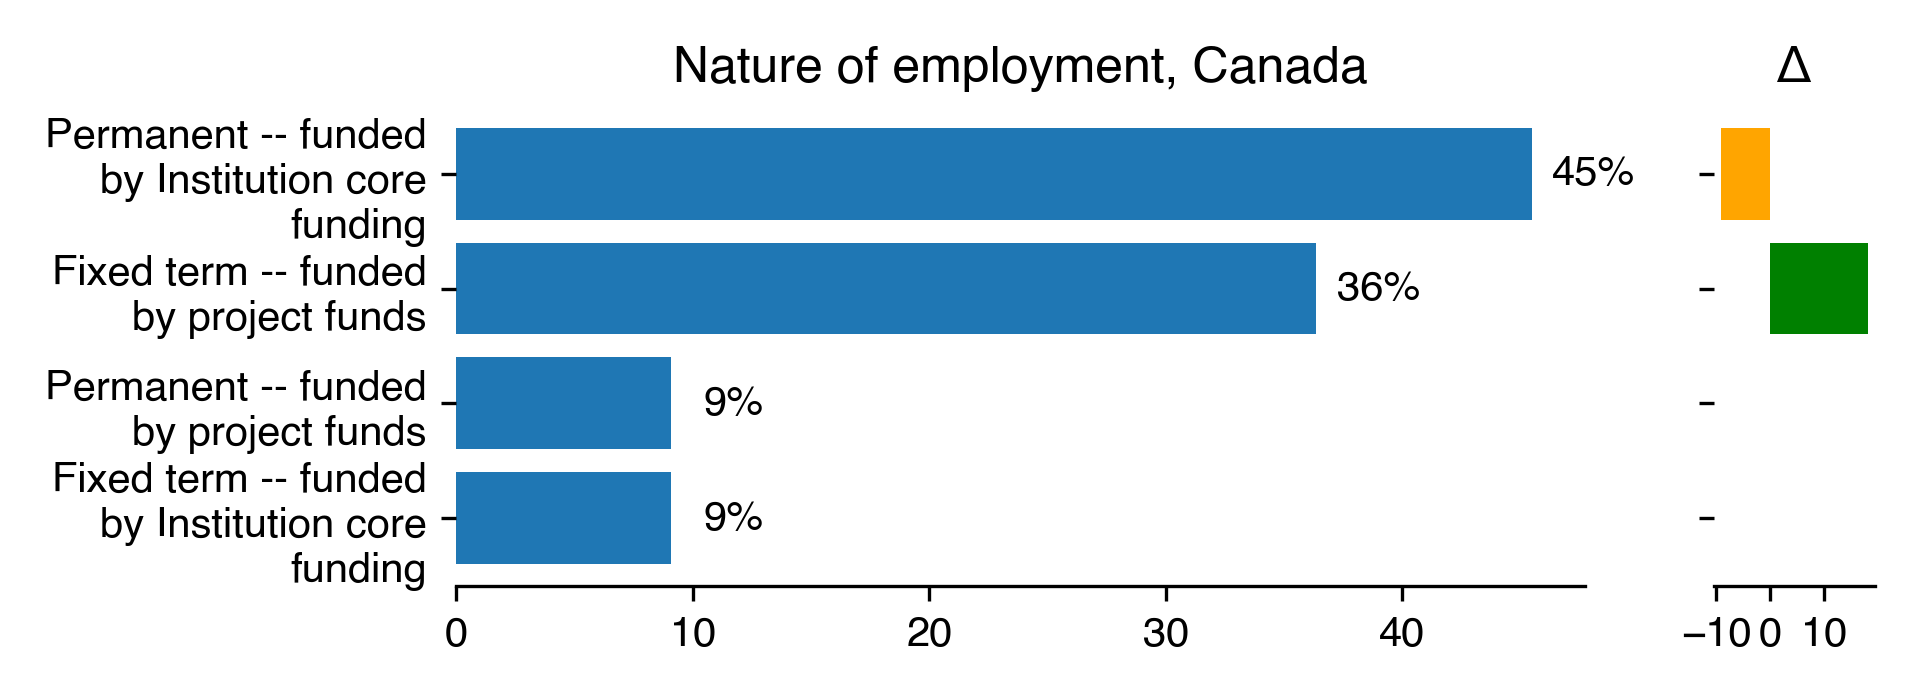
Type of contract
| Nature of employment for Canada | Count | Percentage | Percentage in 2018 | Difference with previous year |
|---|---|---|---|---|
| Permanent – funded by Institution core funding | 5 | 45.45 | 54.55 | -9.09 |
| Fixed term – funded by project funds | 4 | 36.36 | 18.18 | 18.18 |
| Permanent – funded by project funds | 1 | 9.09 | nan | nan |
| Fixed term – funded by Institution core funding | 1 | 9.09 | 9.09 | 0 |
Length of current position
| Duration of contract in years for Canada (without 95 percentile) | Results in 2022 |
|---|---|
| count | 0 |
| mean | nan |
| std | nan |
| min | nan |
| 25% | nan |
| 50% | nan |
| 75% | nan |
| max | nan |
Salary
No data found in survey.
Funding
No data found in survey.
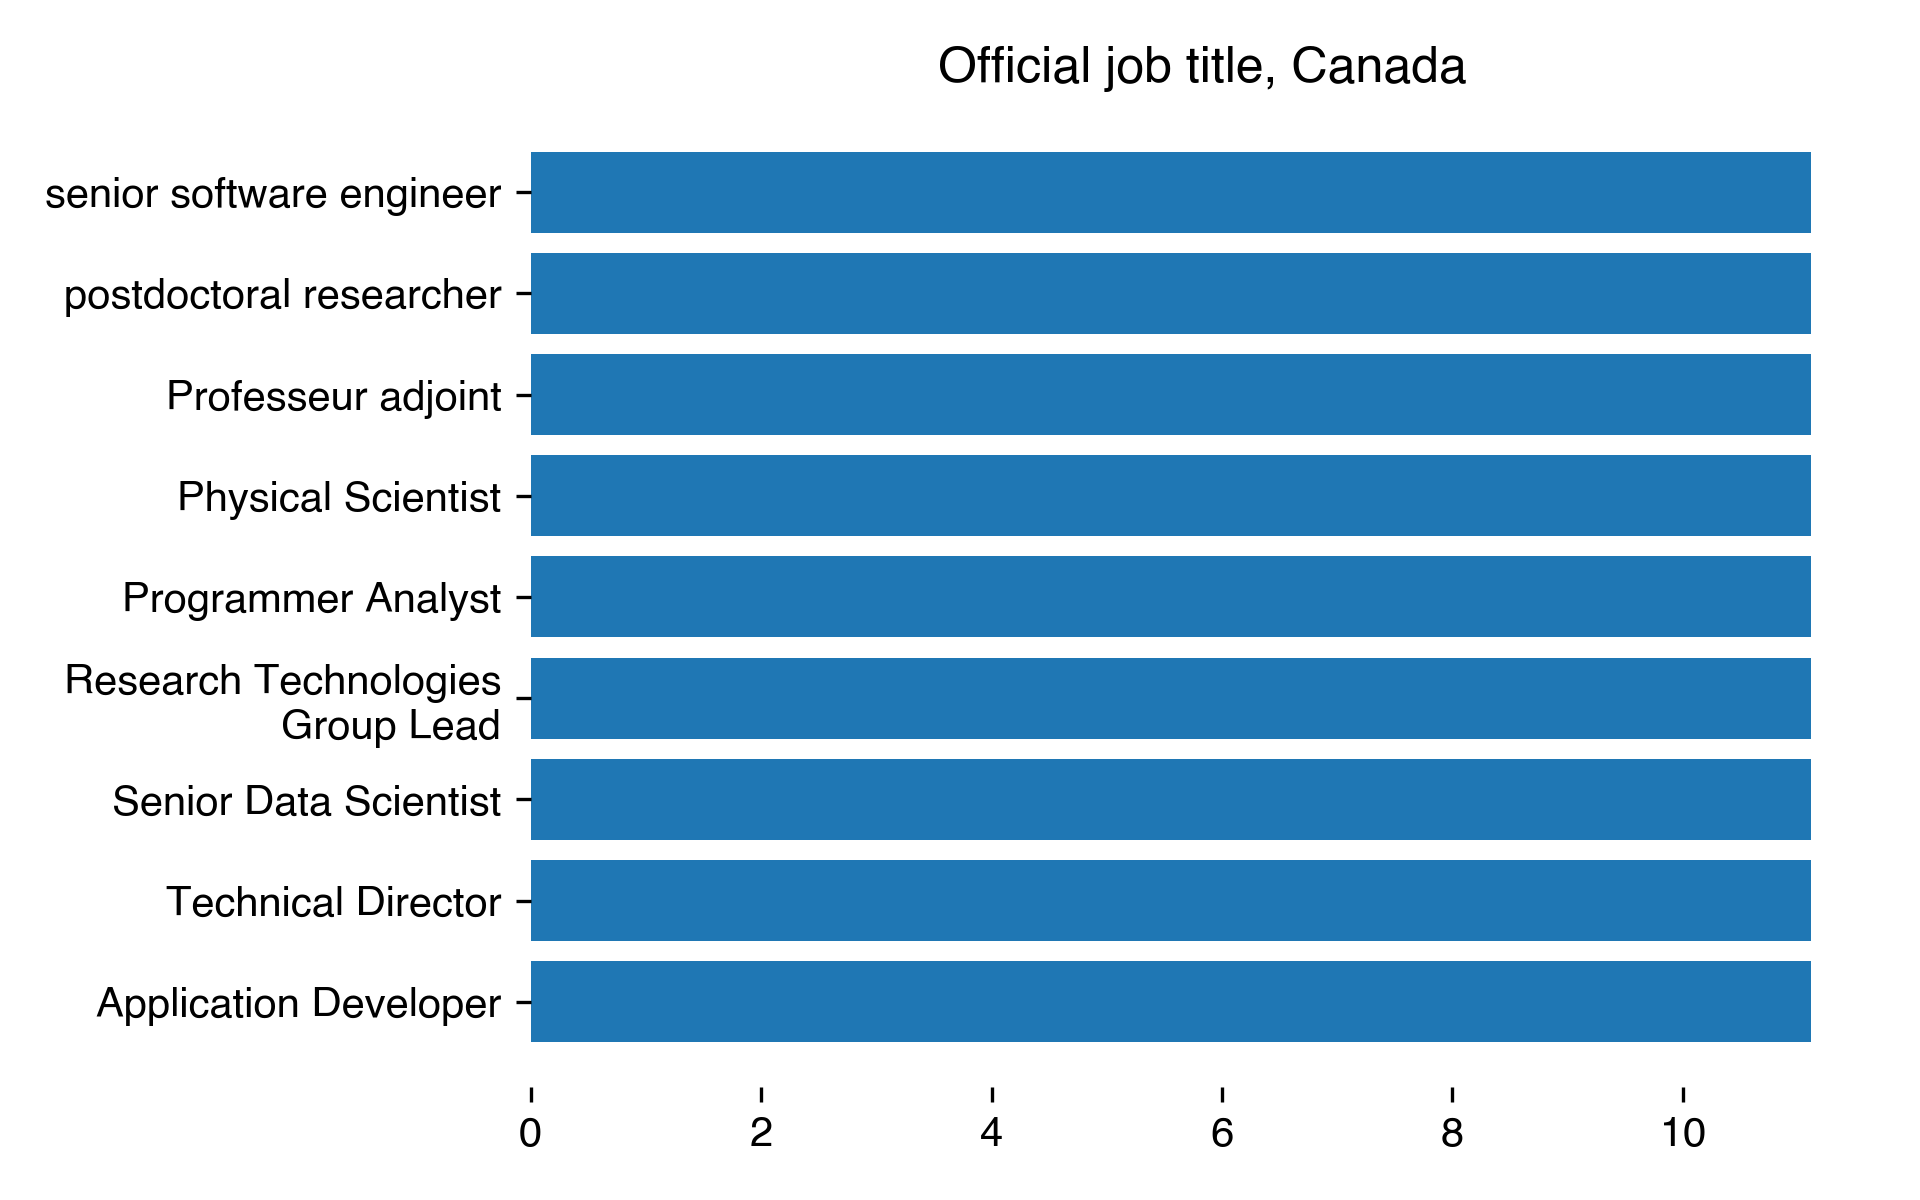
Job title
Germany
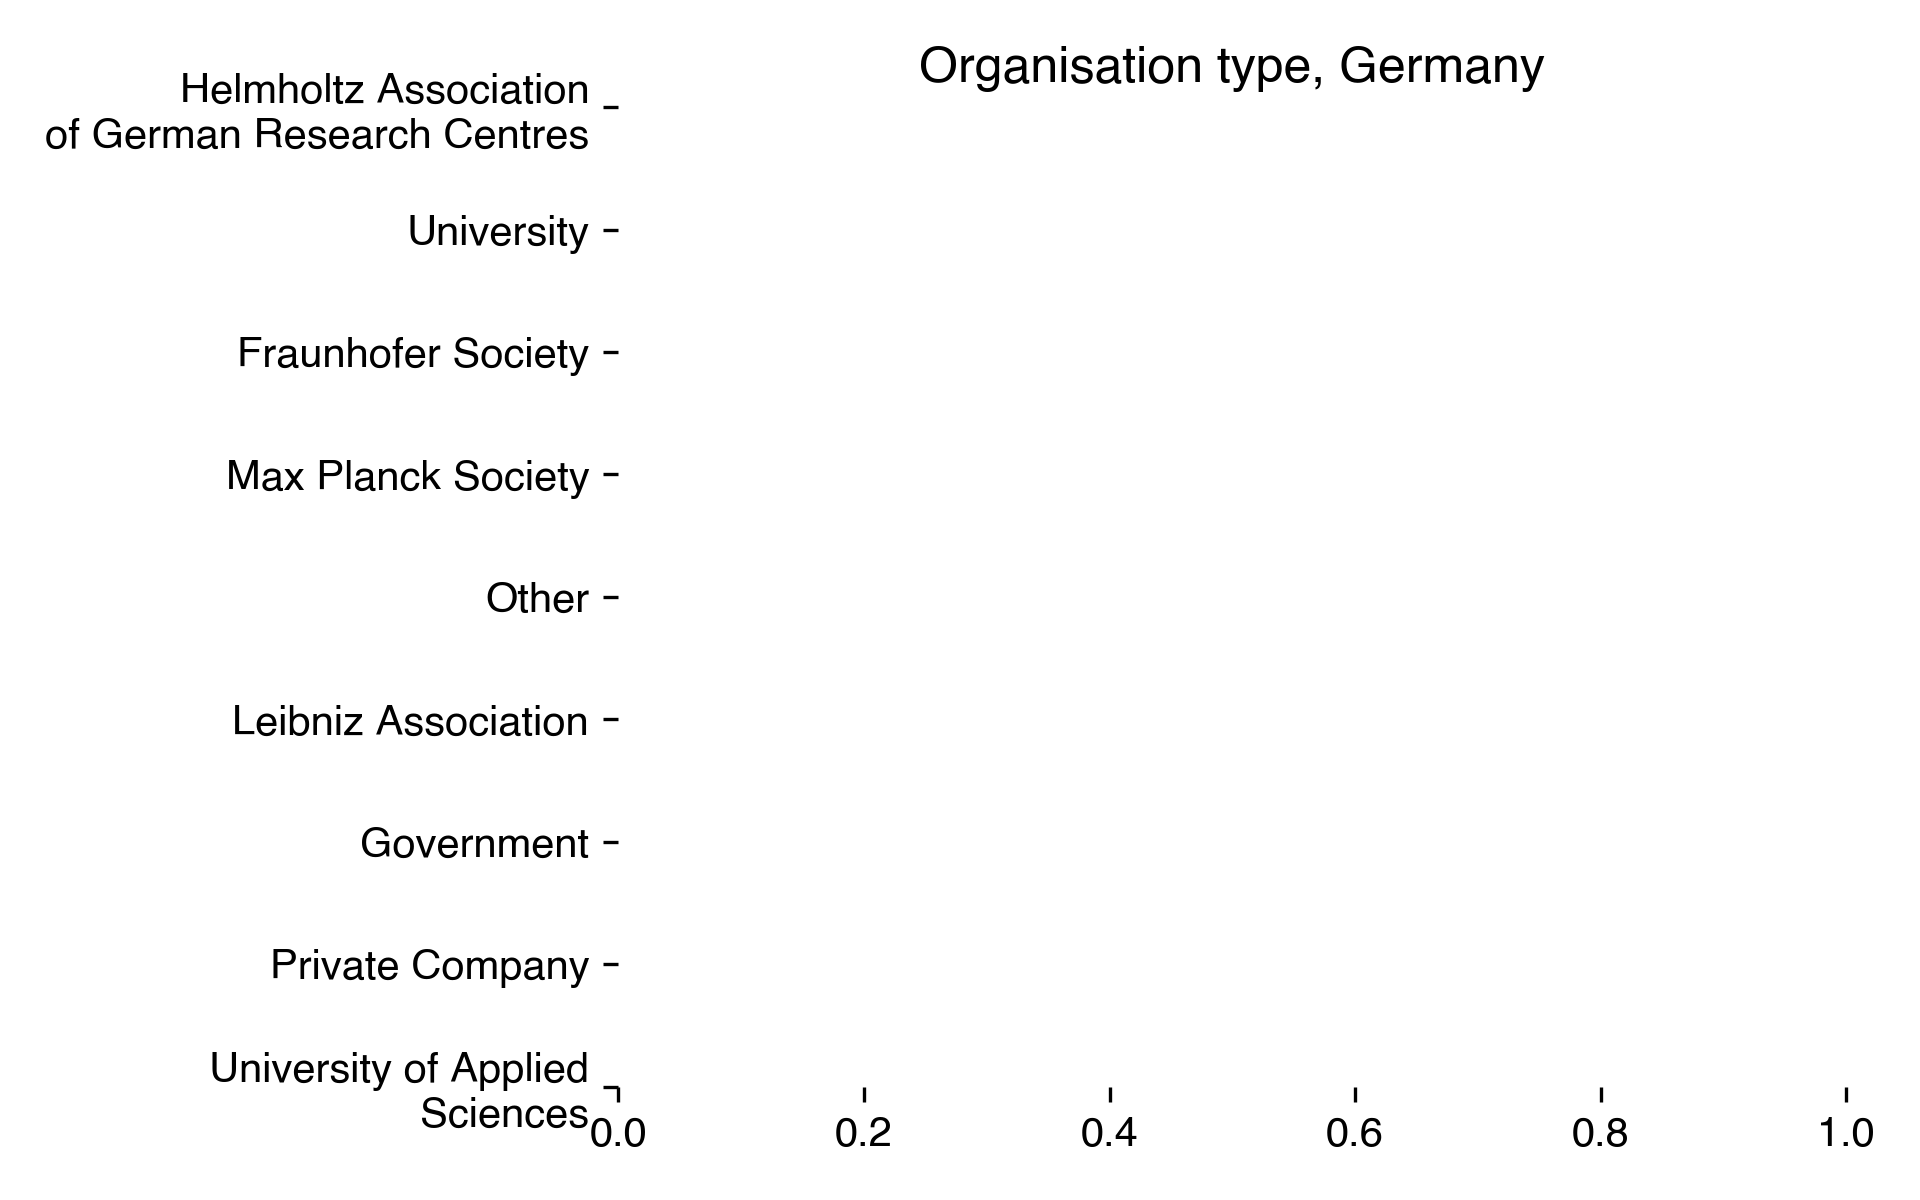
Type of organization
| Organisation type for Germany | Percentage in 2018 |
|---|---|
| Helmholtz Association of German Research Centres | 24.92 |
| University | 20.72 |
| Fraunhofer Society | 19.22 |
| Max Planck Society | 11.41 |
| Other | 9.91 |
| Leibniz Association | 8.41 |
| Government | 2.7 |
| Private Company | 1.8 |
| University of Applied Sciences | 0.9 |
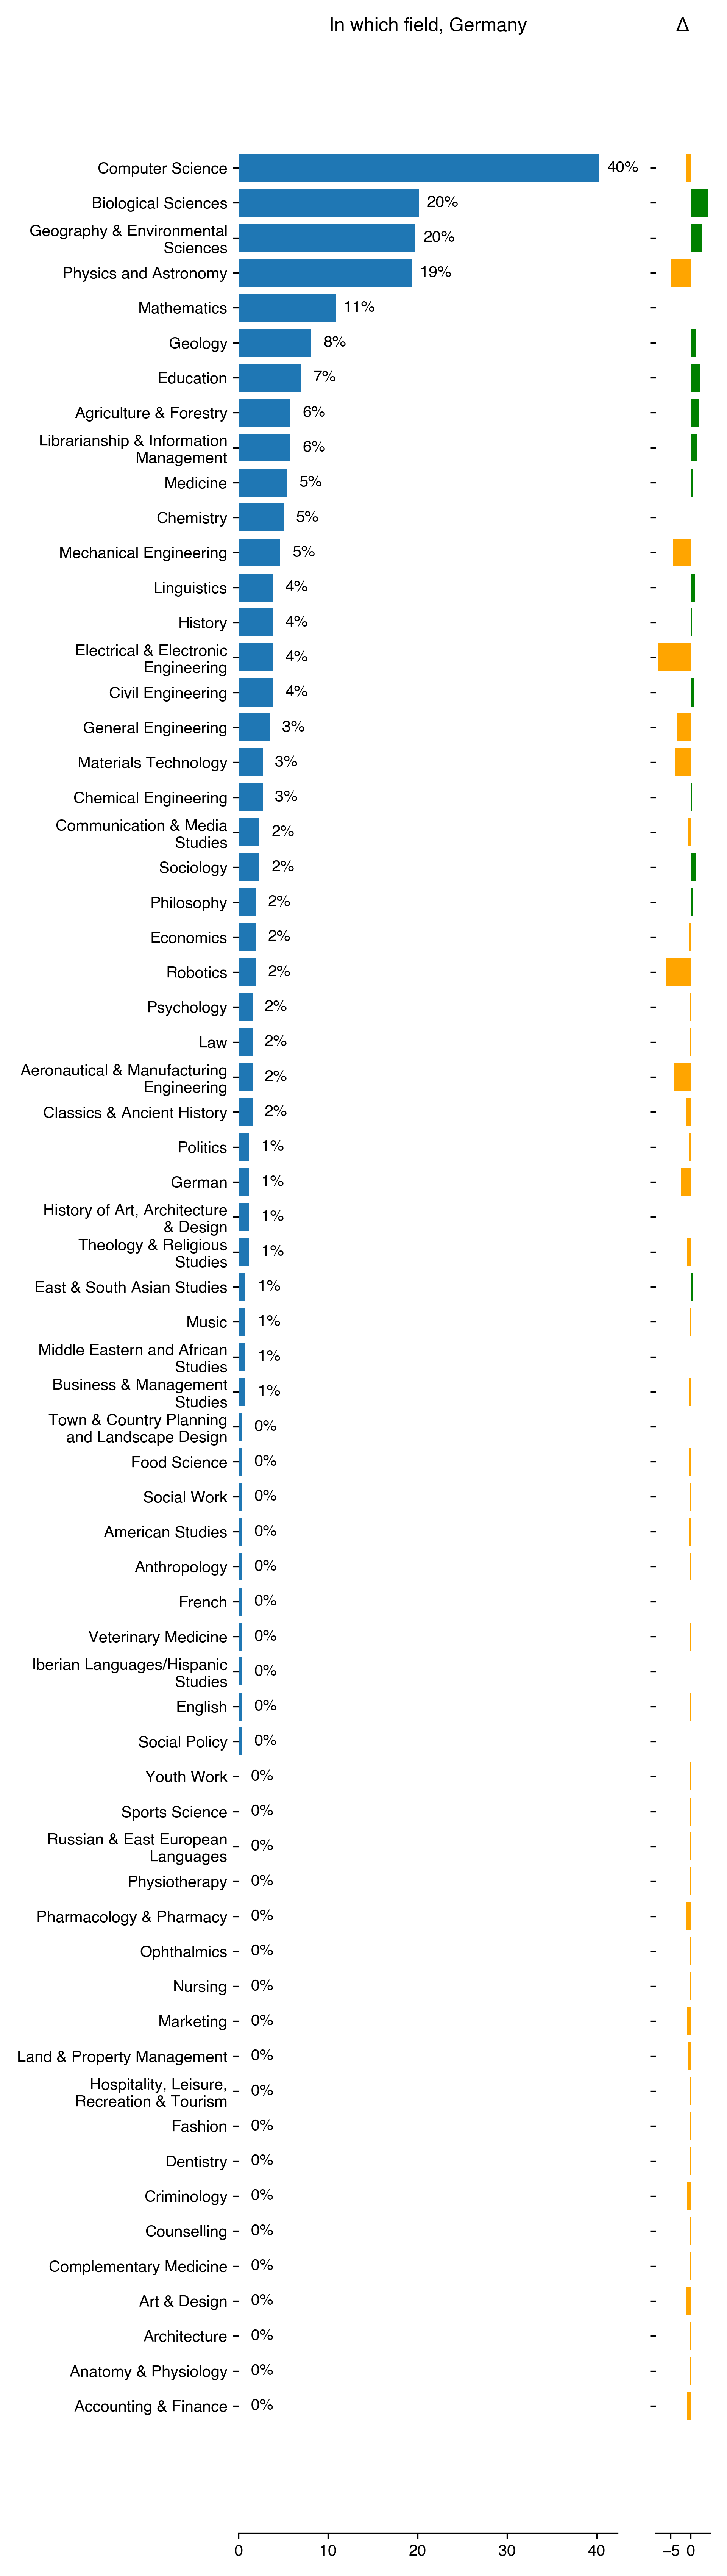
In which field are you working
| In which field for Germany | Count | Percentage | Percentage in 2018 | Difference with previous year |
|---|---|---|---|---|
| Computer Science | 104 | 40.31 | 41.44 | -1.13 |
| Biological Sciences | 52 | 20.16 | 15.92 | 4.24 |
| Geography & Environmental Sciences | 51 | 19.77 | 16.82 | 2.95 |
| Physics and Astronomy | 50 | 19.38 | 24.32 | -4.94 |
| Mathematics | 28 | 10.85 | 10.81 | 0.04 |
| Geology | 21 | 8.14 | 6.91 | 1.23 |
| Education | 18 | 6.98 | 4.5 | 2.47 |
| Agriculture & Forestry | 15 | 5.81 | 3.6 | 2.21 |
| Librarianship & Information Management | 15 | 5.81 | 4.2 | 1.61 |
| Medicine | 14 | 5.43 | 4.8 | 0.62 |
| Chemistry | 13 | 5.04 | 4.8 | 0.23 |
| Mechanical Engineering | 12 | 4.65 | 9.01 | -4.36 |
| Linguistics | 10 | 3.88 | 2.7 | 1.17 |
| History | 10 | 3.88 | 3.6 | 0.27 |
| Electrical & Electronic Engineering | 10 | 3.88 | 12.01 | -8.14 |
| Civil Engineering | 10 | 3.88 | 3 | 0.87 |
| General Engineering | 9 | 3.49 | 6.91 | -3.42 |
| Materials Technology | 7 | 2.71 | 6.61 | -3.89 |
| Chemical Engineering | 7 | 2.71 | 2.4 | 0.31 |
| Communication & Media Studies | 6 | 2.33 | 3 | -0.68 |
| Sociology | 6 | 2.33 | 0.9 | 1.42 |
| Philosophy | 5 | 1.94 | 1.5 | 0.44 |
| Economics | 5 | 1.94 | 2.4 | -0.46 |
| Robotics | 5 | 1.94 | 8.11 | -6.17 |
| Psychology | 4 | 1.55 | 1.8 | -0.25 |
| Law | 4 | 1.55 | 1.8 | -0.25 |
| Aeronautical & Manufacturing Engineering | 4 | 1.55 | 5.71 | -4.16 |
| Classics & Ancient History | 4 | 1.55 | 2.7 | -1.15 |
| Politics | 3 | 1.16 | 1.5 | -0.34 |
| German | 3 | 1.16 | 3.6 | -2.44 |
| History of Art, Architecture & Design | 3 | 1.16 | 1.2 | -0.04 |
| Theology & Religious Studies | 3 | 1.16 | 2.1 | -0.94 |
| East & South Asian Studies | 2 | 0.78 | 0.3 | 0.47 |
| Music | 2 | 0.78 | 0.9 | -0.13 |
| Middle Eastern and African Studies | 2 | 0.78 | 0.6 | 0.17 |
| Business & Management Studies | 2 | 0.78 | 1.2 | -0.43 |
| Town & Country Planning and Landscape Design | 1 | 0.39 | 0.3 | 0.09 |
| Food Science | 1 | 0.39 | 0.9 | -0.51 |
| Social Work | 1 | 0.39 | 0.6 | -0.21 |
| American Studies | 1 | 0.39 | 0.9 | -0.51 |
| Anthropology | 1 | 0.39 | 0.6 | -0.21 |
| French | 1 | 0.39 | 0.3 | 0.09 |
| Veterinary Medicine | 1 | 0.39 | 0.6 | -0.21 |
| Iberian Languages/Hispanic Studies | 1 | 0.39 | 0.3 | 0.09 |
| English | 1 | 0.39 | 0.6 | -0.21 |
| Social Policy | 1 | 0.39 | 0.3 | 0.09 |
| Youth Work | 0 | 0 | 0.3 | -0.3 |
| Sports Science | 0 | 0 | 0.3 | -0.3 |
| Russian & East European Languages | 0 | 0 | 0.3 | -0.3 |
| Physiotherapy | 0 | 0 | 0.3 | -0.3 |
| Pharmacology & Pharmacy | 0 | 0 | 1.2 | -1.2 |
| Ophthalmics | 0 | 0 | 0.3 | -0.3 |
| Nursing | 0 | 0 | 0.3 | -0.3 |
| Marketing | 0 | 0 | 0.9 | -0.9 |
| Land & Property Management | 0 | 0 | 0.6 | -0.6 |
| Hospitality, Leisure, Recreation & Tourism | 0 | 0 | 0.3 | -0.3 |
| Fashion | 0 | 0 | 0.3 | -0.3 |
| Dentistry | 0 | 0 | 0.3 | -0.3 |
| Criminology | 0 | 0 | 0.9 | -0.9 |
| Counselling | 0 | 0 | 0.3 | -0.3 |
| Complementary Medicine | 0 | 0 | 0.3 | -0.3 |
| Art & Design | 0 | 0 | 1.2 | -1.2 |
| Architecture | 0 | 0 | 0.3 | -0.3 |
| Anatomy & Physiology | 0 | 0 | 0.3 | -0.3 |
| Accounting & Finance | 0 | 0 | 0.9 | -0.9 |
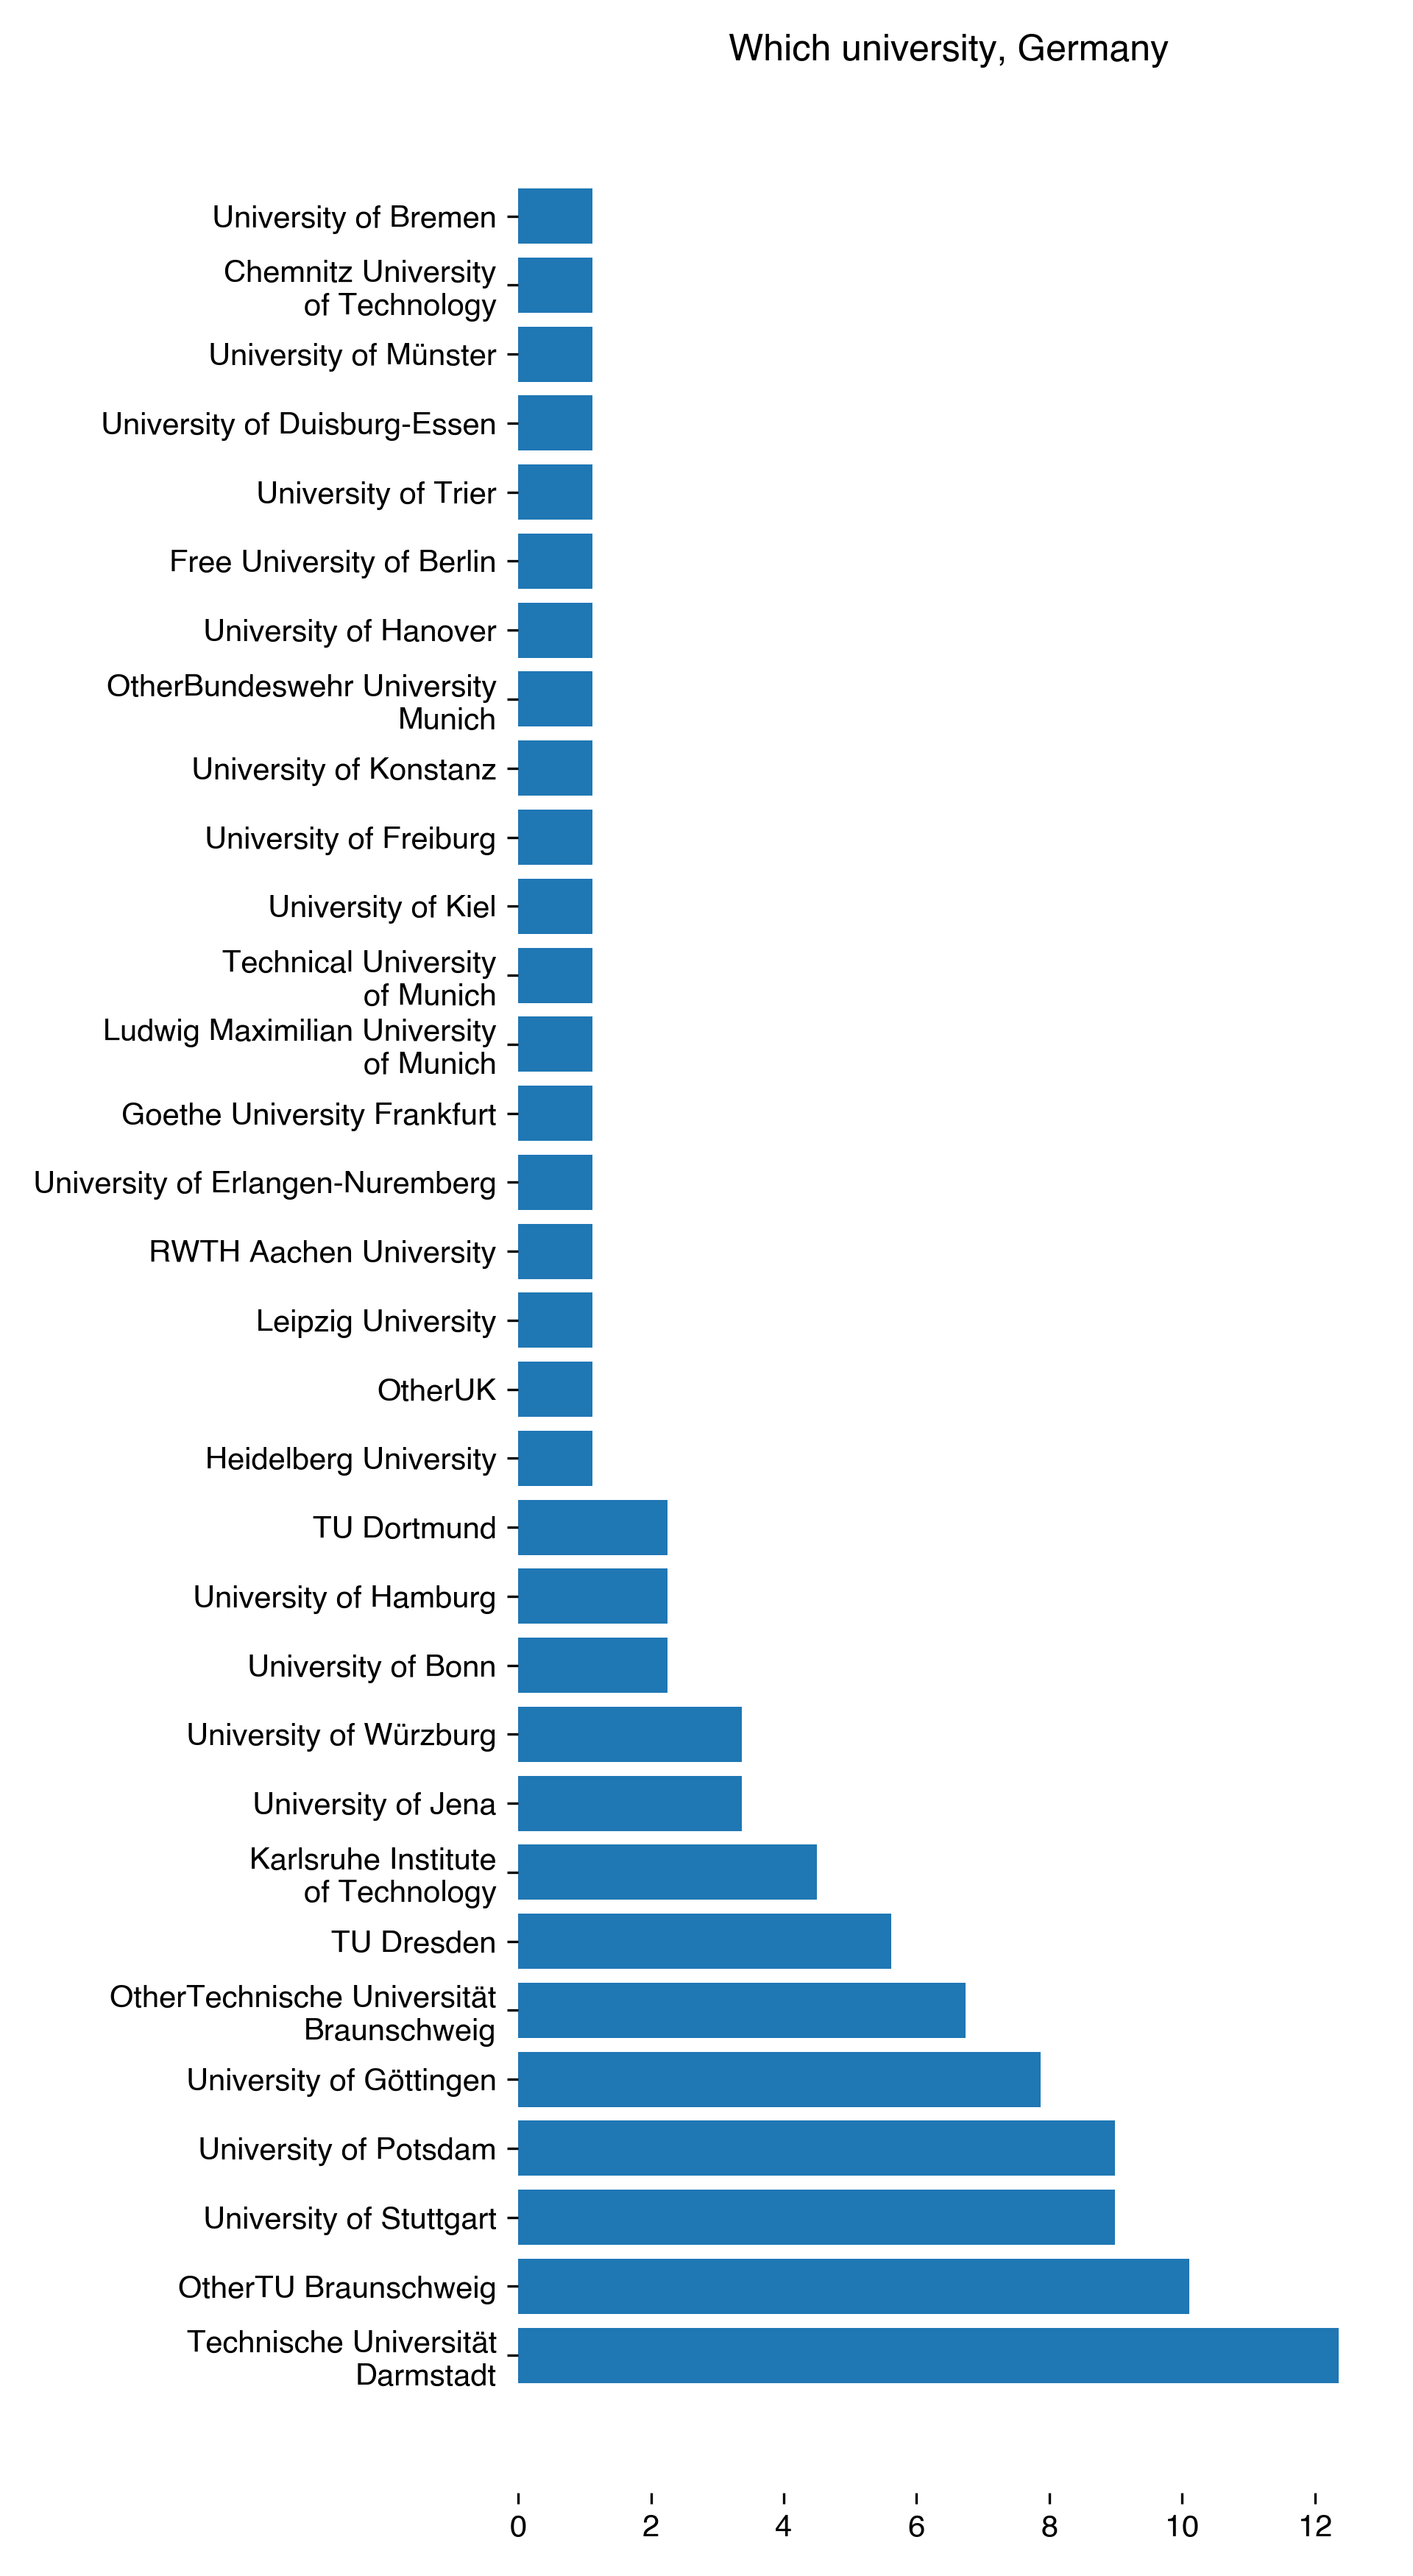
Which university or organization
| Which university for Germany | Count | Percentage |
|---|---|---|
| Technische Universität Darmstadt | 11 | 12.36 |
| OtherTU Braunschweig | 9 | 10.11 |
| University of Stuttgart | 8 | 8.99 |
| University of Potsdam | 8 | 8.99 |
| University of Göttingen | 7 | 7.87 |
| OtherTechnische Universität Braunschweig | 6 | 6.74 |
| TU Dresden | 5 | 5.62 |
| Karlsruhe Institute of Technology | 4 | 4.49 |
| University of Jena | 3 | 3.37 |
| University of Würzburg | 3 | 3.37 |
| University of Bonn | 2 | 2.25 |
| University of Hamburg | 2 | 2.25 |
| TU Dortmund | 2 | 2.25 |
| OtherUK | 1 | 1.12 |
| Leipzig University | 1 | 1.12 |
| University of Bremen | 1 | 1.12 |
| University of Erlangen-Nuremberg | 1 | 1.12 |
| Goethe University Frankfurt | 1 | 1.12 |
| Ludwig Maximilian University of Munich | 1 | 1.12 |
| Technical University of Munich | 1 | 1.12 |
| University of Kiel | 1 | 1.12 |
| University of Freiburg | 1 | 1.12 |
| University of Konstanz | 1 | 1.12 |
| OtherBundeswehr University Munich | 1 | 1.12 |
| University of Hanover | 1 | 1.12 |
| Free University of Berlin | 1 | 1.12 |
| University of Trier | 1 | 1.12 |
| University of Duisburg-Essen | 1 | 1.12 |
| University of Münster | 1 | 1.12 |
| Chemnitz University of Technology | 1 | 1.12 |
| Heidelberg University | 1 | 1.12 |
| RWTH Aachen University | 1 | 1.12 |
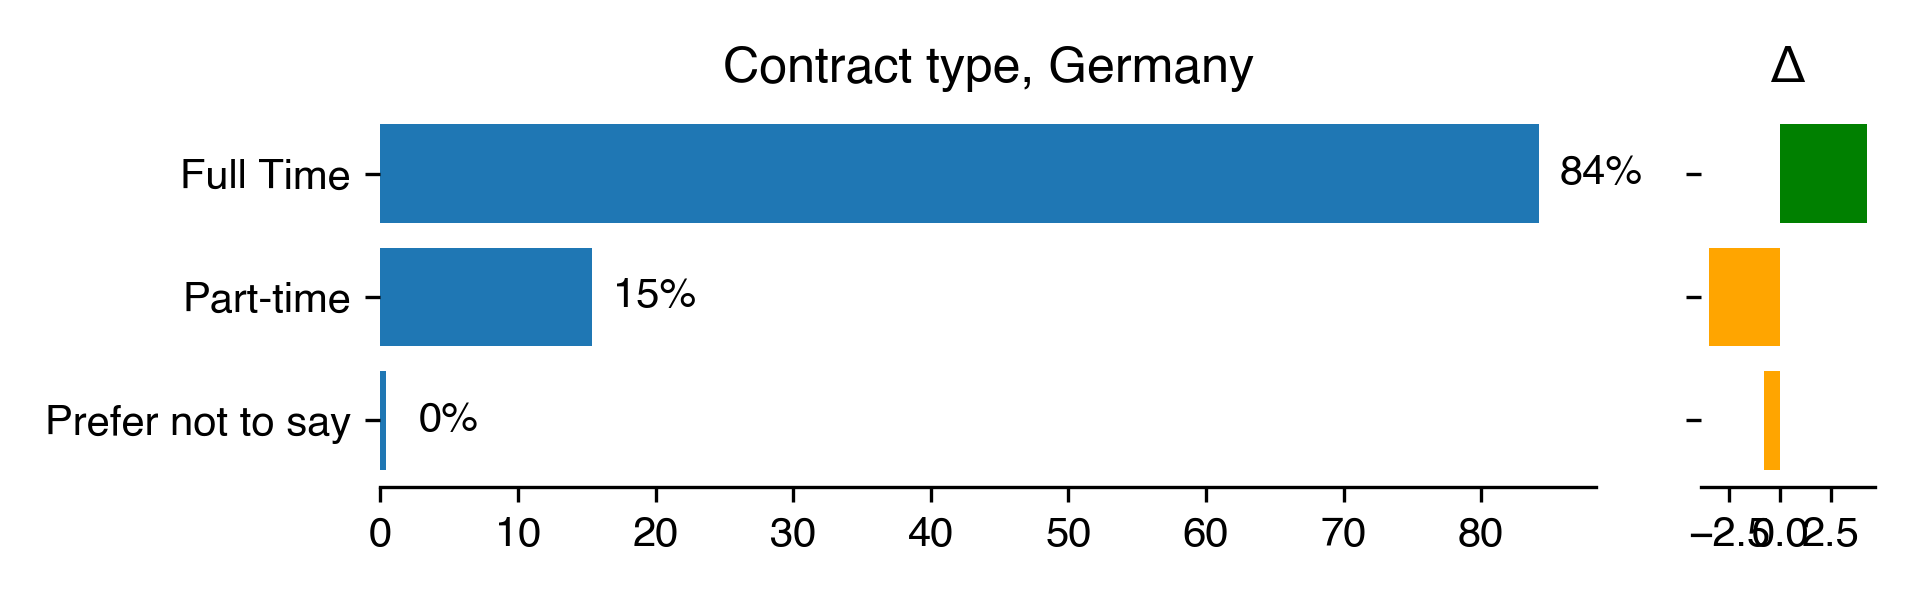
Full time or part-time
| Contract type for Germany | Count | Percentage | Percentage in 2018 | Difference with previous year |
|---|---|---|---|---|
| Full Time | 202 | 84.17 | 79.88 | 4.29 |
| Part-time | 37 | 15.42 | 18.92 | -3.5 |
| Prefer not to say | 1 | 0.42 | 1.2 | -0.78 |
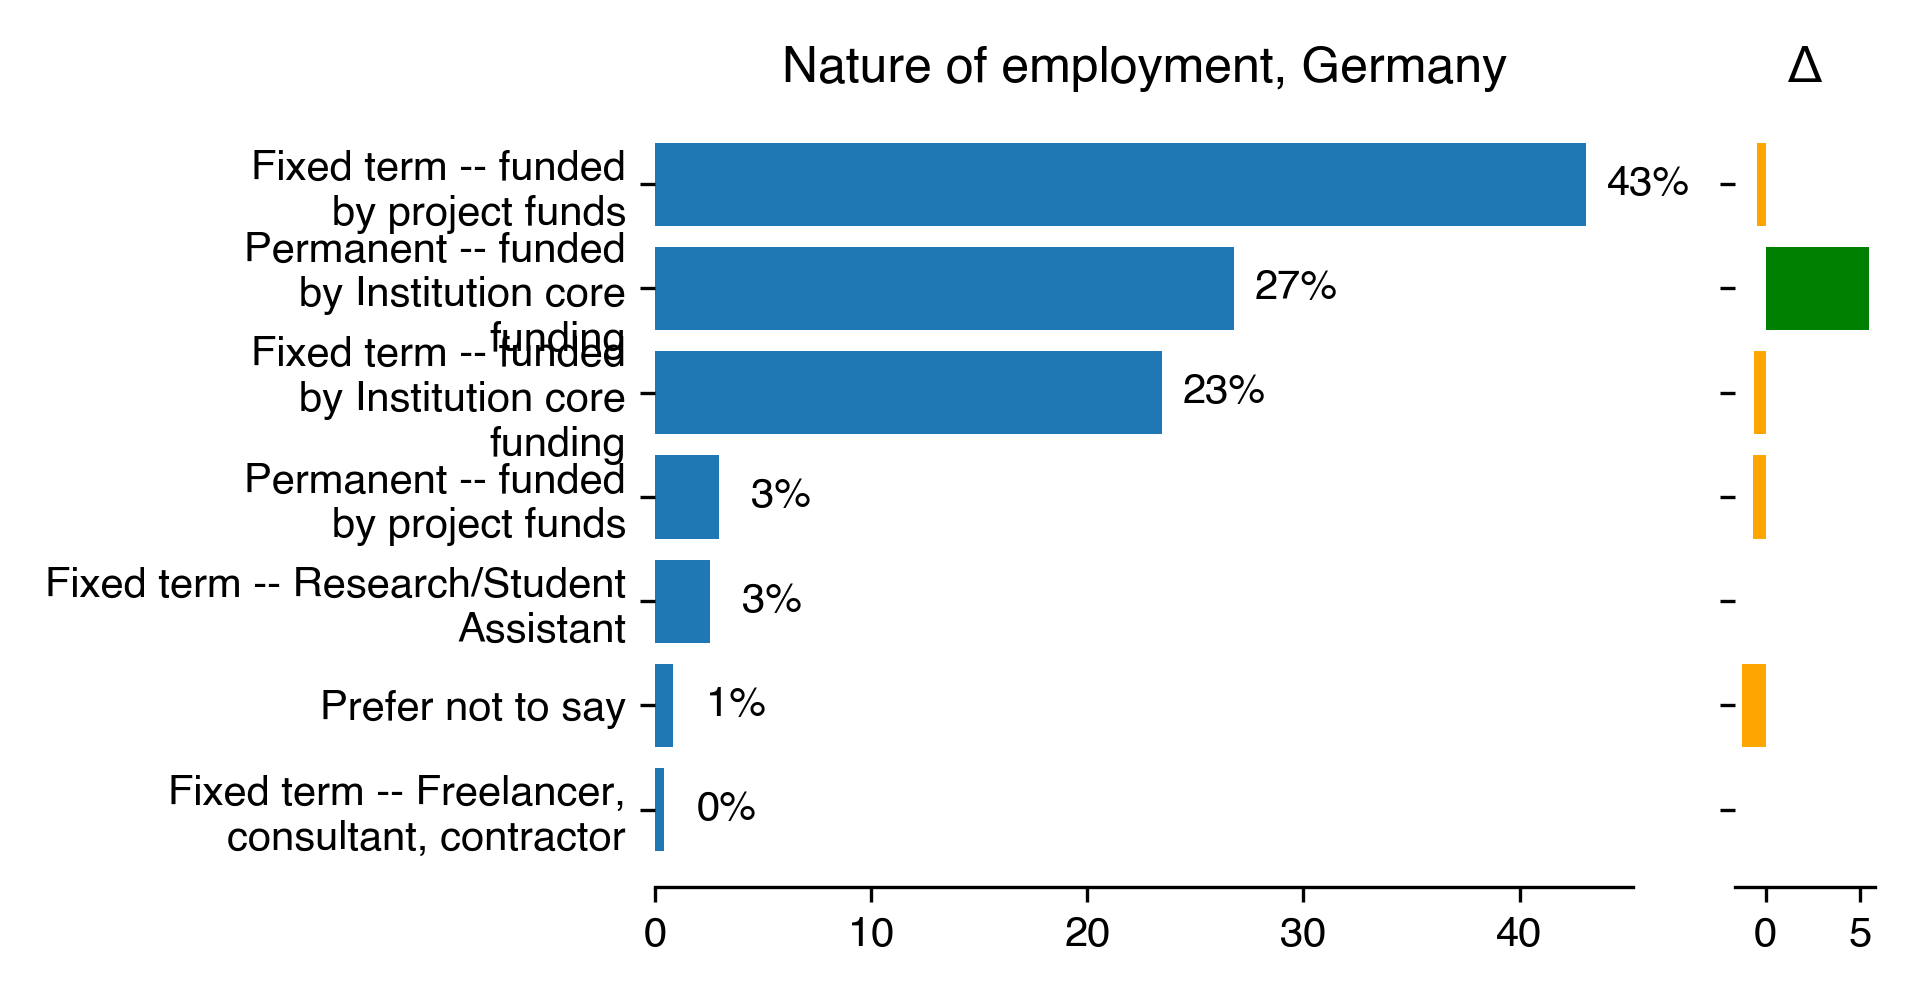
Type of contract
| Nature of employment for Germany | Count | Percentage | Percentage in 2018 | Difference with previous year |
|---|---|---|---|---|
| Fixed term – funded by project funds | 103 | 43.1 | 43.54 | -0.45 |
| Permanent – funded by Institution core funding | 64 | 26.78 | 21.32 | 5.46 |
| Fixed term – funded by Institution core funding | 56 | 23.43 | 24.02 | -0.59 |
| Permanent – funded by project funds | 7 | 2.93 | 3.6 | -0.67 |
| Fixed term – Research/Student Assistant | 6 | 2.51 | nan | nan |
| Prefer not to say | 2 | 0.84 | 2.1 | -1.27 |
| Fixed term – Freelancer, consultant, contractor | 1 | 0.42 | nan | nan |
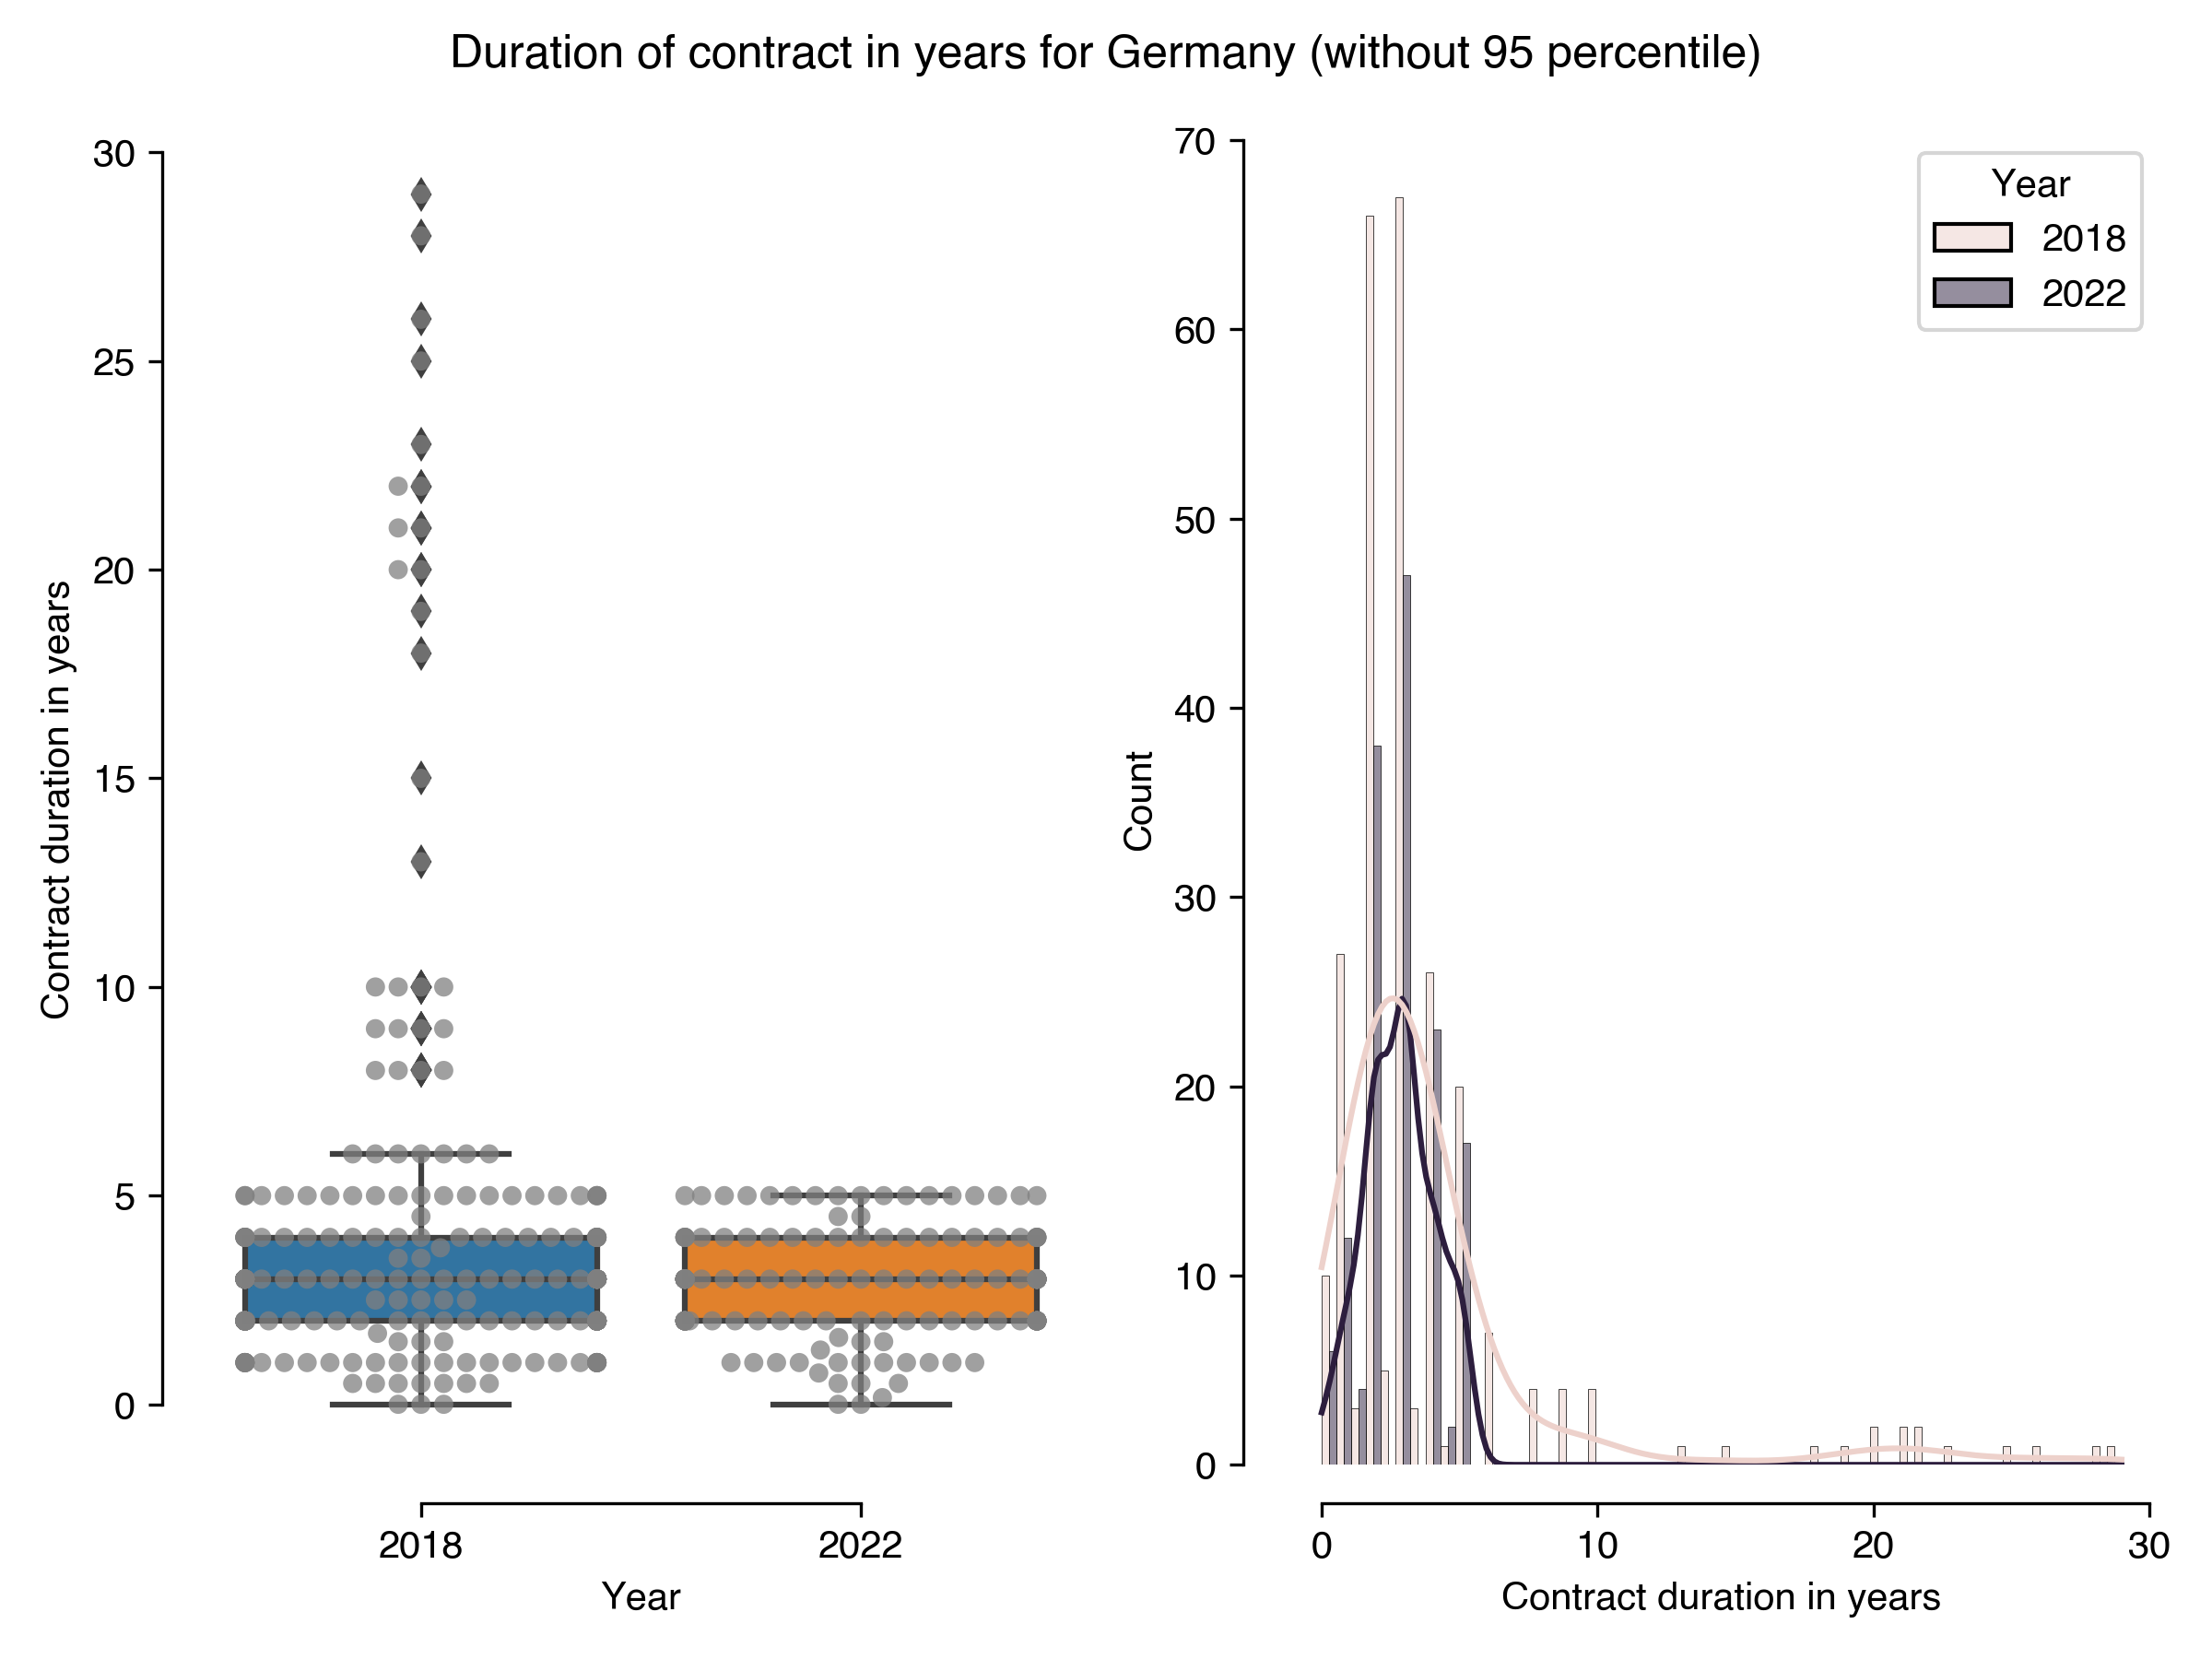
Length of current position
| Duration of contract in years for Germany (without 95 percentile) | Results in 2022 | Results in 2018 |
|---|---|---|
| count | 149 | 262 |
| mean | 2.83 | 4.09 |
| std | 1.25 | 4.77 |
| min | 0 | 0 |
| 25% | 2 | 2 |
| 50% | 3 | 3 |
| 75% | 4 | 4 |
| max | 5 | 29 |
Salary
| Annual salary for Germany | Count | Percentage | Percentage in 2018 | Difference with previous year |
|---|---|---|---|---|
| Less than 27.499 EUR | 8 | 3.92 | 9.49 | -5.57 |
| Between 27.500 and 32.999 EUR | 5 | 2.45 | 3.28 | -0.83 |
| Between 33.000 and 38.499 EUR | 12 | 5.88 | 5.84 | 0.04 |
| Between 38.500 and 43.999 EUR | 12 | 5.88 | 9.12 | -3.24 |
| Between 44.000 and 49.999 EUR | 11 | 5.39 | 13.87 | -8.48 |
| Between 50.000 and 54.999 EUR | 37 | 18.14 | 17.15 | 0.98 |
| Between 55.000 and 65.999 EUR | 60 | 29.41 | 17.15 | 12.26 |
| Between 66.000 and 76.999 EUR | 36 | 17.65 | 8.76 | 8.89 |
| Between 77.000 and 109.999 EUR | 15 | 7.35 | 4.38 | 2.97 |
| More than 110.000 EUR | 1 | 0.49 | nan | nan |
| Prefer not to say | 7 | 3.43 | 10.95 | -7.52 |
Funding
| Type of funding for Germany | Count | Percentage | Percentage in 2018 | Difference with previous year |
|---|---|---|---|---|
| Grants | 110 | 42.64 | 30.93 | 11.7 |
| Institutional support | 96 | 37.21 | 42.34 | -5.13 |
| Industry support | 13 | 5.04 | 11.71 | -6.67 |
| other. Which of the following sources are used to pay for your effort as a Research Software Engineer? | 10 | 3.88 | 0 | 3.88 |
| Consulting & services | 10 | 3.88 | 5.71 | -1.83 |
| Foundations & consortiums | 7 | 2.71 | 1.5 | 1.21 |
| Dual license | 1 | 0.39 | 0.3 | 0.09 |
| Donation button | 1 | 0.39 | 0.3 | 0.09 |
| I volunteer my time | 0 | 0 | 26.73 | -26.73 |
| Membership | 0 | 0 | 0.6 | -0.6 |
| SaaS | 0 | 0 | 0.3 | -0.3 |
| Books & merchandise | 0 | 0 | 0.3 | -0.3 |
Job title
Netherlands
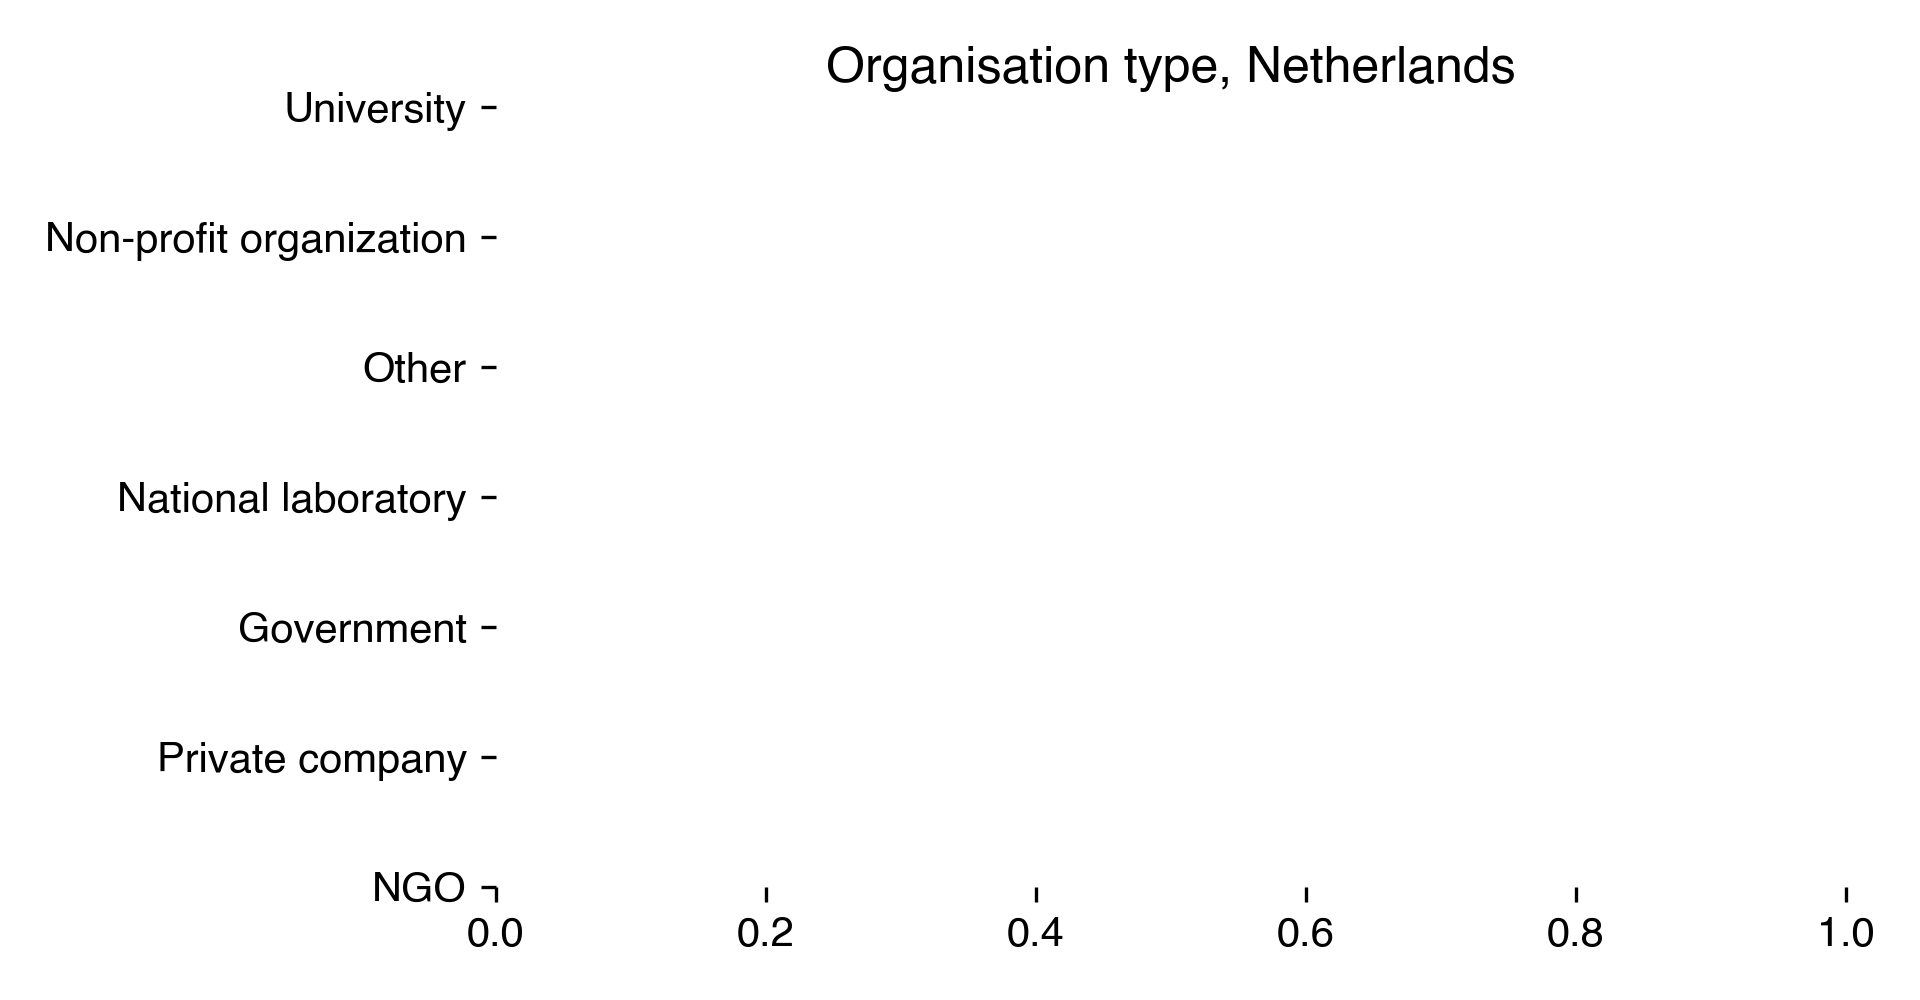
Type of organization
| Organisation type for Netherlands | Percentage in 2018 |
|---|---|
| University | 53.7 |
| Non-profit organization | 14.81 |
| Other | 11.11 |
| National laboratory | 7.41 |
| Government | 7.41 |
| Private company | 3.7 |
| NGO | 1.85 |
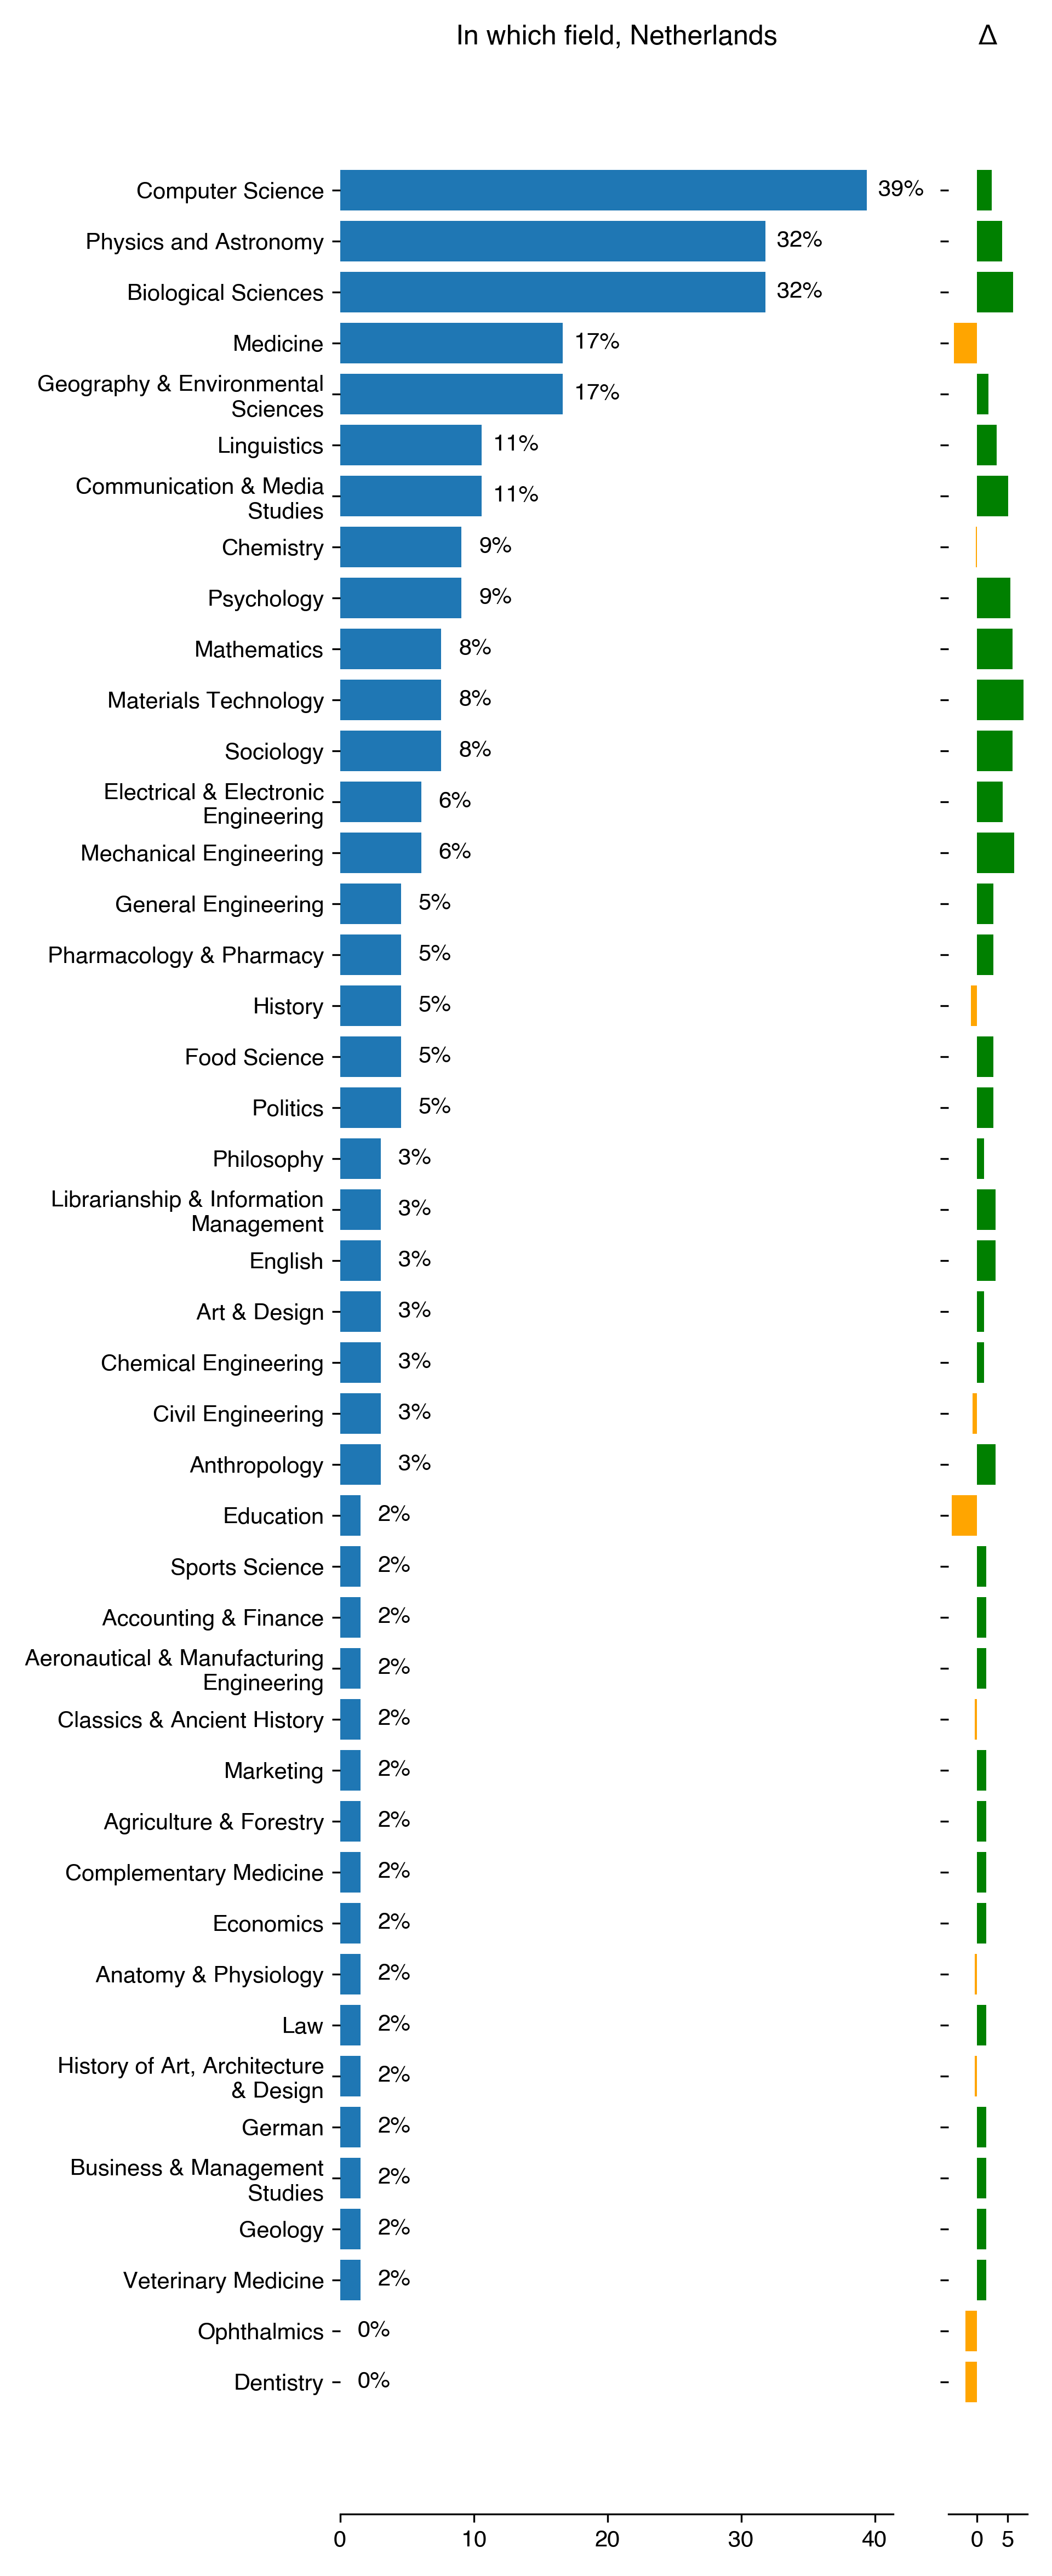
In which field are you working
| In which field for Netherlands | Count | Percentage | Percentage in 2018 | Difference with previous year |
|---|---|---|---|---|
| Computer Science | 26 | 39.39 | 37.04 | 2.36 |
| Physics and Astronomy | 21 | 31.82 | 27.78 | 4.04 |
| Biological Sciences | 21 | 31.82 | 25.93 | 5.89 |
| Medicine | 11 | 16.67 | 20.37 | -3.7 |
| Geography & Environmental Sciences | 11 | 16.67 | 14.81 | 1.85 |
| Linguistics | 7 | 10.61 | 7.41 | 3.2 |
| Communication & Media Studies | 7 | 10.61 | 5.56 | 5.05 |
| Chemistry | 6 | 9.09 | 9.26 | -0.17 |
| Psychology | 6 | 9.09 | 3.7 | 5.39 |
| Mathematics | 5 | 7.58 | 1.85 | 5.72 |
| Materials Technology | 5 | 7.58 | 0 | 7.58 |
| Sociology | 5 | 7.58 | 1.85 | 5.72 |
| Electrical & Electronic Engineering | 4 | 6.06 | 1.85 | 4.21 |
| Mechanical Engineering | 4 | 6.06 | 0 | 6.06 |
| General Engineering | 3 | 4.55 | 1.85 | 2.69 |
| Pharmacology & Pharmacy | 3 | 4.55 | 1.85 | 2.69 |
| History | 3 | 4.55 | 5.56 | -1.01 |
| Food Science | 3 | 4.55 | 1.85 | 2.69 |
| Politics | 3 | 4.55 | 1.85 | 2.69 |
| Philosophy | 2 | 3.03 | 1.85 | 1.18 |
| Librarianship & Information Management | 2 | 3.03 | 0 | 3.03 |
| English | 2 | 3.03 | 0 | 3.03 |
| Art & Design | 2 | 3.03 | 1.85 | 1.18 |
| Chemical Engineering | 2 | 3.03 | 1.85 | 1.18 |
| Civil Engineering | 2 | 3.03 | 3.7 | -0.67 |
| Anthropology | 2 | 3.03 | 0 | 3.03 |
| Education | 1 | 1.52 | 5.56 | -4.04 |
| Sports Science | 1 | 1.52 | 0 | 1.52 |
| Accounting & Finance | 1 | 1.52 | 0 | 1.52 |
| Aeronautical & Manufacturing Engineering | 1 | 1.52 | 0 | 1.52 |
| Classics & Ancient History | 1 | 1.52 | 1.85 | -0.34 |
| Marketing | 1 | 1.52 | 0 | 1.52 |
| Agriculture & Forestry | 1 | 1.52 | 0 | 1.52 |
| Complementary Medicine | 1 | 1.52 | 0 | 1.52 |
| Economics | 1 | 1.52 | 0 | 1.52 |
| Anatomy & Physiology | 1 | 1.52 | 1.85 | -0.34 |
| Law | 1 | 1.52 | 0 | 1.52 |
| History of Art, Architecture & Design | 1 | 1.52 | 1.85 | -0.34 |
| German | 1 | 1.52 | 0 | 1.52 |
| Business & Management Studies | 1 | 1.52 | 0 | 1.52 |
| Geology | 1 | 1.52 | 0 | 1.52 |
| Veterinary Medicine | 1 | 1.52 | 0 | 1.52 |
| Ophthalmics | 0 | 0 | 1.85 | -1.85 |
| Dentistry | 0 | 0 | 1.85 | -1.85 |
Which university or organization
No data found in survey.
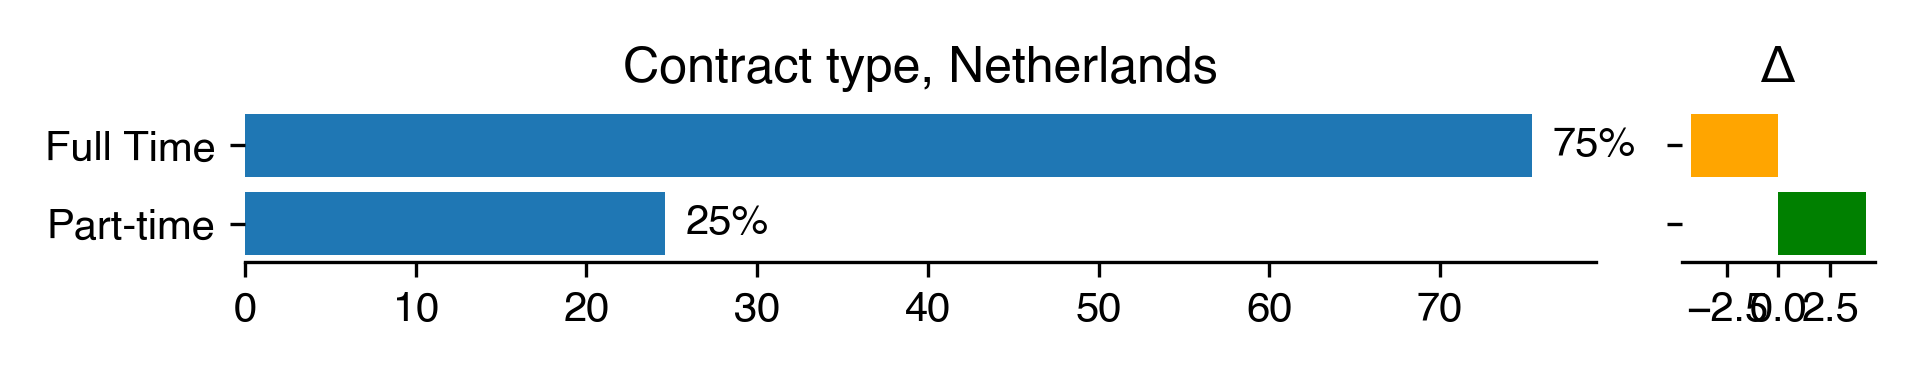
Full time or part-time
| Contract type for Netherlands | Count | Percentage | Percentage in 2018 | Difference with previous year |
|---|---|---|---|---|
| Full Time | 49 | 75.38 | 79.63 | -4.25 |
| Part-time | 16 | 24.62 | 20.37 | 4.25 |
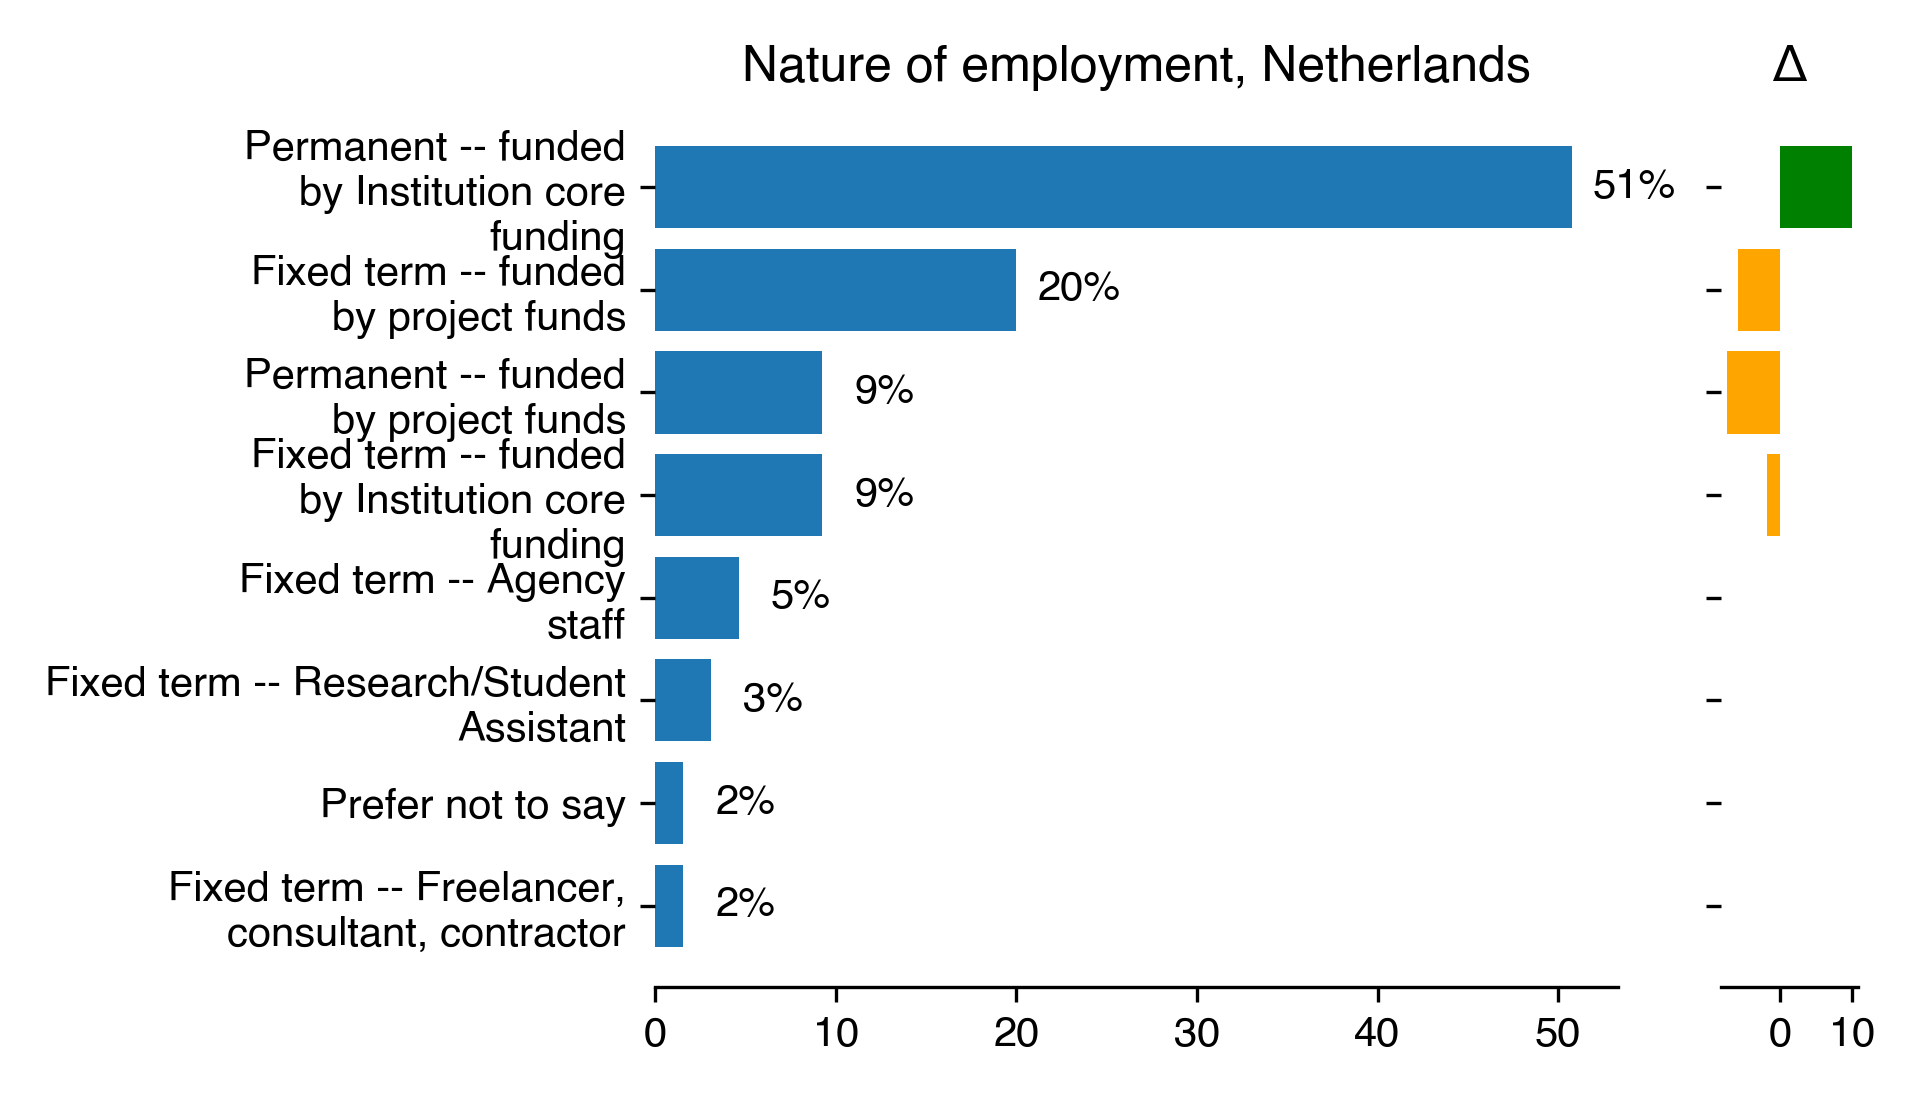
Type of contract
| Nature of employment for Netherlands | Count | Percentage | Percentage in 2018 | Difference with previous year |
|---|---|---|---|---|
| Permanent – funded by Institution core funding | 33 | 50.77 | 40.74 | 10.03 |
| Fixed term – funded by project funds | 13 | 20 | 25.93 | -5.93 |
| Permanent – funded by project funds | 6 | 9.23 | 16.67 | -7.44 |
| Fixed term – funded by Institution core funding | 6 | 9.23 | 11.11 | -1.88 |
| Fixed term – Agency staff | 3 | 4.62 | nan | nan |
| Fixed term – Research/Student Assistant | 2 | 3.08 | nan | nan |
| Prefer not to say | 1 | 1.54 | nan | nan |
| Fixed term – Freelancer, consultant, contractor | 1 | 1.54 | nan | nan |
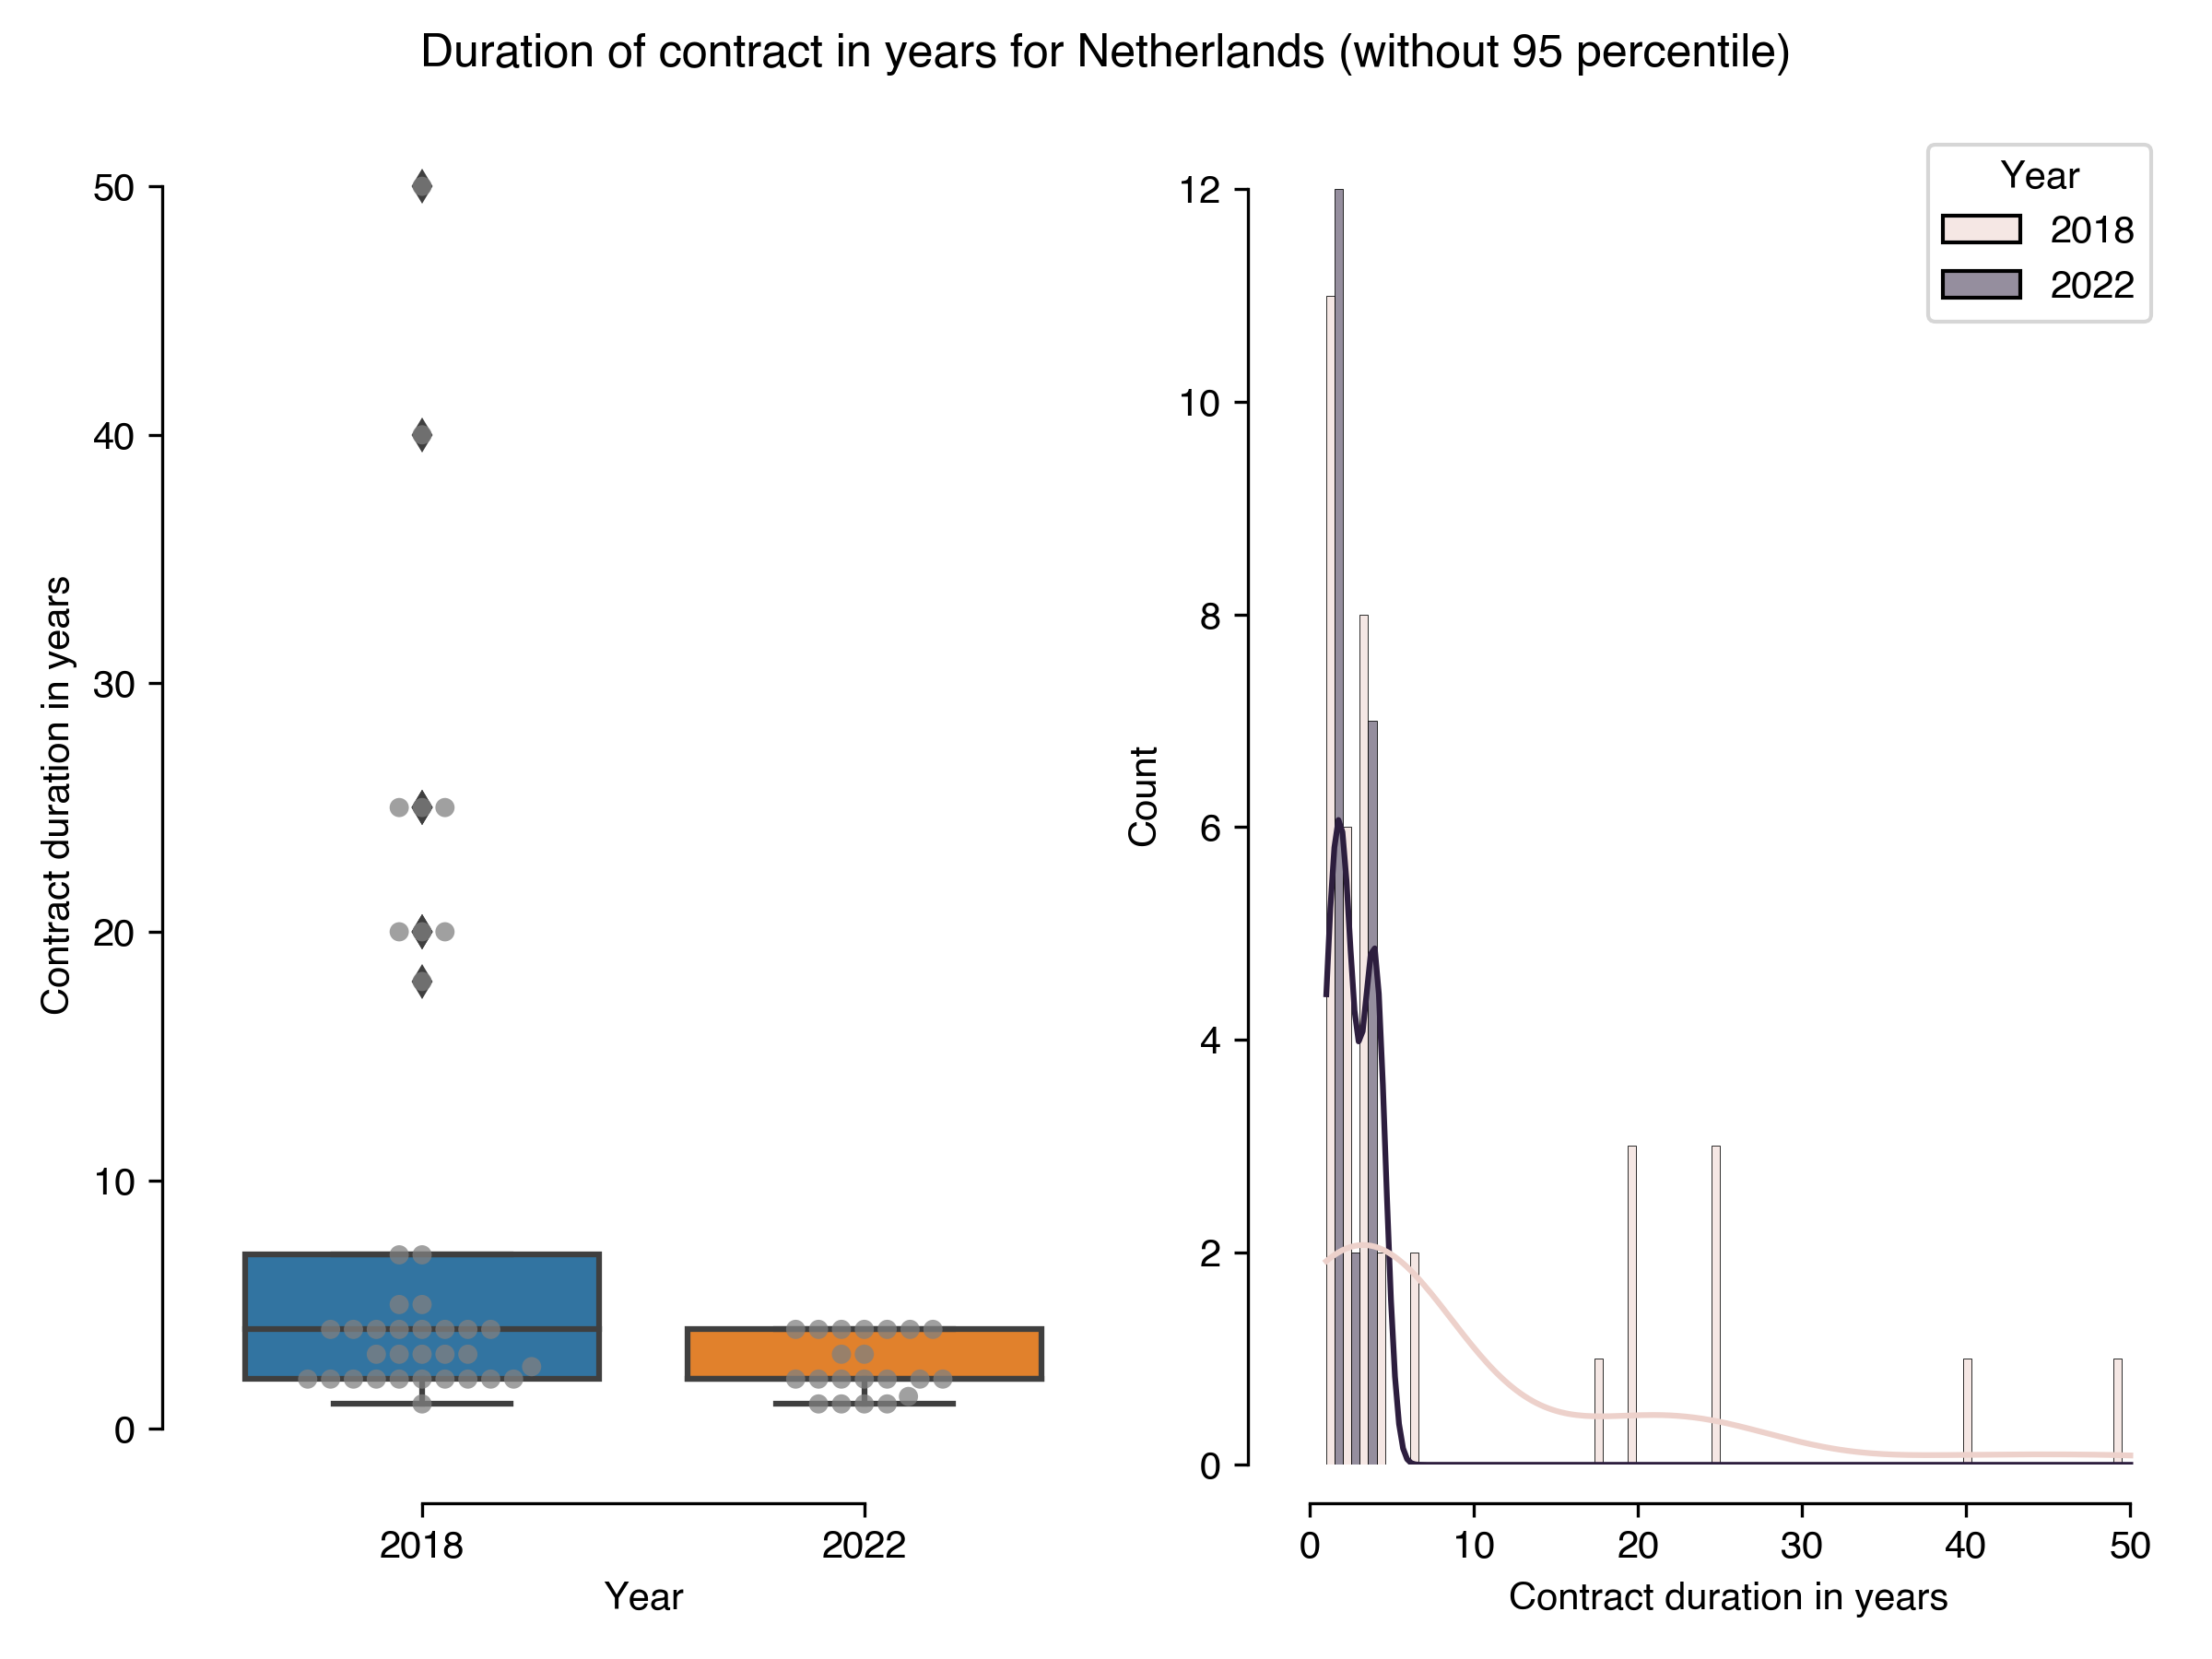
Length of current position
| Duration of contract in years for Netherlands (without 95 percentile) | Results in 2022 | Results in 2018 |
|---|---|---|
| count | 21 | 38 |
| mean | 2.54 | 8.88 |
| std | 1.19 | 11.47 |
| min | 1 | 1 |
| 25% | 2 | 2 |
| 50% | 2 | 4 |
| 75% | 4 | 7 |
| max | 4 | 50 |
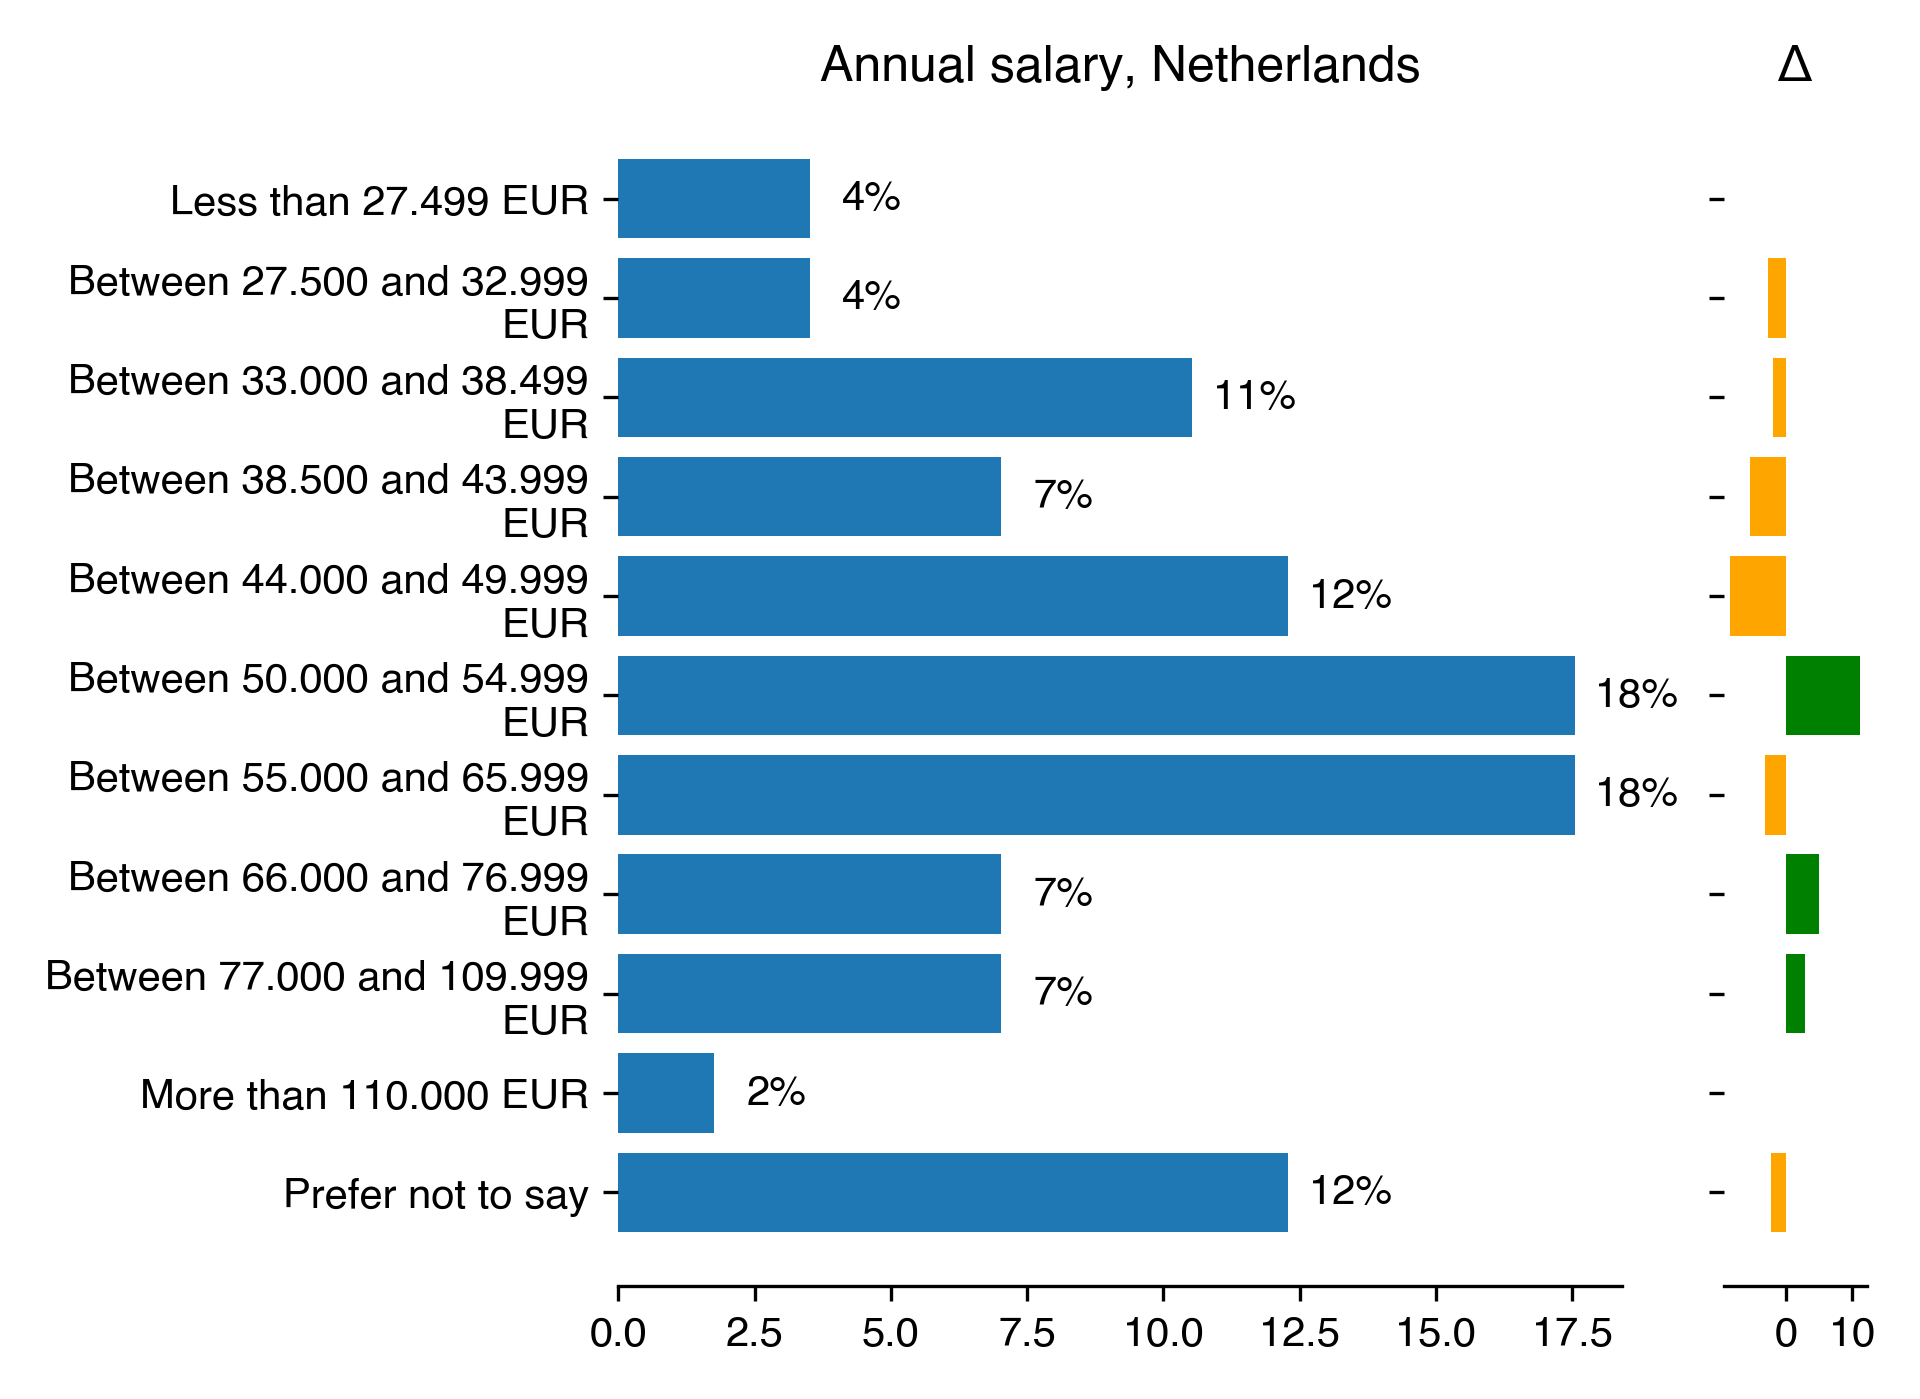
Salary
| Annual salary for Netherlands | Count | Percentage | Percentage in 2018 | Difference with previous year |
|---|---|---|---|---|
| Less than 27.499 EUR | 2 | 3.51 | nan | nan |
| Between 27.500 and 32.999 EUR | 2 | 3.51 | 6.25 | -2.74 |
| Between 33.000 and 38.499 EUR | 6 | 10.53 | 12.5 | -1.97 |
| Between 38.500 and 43.999 EUR | 4 | 7.02 | 12.5 | -5.48 |
| Between 44.000 and 49.999 EUR | 7 | 12.28 | 20.83 | -8.55 |
| Between 50.000 and 54.999 EUR | 10 | 17.54 | 6.25 | 11.29 |
| Between 55.000 and 65.999 EUR | 10 | 17.54 | 20.83 | -3.29 |
| Between 66.000 and 76.999 EUR | 4 | 7.02 | 2.08 | 4.93 |
| Between 77.000 and 109.999 EUR | 4 | 7.02 | 4.17 | 2.85 |
| More than 110.000 EUR | 1 | 1.75 | nan | nan |
| Prefer not to say | 7 | 12.28 | 14.58 | -2.3 |
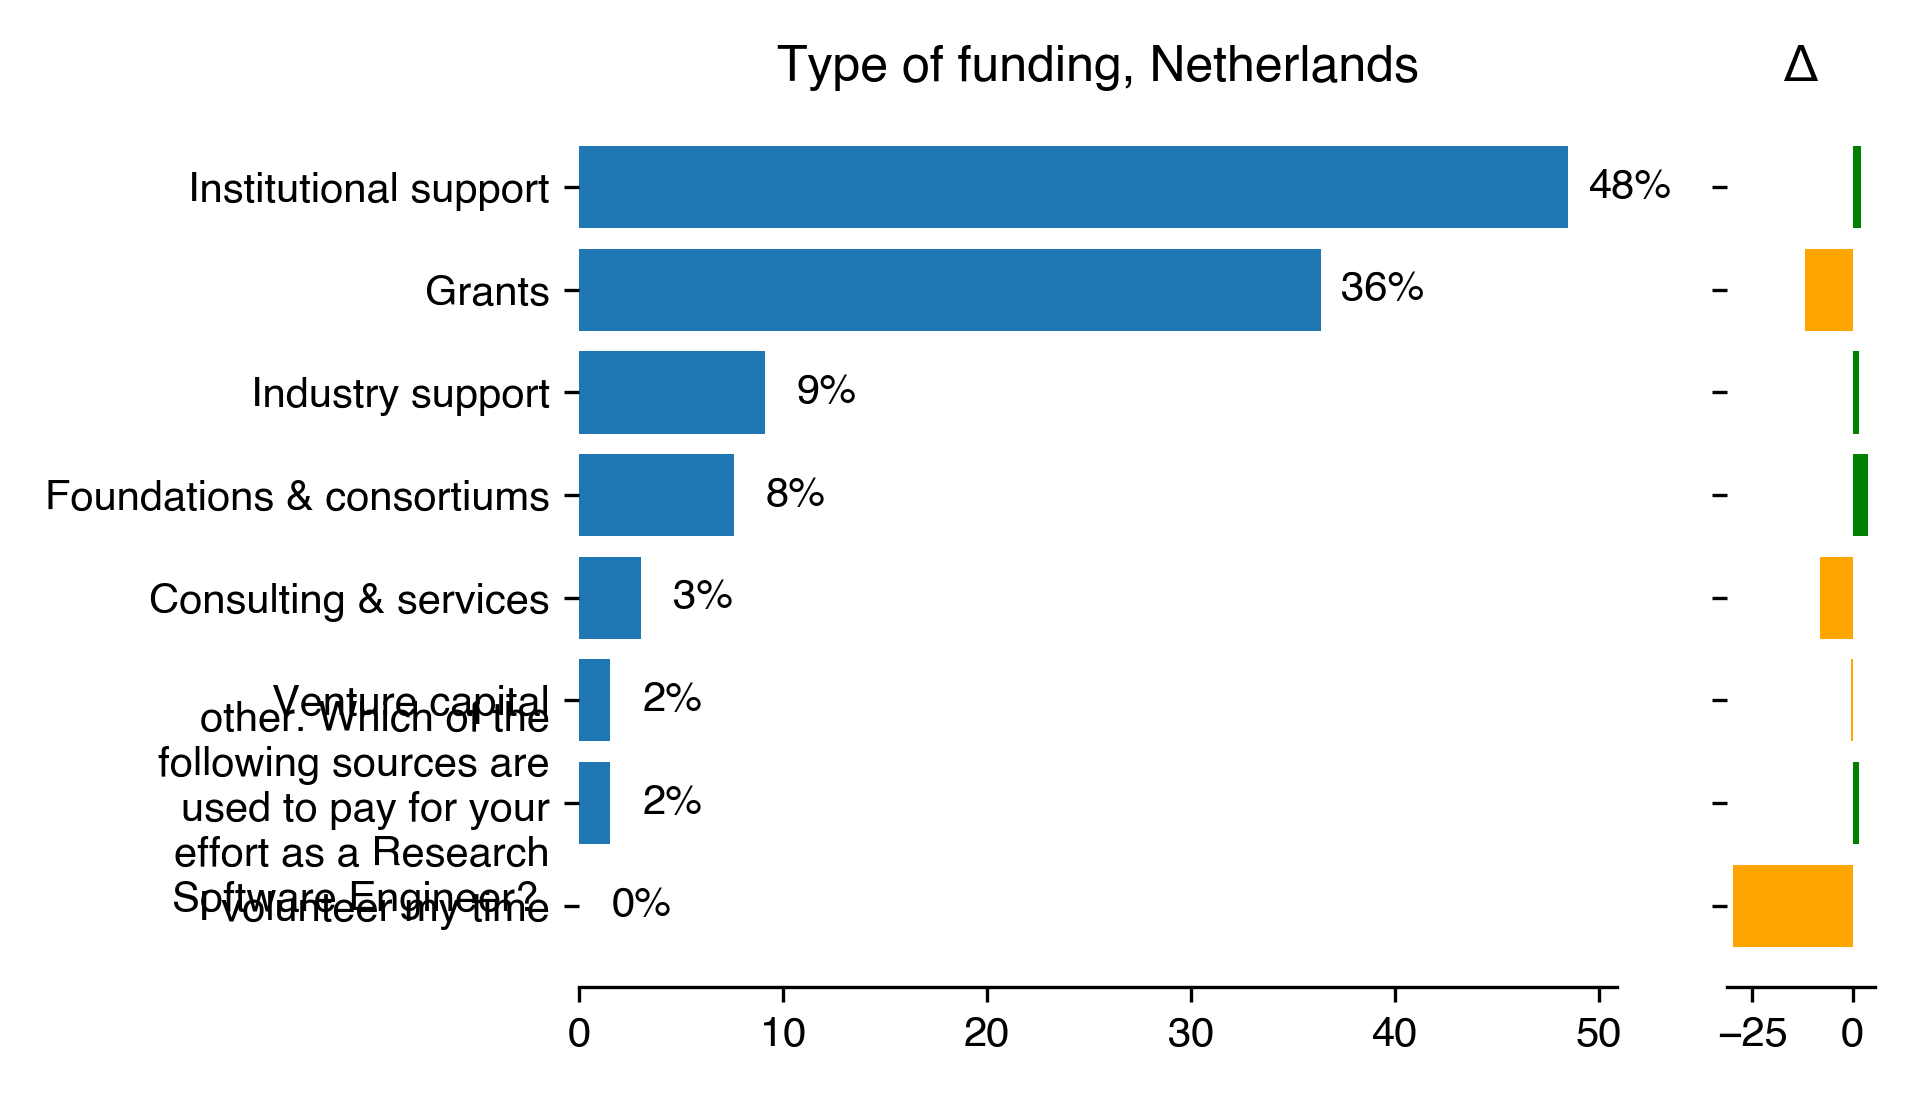
Funding
| Type of funding for Netherlands | Count | Percentage | Percentage in 2018 | Difference with previous year |
|---|---|---|---|---|
| Institutional support | 32 | 48.48 | 46.3 | 2.19 |
| Grants | 24 | 36.36 | 48.15 | -11.78 |
| Industry support | 6 | 9.09 | 7.41 | 1.68 |
| Foundations & consortiums | 5 | 7.58 | 3.7 | 3.87 |
| Consulting & services | 2 | 3.03 | 11.11 | -8.08 |
| Venture capital | 1 | 1.52 | 1.85 | -0.34 |
| other. Which of the following sources are used to pay for your effort as a Research Software Engineer? | 1 | 1.52 | 0 | 1.52 |
| I volunteer my time | 0 | 0 | 29.63 | -29.63 |
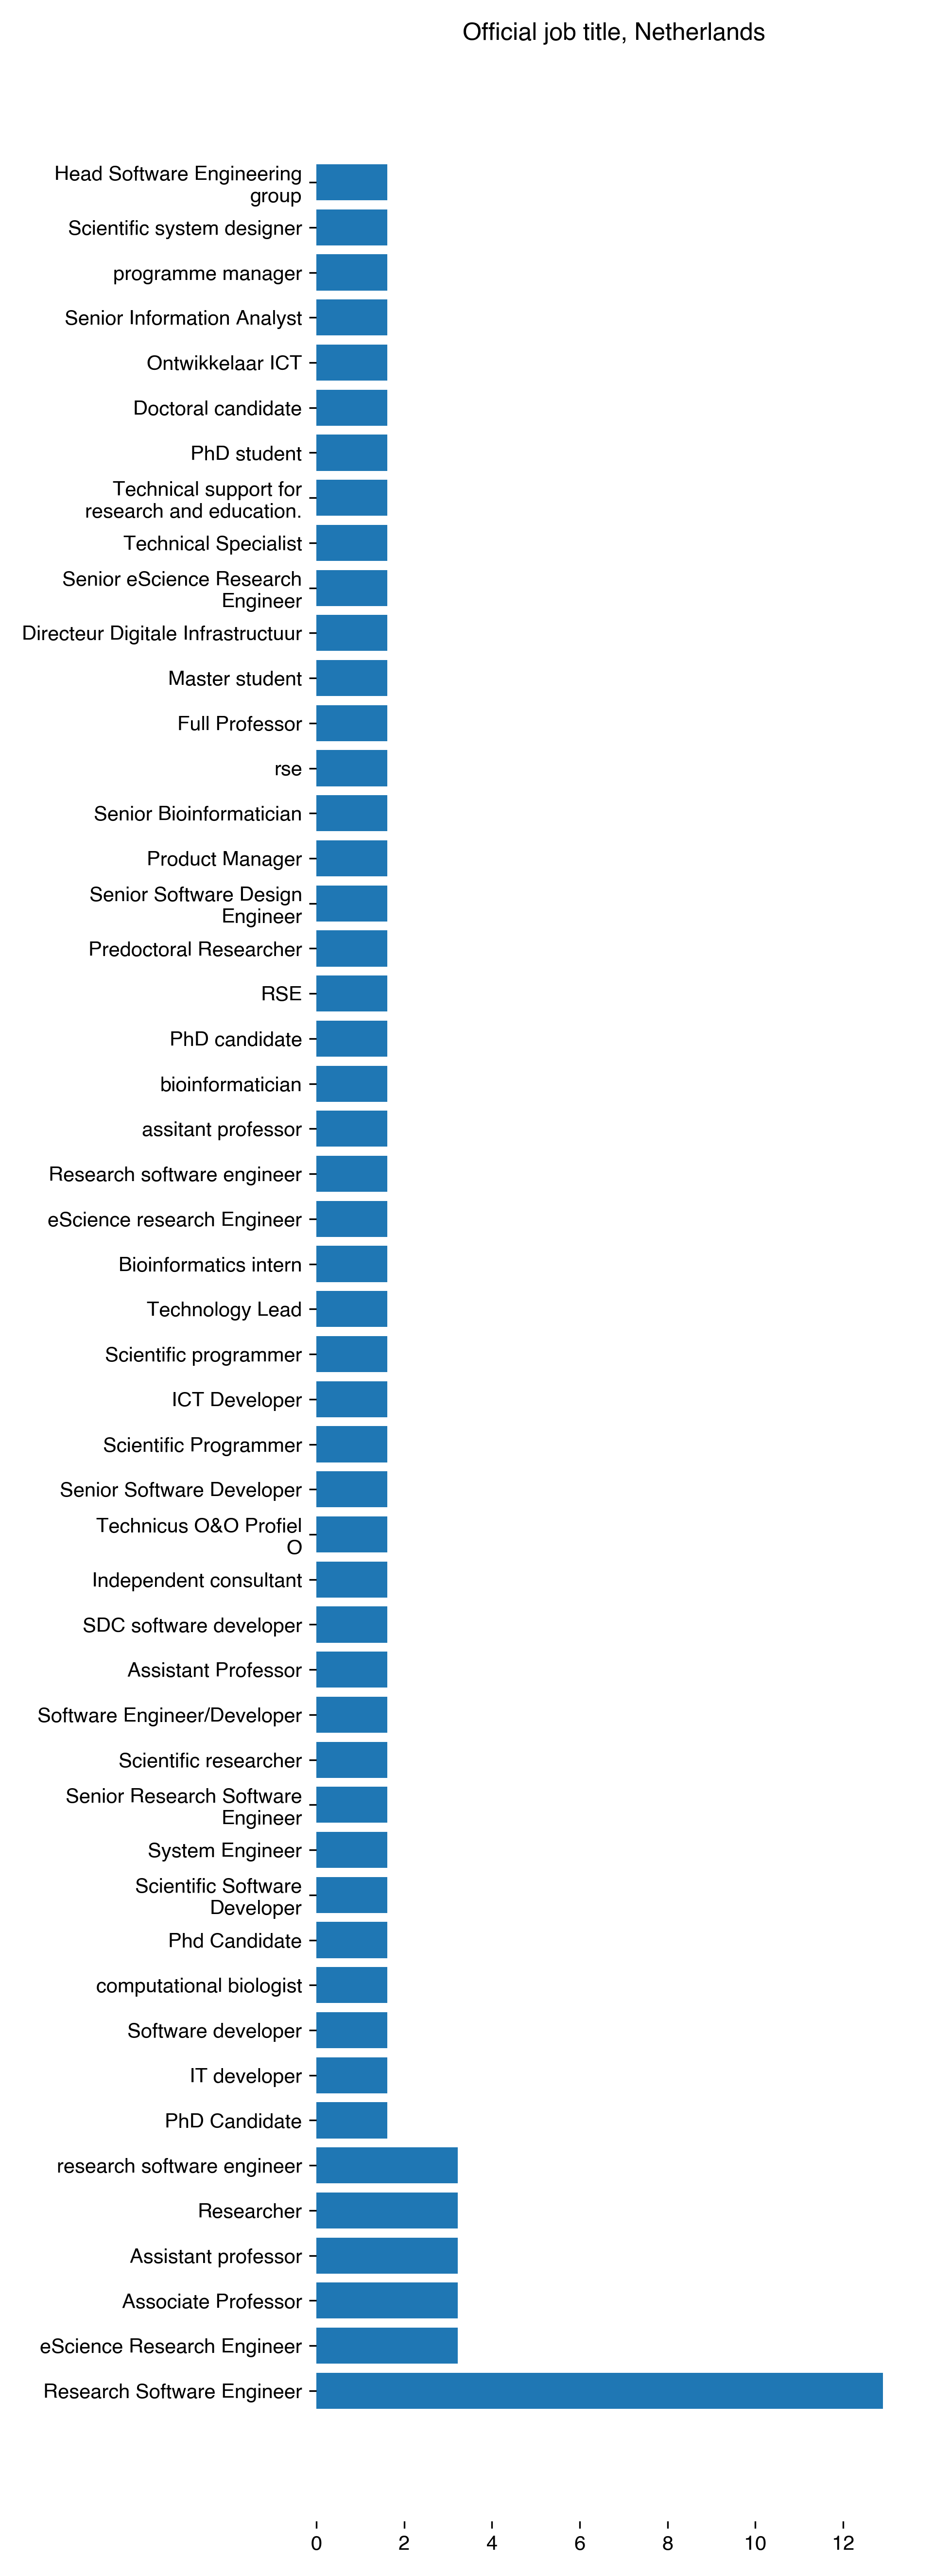
Job title
New Zealand
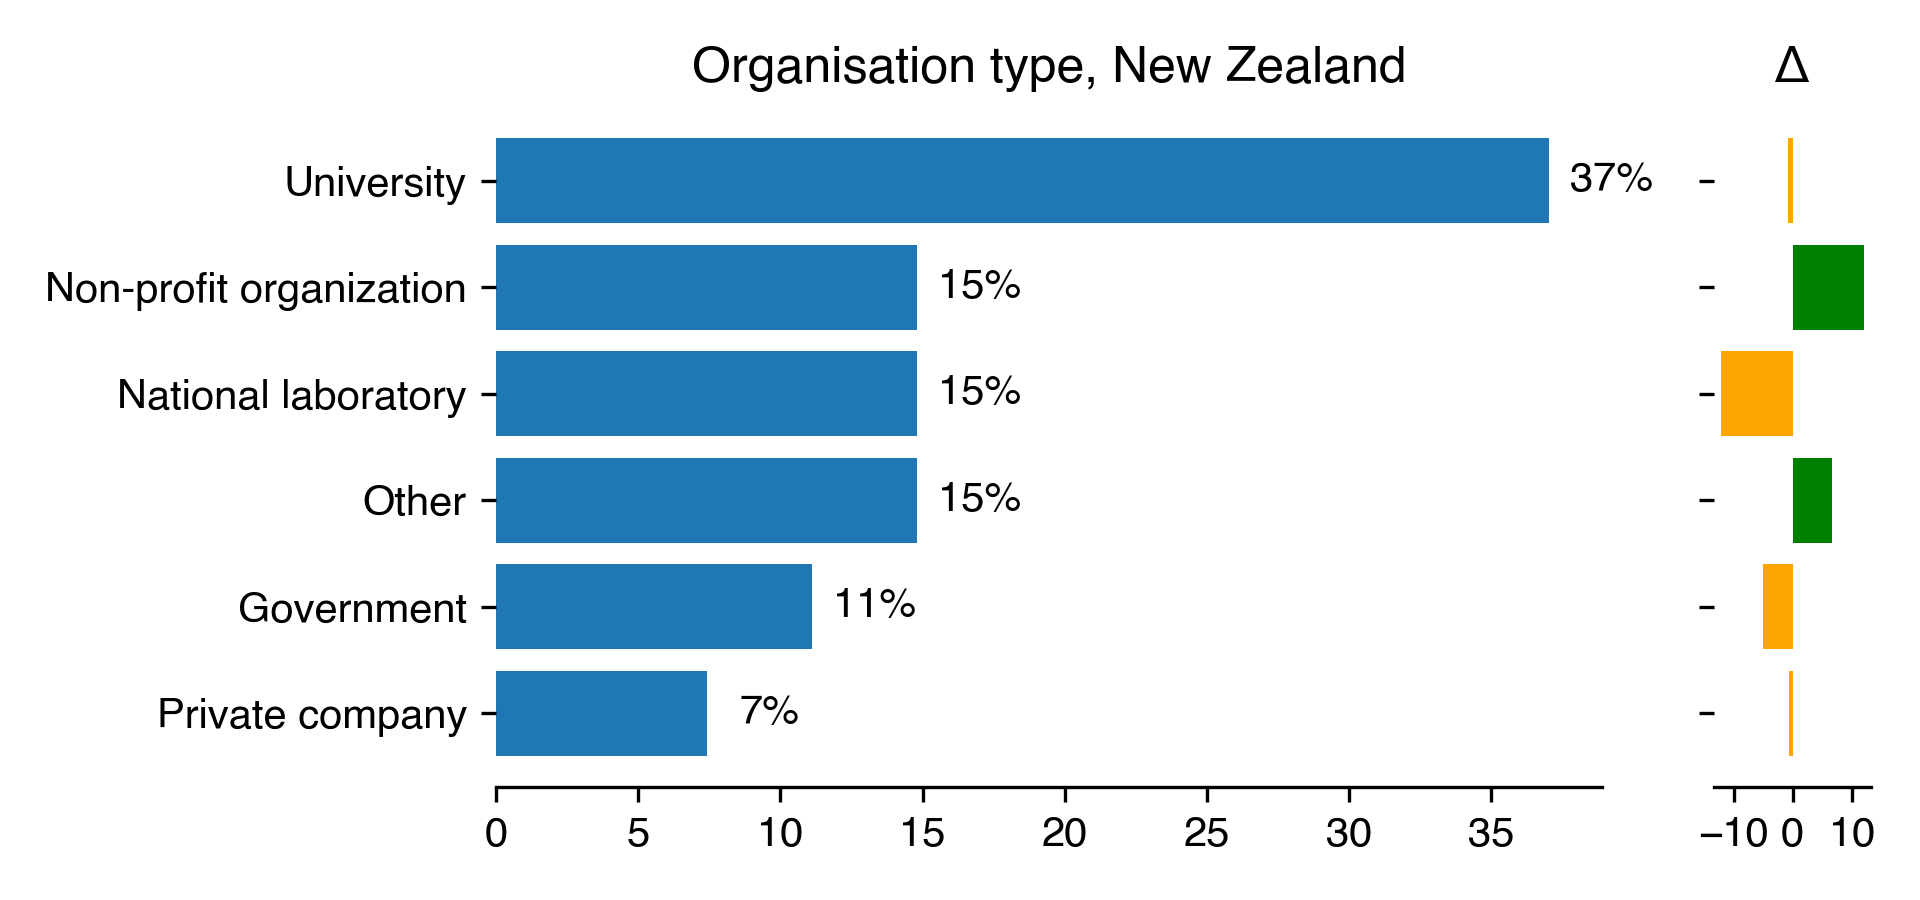
Type of organization
| Organisation type for New Zealand | Count | Percentage | Percentage in 2018 | Difference with previous year |
|---|---|---|---|---|
| University | 10 | 37.04 | 37.84 | -0.8 |
| Non-profit organization | 4 | 14.81 | 2.7 | 12.11 |
| National laboratory | 4 | 14.81 | 27.03 | -12.21 |
| Other | 4 | 14.81 | 8.11 | 6.71 |
| Government | 3 | 11.11 | 16.22 | -5.11 |
| Private company | 2 | 7.41 | 8.11 | -0.7 |
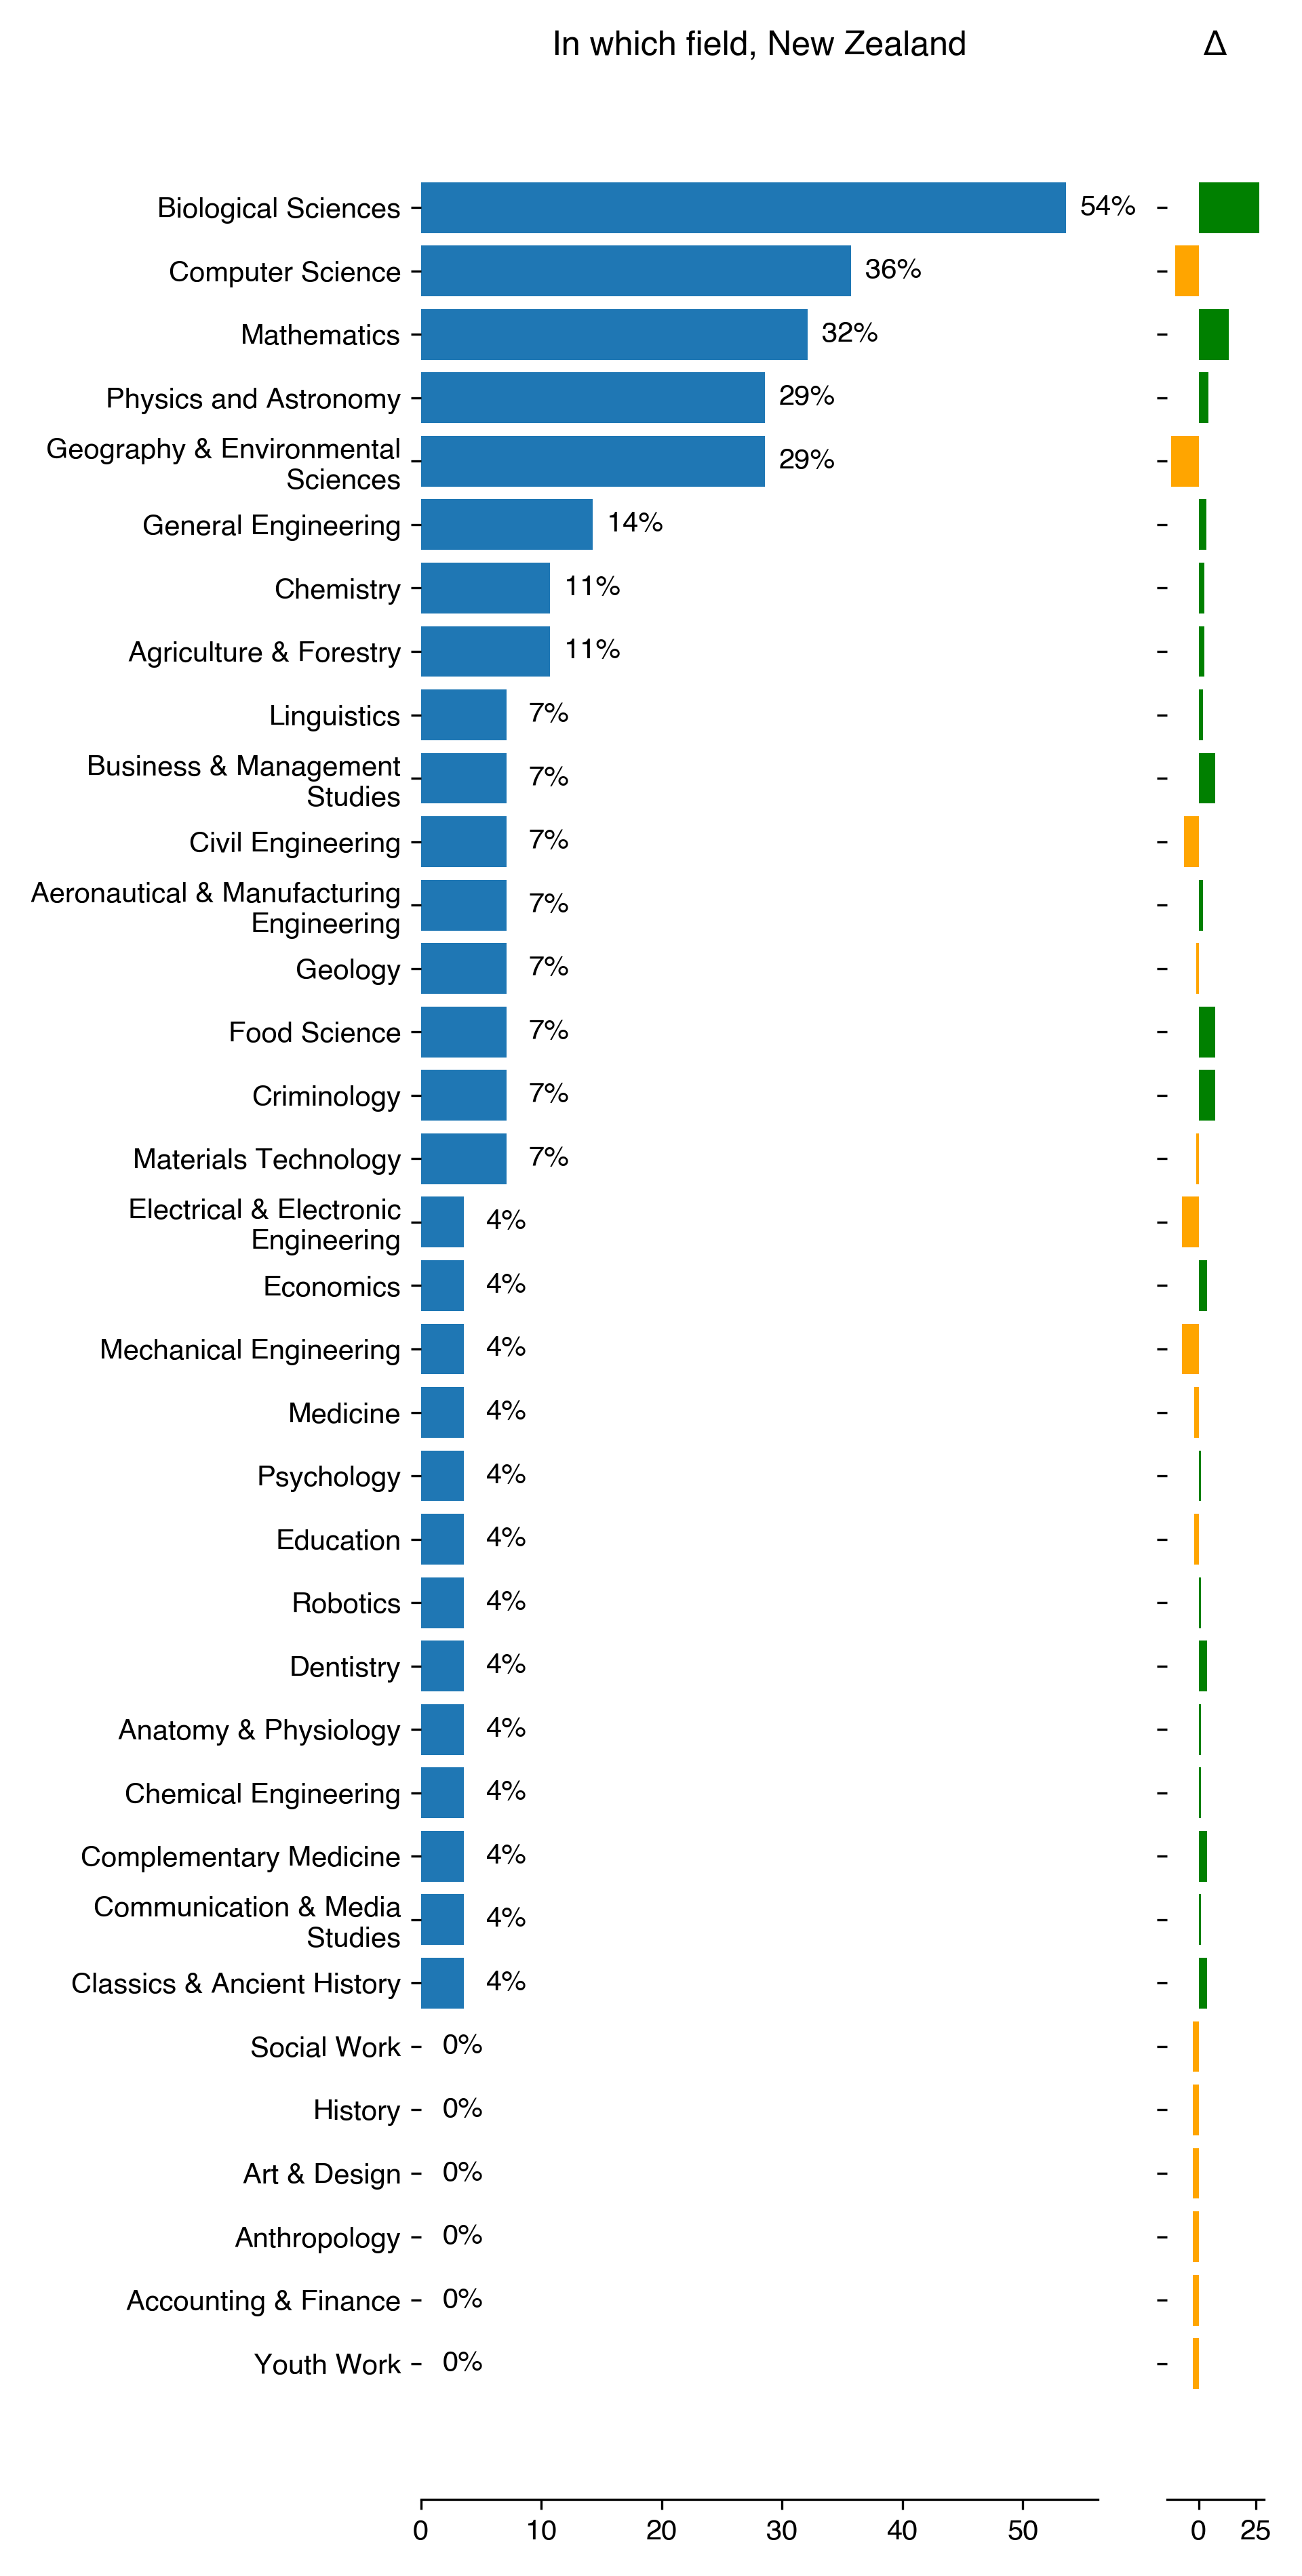
In which field are you working
| In which field for New Zealand | Count | Percentage | Percentage in 2018 | Difference with previous year |
|---|---|---|---|---|
| Biological Sciences | 15 | 53.57 | 27.03 | 26.54 |
| Computer Science | 10 | 35.71 | 45.95 | -10.23 |
| Mathematics | 9 | 32.14 | 18.92 | 13.22 |
| Physics and Astronomy | 8 | 28.57 | 24.32 | 4.25 |
| Geography & Environmental Sciences | 8 | 28.57 | 40.54 | -11.97 |
| General Engineering | 4 | 14.29 | 10.81 | 3.47 |
| Chemistry | 3 | 10.71 | 8.11 | 2.61 |
| Agriculture & Forestry | 3 | 10.71 | 8.11 | 2.61 |
| Linguistics | 2 | 7.14 | 5.41 | 1.74 |
| Business & Management Studies | 2 | 7.14 | 0 | 7.14 |
| Civil Engineering | 2 | 7.14 | 13.51 | -6.37 |
| Aeronautical & Manufacturing Engineering | 2 | 7.14 | 5.41 | 1.74 |
| Geology | 2 | 7.14 | 8.11 | -0.97 |
| Food Science | 2 | 7.14 | 0 | 7.14 |
| Criminology | 2 | 7.14 | 0 | 7.14 |
| Materials Technology | 2 | 7.14 | 8.11 | -0.97 |
| Electrical & Electronic Engineering | 1 | 3.57 | 10.81 | -7.24 |
| Economics | 1 | 3.57 | 0 | 3.57 |
| Mechanical Engineering | 1 | 3.57 | 10.81 | -7.24 |
| Medicine | 1 | 3.57 | 5.41 | -1.83 |
| Psychology | 1 | 3.57 | 2.7 | 0.87 |
| Education | 1 | 3.57 | 5.41 | -1.83 |
| Robotics | 1 | 3.57 | 2.7 | 0.87 |
| Dentistry | 1 | 3.57 | 0 | 3.57 |
| Anatomy & Physiology | 1 | 3.57 | 2.7 | 0.87 |
| Chemical Engineering | 1 | 3.57 | 2.7 | 0.87 |
| Complementary Medicine | 1 | 3.57 | 0 | 3.57 |
| Communication & Media Studies | 1 | 3.57 | 2.7 | 0.87 |
| Classics & Ancient History | 1 | 3.57 | 0 | 3.57 |
| Social Work | 0 | 0 | 2.7 | -2.7 |
| History | 0 | 0 | 2.7 | -2.7 |
| Art & Design | 0 | 0 | 2.7 | -2.7 |
| Anthropology | 0 | 0 | 2.7 | -2.7 |
| Accounting & Finance | 0 | 0 | 2.7 | -2.7 |
| Youth Work | 0 | 0 | 2.7 | -2.7 |
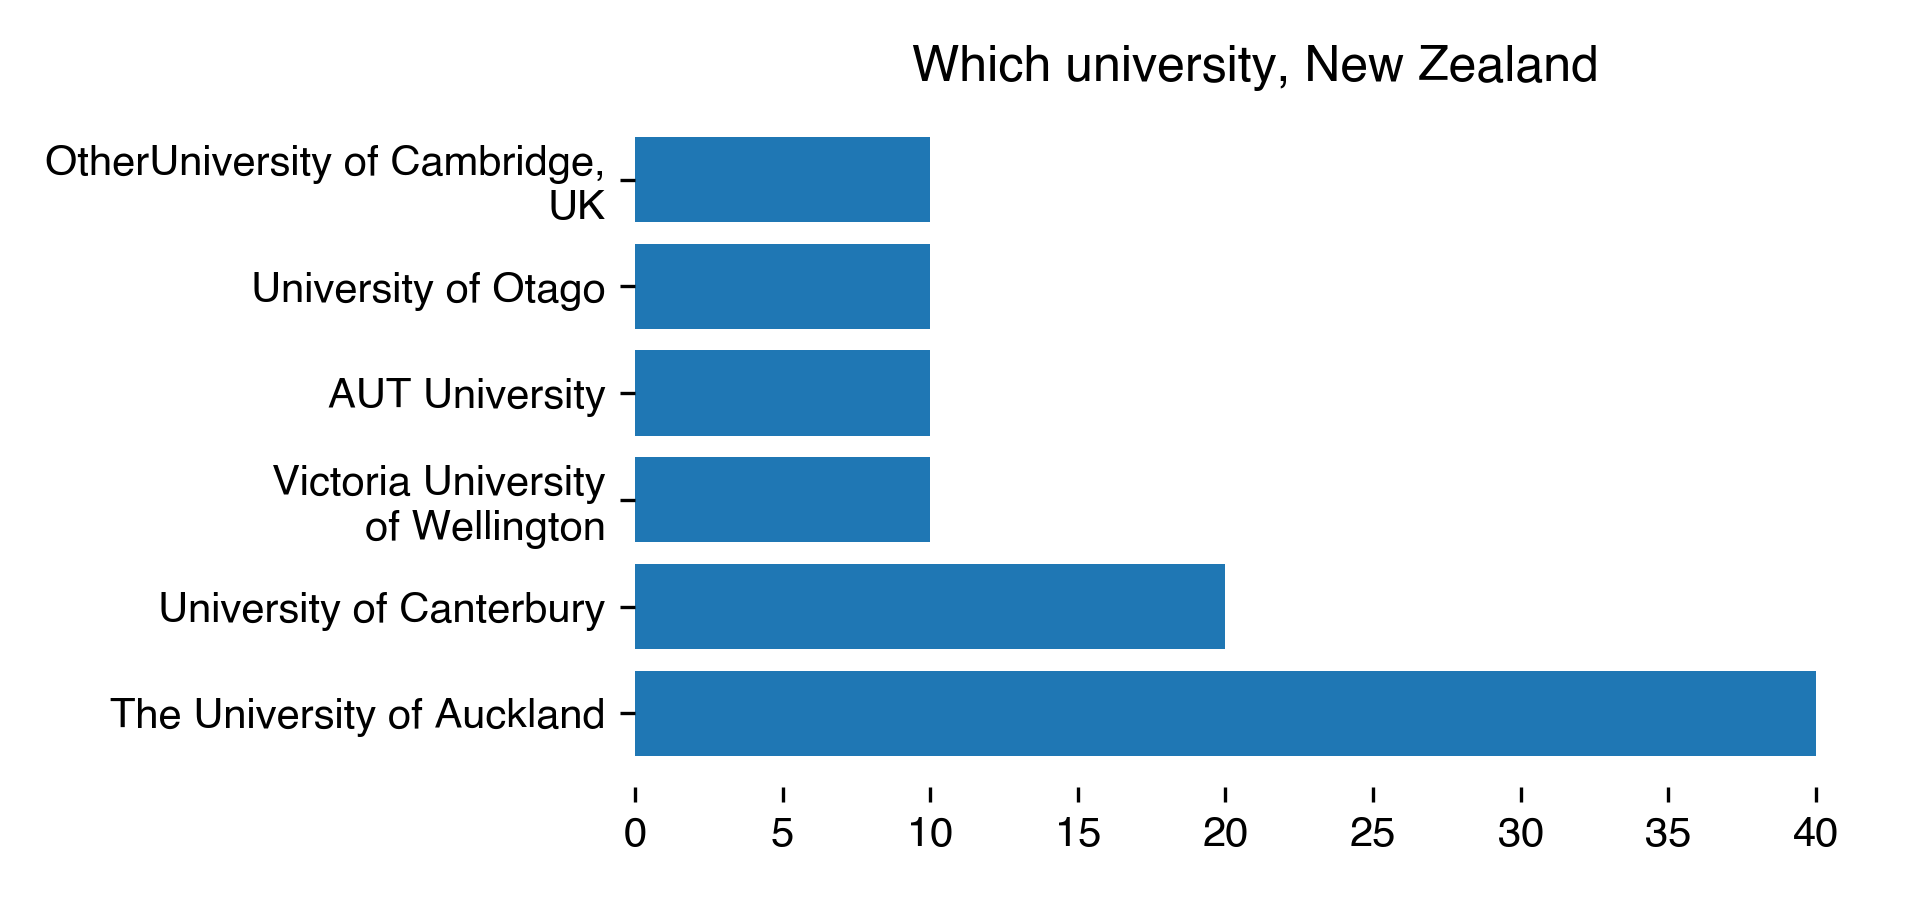
Which university or organization
| Which university for New Zealand | Count | Percentage |
|---|---|---|
| The University of Auckland | 4 | 40 |
| University of Canterbury | 2 | 20 |
| OtherUniversity of Cambridge, UK | 1 | 10 |
| University of Otago | 1 | 10 |
| AUT University | 1 | 10 |
| Victoria University of Wellington | 1 | 10 |
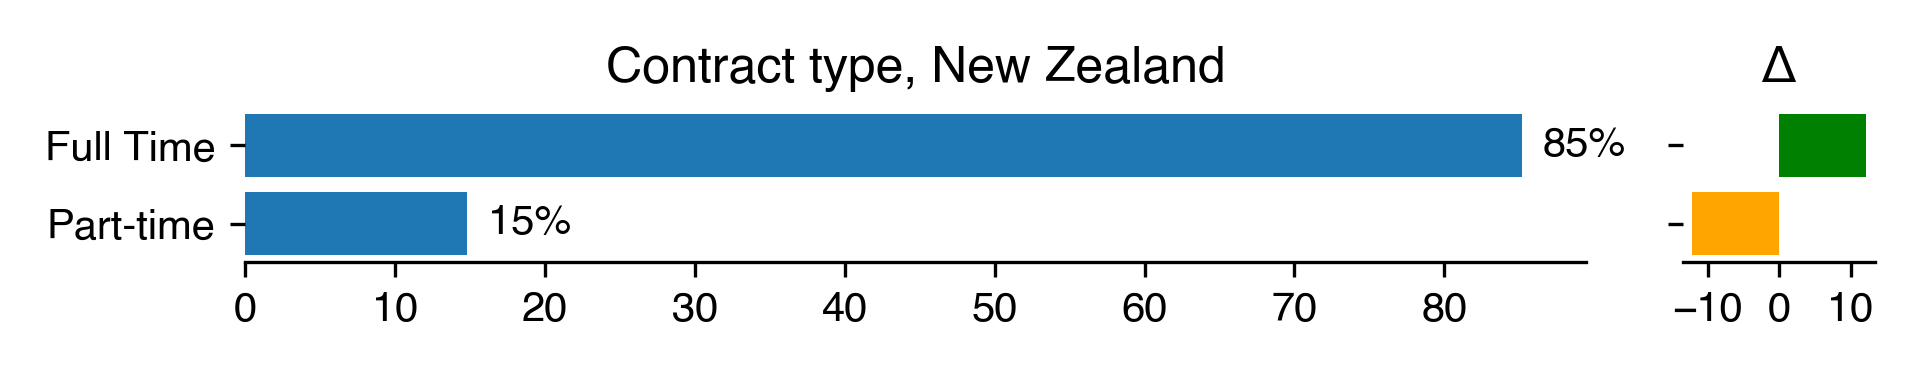
Full time or part-time
| Contract type for New Zealand | Count | Percentage | Percentage in 2018 | Difference with previous year |
|---|---|---|---|---|
| Full Time | 23 | 85.19 | 72.97 | 12.21 |
| Part-time | 4 | 14.81 | 27.03 | -12.21 |
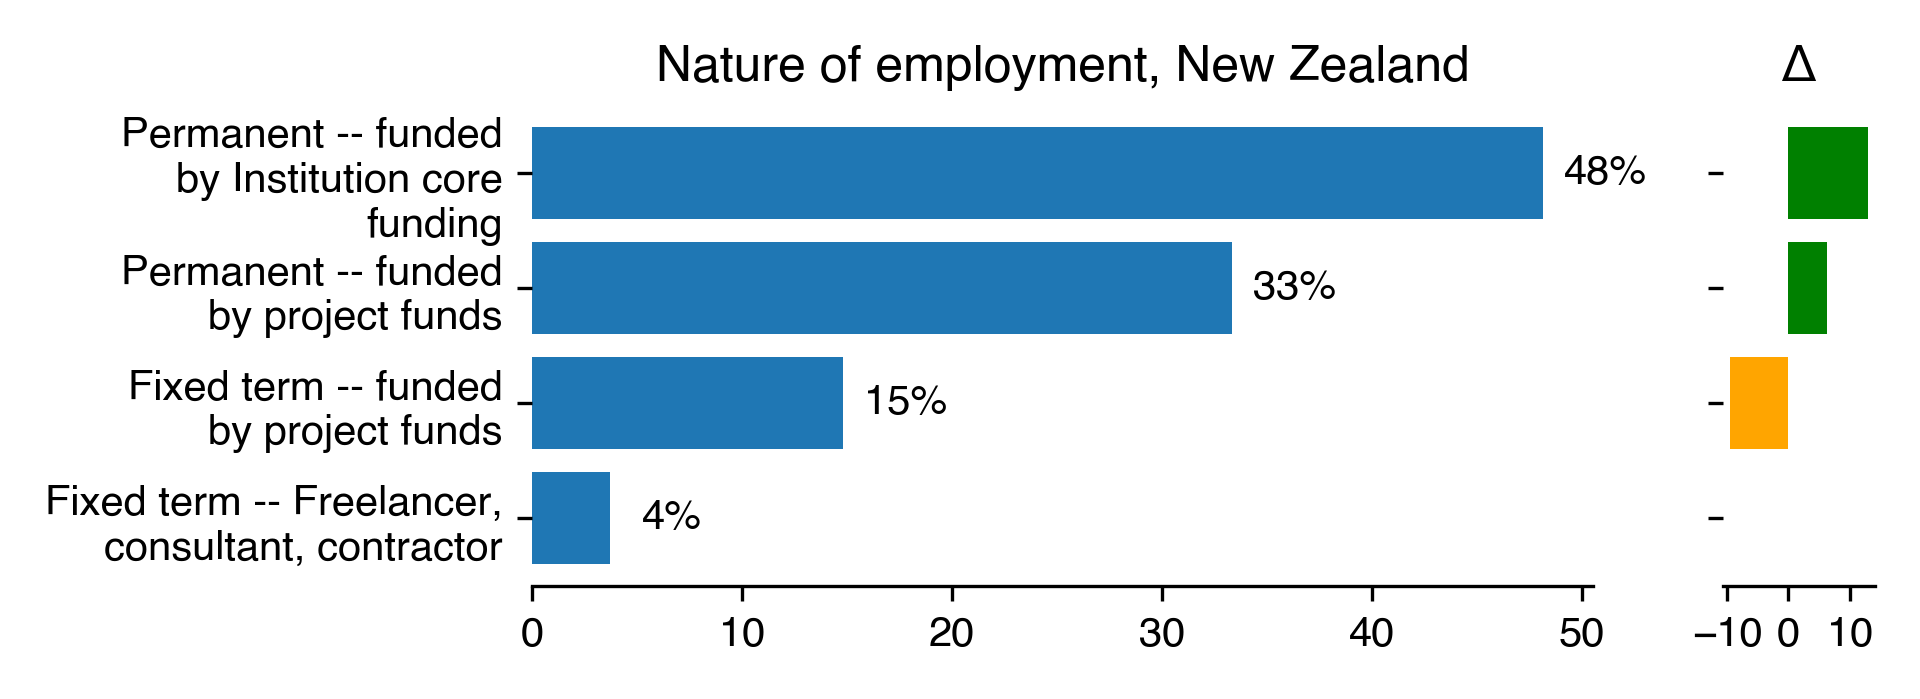
Type of contract
| Nature of employment for New Zealand | Count | Percentage | Percentage in 2018 | Difference with previous year |
|---|---|---|---|---|
| Permanent – funded by Institution core funding | 13 | 48.15 | 35.14 | 13.01 |
| Permanent – funded by project funds | 9 | 33.33 | 27.03 | 6.31 |
| Fixed term – funded by project funds | 4 | 14.81 | 24.32 | -9.51 |
| Fixed term – Freelancer, consultant, contractor | 1 | 3.7 | nan | nan |
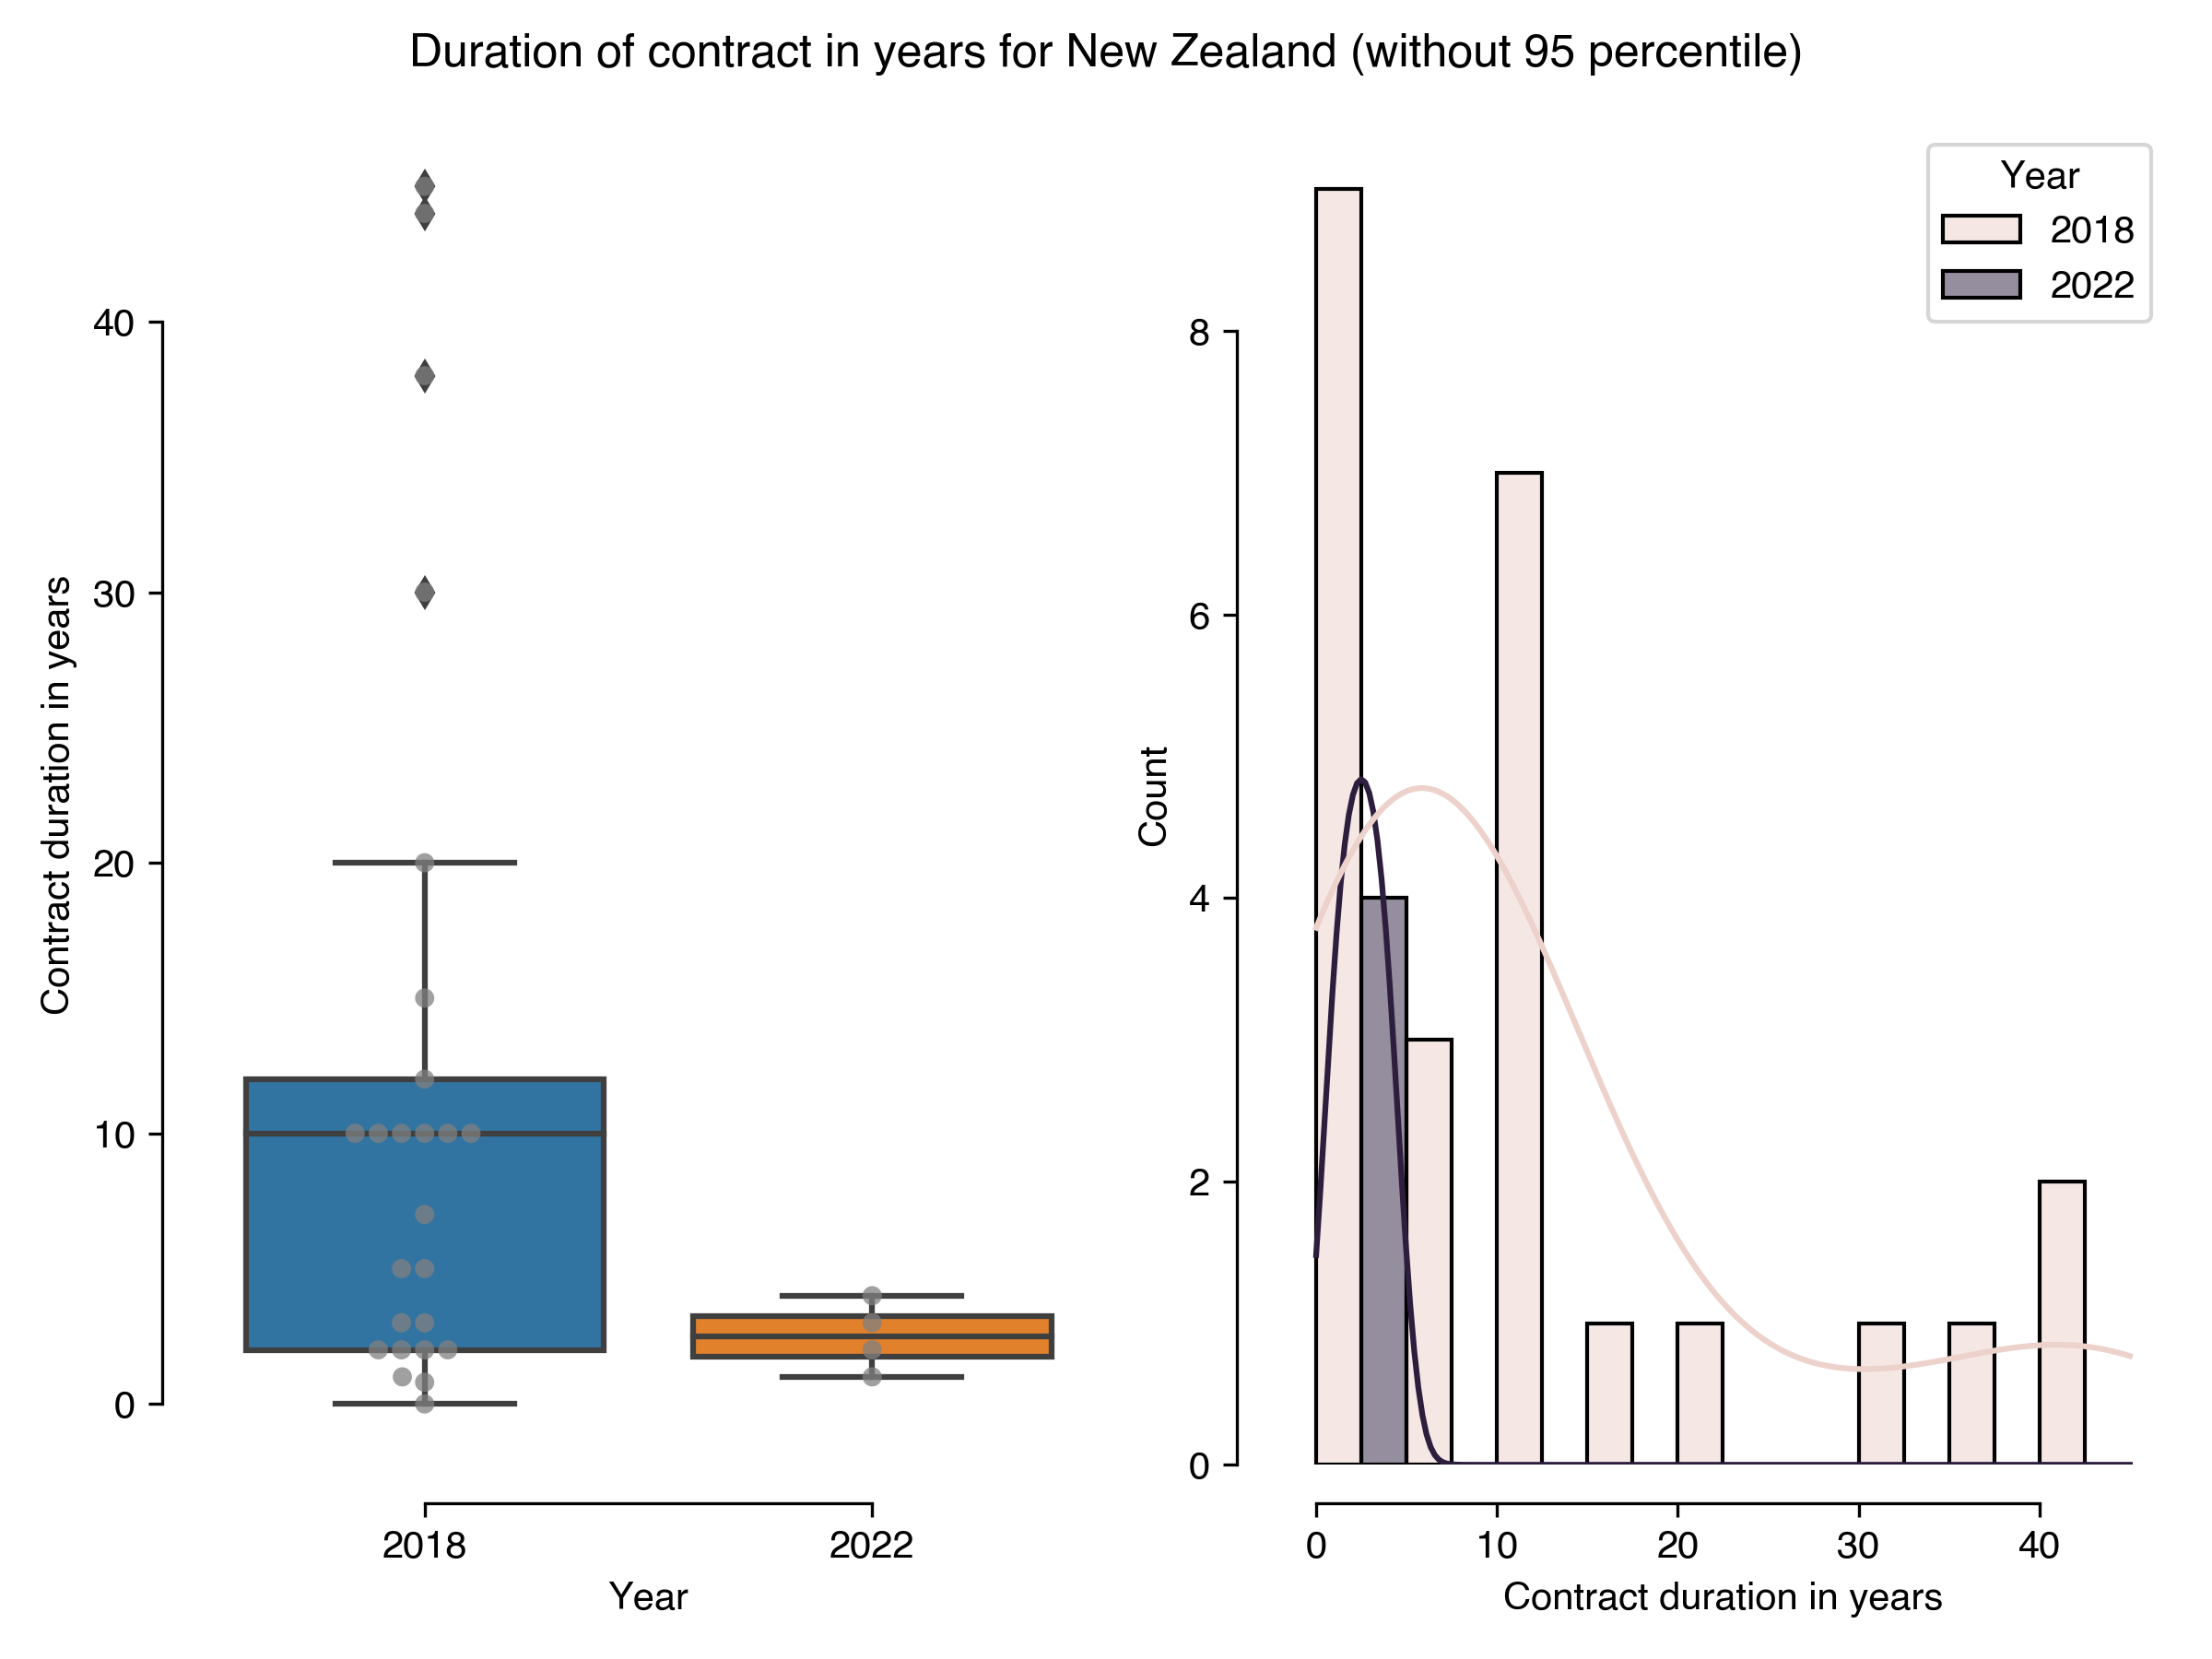
Length of current position
| Duration of contract in years for New Zealand (without 95 percentile) | Results in 2022 | Results in 2018 |
|---|---|---|
| count | 4 | 25 |
| mean | 2.5 | 11.87 |
| std | 1.29 | 13.36 |
| min | 1 | 0 |
| 25% | 1.75 | 2 |
| 50% | 2.5 | 10 |
| 75% | 3.25 | 12 |
| max | 4 | 45 |
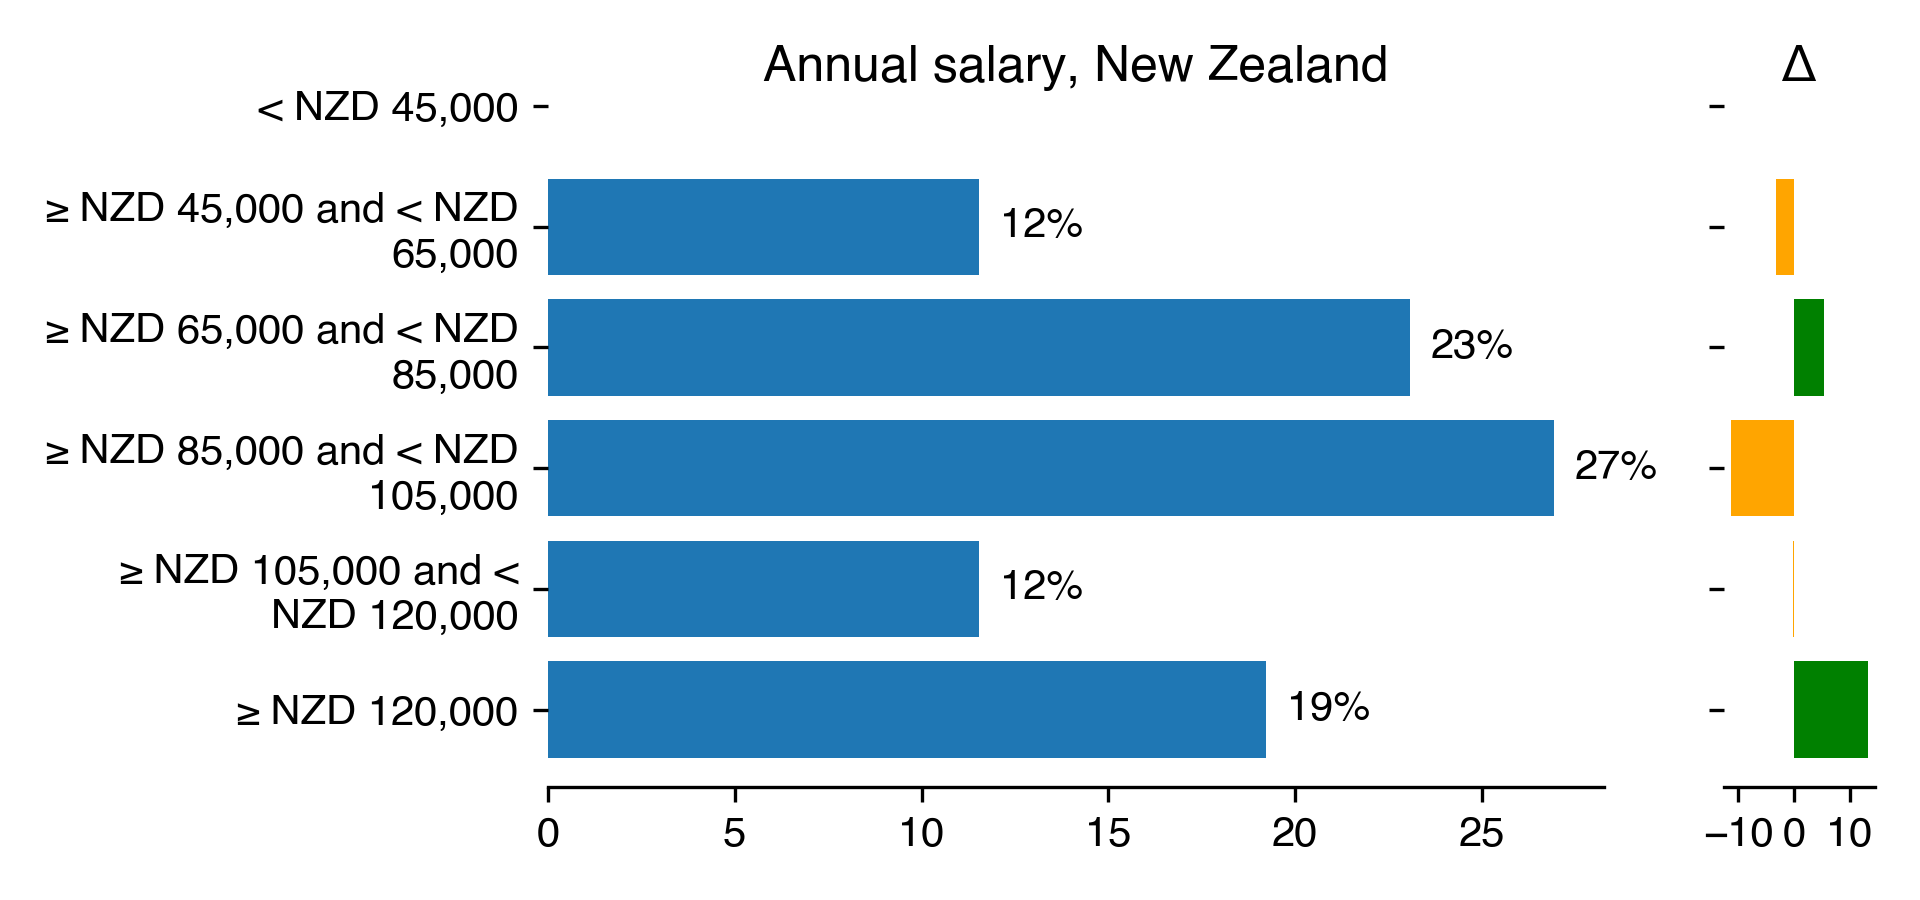
Salary
| Annual salary for New Zealand | Count | Percentage | Percentage in 2018 | Difference with previous year |
|---|---|---|---|---|
| < NZD 45,000 | nan | nan | nan | nan |
| ≥ NZD 45,000 and < NZD 65,000 | 3 | 11.54 | 14.71 | -3.17 |
| ≥ NZD 65,000 and < NZD 85,000 | 6 | 23.08 | 17.65 | 5.43 |
| ≥ NZD 85,000 and < NZD 105,000 | 7 | 26.92 | 38.24 | -11.31 |
| ≥ NZD 105,000 and < NZD 120,000 | 3 | 11.54 | 11.76 | -0.23 |
| ≥ NZD 120,000 | 5 | 19.23 | 5.88 | 13.35 |
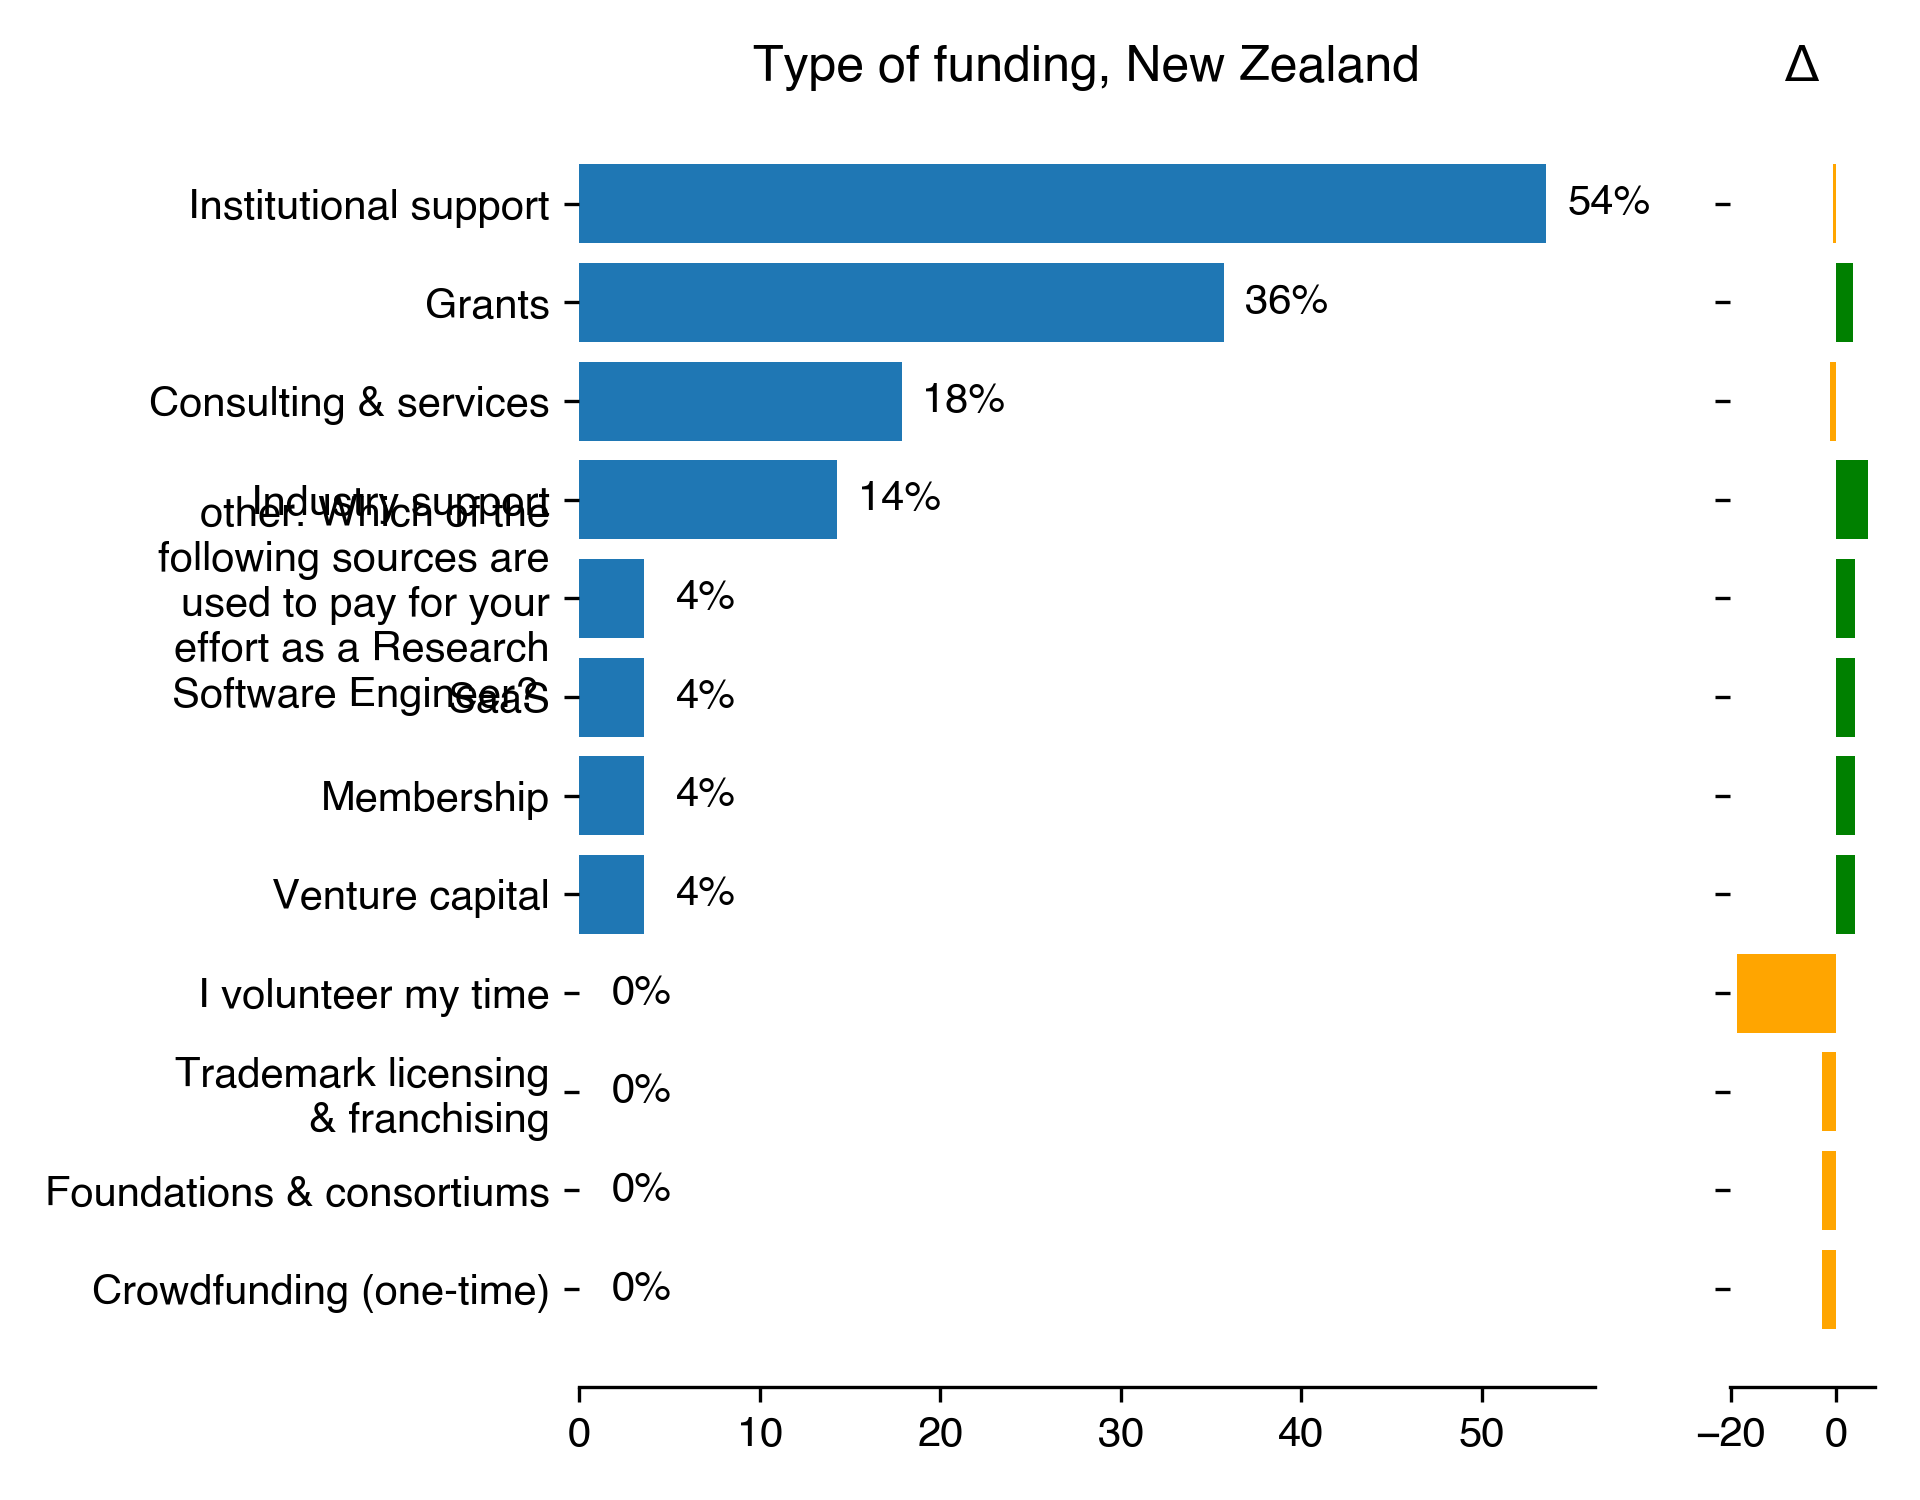
Funding
| Type of funding for New Zealand | Count | Percentage | Percentage in 2018 | Difference with previous year |
|---|---|---|---|---|
| Institutional support | 15 | 53.57 | 54.05 | -0.48 |
| Grants | 10 | 35.71 | 32.43 | 3.28 |
| Consulting & services | 5 | 17.86 | 18.92 | -1.06 |
| Industry support | 4 | 14.29 | 8.11 | 6.18 |
| other. Which of the following sources are used to pay for your effort as a Research Software Engineer? | 1 | 3.57 | 0 | 3.57 |
| SaaS | 1 | 3.57 | 0 | 3.57 |
| Membership | 1 | 3.57 | 0 | 3.57 |
| Venture capital | 1 | 3.57 | 0 | 3.57 |
| I volunteer my time | 0 | 0 | 18.92 | -18.92 |
| Trademark licensing & franchising | 0 | 0 | 2.7 | -2.7 |
| Foundations & consortiums | 0 | 0 | 2.7 | -2.7 |
| Crowdfunding (one-time) | 0 | 0 | 2.7 | -2.7 |
Job title
South Africa
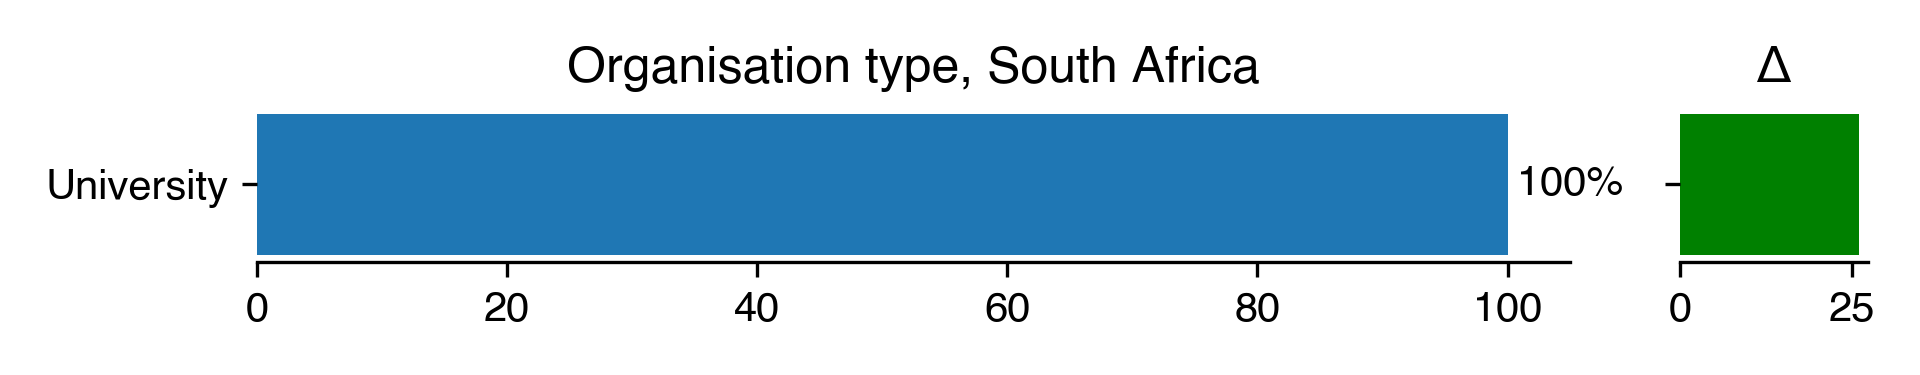
Type of organization
| Organisation type for South Africa | Count | Percentage | Percentage in 2018 | Difference with previous year |
|---|---|---|---|---|
| University | 2 | 100 | 73.91 | 26.09 |
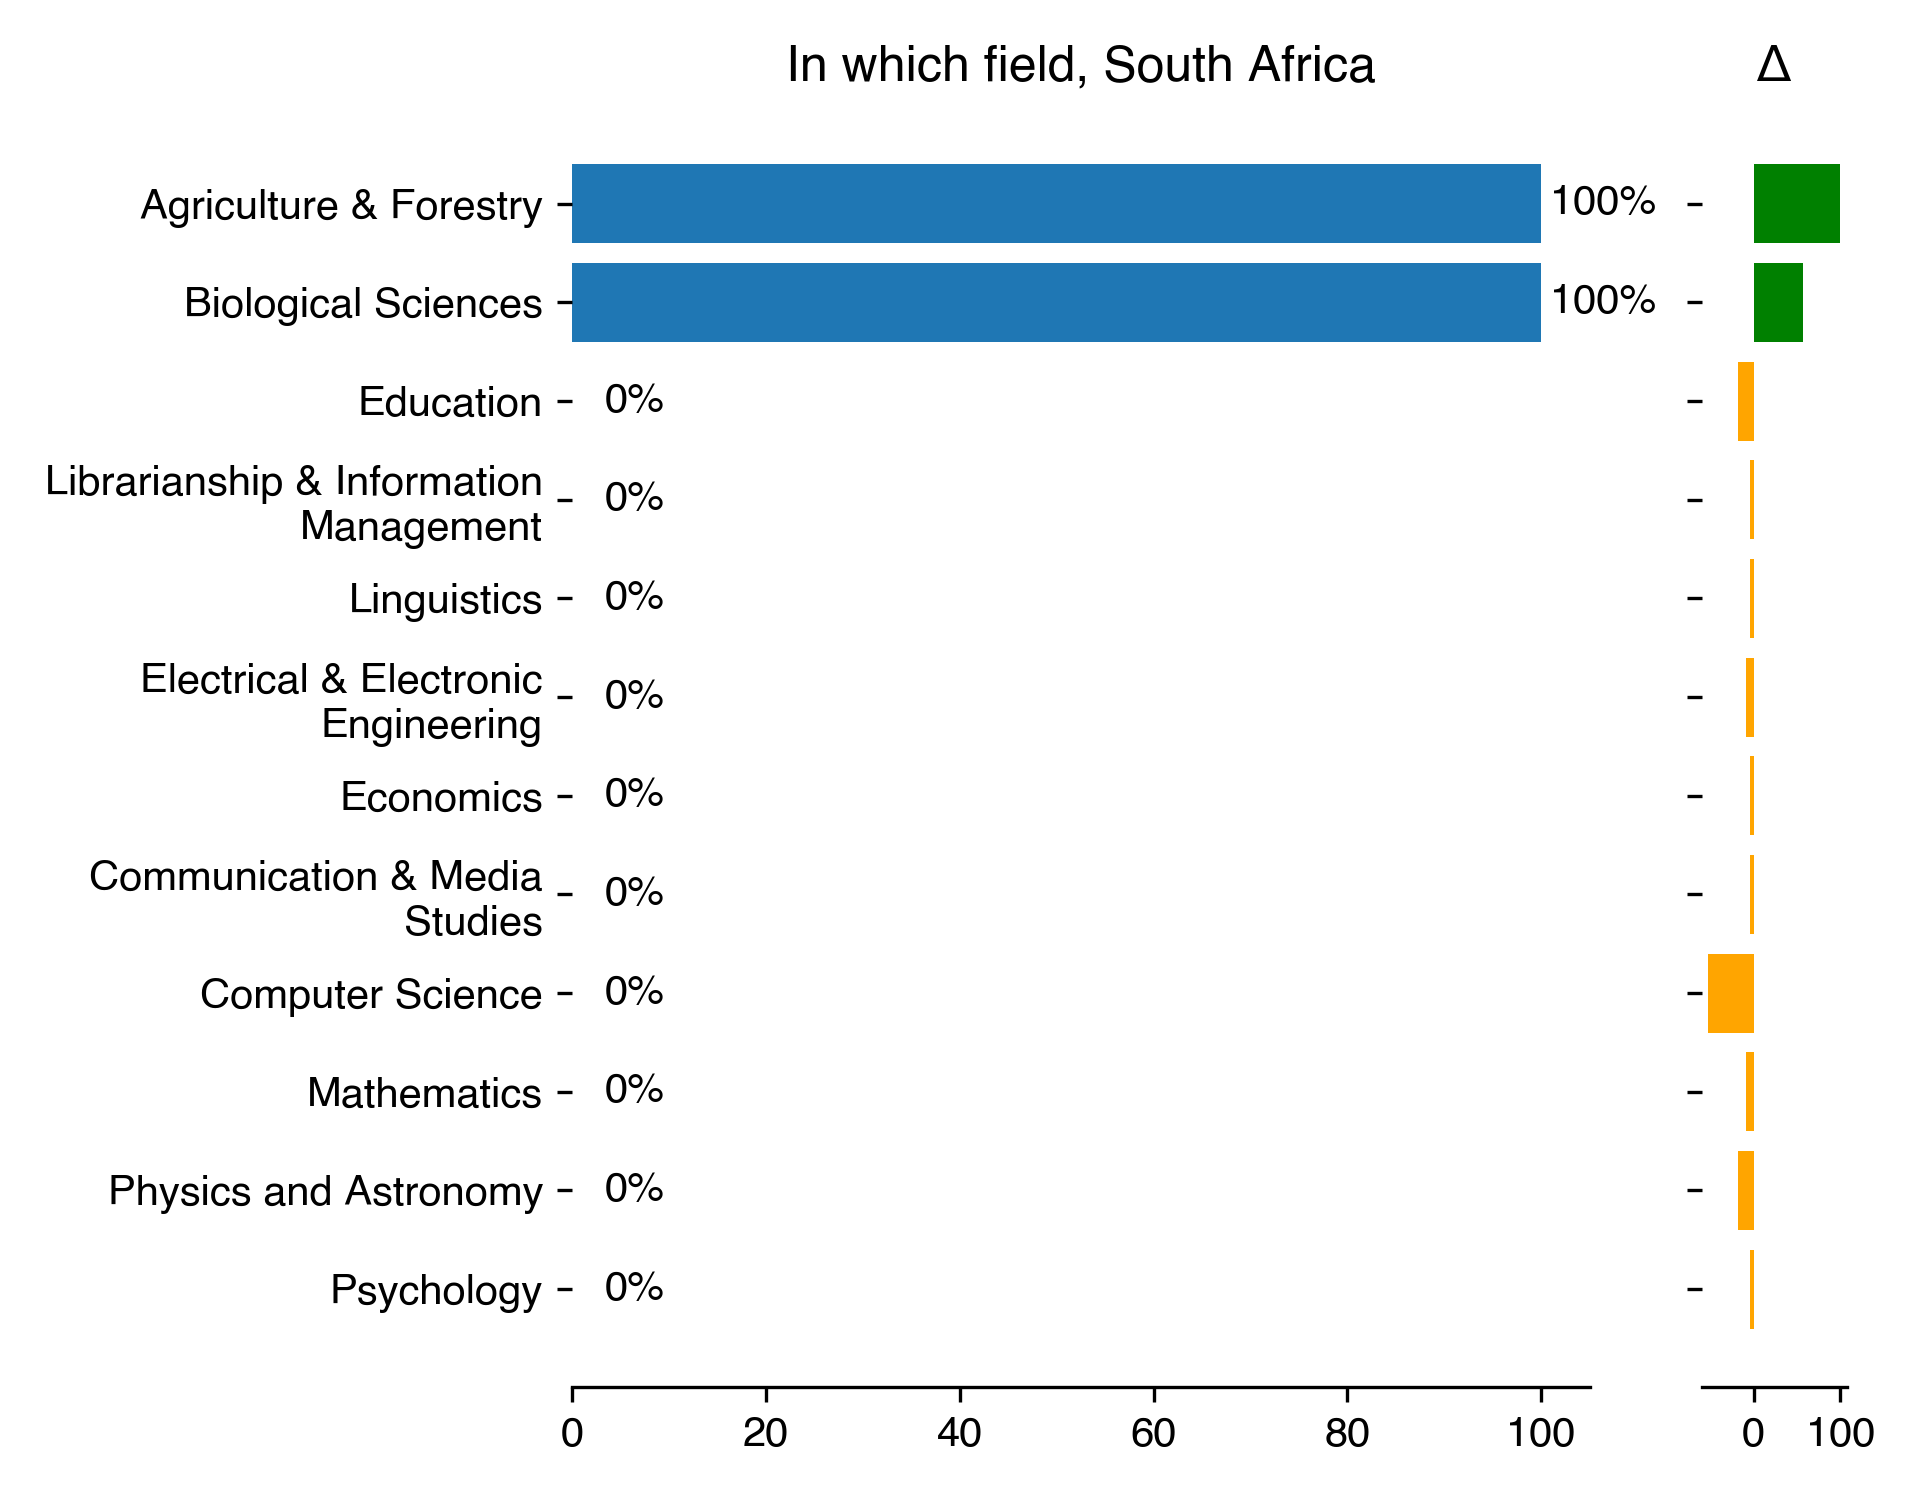
In which field are you working
| In which field for South Africa | Count | Percentage | Percentage in 2018 | Difference with previous year |
|---|---|---|---|---|
| Agriculture & Forestry | 2 | 100 | 0 | 100 |
| Biological Sciences | 2 | 100 | 43.48 | 56.52 |
| Education | 0 | 0 | 17.39 | -17.39 |
| Librarianship & Information Management | 0 | 0 | 4.35 | -4.35 |
| Linguistics | 0 | 0 | 4.35 | -4.35 |
| Electrical & Electronic Engineering | 0 | 0 | 8.7 | -8.7 |
| Economics | 0 | 0 | 4.35 | -4.35 |
| Communication & Media Studies | 0 | 0 | 4.35 | -4.35 |
| Computer Science | 0 | 0 | 52.17 | -52.17 |
| Mathematics | 0 | 0 | 8.7 | -8.7 |
| Physics and Astronomy | 0 | 0 | 17.39 | -17.39 |
| Psychology | 0 | 0 | 4.35 | -4.35 |
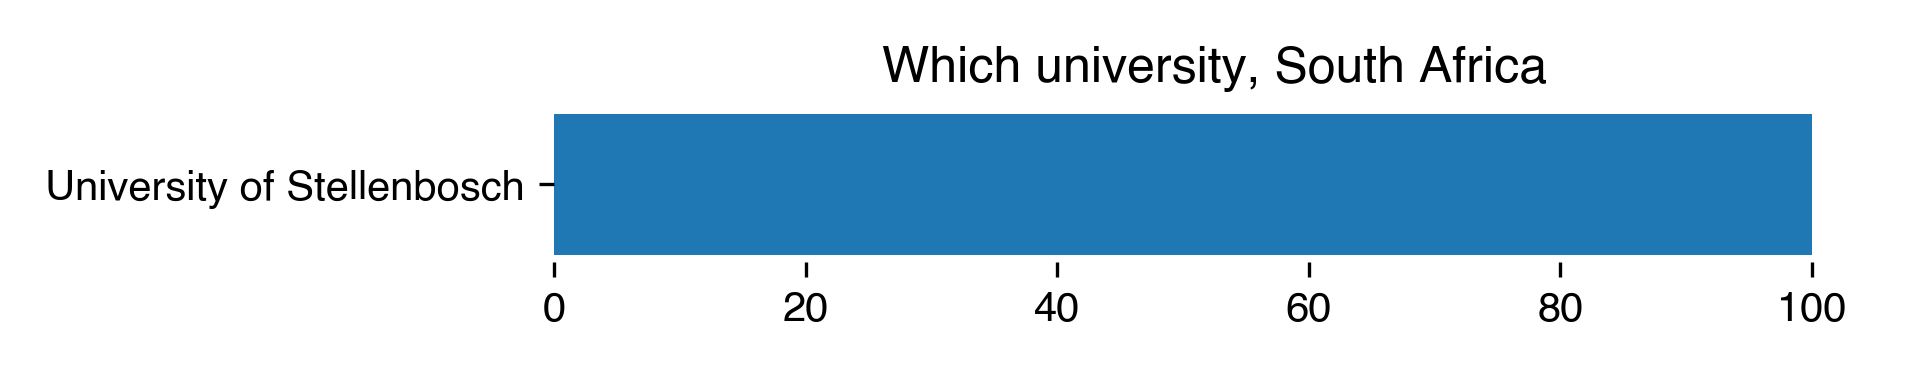
Which university or organization
| Which university for South Africa | Count | Percentage |
|---|---|---|
| University of Stellenbosch | 2 | 100 |
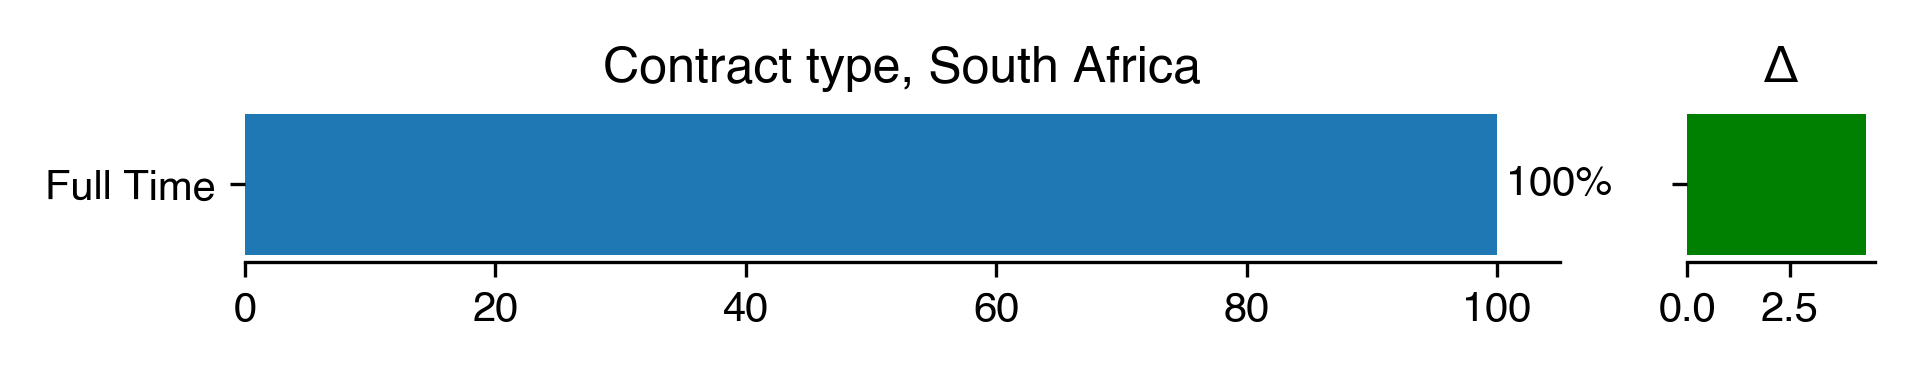
Full time or part-time
| Contract type for South Africa | Count | Percentage | Percentage in 2018 | Difference with previous year |
|---|---|---|---|---|
| Full Time | 2 | 100 | 95.65 | 4.35 |
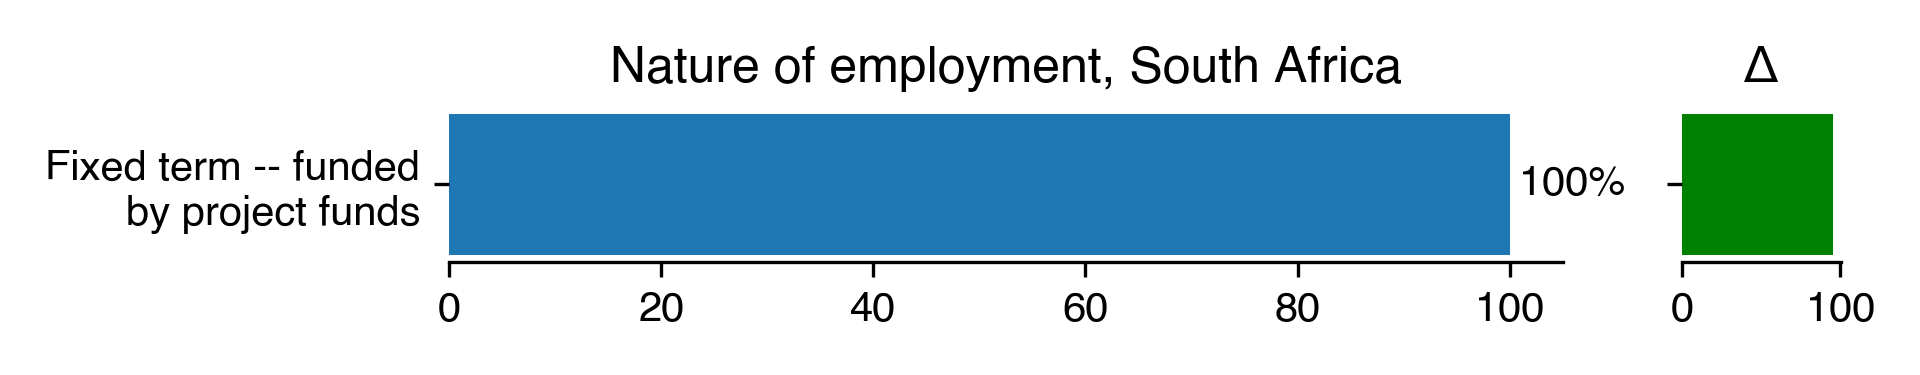
Type of contract
| Nature of employment for South Africa | Count | Percentage | Percentage in 2018 | Difference with previous year |
|---|---|---|---|---|
| Fixed term – funded by project funds | 2 | 100 | 4.35 | 95.65 |
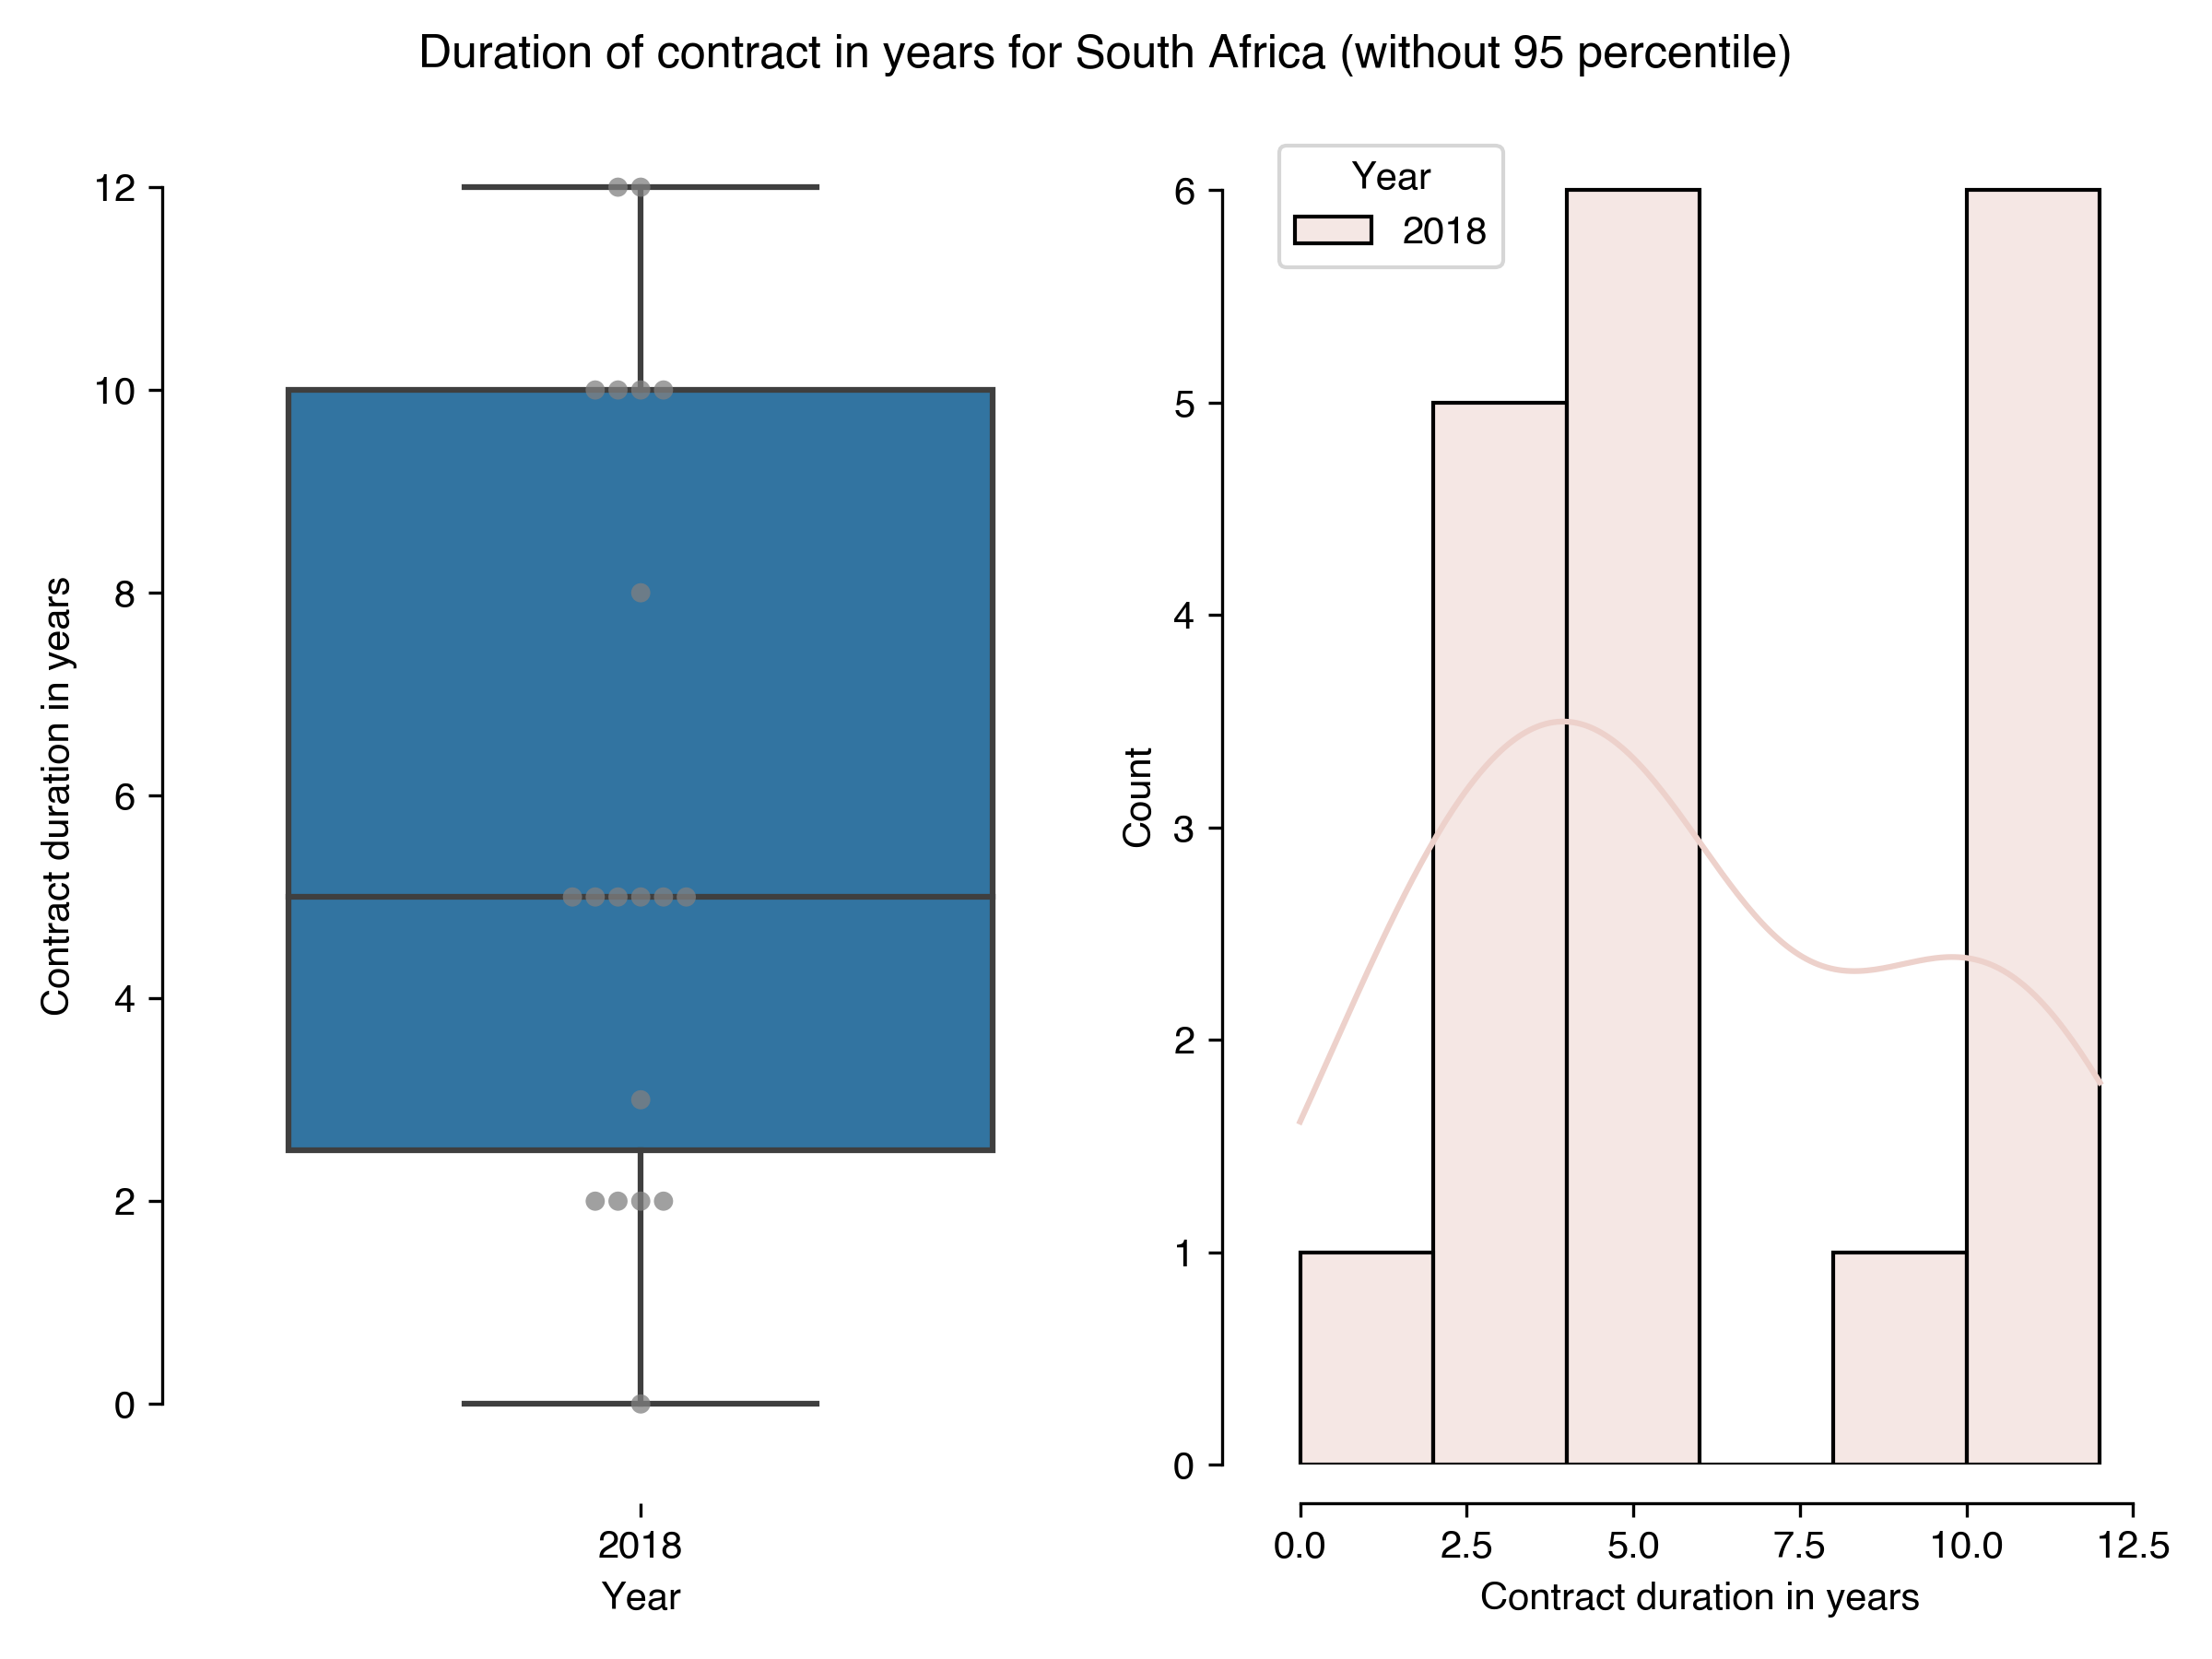
Length of current position
| Duration of contract in years for South Africa (without 95 percentile) | Results in 2022 | Results in 2018 |
|---|---|---|
| count | 0 | 19 |
| mean | nan | 5.95 |
| std | nan | 3.76 |
| min | nan | 0 |
| 25% | nan | 2.5 |
| 50% | nan | 5 |
| 75% | nan | 10 |
| max | nan | 12 |
Salary
| Annual salary for South Africa | Count | Percentage |
|---|---|---|
| Less than R 189 880 | nan | nan |
| Between R 189 881 and R 296 540 | nan | nan |
| Between R 296 541 and R 410 460 | nan | nan |
| Between R 410 461 and R 555 600 | nan | nan |
| Between R 555 601 and R 708 310 | nan | nan |
| Between R 708 311 and R 1 500 000 | nan | nan |
| More than R 1 500 000 | nan | nan |
| Prefer not to say | nan | nan |
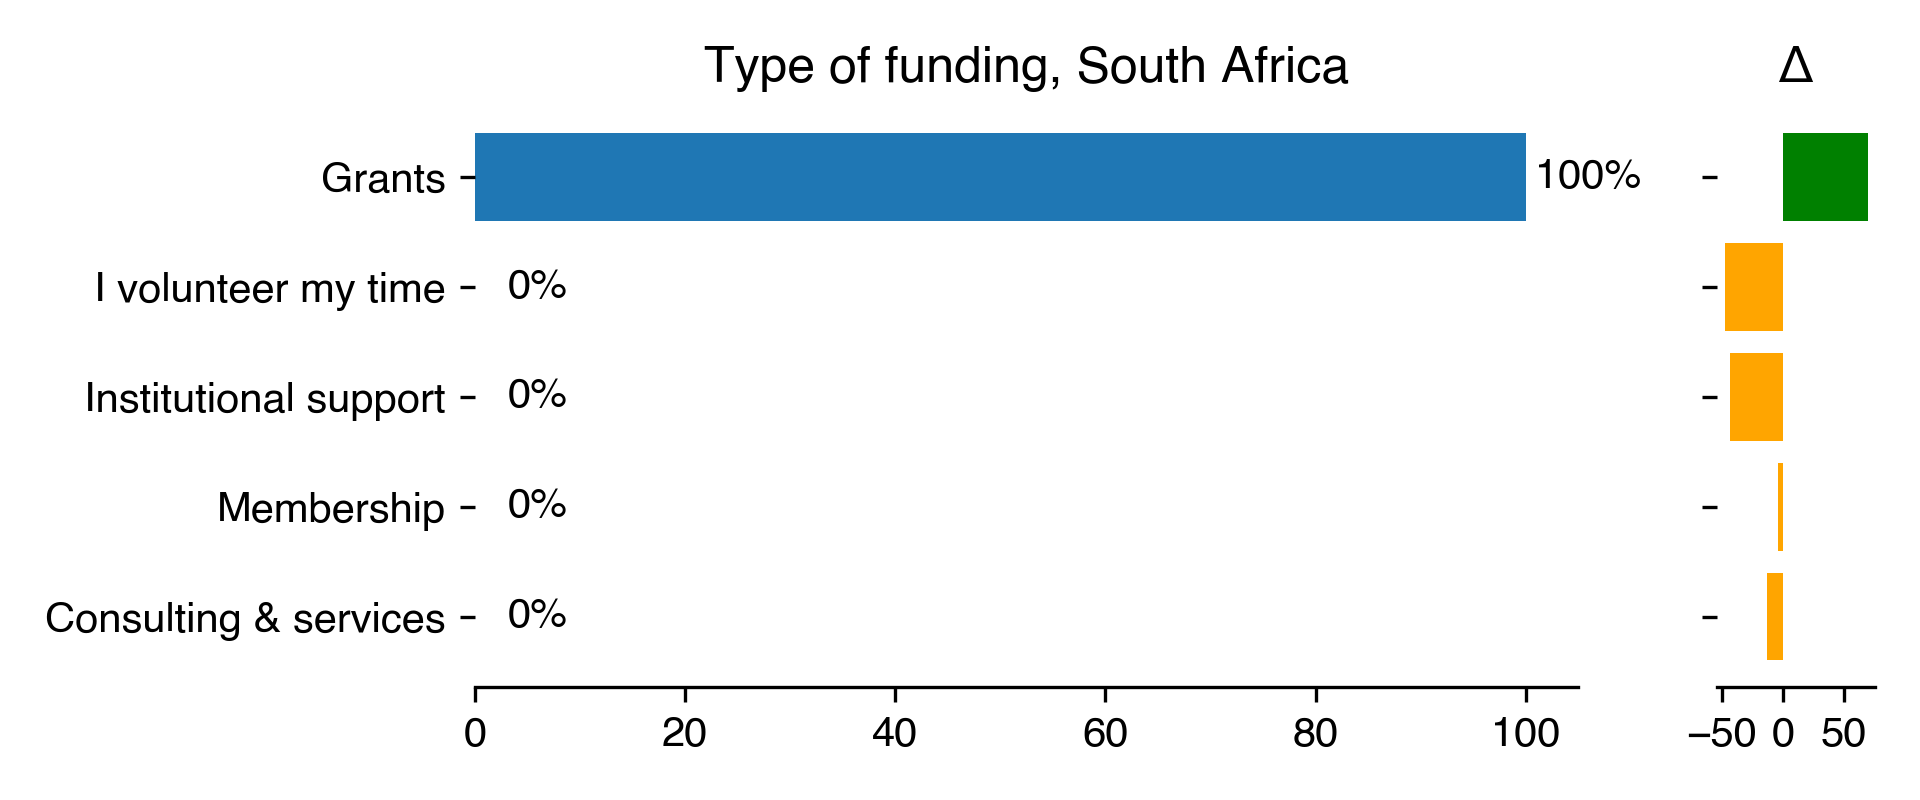
Funding
| Type of funding for South Africa | Count | Percentage | Percentage in 2018 | Difference with previous year |
|---|---|---|---|---|
| Grants | 2 | 100 | 30.43 | 69.57 |
| I volunteer my time | 0 | 0 | 47.83 | -47.83 |
| Institutional support | 0 | 0 | 43.48 | -43.48 |
| Membership | 0 | 0 | 4.35 | -4.35 |
| Consulting & services | 0 | 0 | 13.04 | -13.04 |
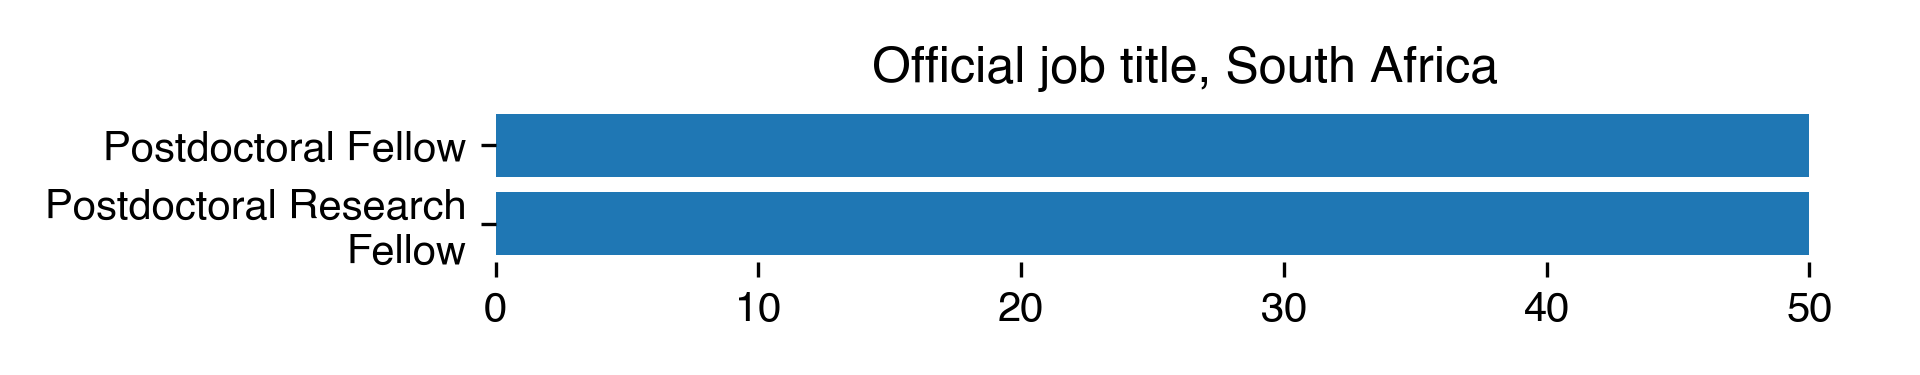
Job title
United Kingdom
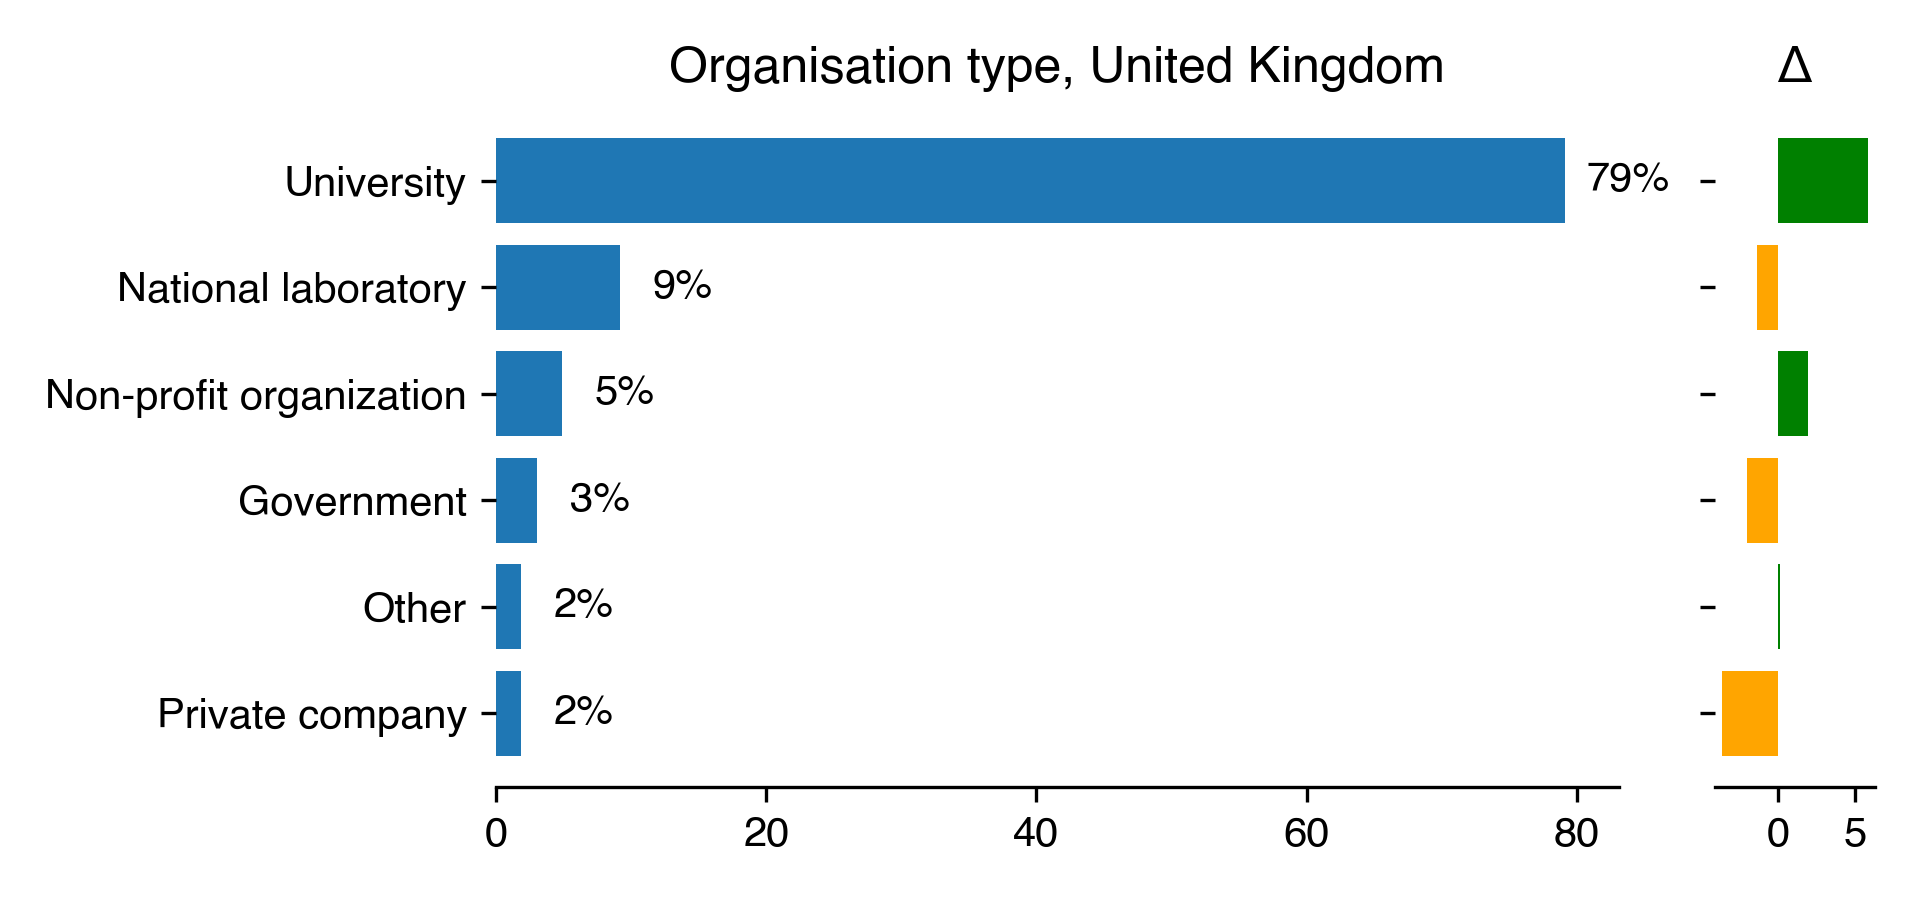
Type of organization
| Organisation type for United Kingdom | Count | Percentage | Percentage in 2018 | Difference with previous year |
|---|---|---|---|---|
| University | 129 | 79.14 | 73.31 | 5.84 |
| National laboratory | 15 | 9.2 | 10.59 | -1.39 |
| Non-profit organization | 8 | 4.91 | 2.97 | 1.94 |
| Government | 5 | 3.07 | 5.08 | -2.02 |
| Other | 3 | 1.84 | 1.69 | 0.15 |
| Private company | 3 | 1.84 | 5.51 | -3.67 |
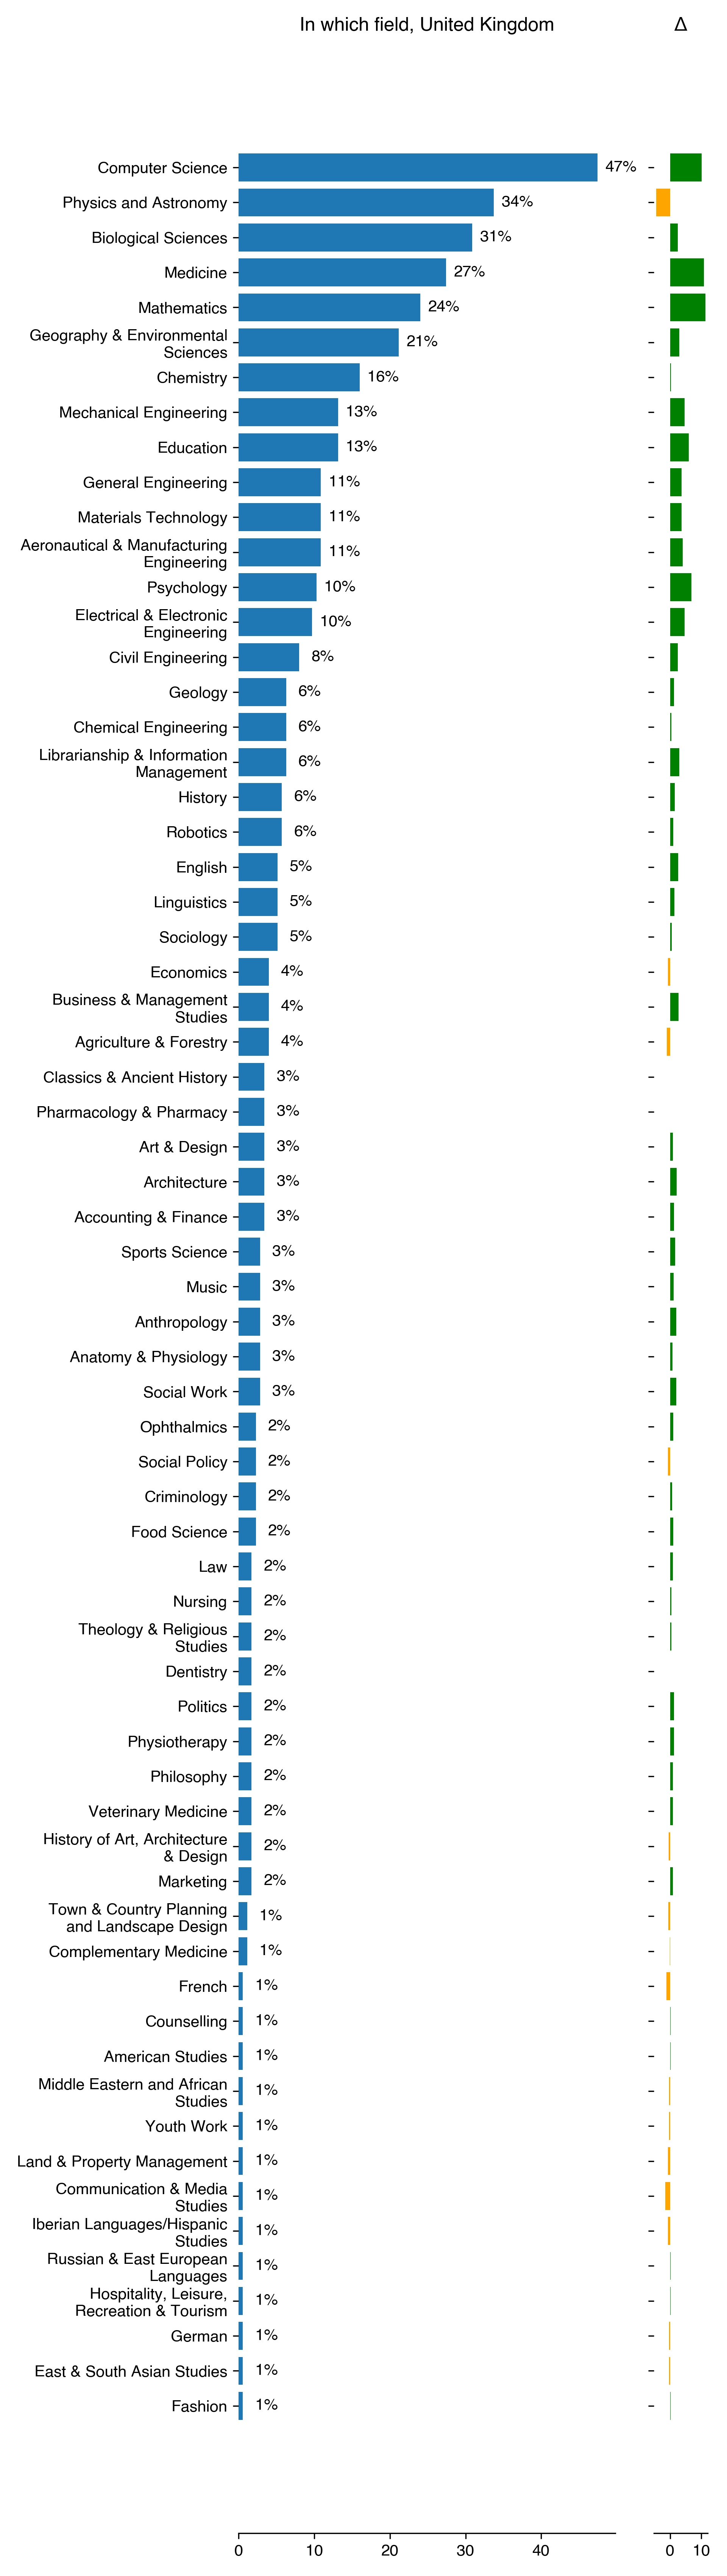
In which field are you working
| In which field for United Kingdom | Count | Percentage | Percentage in 2018 | Difference with previous year |
|---|---|---|---|---|
| Computer Science | 83 | 47.43 | 37.29 | 10.14 |
| Physics and Astronomy | 59 | 33.71 | 38.14 | -4.42 |
| Biological Sciences | 54 | 30.86 | 28.39 | 2.47 |
| Medicine | 48 | 27.43 | 16.53 | 10.9 |
| Mathematics | 42 | 24 | 12.71 | 11.29 |
| Geography & Environmental Sciences | 37 | 21.14 | 18.22 | 2.92 |
| Chemistry | 28 | 16 | 15.68 | 0.32 |
| Mechanical Engineering | 23 | 13.14 | 8.47 | 4.67 |
| Education | 23 | 13.14 | 7.2 | 5.94 |
| General Engineering | 19 | 10.86 | 7.2 | 3.65 |
| Materials Technology | 19 | 10.86 | 7.2 | 3.65 |
| Aeronautical & Manufacturing Engineering | 19 | 10.86 | 6.78 | 4.08 |
| Psychology | 18 | 10.29 | 3.39 | 6.9 |
| Electrical & Electronic Engineering | 17 | 9.71 | 5.08 | 4.63 |
| Civil Engineering | 14 | 8 | 5.51 | 2.49 |
| Geology | 11 | 6.29 | 5.08 | 1.2 |
| Chemical Engineering | 11 | 6.29 | 5.93 | 0.35 |
| Librarianship & Information Management | 11 | 6.29 | 3.39 | 2.9 |
| History | 10 | 5.71 | 4.24 | 1.48 |
| Robotics | 10 | 5.71 | 4.66 | 1.05 |
| English | 9 | 5.14 | 2.54 | 2.6 |
| Linguistics | 9 | 5.14 | 3.81 | 1.33 |
| Sociology | 9 | 5.14 | 4.66 | 0.48 |
| Economics | 7 | 4 | 4.66 | -0.66 |
| Business & Management Studies | 7 | 4 | 1.27 | 2.73 |
| Agriculture & Forestry | 7 | 4 | 5.08 | -1.08 |
| Classics & Ancient History | 6 | 3.43 | 3.39 | 0.04 |
| Pharmacology & Pharmacy | 6 | 3.43 | 3.39 | 0.04 |
| Art & Design | 6 | 3.43 | 2.54 | 0.89 |
| Architecture | 6 | 3.43 | 1.27 | 2.16 |
| Accounting & Finance | 6 | 3.43 | 2.12 | 1.31 |
| Sports Science | 5 | 2.86 | 1.27 | 1.59 |
| Music | 5 | 2.86 | 1.69 | 1.16 |
| Anthropology | 5 | 2.86 | 0.85 | 2.01 |
| Anatomy & Physiology | 5 | 2.86 | 2.12 | 0.74 |
| Social Work | 5 | 2.86 | 0.85 | 2.01 |
| Ophthalmics | 4 | 2.29 | 1.27 | 1.01 |
| Social Policy | 4 | 2.29 | 2.97 | -0.68 |
| Criminology | 4 | 2.29 | 1.69 | 0.59 |
| Food Science | 4 | 2.29 | 1.27 | 1.01 |
| Law | 3 | 1.71 | 0.85 | 0.87 |
| Nursing | 3 | 1.71 | 1.27 | 0.44 |
| Theology & Religious Studies | 3 | 1.71 | 1.27 | 0.44 |
| Dentistry | 3 | 1.71 | 1.69 | 0.02 |
| Politics | 3 | 1.71 | 0.42 | 1.29 |
| Physiotherapy | 3 | 1.71 | 0.42 | 1.29 |
| Philosophy | 3 | 1.71 | 0.85 | 0.87 |
| Veterinary Medicine | 3 | 1.71 | 0.85 | 0.87 |
| History of Art, Architecture & Design | 3 | 1.71 | 2.12 | -0.4 |
| Marketing | 3 | 1.71 | 0.85 | 0.87 |
| Town & Country Planning and Landscape Design | 2 | 1.14 | 1.69 | -0.55 |
| Complementary Medicine | 2 | 1.14 | 1.27 | -0.13 |
| French | 1 | 0.57 | 1.69 | -1.12 |
| Counselling | 1 | 0.57 | 0.42 | 0.15 |
| American Studies | 1 | 0.57 | 0.42 | 0.15 |
| Middle Eastern and African Studies | 1 | 0.57 | 0.85 | -0.28 |
| Youth Work | 1 | 0.57 | 0.85 | -0.28 |
| Land & Property Management | 1 | 0.57 | 1.27 | -0.7 |
| Communication & Media Studies | 1 | 0.57 | 2.12 | -1.55 |
| Iberian Languages/Hispanic Studies | 1 | 0.57 | 1.27 | -0.7 |
| Russian & East European Languages | 1 | 0.57 | 0.42 | 0.15 |
| Hospitality, Leisure, Recreation & Tourism | 1 | 0.57 | 0.42 | 0.15 |
| German | 1 | 0.57 | 0.85 | -0.28 |
| East & South Asian Studies | 1 | 0.57 | 0.85 | -0.28 |
| Fashion | 1 | 0.57 | 0.42 | 0.15 |
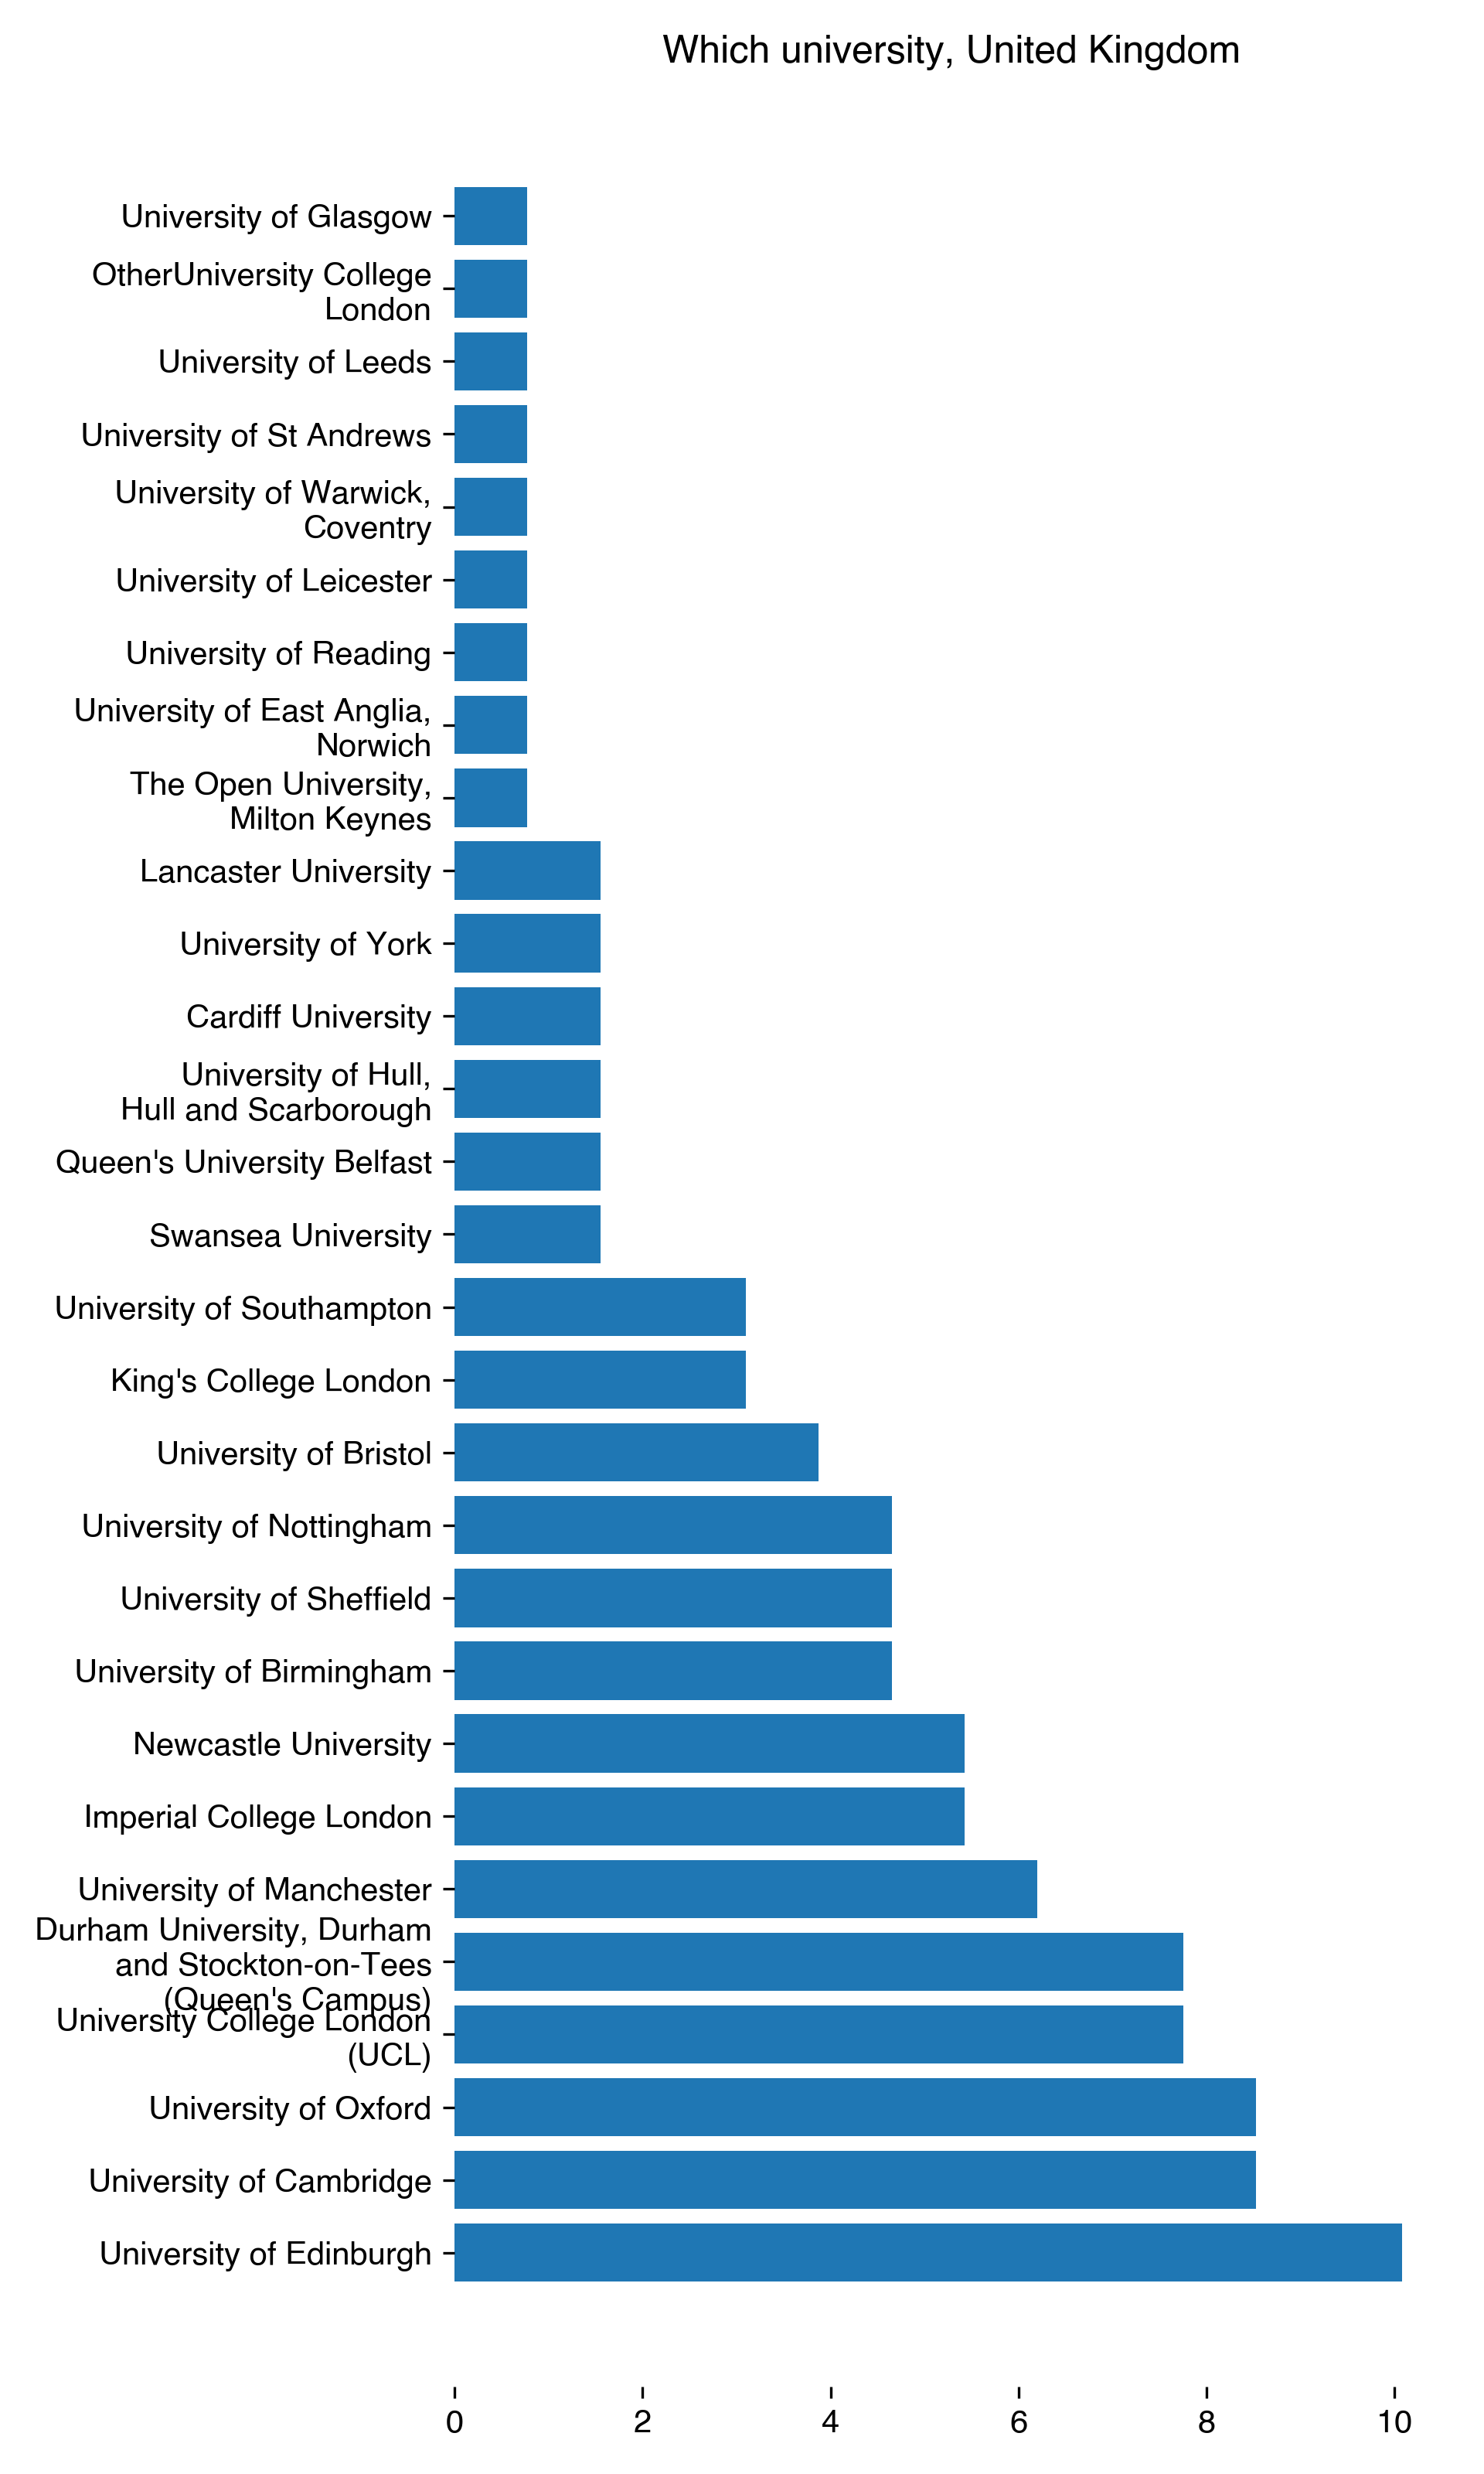
Which university or organization
| Which university for United Kingdom | Count | Percentage |
|---|---|---|
| University of Edinburgh | 13 | 10.08 |
| University of Cambridge | 11 | 8.53 |
| University of Oxford | 11 | 8.53 |
| University College London (UCL) | 10 | 7.75 |
| Durham University, Durham and Stockton-on-Tees (Queen’s Campus) | 10 | 7.75 |
| University of Manchester | 8 | 6.2 |
| Imperial College London | 7 | 5.43 |
| Newcastle University | 7 | 5.43 |
| University of Birmingham | 6 | 4.65 |
| University of Sheffield | 6 | 4.65 |
| University of Nottingham | 6 | 4.65 |
| University of Bristol | 5 | 3.88 |
| University of Southampton | 4 | 3.1 |
| King’s College London | 4 | 3.1 |
| Swansea University | 2 | 1.55 |
| Queen’s University Belfast | 2 | 1.55 |
| University of Hull, Hull and Scarborough | 2 | 1.55 |
| Cardiff University | 2 | 1.55 |
| University of York | 2 | 1.55 |
| Lancaster University | 2 | 1.55 |
| University of East Anglia, Norwich | 1 | 0.78 |
| University of Reading | 1 | 0.78 |
| University of Leicester | 1 | 0.78 |
| University of Warwick, Coventry | 1 | 0.78 |
| University of St Andrews | 1 | 0.78 |
| University of Leeds | 1 | 0.78 |
| OtherUniversity College London | 1 | 0.78 |
| The Open University, Milton Keynes | 1 | 0.78 |
| University of Glasgow | 1 | 0.78 |
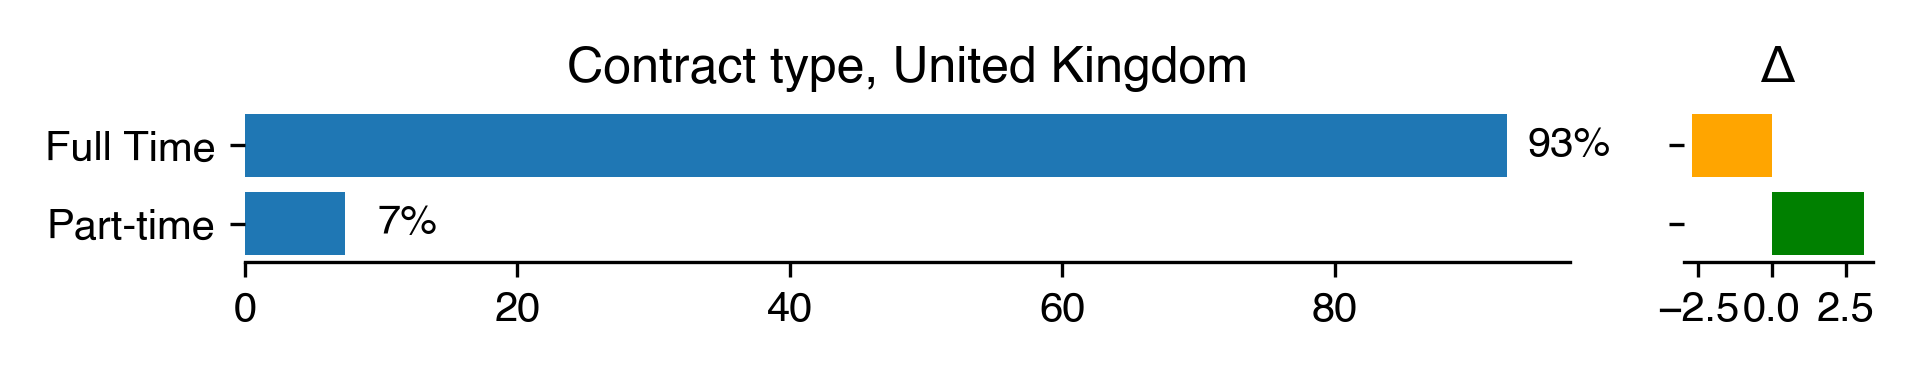
Full time or part-time
| Contract type for United Kingdom | Count | Percentage | Percentage in 2018 | Difference with previous year |
|---|---|---|---|---|
| Full Time | 151 | 92.64 | 95.34 | -2.7 |
| Part-time | 12 | 7.36 | 4.24 | 3.12 |
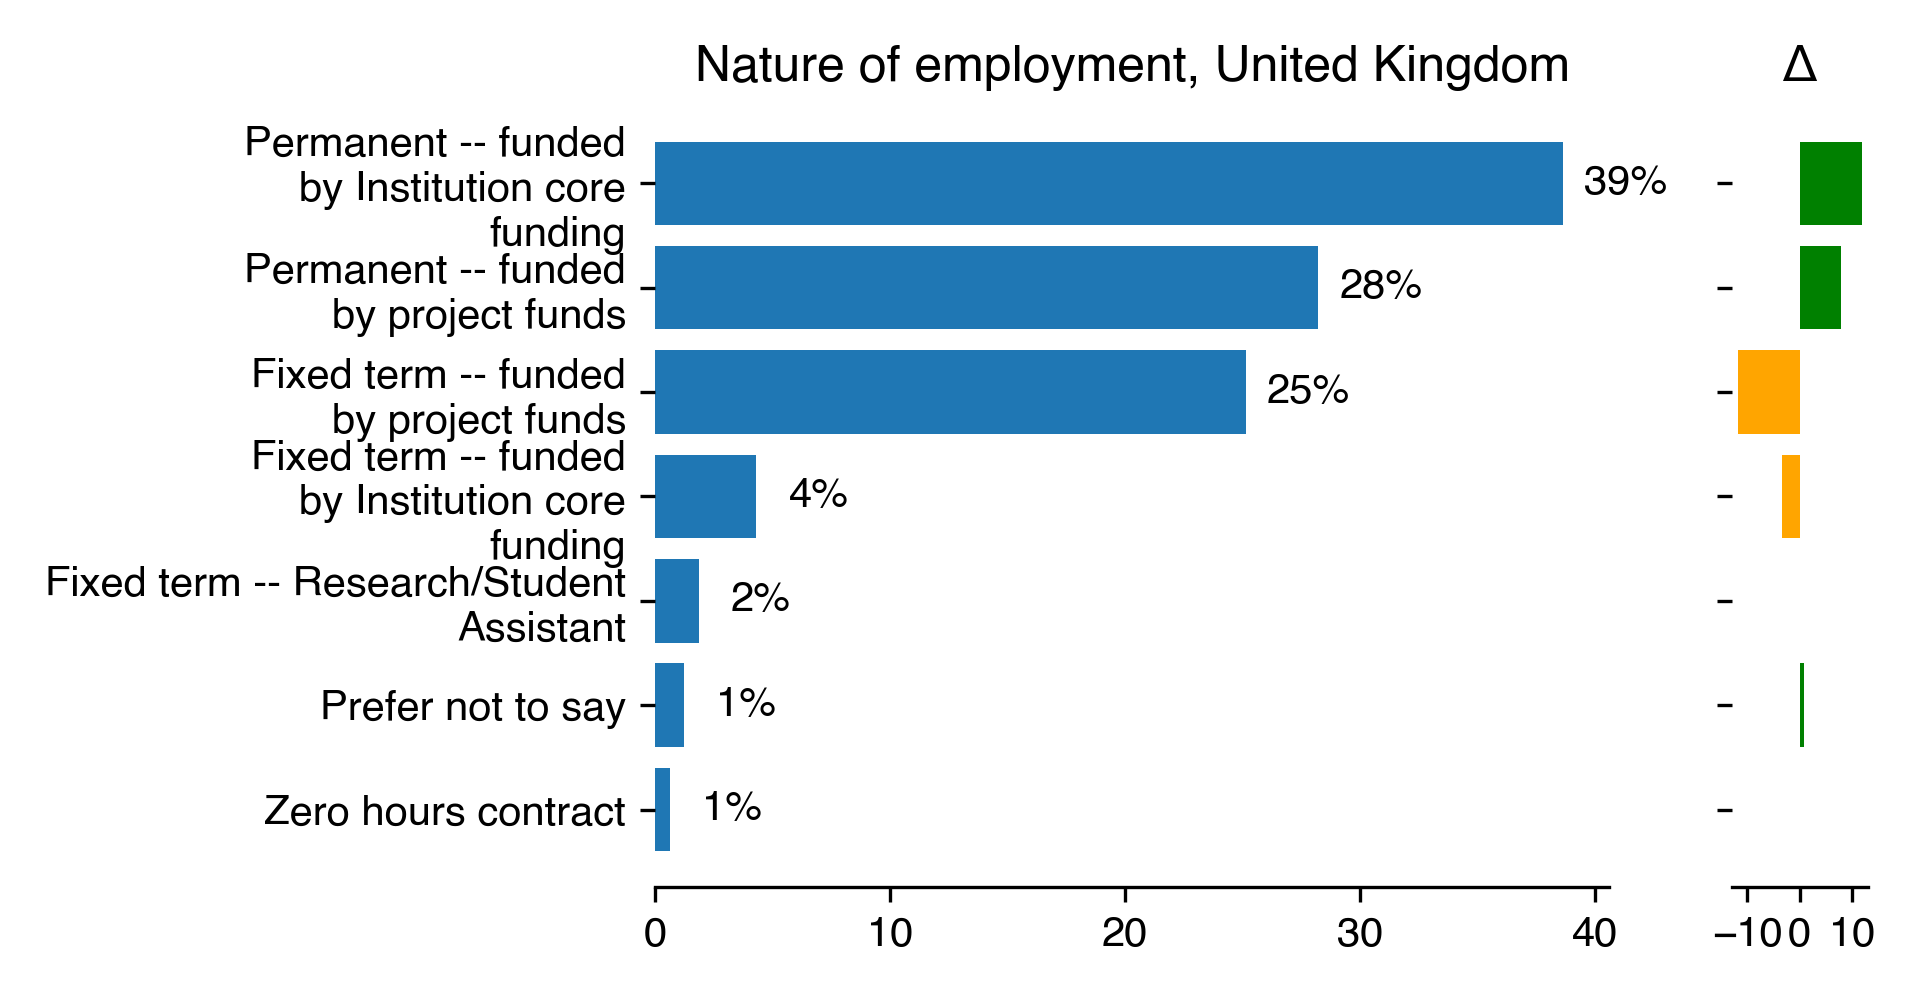
Type of contract
| Nature of employment for United Kingdom | Count | Percentage | Percentage in 2018 | Difference with previous year |
|---|---|---|---|---|
| Permanent – funded by Institution core funding | 63 | 38.65 | 26.69 | 11.96 |
| Permanent – funded by project funds | 46 | 28.22 | 20.34 | 7.88 |
| Fixed term – funded by project funds | 41 | 25.15 | 36.86 | -11.71 |
| Fixed term – funded by Institution core funding | 7 | 4.29 | 7.63 | -3.33 |
| Fixed term – Research/Student Assistant | 3 | 1.84 | nan | nan |
| Prefer not to say | 2 | 1.23 | 0.42 | 0.8 |
| Zero hours contract | 1 | 0.61 | nan | nan |
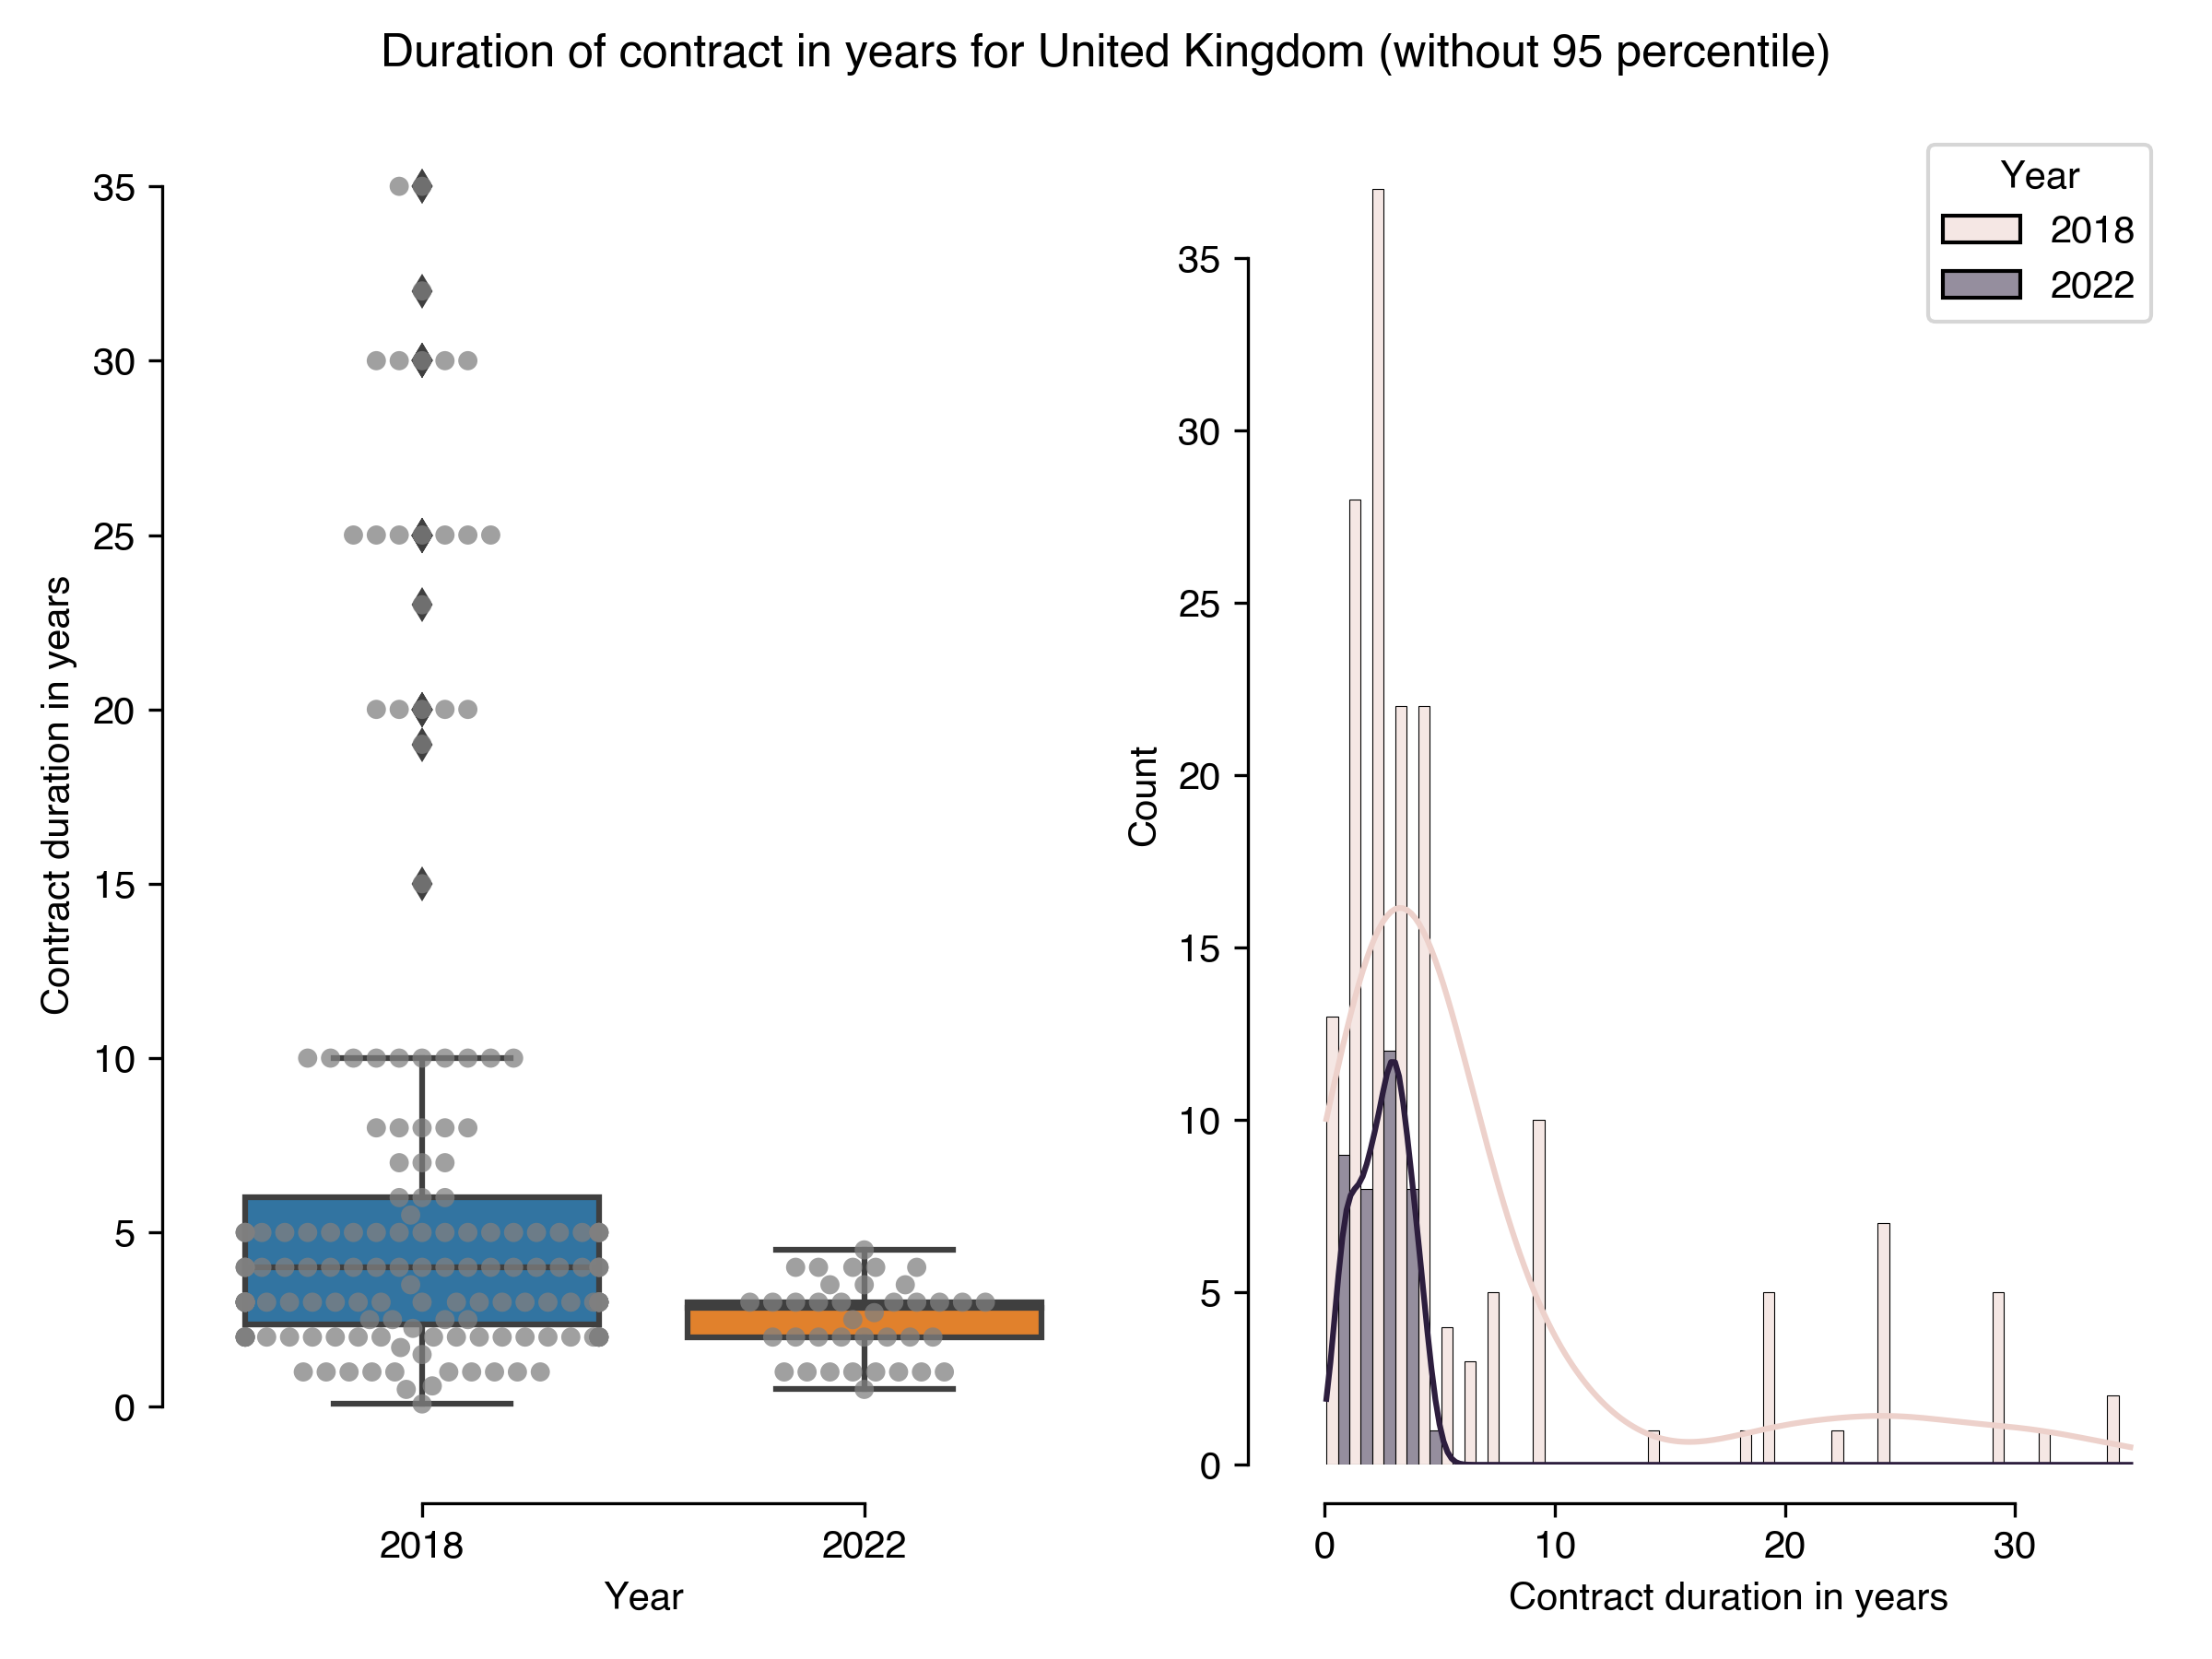
Length of current position
| Duration of contract in years for United Kingdom (without 95 percentile) | Results in 2022 | Results in 2018 |
|---|---|---|
| count | 38 | 167 |
| mean | 2.49 | 6.83 |
| std | 1.1 | 8 |
| min | 0.5 | 0.08 |
| 25% | 2 | 2.38 |
| 50% | 2.85 | 4 |
| 75% | 3 | 6 |
| max | 4.5 | 35 |
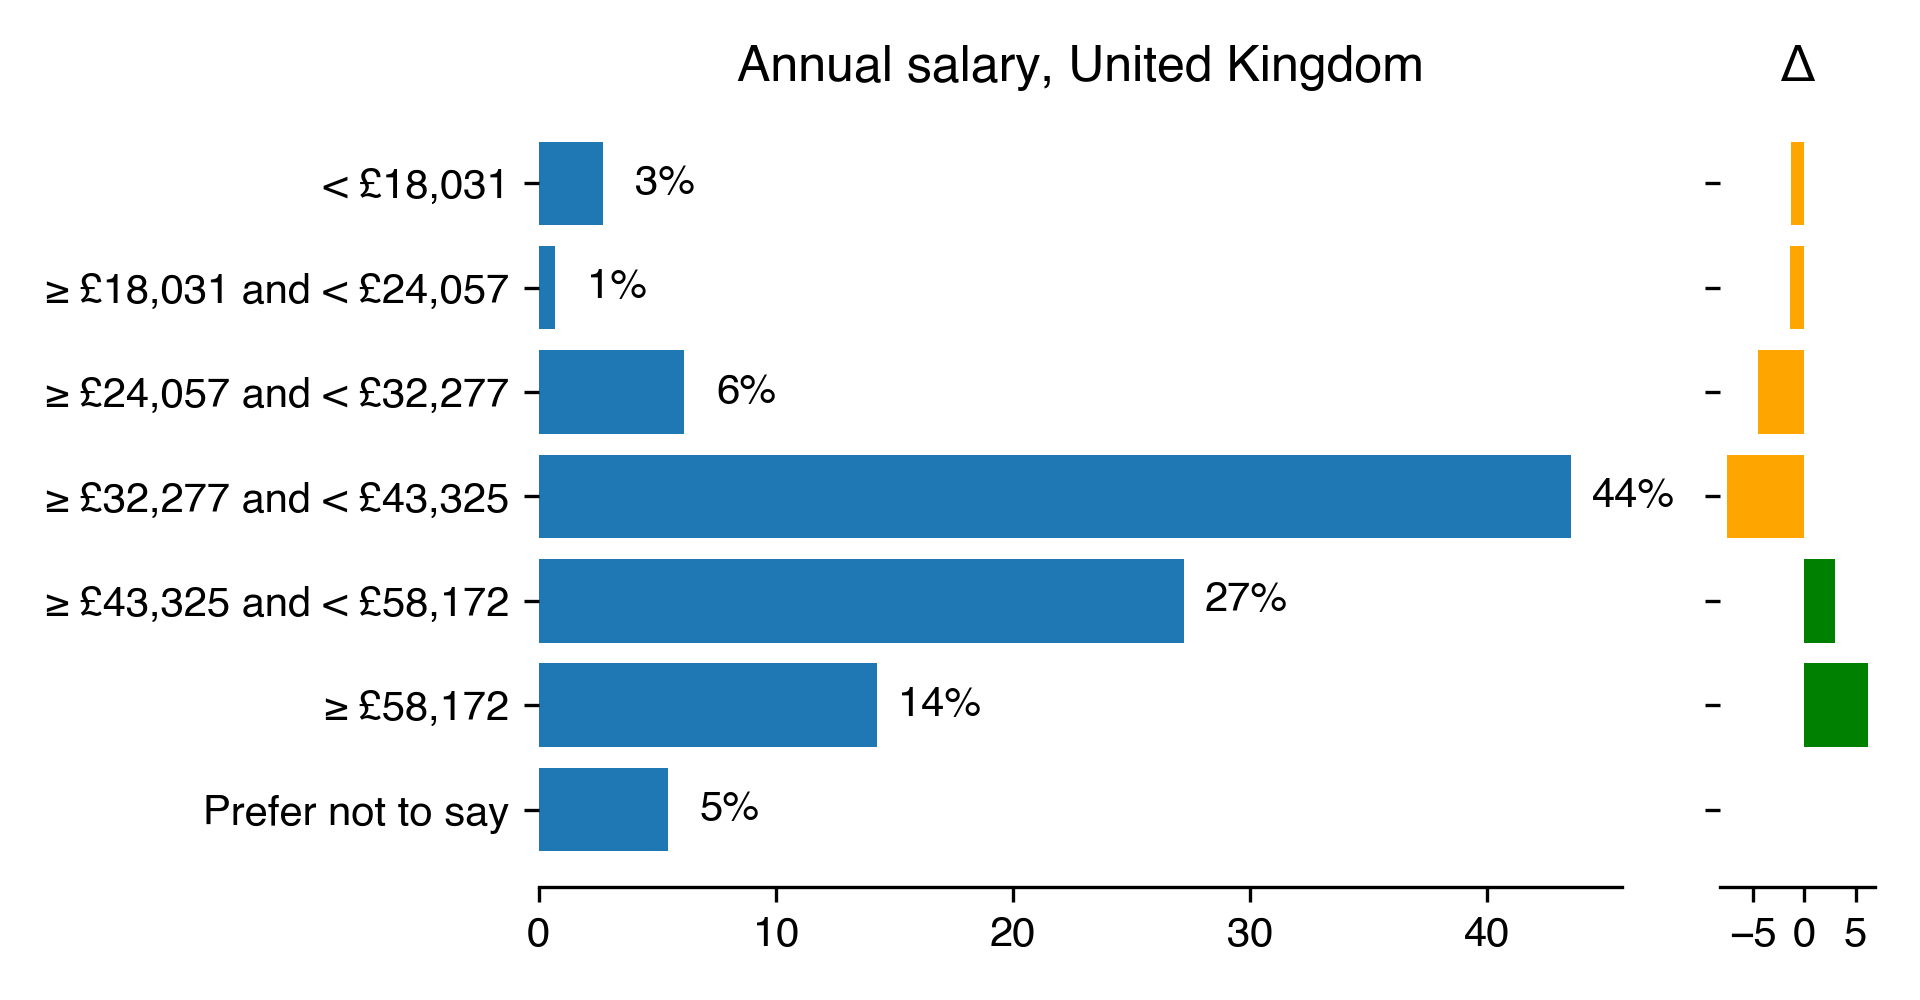
Salary
| Annual salary for United Kingdom | Count | Percentage | Percentage in 2018 | Difference with previous year |
|---|---|---|---|---|
| < £18,031 | 4 | 2.72 | 4.04 | -1.32 |
| ≥ £18,031 and < £24,057 | 1 | 0.68 | 2.02 | -1.34 |
| ≥ £24,057 and < £32,277 | 9 | 6.12 | 10.61 | -4.48 |
| ≥ £32,277 and < £43,325 | 64 | 43.54 | 51.01 | -7.47 |
| ≥ £43,325 and < £58,172 | 40 | 27.21 | 24.24 | 2.97 |
| ≥ £58,172 | 21 | 14.29 | 8.08 | 6.2 |
| Prefer not to say | 8 | 5.44 | nan | nan |
Funding
| Type of funding for United Kingdom | Count | Percentage | Percentage in 2018 | Difference with previous year |
|---|---|---|---|---|
| Grants | 101 | 57.71 | 55.08 | 2.63 |
| Institutional support | 72 | 41.14 | 34.32 | 6.82 |
| Industry support | 21 | 12 | 6.36 | 5.64 |
| Consulting & services | 16 | 9.14 | 8.47 | 0.67 |
| other. Which of the following sources are used to pay for your effort as a Research Software Engineer? | 6 | 3.43 | 0 | 3.43 |
| Foundations & consortiums | 4 | 2.29 | 3.39 | -1.1 |
| Venture capital | 3 | 1.71 | 0 | 1.71 |
| Open core | 3 | 1.71 | 0.42 | 1.29 |
| Advertising & sponsorships | 2 | 1.14 | 0.42 | 0.72 |
| Books & merchandise | 1 | 0.57 | 0 | 0.57 |
| Membership | 1 | 0.57 | 0.85 | -0.28 |
| I volunteer my time | 0 | 0 | 17.37 | -17.37 |
Job title
United States
Type of organization
| Organisation type for United States | Count | Percentage | Percentage in 2018 | Difference with previous year |
|---|---|---|---|---|
| University | 100 | 64.94 | 56.46 | 8.47 |
| National laboratory | 21 | 13.64 | 19.73 | -6.09 |
| Private company | 13 | 8.44 | 6.8 | 1.64 |
| Government | 12 | 7.79 | 3.4 | 4.39 |
| Non-profit organization | 5 | 3.25 | 10.2 | -6.96 |
| Other | 2 | 1.3 | 2.72 | -1.42 |
| NGO | 1 | 0.65 | 0.68 | -0.03 |
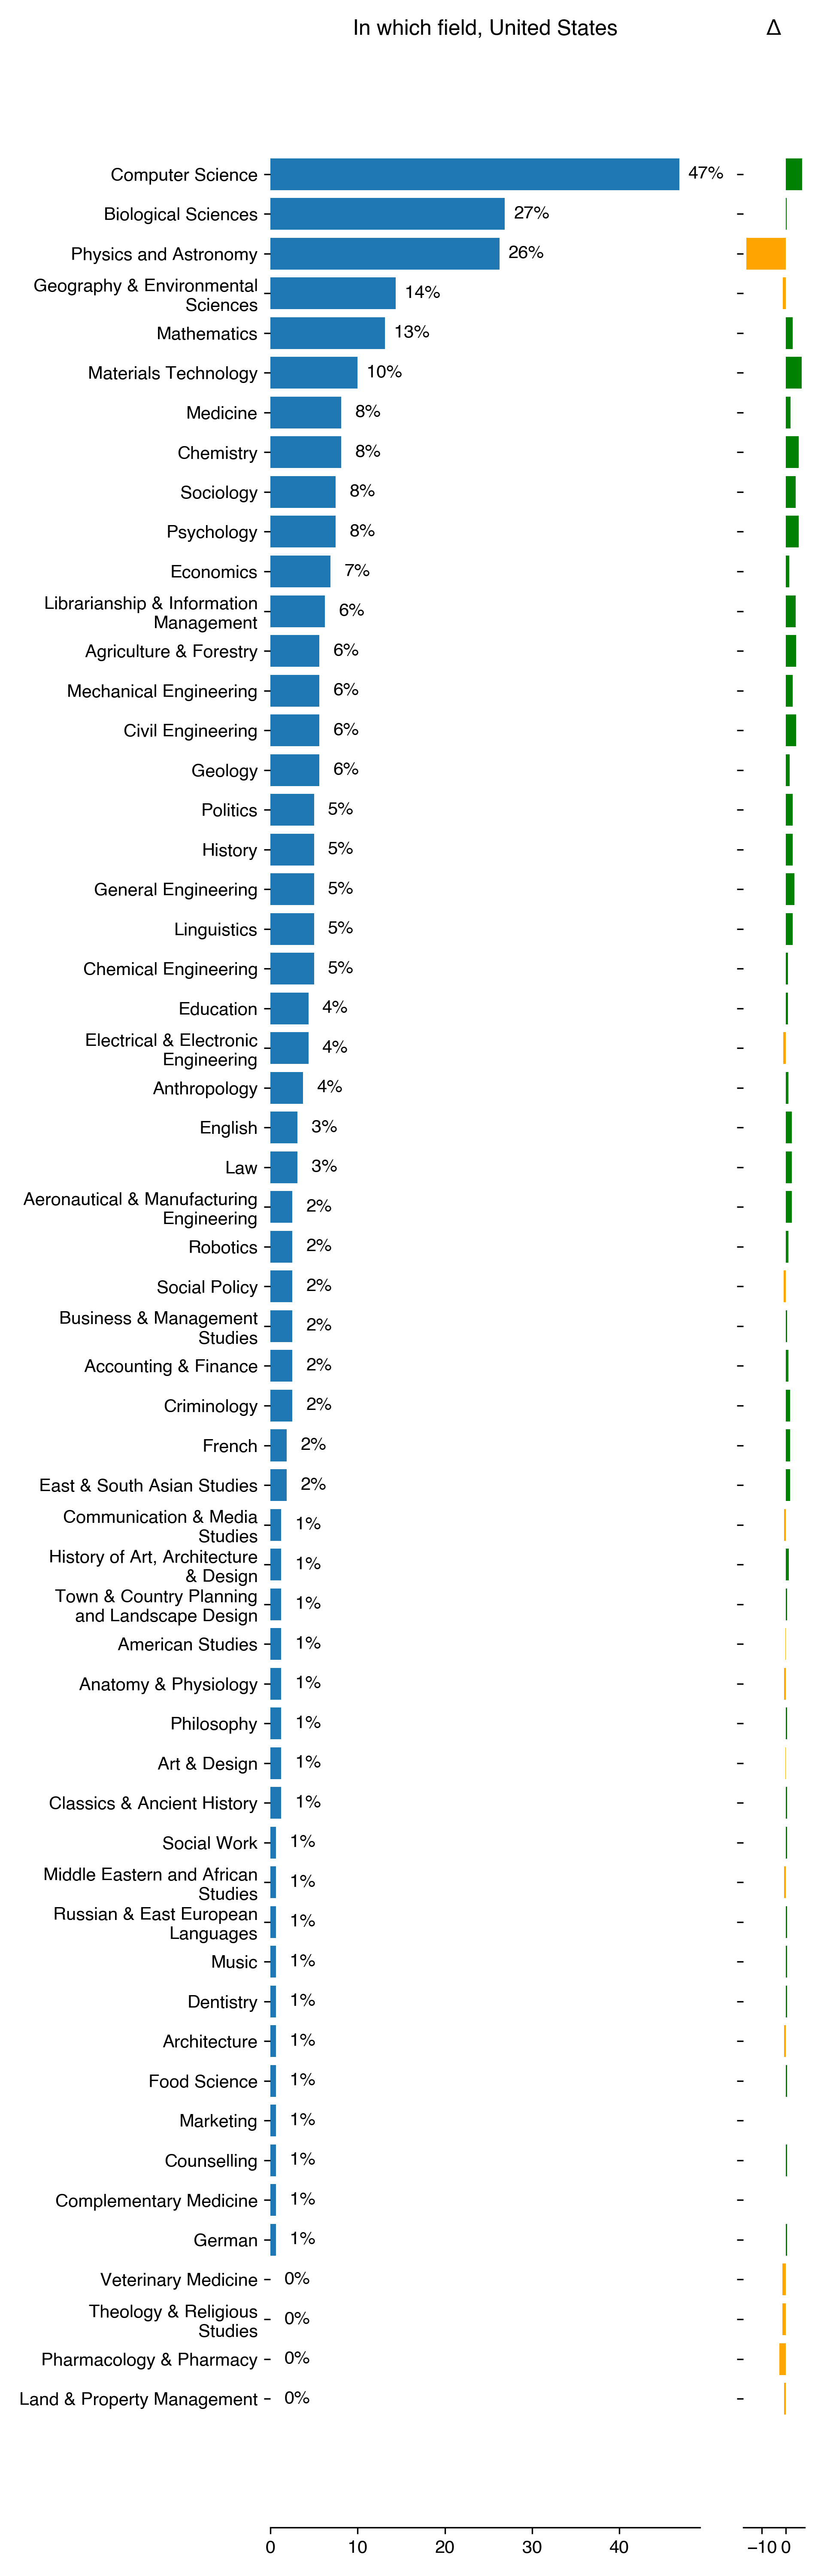
In which field are you working
| In which field for United States | Count | Percentage | Percentage in 2018 | Difference with previous year |
|---|---|---|---|---|
| Computer Science | 75 | 46.88 | 40.14 | 6.74 |
| Biological Sciences | 43 | 26.88 | 26.53 | 0.34 |
| Physics and Astronomy | 42 | 26.25 | 42.86 | -16.61 |
| Geography & Environmental Sciences | 23 | 14.37 | 15.65 | -1.27 |
| Mathematics | 21 | 13.12 | 10.2 | 2.92 |
| Materials Technology | 16 | 10 | 3.4 | 6.6 |
| Medicine | 13 | 8.12 | 6.12 | 2 |
| Chemistry | 13 | 8.12 | 2.72 | 5.4 |
| Sociology | 12 | 7.5 | 3.4 | 4.1 |
| Psychology | 12 | 7.5 | 2.04 | 5.46 |
| Economics | 11 | 6.88 | 5.44 | 1.43 |
| Librarianship & Information Management | 10 | 6.25 | 2.04 | 4.21 |
| Agriculture & Forestry | 9 | 5.62 | 1.36 | 4.26 |
| Mechanical Engineering | 9 | 5.62 | 2.72 | 2.9 |
| Civil Engineering | 9 | 5.62 | 1.36 | 4.26 |
| Geology | 9 | 5.62 | 4.08 | 1.54 |
| Politics | 8 | 5 | 2.04 | 2.96 |
| History | 8 | 5 | 2.04 | 2.96 |
| General Engineering | 8 | 5 | 1.36 | 3.64 |
| Linguistics | 8 | 5 | 2.04 | 2.96 |
| Chemical Engineering | 8 | 5 | 4.08 | 0.92 |
| Education | 7 | 4.38 | 3.4 | 0.97 |
| Electrical & Electronic Engineering | 7 | 4.38 | 5.44 | -1.07 |
| Anthropology | 6 | 3.75 | 2.72 | 1.03 |
| English | 5 | 3.12 | 0.68 | 2.44 |
| Law | 5 | 3.12 | 0.68 | 2.44 |
| Aeronautical & Manufacturing Engineering | 4 | 2.5 | 0 | 2.5 |
| Robotics | 4 | 2.5 | 1.36 | 1.14 |
| Social Policy | 4 | 2.5 | 3.4 | -0.9 |
| Business & Management Studies | 4 | 2.5 | 2.04 | 0.46 |
| Accounting & Finance | 4 | 2.5 | 1.36 | 1.14 |
| Criminology | 4 | 2.5 | 0.68 | 1.82 |
| French | 3 | 1.88 | 0 | 1.88 |
| East & South Asian Studies | 3 | 1.88 | 0 | 1.88 |
| Communication & Media Studies | 2 | 1.25 | 2.04 | -0.79 |
| History of Art, Architecture & Design | 2 | 1.25 | 0 | 1.25 |
| Town & Country Planning and Landscape Design | 2 | 1.25 | 0.68 | 0.57 |
| American Studies | 2 | 1.25 | 1.36 | -0.11 |
| Anatomy & Physiology | 2 | 1.25 | 2.04 | -0.79 |
| Philosophy | 2 | 1.25 | 0.68 | 0.57 |
| Art & Design | 2 | 1.25 | 1.36 | -0.11 |
| Classics & Ancient History | 2 | 1.25 | 0.68 | 0.57 |
| Social Work | 1 | 0.62 | 0 | 0.62 |
| Middle Eastern and African Studies | 1 | 0.62 | 1.36 | -0.74 |
| Russian & East European Languages | 1 | 0.62 | 0 | 0.62 |
| Music | 1 | 0.62 | 0 | 0.62 |
| Dentistry | 1 | 0.62 | 0 | 0.62 |
| Architecture | 1 | 0.62 | 1.36 | -0.74 |
| Food Science | 1 | 0.62 | 0 | 0.62 |
| Marketing | 1 | 0.62 | 0.68 | -0.06 |
| Counselling | 1 | 0.62 | 0 | 0.62 |
| Complementary Medicine | 1 | 0.62 | 0.68 | -0.06 |
| German | 1 | 0.62 | 0 | 0.62 |
| Veterinary Medicine | 0 | 0 | 1.36 | -1.36 |
| Theology & Religious Studies | 0 | 0 | 1.36 | -1.36 |
| Pharmacology & Pharmacy | 0 | 0 | 2.72 | -2.72 |
| Land & Property Management | 0 | 0 | 0.68 | -0.68 |
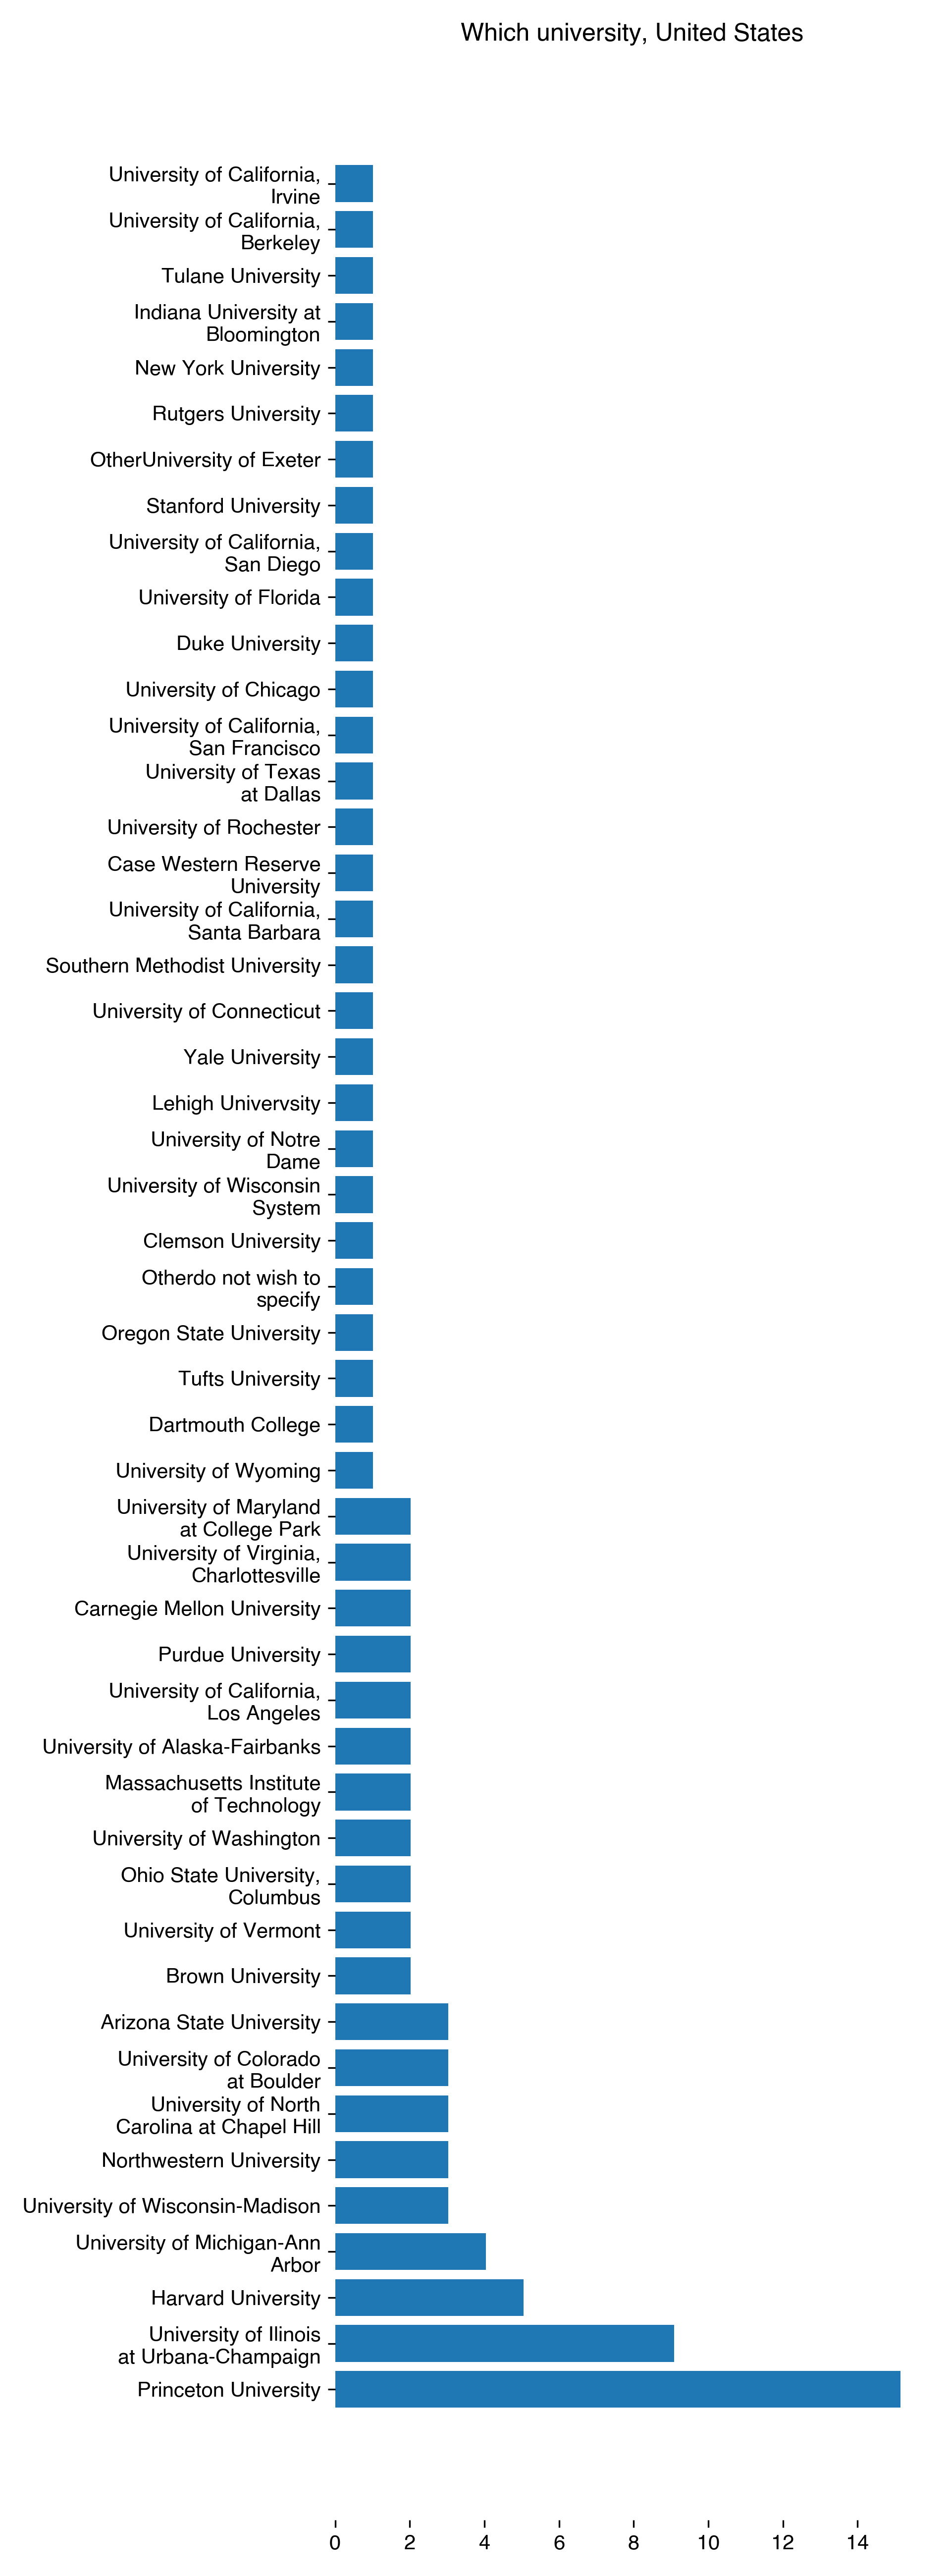
Which university or organization
| Which university for United States | Count | Percentage |
|---|---|---|
| Princeton University | 15 | 15.15 |
| University of Ilinois at Urbana-Champaign | 9 | 9.09 |
| Harvard University | 5 | 5.05 |
| University of Michigan-Ann Arbor | 4 | 4.04 |
| University of Wisconsin-Madison | 3 | 3.03 |
| Northwestern University | 3 | 3.03 |
| University of North Carolina at Chapel Hill | 3 | 3.03 |
| University of Colorado at Boulder | 3 | 3.03 |
| Arizona State University | 3 | 3.03 |
| University of Maryland at College Park | 2 | 2.02 |
| University of Virginia, Charlottesville | 2 | 2.02 |
| University of California, Los Angeles | 2 | 2.02 |
| Carnegie Mellon University | 2 | 2.02 |
| Purdue University | 2 | 2.02 |
| Brown University | 2 | 2.02 |
| University of Alaska-Fairbanks | 2 | 2.02 |
| Massachusetts Institute of Technology | 2 | 2.02 |
| University of Washington | 2 | 2.02 |
| Ohio State University, Columbus | 2 | 2.02 |
| University of Vermont | 2 | 2.02 |
| Dartmouth College | 1 | 1.01 |
| Tufts University | 1 | 1.01 |
| Oregon State University | 1 | 1.01 |
| University of Wyoming | 1 | 1.01 |
| University of California, Irvine | 1 | 1.01 |
| University of Wisconsin System | 1 | 1.01 |
| University of California, Berkeley | 1 | 1.01 |
| Tulane University | 1 | 1.01 |
| Indiana University at Bloomington | 1 | 1.01 |
| New York University | 1 | 1.01 |
| Rutgers University | 1 | 1.01 |
| OtherUniversity of Exeter | 1 | 1.01 |
| Stanford University | 1 | 1.01 |
| University of California, San Diego | 1 | 1.01 |
| University of Florida | 1 | 1.01 |
| Duke University | 1 | 1.01 |
| University of Chicago | 1 | 1.01 |
| University of California, San Francisco | 1 | 1.01 |
| University of Texas at Dallas | 1 | 1.01 |
| University of Rochester | 1 | 1.01 |
| Case Western Reserve University | 1 | 1.01 |
| University of California, Santa Barbara | 1 | 1.01 |
| Southern Methodist University | 1 | 1.01 |
| University of Connecticut | 1 | 1.01 |
| Yale University | 1 | 1.01 |
| Lehigh Univervsity | 1 | 1.01 |
| University of Notre Dame | 1 | 1.01 |
| Clemson University | 1 | 1.01 |
| Otherdo not wish to specify | 1 | 1.01 |
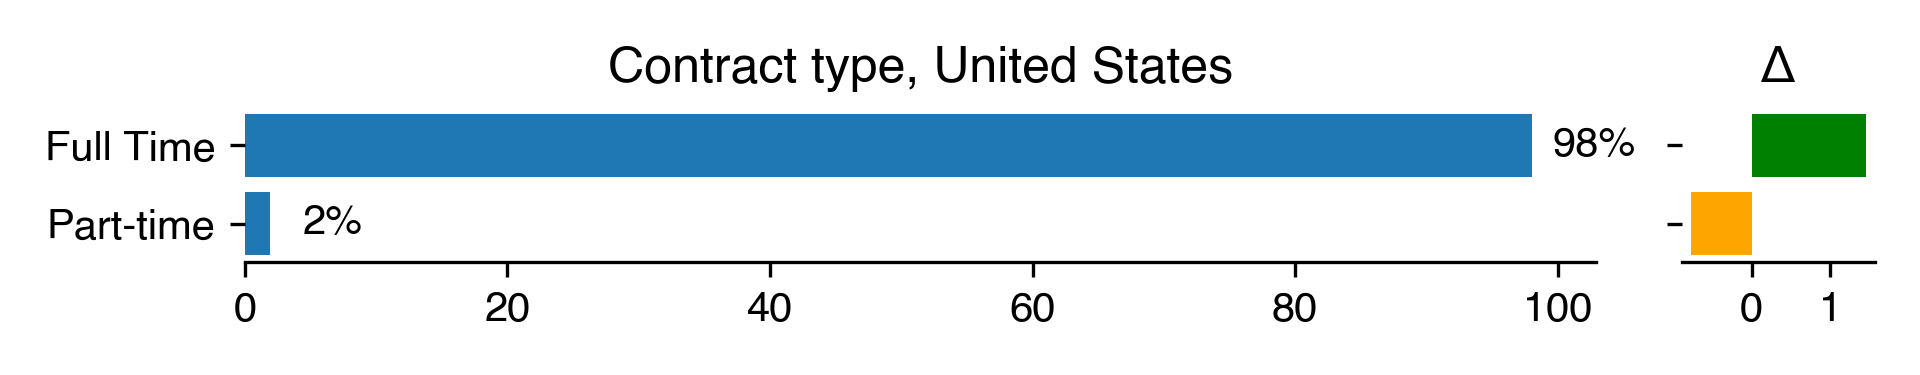
Full time or part-time
| Contract type for United States | Count | Percentage | Percentage in 2018 | Difference with previous year |
|---|---|---|---|---|
| Full Time | 151 | 98.05 | 96.6 | 1.45 |
| Part-time | 3 | 1.95 | 2.72 | -0.77 |
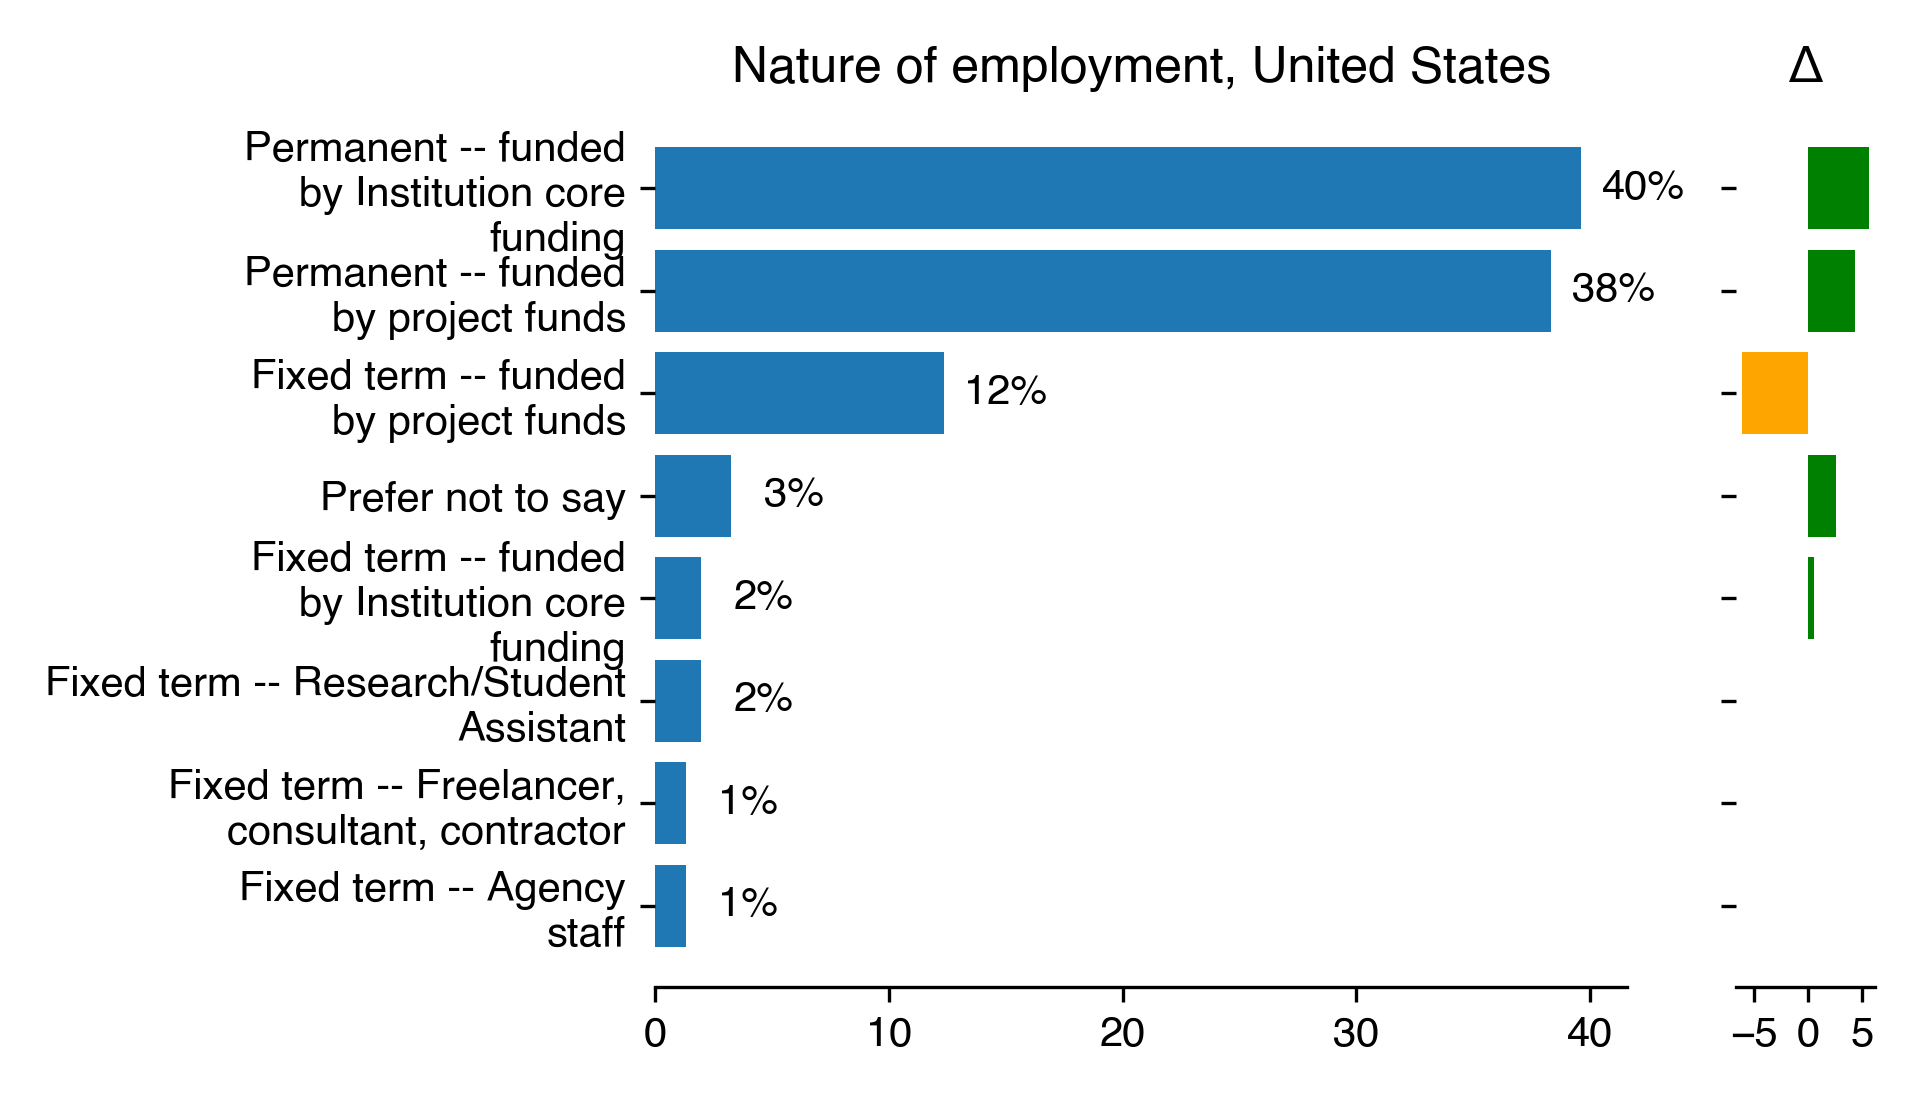
Type of contract
| Nature of employment for United States | Count | Percentage | Percentage in 2018 | Difference with previous year |
|---|---|---|---|---|
| Permanent – funded by Institution core funding | 61 | 39.61 | 34.01 | 5.6 |
| Permanent – funded by project funds | 59 | 38.31 | 34.01 | 4.3 |
| Fixed term – funded by project funds | 19 | 12.34 | 18.37 | -6.03 |
| Prefer not to say | 5 | 3.25 | 0.68 | 2.57 |
| Fixed term – funded by Institution core funding | 3 | 1.95 | 1.36 | 0.59 |
| Fixed term – Research/Student Assistant | 3 | 1.95 | nan | nan |
| Fixed term – Freelancer, consultant, contractor | 2 | 1.3 | nan | nan |
| Fixed term – Agency staff | 2 | 1.3 | nan | nan |
Length of current position
| Duration of contract in years for United States (without 95 percentile) | Results in 2022 | Results in 2018 |
|---|---|---|
| count | 21 | 100 |
| mean | 2.98 | 8.46 |
| std | 1.83 | 8.13 |
| min | -1 | 0.8 |
| 25% | 2 | 3 |
| 50% | 2 | 5 |
| 75% | 5 | 10 |
| max | 6 | 37 |
Salary
| Annual salary for United States | Count | Percentage | Percentage in 2018 | Difference with previous year |
|---|---|---|---|---|
| < $30,000 | 3 | 2.16 | 2.99 | -0.83 |
| ≥ $30,000 and < $49,999 | 7 | 5.04 | 6.72 | -1.68 |
| ≥ $50,000 and < $69,999 | 10 | 7.19 | 14.93 | -7.73 |
| ≥ $70,000 and < $89,999 | 19 | 13.67 | 16.42 | -2.75 |
| ≥ $90,000 and < $109,999 | 43 | 30.94 | 21.64 | 9.29 |
| ≥ $110,000 and < $129,999 | 27 | 19.42 | 20.9 | -1.47 |
| ≥ $130,000 and < $149,999 | 7 | 5.04 | 5.22 | -0.19 |
| ≥ $150,000 and < $199,999 | 14 | 10.07 | nan | nan |
| ≥ $150,000 | nan | nan | nan | nan |
| Prefer not to say | 3 | 2.16 | 2.99 | -0.83 |
Funding
| Type of funding for United States | Count | Percentage | Percentage in 2018 | Difference with previous year |
|---|---|---|---|---|
| Institutional support | 85 | 53.12 | 47.62 | 5.51 |
| Grants | 82 | 51.25 | 57.82 | -6.57 |
| Foundations & consortiums | 11 | 6.88 | 4.76 | 2.11 |
| Industry support | 9 | 5.62 | 4.08 | 1.54 |
| Consulting & services | 9 | 5.62 | 4.76 | 0.86 |
| other. Which of the following sources are used to pay for your effort as a Research Software Engineer? | 8 | 5 | 0 | 5 |
| Donation button | 2 | 1.25 | 0 | 1.25 |
| SaaS | 1 | 0.62 | 0 | 0.62 |
| Open core | 1 | 0.62 | 0 | 0.62 |
| Crowdfunding (recurring) | 1 | 0.62 | 0 | 0.62 |
| Advertising & sponsorships | 1 | 0.62 | 0.68 | -0.06 |
| Venture capital | 0 | 0 | 3.4 | -3.4 |
| I volunteer my time | 0 | 0 | 14.29 | -14.29 |
Job title
World
Type of organization
| Organisation type for World | Count | Percentage | Percentage in 2018 | Difference with previous year |
|---|---|---|---|---|
| University | 396 | 62.36 | 47.94 | 14.42 |
| National laboratory | 86 | 13.54 | 10.05 | 3.49 |
| Government | 56 | 8.82 | 5.43 | 3.39 |
| Non-profit organization | 39 | 6.14 | 4.42 | 1.72 |
| Private company | 39 | 6.14 | 3.92 | 2.22 |
| Other | 17 | 2.68 | 5.43 | -2.75 |
| NGO | 2 | 0.31 | 0.5 | -0.19 |
In which field are you working
| In which field for World | Count | Percentage | Percentage in 2018 | Difference with previous year |
|---|---|---|---|---|
| Computer Science | 425 | 42.63 | 35.58 | 7.05 |
| Biological Sciences | 273 | 27.38 | 21.61 | 5.77 |
| Physics and Astronomy | 248 | 24.87 | 27.14 | -2.26 |
| Geography & Environmental Sciences | 159 | 15.95 | 15.38 | 0.57 |
| Mathematics | 147 | 14.74 | 10.05 | 4.69 |
| Medicine | 111 | 11.13 | 8.34 | 2.79 |
| Chemistry | 95 | 9.53 | 6.73 | 2.79 |
| Mechanical Engineering | 66 | 6.62 | 5.83 | 0.79 |
| Education | 65 | 6.52 | 5.13 | 1.39 |
| Materials Technology | 59 | 5.92 | 4.92 | 0.99 |
| Agriculture & Forestry | 59 | 5.92 | 3.22 | 2.7 |
| General Engineering | 57 | 5.72 | 5.13 | 0.59 |
| Geology | 54 | 5.42 | 4.62 | 0.79 |
| Psychology | 51 | 5.12 | 2.41 | 2.7 |
| Electrical & Electronic Engineering | 47 | 4.71 | 6.93 | -2.22 |
| Civil Engineering | 46 | 4.61 | 3.42 | 1.2 |
| Linguistics | 45 | 4.51 | 2.91 | 1.6 |
| Librarianship & Information Management | 45 | 4.51 | 2.71 | 1.8 |
| Chemical Engineering | 40 | 4.01 | 3.02 | 1 |
| History | 39 | 3.91 | 3.12 | 0.8 |
| Sociology | 37 | 3.71 | 2.31 | 1.4 |
| Aeronautical & Manufacturing Engineering | 31 | 3.11 | 3.72 | -0.61 |
| Robotics | 30 | 3.01 | 4.12 | -1.11 |
| Economics | 30 | 3.01 | 3.02 | -0.01 |
| Business & Management Studies | 23 | 2.31 | 1.11 | 1.2 |
| Communication & Media Studies | 22 | 2.21 | 2.51 | -0.31 |
| English | 20 | 2.01 | 1.01 | 1 |
| Politics | 20 | 2.01 | 1.21 | 0.8 |
| Classics & Ancient History | 19 | 1.91 | 2.11 | -0.2 |
| Anthropology | 17 | 1.71 | 0.9 | 0.8 |
| Accounting & Finance | 16 | 1.6 | 1.11 | 0.5 |
| Food Science | 15 | 1.5 | 0.7 | 0.8 |
| Philosophy | 15 | 1.5 | 1.01 | 0.5 |
| Law | 15 | 1.5 | 0.9 | 0.6 |
| Art & Design | 13 | 1.3 | 1.51 | -0.2 |
| History of Art, Architecture & Design | 12 | 1.2 | 1.11 | 0.1 |
| Music | 12 | 1.2 | 0.7 | 0.5 |
| Information and computing sciences | 12 | 1.2 | 0 | 1.2 |
| Pharmacology & Pharmacy | 11 | 1.1 | 1.91 | -0.81 |
| Social Policy | 11 | 1.1 | 1.41 | -0.3 |
| Anatomy & Physiology | 10 | 1 | 1.31 | -0.3 |
| Criminology | 10 | 1 | 0.8 | 0.2 |
| Sports Science | 9 | 0.9 | 0.4 | 0.5 |
| Social Work | 9 | 0.9 | 0.6 | 0.3 |
| German | 9 | 0.9 | 1.51 | -0.6 |
| East & South Asian Studies | 9 | 0.9 | 0.3 | 0.6 |
| Architecture | 8 | 0.8 | 0.7 | 0.1 |
| Biomedical and clinical sciences | 7 | 0.7 | 0 | 0.7 |
| Middle Eastern and African Studies | 7 | 0.7 | 0.7 | -0 |
| Veterinary Medicine | 7 | 0.7 | 0.6 | 0.1 |
| French | 7 | 0.7 | 0.6 | 0.1 |
| Theology & Religious Studies | 7 | 0.7 | 1.21 | -0.5 |
| Earth sciences | 6 | 0.6 | 0 | 0.6 |
| Biological sciences | 6 | 0.6 | 0 | 0.6 |
| Health sciences | 6 | 0.6 | 0 | 0.6 |
| Complementary Medicine | 6 | 0.6 | 0.5 | 0.1 |
| Physical sciences | 6 | 0.6 | 0 | 0.6 |
| Built environment and design | 5 | 0.5 | 0 | 0.5 |
| Engineering | 5 | 0.5 | 0 | 0.5 |
| Language, communication and culture | 5 | 0.5 | 0 | 0.5 |
| Town & Country Planning and Landscape Design | 5 | 0.5 | 0.6 | -0.1 |
| Ophthalmics | 5 | 0.5 | 0.6 | -0.1 |
| American Studies | 5 | 0.5 | 0.6 | -0.1 |
| Dentistry | 5 | 0.5 | 0.6 | -0.1 |
| Marketing | 5 | 0.5 | 0.8 | -0.3 |
| Counselling | 4 | 0.4 | 0.2 | 0.2 |
| History, heritage and archaeology | 4 | 0.4 | 0 | 0.4 |
| Environmental sciences | 4 | 0.4 | 0 | 0.4 |
| Iberian Languages/Hispanic Studies | 4 | 0.4 | 0.5 | -0.1 |
| Commerce, management, tourism and services | 4 | 0.4 | 0 | 0.4 |
| Chemical sciences | 4 | 0.4 | 0 | 0.4 |
| Nursing | 4 | 0.4 | 0.4 | -0 |
| Human society | 4 | 0.4 | 0 | 0.4 |
| Economics.1 | 3 | 0.3 | 0 | 0.3 |
| Education.1 | 3 | 0.3 | 0 | 0.3 |
| Physiotherapy | 3 | 0.3 | 0.2 | 0.1 |
| Mathematical sciences | 2 | 0.2 | 0 | 0.2 |
| Psychology.1 | 2 | 0.2 | 0 | 0.2 |
| Indigenous studies | 2 | 0.2 | 0 | 0.2 |
| Russian & East European Languages | 2 | 0.2 | 0.2 | -0 |
| Land & Property Management | 2 | 0.2 | 0.6 | -0.4 |
| Fashion | 1 | 0.1 | 0.2 | -0.1 |
| Creative arts and writing | 1 | 0.1 | 0 | 0.1 |
| Law and legal studies | 1 | 0.1 | 0 | 0.1 |
| Philosophy and religious studies | 1 | 0.1 | 0 | 0.1 |
| Youth Work | 1 | 0.1 | 0.4 | -0.3 |
| Hospitality, Leisure, Recreation & Tourism | 1 | 0.1 | 0.2 | -0.1 |
| 02 Physical Sciences | 0 | 0 | 3.62 | -3.62 |
| 01 Mathematical Sciences | 0 | 0 | 2.41 | -2.41 |
| HEALTH SCIENCES | 0 | 0 | 0.1 | -0.1 |
| OTHER STUDIES IN NATURAL SCIENCES AND ENGINEERING | 0 | 0 | 0.2 | -0.2 |
| LIFE SCIENCES RESEARCH RELATED TO HUMAN HEALTH AND DISEASE | 0 | 0 | 0.2 | -0.2 |
| PSYCHOLOGY | 0 | 0 | 0.2 | -0.2 |
| EVOLUTION AND ECOLOGY | 0 | 0 | 0.2 | -0.2 |
| MICROBIOLOGY | 0 | 0 | 0.1 | -0.1 |
| 04 Earth Sciences | 0 | 0 | 2.21 | -2.21 |
| 03 Chemical Sciences | 0 | 0 | 1.01 | -1.01 |
| 17 Psychology and Cognitive Sciences | 0 | 0 | 0.3 | -0.3 |
| 05 Environmental Sciences | 0 | 0 | 2.11 | -2.11 |
| 15 Commerce, Management, Tourism and Services | 0 | 0 | 0.2 | -0.2 |
| HYDROLOGY | 0 | 0 | 0.1 | -0.1 |
| 22 Philosophy and Religious Studies | 0 | 0 | 0.3 | -0.3 |
| 21 History and Archaeology | 0 | 0 | 0.3 | -0.3 |
| 20 Language, Communication and Culture | 0 | 0 | 0.5 | -0.5 |
| 19 Studies in Creative Arts and Writing | 0 | 0 | 0.3 | -0.3 |
| 18 Law and Legal Studies | 0 | 0 | 0.1 | -0.1 |
| 16 Studies in Human Society | 0 | 0 | 0.4 | -0.4 |
| 14 Economics | 0 | 0 | 0.2 | -0.2 |
| 06 Biological Sciences | 0 | 0 | 3.42 | -3.42 |
| 13 Education | 0 | 0 | 0.9 | -0.9 |
| 12 Built Environment and Design | 0 | 0 | 0.2 | -0.2 |
| 11 Medical and Health Sciences | 0 | 0 | 2.41 | -2.41 |
| 10 Technology | 0 | 0 | 2.61 | -2.61 |
| 09 Engineering | 0 | 0 | 2.31 | -2.31 |
| 08 Information and Computing Sciences | 0 | 0 | 4.52 | -4.52 |
| 07 Agricultural and Veterinary Sciences | 0 | 0 | 1.01 | -1.01 |
| FLUID MECHANICS | 0 | 0 | 0.1 | -0.1 |
| BIOMEDICAL ENGINEERING | 0 | 0 | 0.1 | -0.1 |
| DESIGN AND MANUFACTURING | 0 | 0 | 0.1 | -0.1 |
| INDUSTRIAL ENGINEERING | 0 | 0 | 0.1 | -0.1 |
| ENVIRONMENTAL ENGINEERING | 0 | 0 | 0.1 | -0.1 |
| INFORMATION TECHNOLOGY | 0 | 0 | 0.2 | -0.2 |
| ARTIFICIAL INTELLIGENCE | 0 | 0 | 0.2 | -0.2 |
| PHYSICAL GEOGRAPHY | 0 | 0 | 0.1 | -0.1 |
| EARTH SCIENCE | 0 | 0 | 0.1 | -0.1 |
| CONDENSED MATTERPHYSICS | 0 | 0 | 0.1 | -0.1 |
| ASTRONOMY AND ASTROPHYSICS | 0 | 0 | 0.3 | -0.3 |
| THEORETICAL PHYSICS AND CHEMISTRY | 0 | 0 | 0.1 | -0.1 |
| PHYSICS | 0 | 0 | 0.1 | -0.1 |
| STATISTICS AND PROBABILITY | 0 | 0 | 0.4 | -0.4 |
| APPLIED MATHEMATICS | 0 | 0 | 0.1 | -0.1 |
Which university or organization
| Which university for World | Count | Percentage |
|---|---|---|
| Princeton University | 15 | 3.69 |
| Aalto University | 13 | 3.19 |
| University of Edinburgh | 13 | 3.19 |
| University of Cambridge | 11 | 2.7 |
| University of Oxford | 11 | 2.7 |
| Technische Universität Darmstadt | 11 | 2.7 |
| Durham University, Durham and Stockton-on-Tees (Queen’s Campus) | 10 | 2.46 |
| University College London (UCL) | 10 | 2.46 |
| OtherTU Braunschweig | 9 | 2.21 |
| University of Ilinois at Urbana-Champaign | 9 | 2.21 |
| University of Stuttgart | 8 | 1.97 |
| University of Potsdam | 8 | 1.97 |
| University of Manchester | 8 | 1.97 |
| Newcastle University | 7 | 1.72 |
| Imperial College London | 7 | 1.72 |
| Uppsala University | 7 | 1.72 |
| University of Göttingen | 7 | 1.72 |
| University of Helsinki | 7 | 1.72 |
| University of Nottingham | 6 | 1.47 |
| University of Sheffield | 6 | 1.47 |
| OtherTechnische Universität Braunschweig | 6 | 1.47 |
| University of Birmingham | 6 | 1.47 |
| TU Dresden | 5 | 1.23 |
| University of Bristol | 5 | 1.23 |
| University of Oslo | 5 | 1.23 |
| Harvard University | 5 | 1.23 |
| University of Oulu | 4 | 0.98 |
| Queensland University of Technology | 4 | 0.98 |
| Karolinska Institute | 4 | 0.98 |
| Karlsruhe Institute of Technology | 4 | 0.98 |
| University of Michigan-Ann Arbor | 4 | 0.98 |
| University of Southampton | 4 | 0.98 |
| The University of Auckland | 4 | 0.98 |
| King’s College London | 4 | 0.98 |
| The Australian National University | 3 | 0.74 |
| University of Colorado at Boulder | 3 | 0.74 |
| Northwestern University | 3 | 0.74 |
| University of Würzburg | 3 | 0.74 |
| The University of Melbourne | 3 | 0.74 |
| University of Wisconsin-Madison | 3 | 0.74 |
| Arizona State University | 3 | 0.74 |
| University of North Carolina at Chapel Hill | 3 | 0.74 |
| University of Jena | 3 | 0.74 |
| Queen’s University Belfast | 2 | 0.49 |
| University of Vaasa | 2 | 0.49 |
| Brown University | 2 | 0.49 |
| University of Alaska-Fairbanks | 2 | 0.49 |
| Purdue University | 2 | 0.49 |
| University of Canterbury | 2 | 0.49 |
| University of York | 2 | 0.49 |
| Norwegian University of Science and Technology | 2 | 0.49 |
| Lancaster University | 2 | 0.49 |
| Ohio State University, Columbus | 2 | 0.49 |
| University of Bonn | 2 | 0.49 |
| University of Maryland at College Park | 2 | 0.49 |
| University of Hull, Hull and Scarborough | 2 | 0.49 |
| Royal Institute of Technology | 2 | 0.49 |
| Carnegie Mellon University | 2 | 0.49 |
| University of Stellenbosch | 2 | 0.49 |
| University of Jyväskylä | 2 | 0.49 |
| University of Turku | 2 | 0.49 |
| University of Virginia, Charlottesville | 2 | 0.49 |
| Chalmers University of Technology | 2 | 0.49 |
| University of Vermont | 2 | 0.49 |
| Massachusetts Institute of Technology | 2 | 0.49 |
| University of California, Los Angeles | 2 | 0.49 |
| Lund University | 2 | 0.49 |
| TU Dortmund | 2 | 0.49 |
| Cardiff University | 2 | 0.49 |
| Swansea University | 2 | 0.49 |
| University of Hamburg | 2 | 0.49 |
| University of Washington | 2 | 0.49 |
| Duke University | 1 | 0.25 |
| Technical University of Munich | 1 | 0.25 |
| University of Kiel | 1 | 0.25 |
| University of Chicago | 1 | 0.25 |
| Leipzig University | 1 | 0.25 |
| University of Bremen | 1 | 0.25 |
| OtherUK | 1 | 0.25 |
| University of California, Irvine | 1 | 0.25 |
| University of Florida | 1 | 0.25 |
| Victoria University of Wellington | 1 | 0.25 |
| OtherUniversity of Exeter | 1 | 0.25 |
| Rutgers University | 1 | 0.25 |
| RWTH Aachen University | 1 | 0.25 |
| New York University | 1 | 0.25 |
| University of Newcastle | 1 | 0.25 |
| Ludwig Maximilian University of Munich | 1 | 0.25 |
| University of Wisconsin System | 1 | 0.25 |
| Tulane University | 1 | 0.25 |
| Goethe University Frankfurt | 1 | 0.25 |
| The Open University, Milton Keynes | 1 | 0.25 |
| University of California, Berkeley | 1 | 0.25 |
| University of Erlangen-Nuremberg | 1 | 0.25 |
| University of California, San Francisco | 1 | 0.25 |
| The University of Sydney | 1 | 0.25 |
| Dartmouth College | 1 | 0.25 |
| Tufts University | 1 | 0.25 |
| Oregon State University | 1 | 0.25 |
| University of Wyoming | 1 | 0.25 |
| AUT University | 1 | 0.25 |
| Stanford University | 1 | 0.25 |
| Indiana University at Bloomington | 1 | 0.25 |
| Linköping University | 1 | 0.25 |
| Åbo Akademi University | 1 | 0.25 |
| The University of Queensland | 1 | 0.25 |
| University of Texas at Dallas | 1 | 0.25 |
| University of Freiburg | 1 | 0.25 |
| Southern Methodist University | 1 | 0.25 |
| University of Glasgow | 1 | 0.25 |
| University of East Anglia, Norwich | 1 | 0.25 |
| University of Hanover | 1 | 0.25 |
| Free University of Berlin | 1 | 0.25 |
| University of Trier | 1 | 0.25 |
| University of Duisburg-Essen | 1 | 0.25 |
| University of Münster | 1 | 0.25 |
| Chemnitz University of Technology | 1 | 0.25 |
| Heidelberg University | 1 | 0.25 |
| University of Connecticut | 1 | 0.25 |
| Yale University | 1 | 0.25 |
| University of Reading | 1 | 0.25 |
| OtherUniversity College London | 1 | 0.25 |
| Lehigh Univervsity | 1 | 0.25 |
| University of Notre Dame | 1 | 0.25 |
| Clemson University | 1 | 0.25 |
| The Arctic University of Norway | 1 | 0.25 |
| University of Canberra | 1 | 0.25 |
| University of Rochester | 1 | 0.25 |
| Swinburne University of Technology | 1 | 0.25 |
| Macquarie University | 1 | 0.25 |
| University of Leeds | 1 | 0.25 |
| University of Tasmania | 1 | 0.25 |
| Curtin University of Technology | 1 | 0.25 |
| Case Western Reserve University | 1 | 0.25 |
| University of St Andrews | 1 | 0.25 |
| University of Warwick, Coventry | 1 | 0.25 |
| University of Otago | 1 | 0.25 |
| University of California, San Diego | 1 | 0.25 |
| University of California, Santa Barbara | 1 | 0.25 |
| OtherUniversity of Cambridge, UK | 1 | 0.25 |
| University of Leicester | 1 | 0.25 |
| Universidad Nacional de San Juan, San Juan | 1 | 0.25 |
| University of Konstanz | 1 | 0.25 |
| University of Gothenburg | 1 | 0.25 |
| OtherBundeswehr University Munich | 1 | 0.25 |
| University of Western Sydney | 1 | 0.25 |
| Otherdo not wish to specify | 1 | 0.25 |
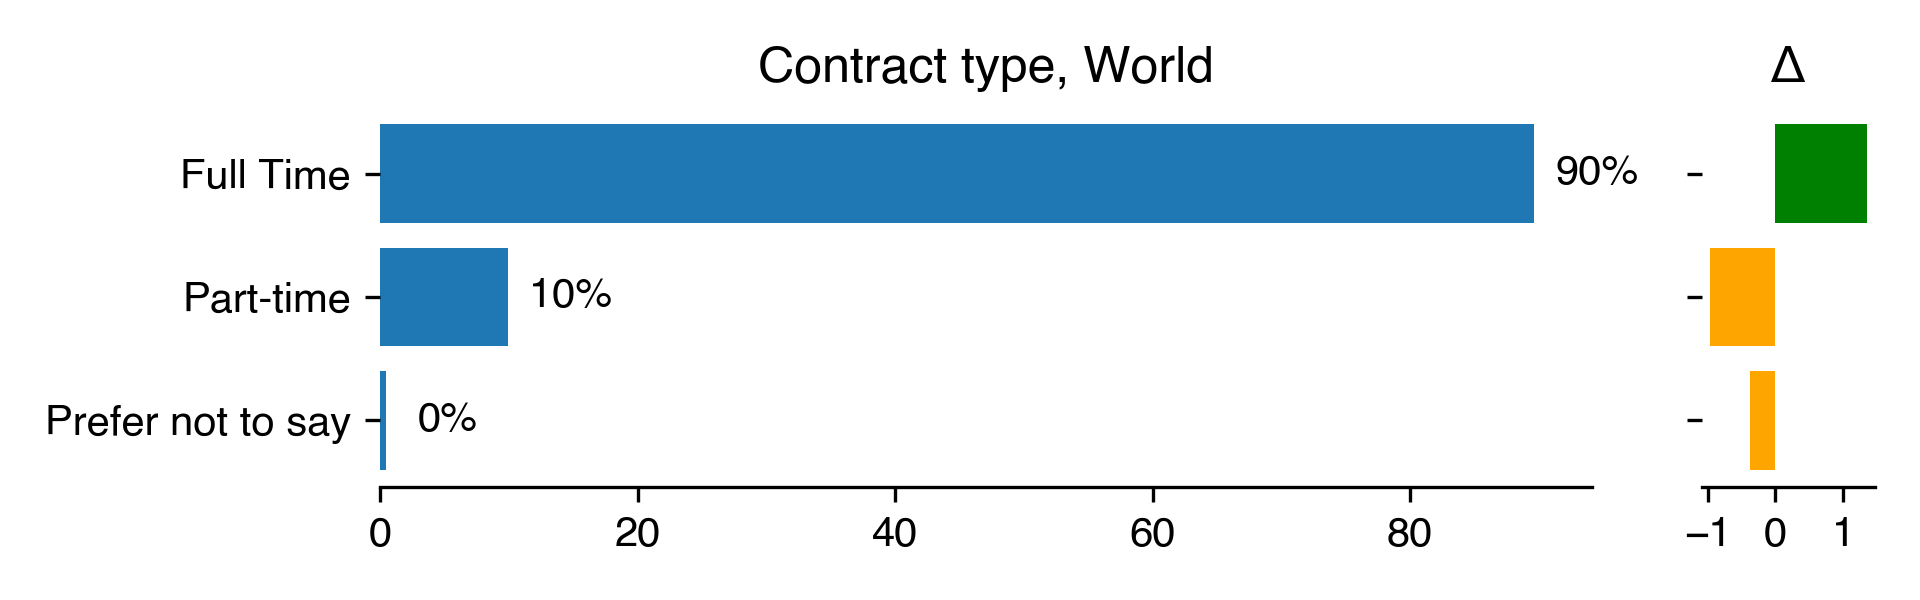
Full time or part-time
| Contract type for World | Count | Percentage | Percentage in 2018 | Difference with previous year |
|---|---|---|---|---|
| Full Time | 833 | 89.67 | 88.31 | 1.35 |
| Part-time | 92 | 9.9 | 10.87 | -0.97 |
| Prefer not to say | 4 | 0.43 | 0.81 | -0.38 |
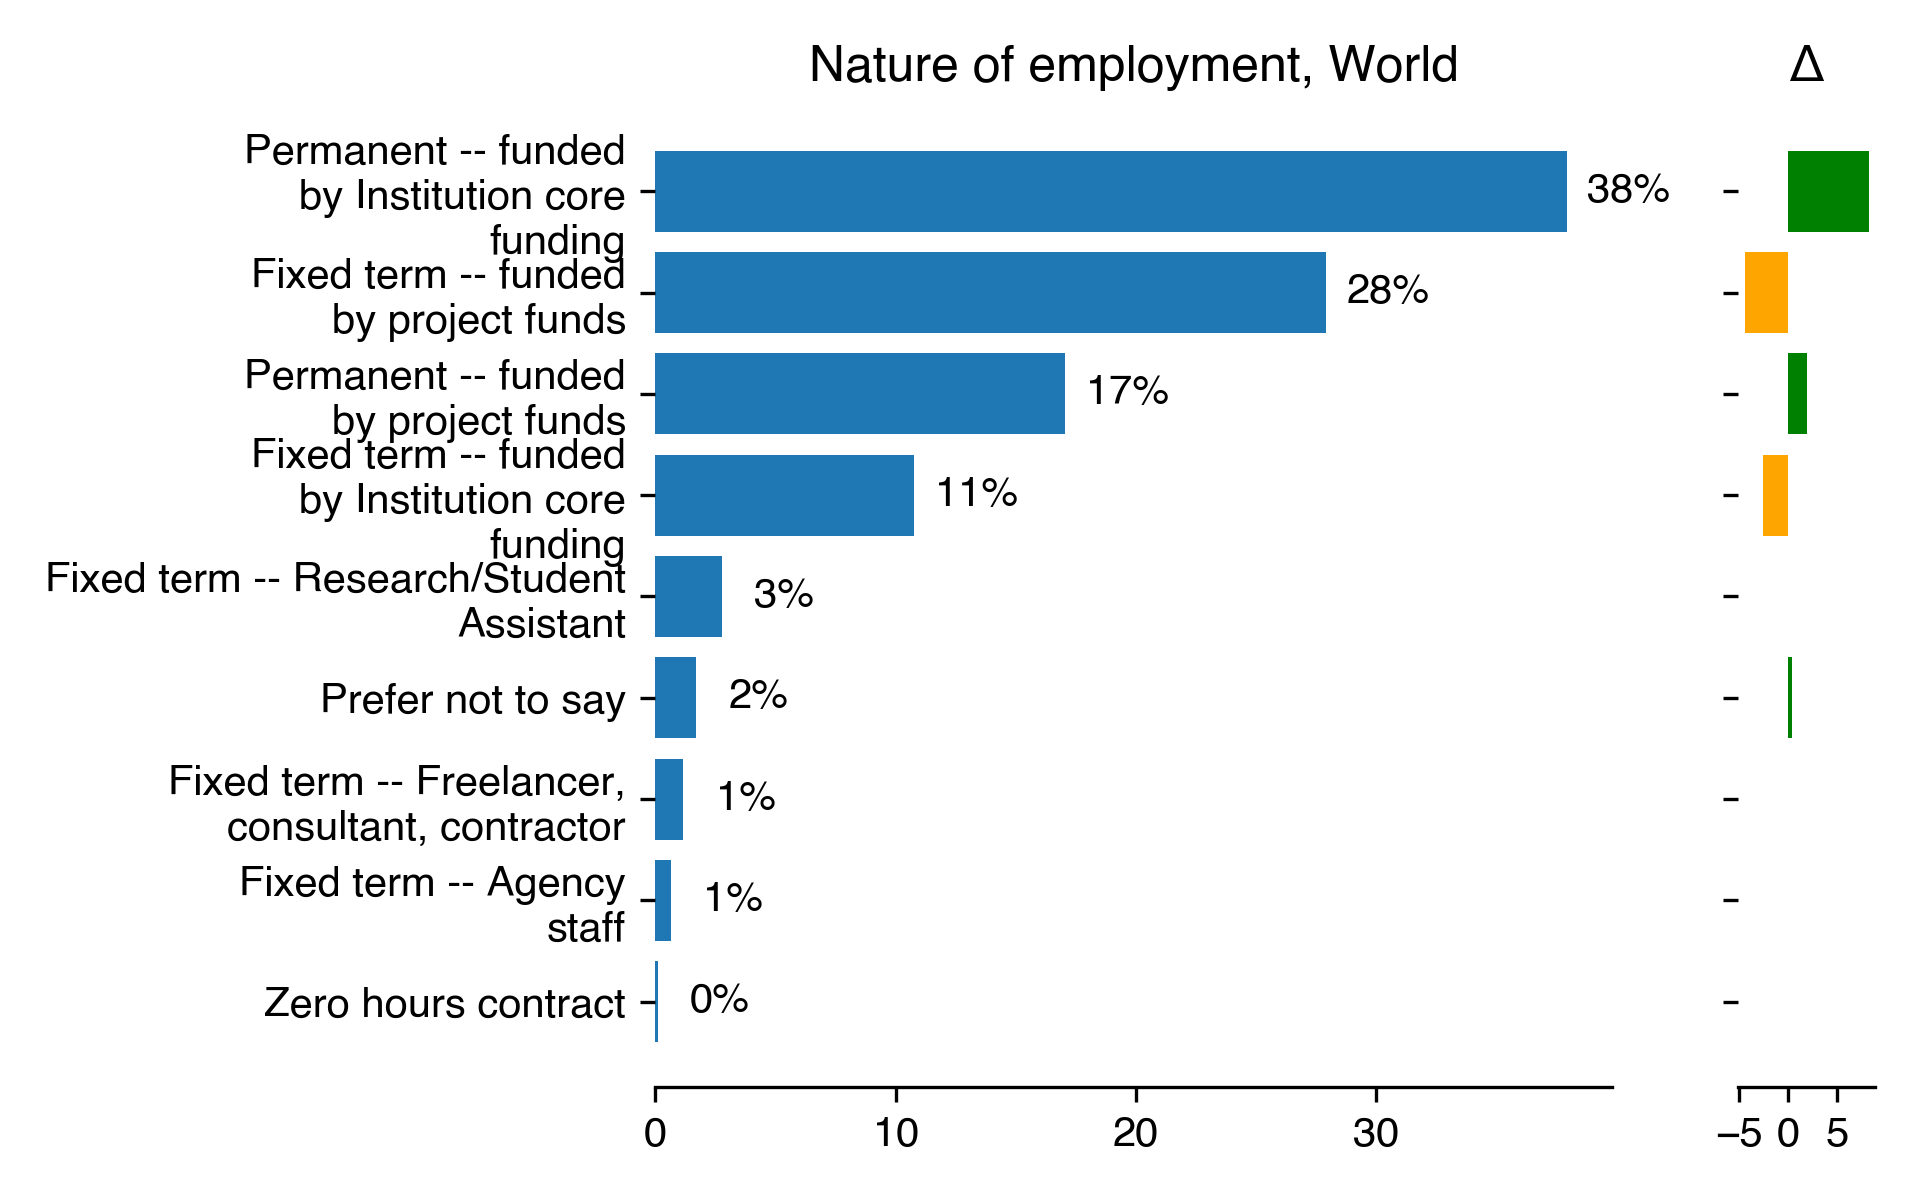
Type of contract
| Nature of employment for World | Count | Percentage | Percentage in 2018 | Difference with previous year |
|---|---|---|---|---|
| Permanent – funded by Institution core funding | 356 | 37.91 | 29.65 | 8.26 |
| Fixed term – funded by project funds | 262 | 27.9 | 32.36 | -4.46 |
| Permanent – funded by project funds | 160 | 17.04 | 15.08 | 1.96 |
| Fixed term – funded by Institution core funding | 101 | 10.76 | 13.37 | -2.61 |
| Fixed term – Research/Student Assistant | 26 | 2.77 | nan | nan |
| Prefer not to say | 16 | 1.7 | 1.31 | 0.4 |
| Fixed term – Freelancer, consultant, contractor | 11 | 1.17 | nan | nan |
| Fixed term – Agency staff | 6 | 0.64 | nan | nan |
| Zero hours contract | 1 | 0.11 | 0.1 | 0.01 |
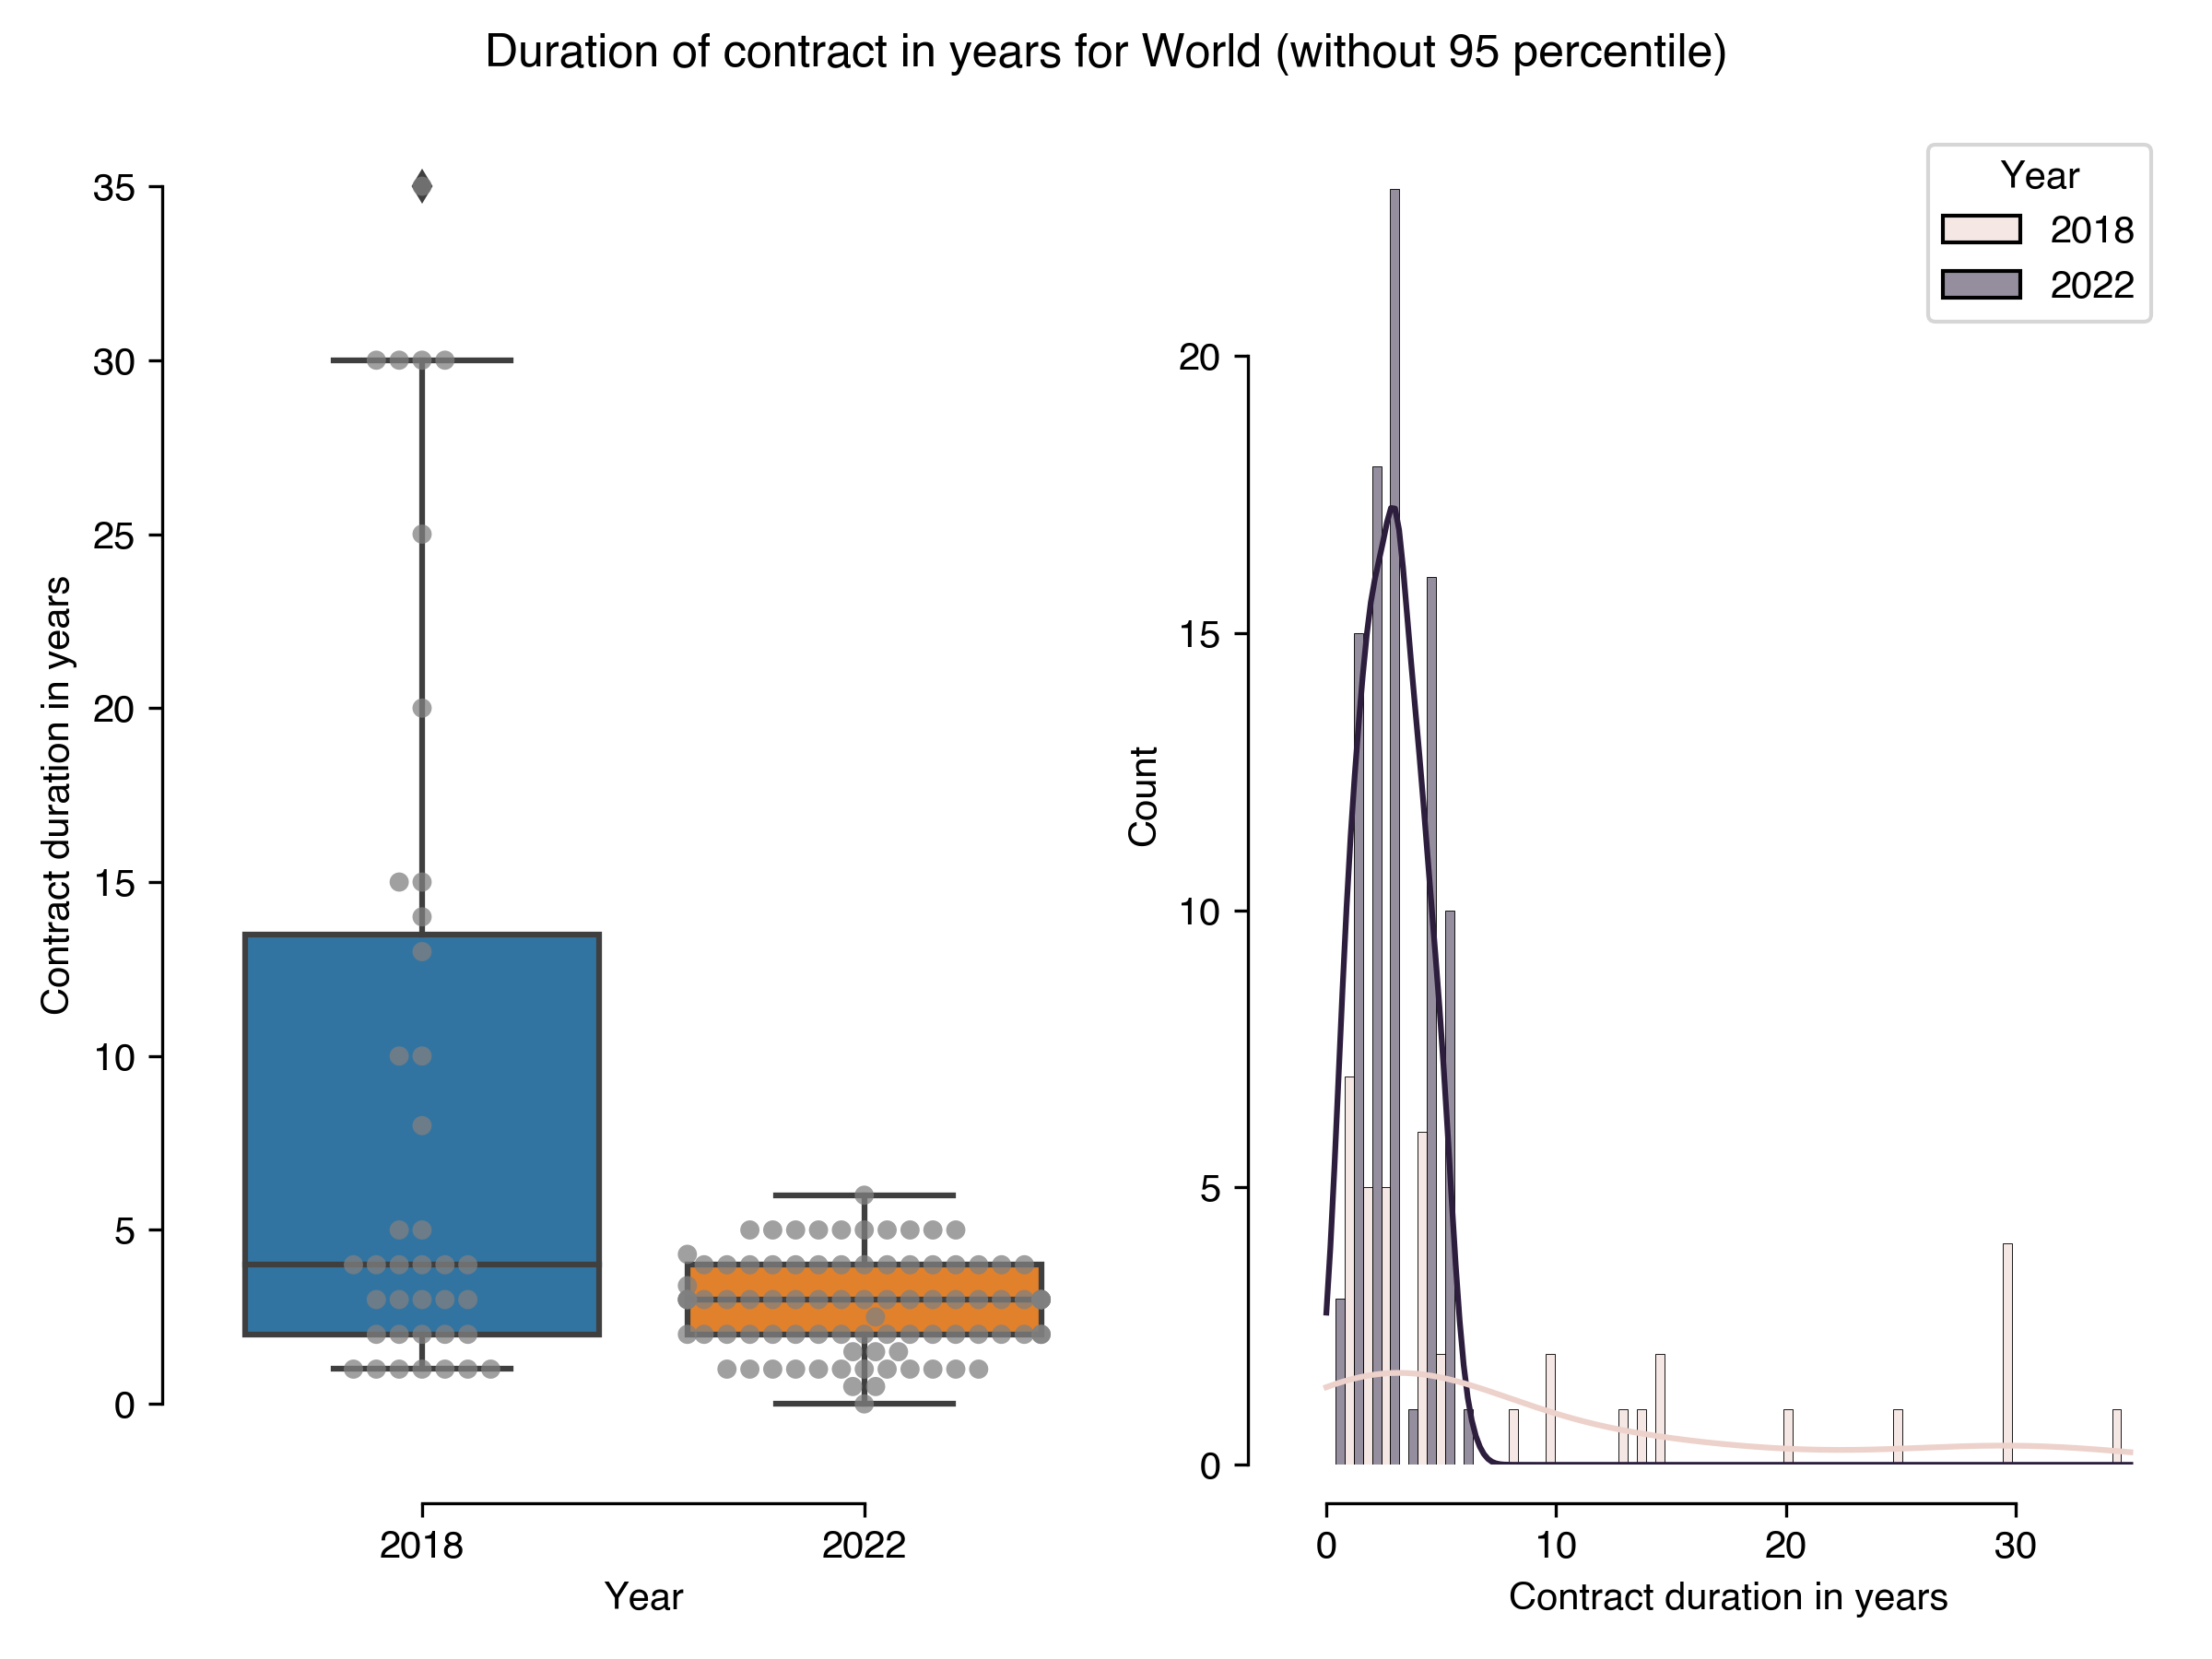
Length of current position
| Duration of contract in years for World (without 95 percentile) | Results in 2022 | Results in 2018 |
|---|---|---|
| count | 87 | 39 |
| mean | 2.82 | 9 |
| std | 1.35 | 10.24 |
| min | 0 | 1 |
| 25% | 2 | 2 |
| 50% | 3 | 4 |
| 75% | 4 | 13.5 |
| max | 6 | 35 |