Australia Germany Netherlands New Zealand South Africa United Kingdom United States World
In this section we investigate the relationship between RSEs/RSDs and their own
experience in software development Understandably, we expect them having
several years of software development experience. However, as shown in previous
years, it is not necessarily reflected upon their own feeling of being
considered as professional.
Questions in this section:
Do you consider yourself a professional software developer? (Yes/No)
How many years of software development experience do you have? (integer)
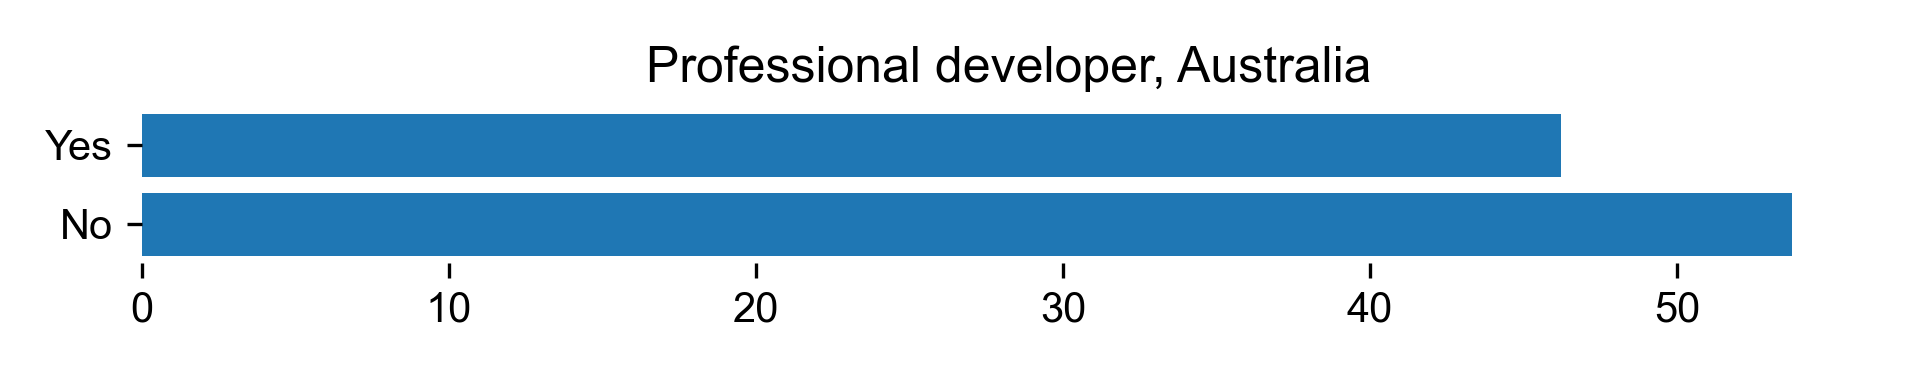
Professional developer for Australia
Count
Percentage
Yes
43
46.2366
No
50
53.7634
Download CSV
2021-08-04T21:05:04.448474
image/svg+xml
Matplotlib v3.4.2, https://matplotlib.org/
0
10
20
30
40
50
No
Yes
Professional developer, Australia
PNG SVG
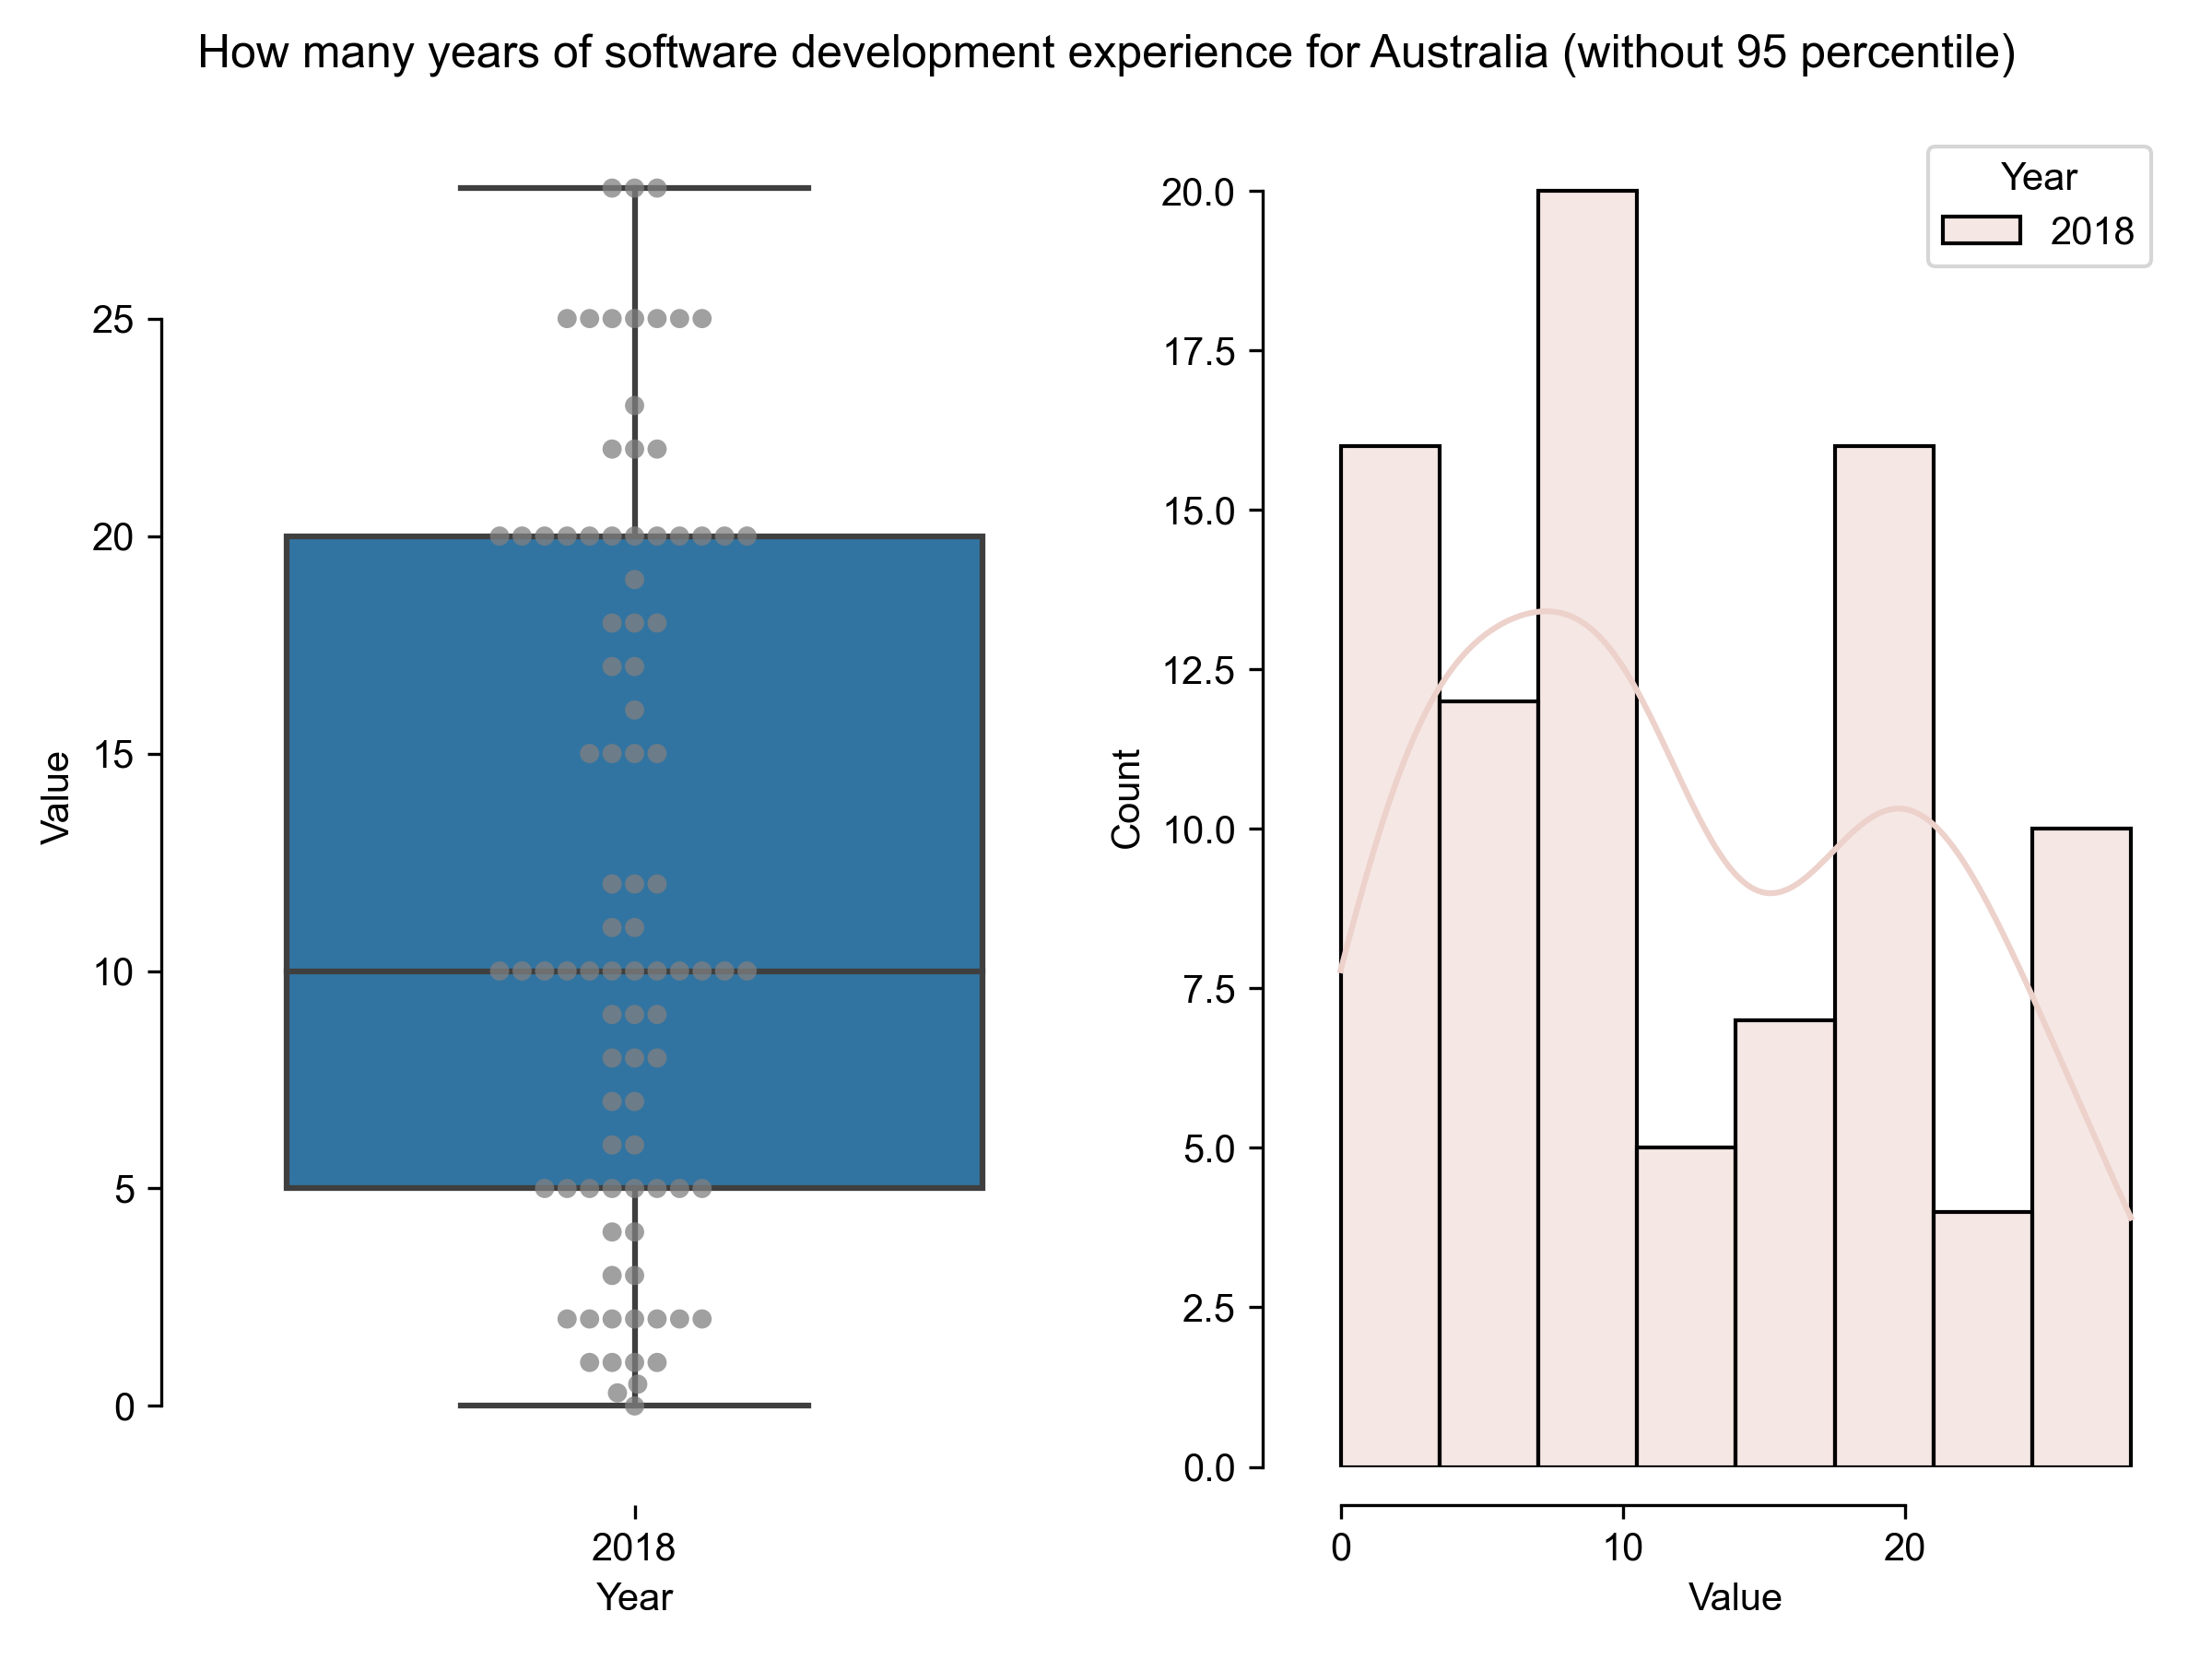
How many years of software development experience for Australia (without 95 percentile)
Results in 2018
count
90
mean
12.2089
std
8.15662
min
0
25%
5
50%
10
75%
20
max
28
Download CSV
2021-08-04T21:05:05.050213
image/svg+xml
Matplotlib v3.4.2, https://matplotlib.org/
2018
Year
0
5
10
15
20
25
Value
0
10
20
Value
0.0
2.5
5.0
7.5
10.0
12.5
15.0
17.5
20.0
Count
Year
2018
How many years of software development experience for Australia (without 95 percentile)
PNG SVG
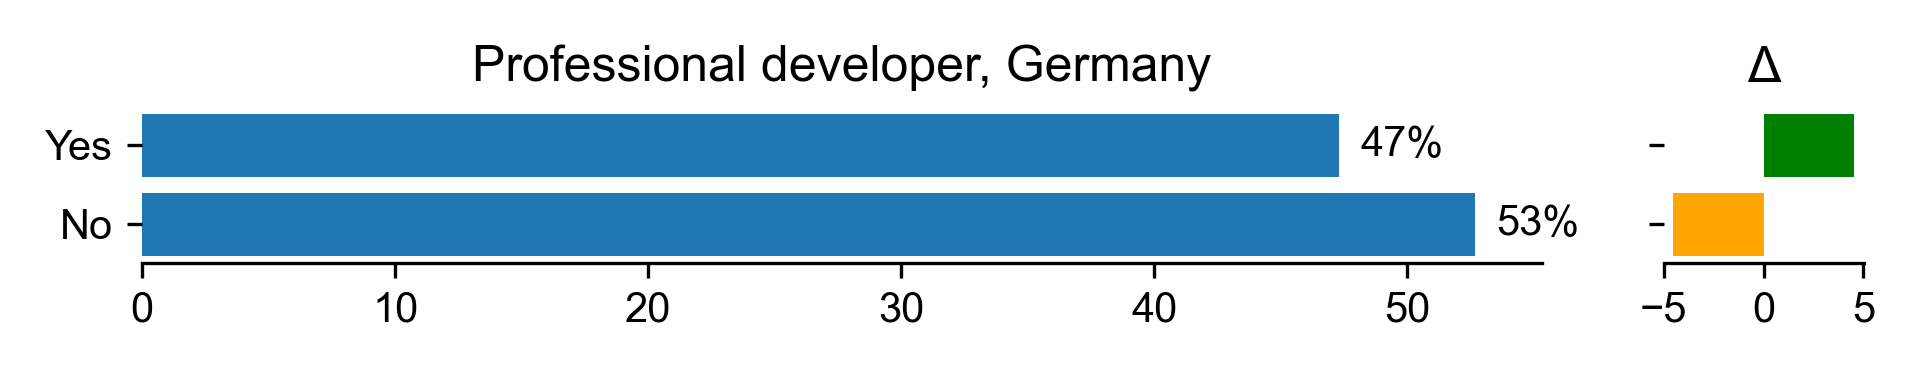
Professional developer for Germany
Count
Percentage
Percentage in 2017
Difference with previous year
Yes
150
47.3186
42.7692
4.54938
No
167
52.6814
57.2308
-4.54938
Download CSV
2021-08-04T21:05:05.356903
image/svg+xml
Matplotlib v3.4.2, https://matplotlib.org/
0
10
20
30
40
50
No
Yes
53%
47%
Professional developer, Germany
−5
0
5
Δ
PNG SVG
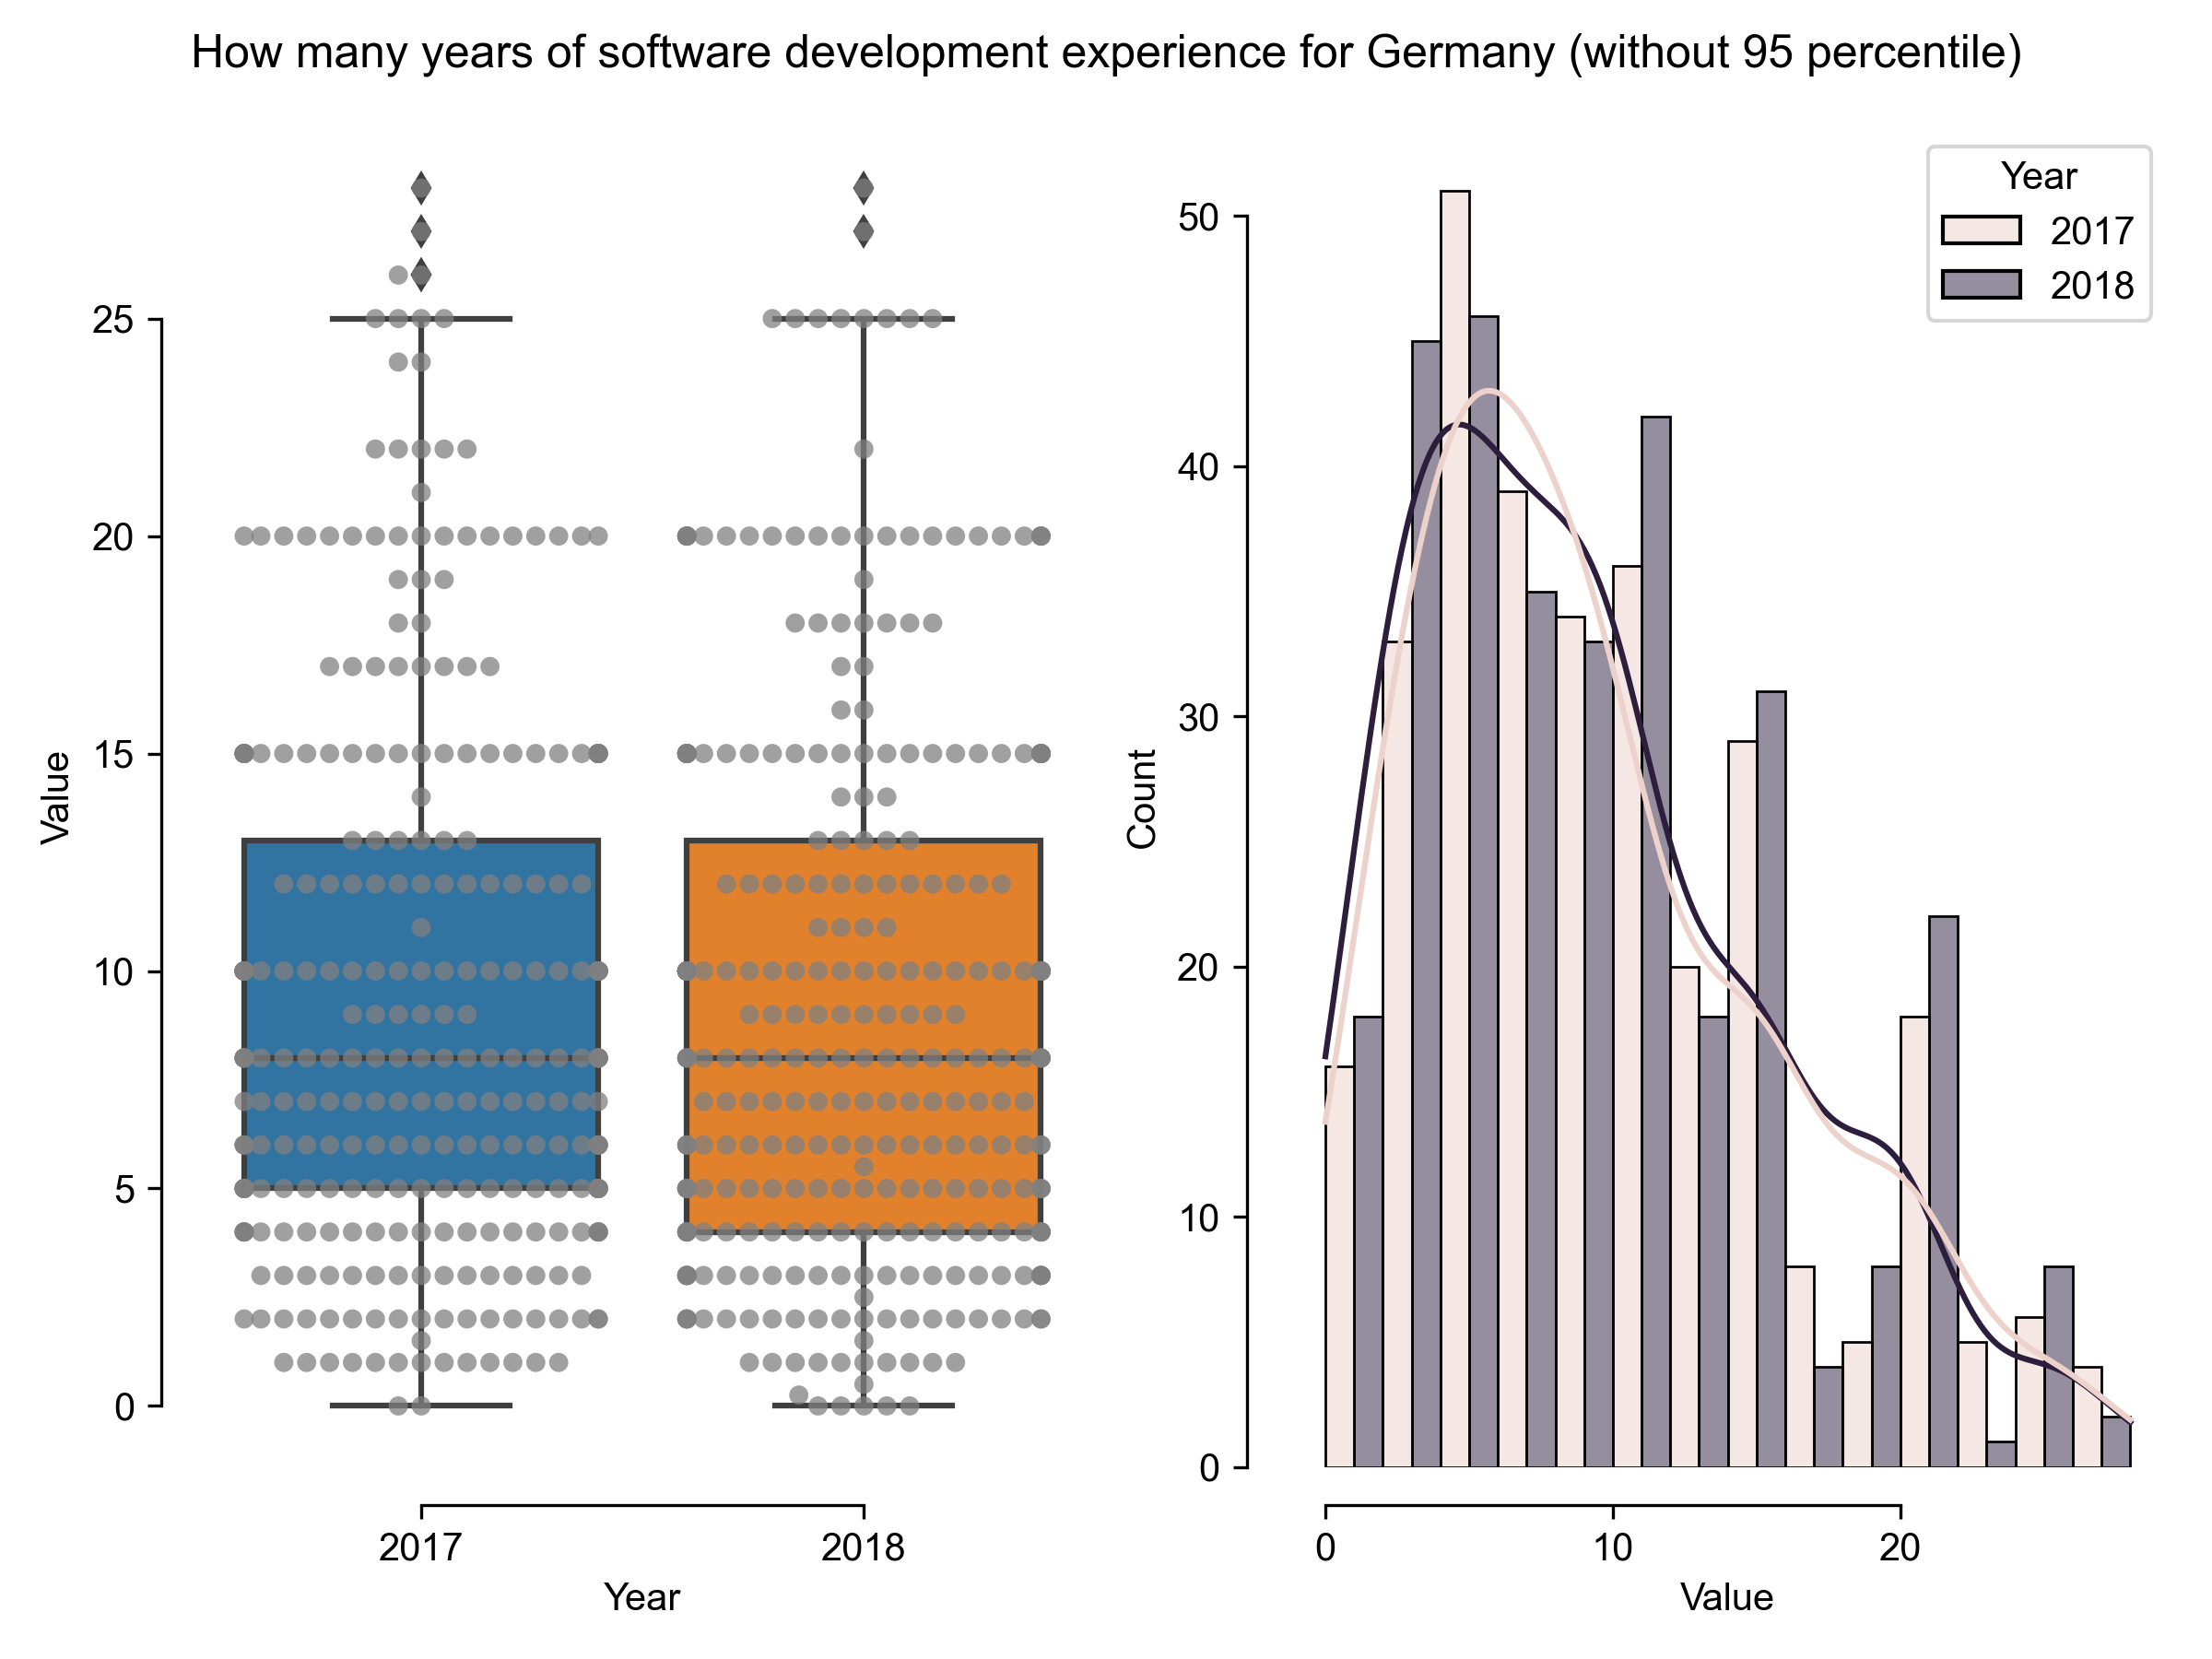
How many years of software development experience for Germany (without 95 percentile)
Results in 2018
Results in 2017
count
313
304
mean
9.16374
9.38322
std
6.23297
6.23934
min
0
0
25%
4
5
50%
8
8
75%
13
13
max
28
28
Download CSV
2021-08-04T21:05:06.380979
image/svg+xml
Matplotlib v3.4.2, https://matplotlib.org/
2017
2018
Year
0
5
10
15
20
25
Value
0
10
20
Value
0
10
20
30
40
50
Count
Year
2017
2018
How many years of software development experience for Germany (without 95 percentile)
PNG SVG
Professional developer for Netherlands
Count
Percentage
Percentage in 2017
Difference with previous year
Yes
29
54.717
65.3333
-10.6164
No
24
45.283
34.6667
10.6164
Download CSV
2021-08-04T21:05:06.756427
image/svg+xml
Matplotlib v3.4.2, https://matplotlib.org/
0
10
20
30
40
50
No
Yes
45%
55%
Professional developer, Netherlands
−10
0
10
Δ
PNG SVG
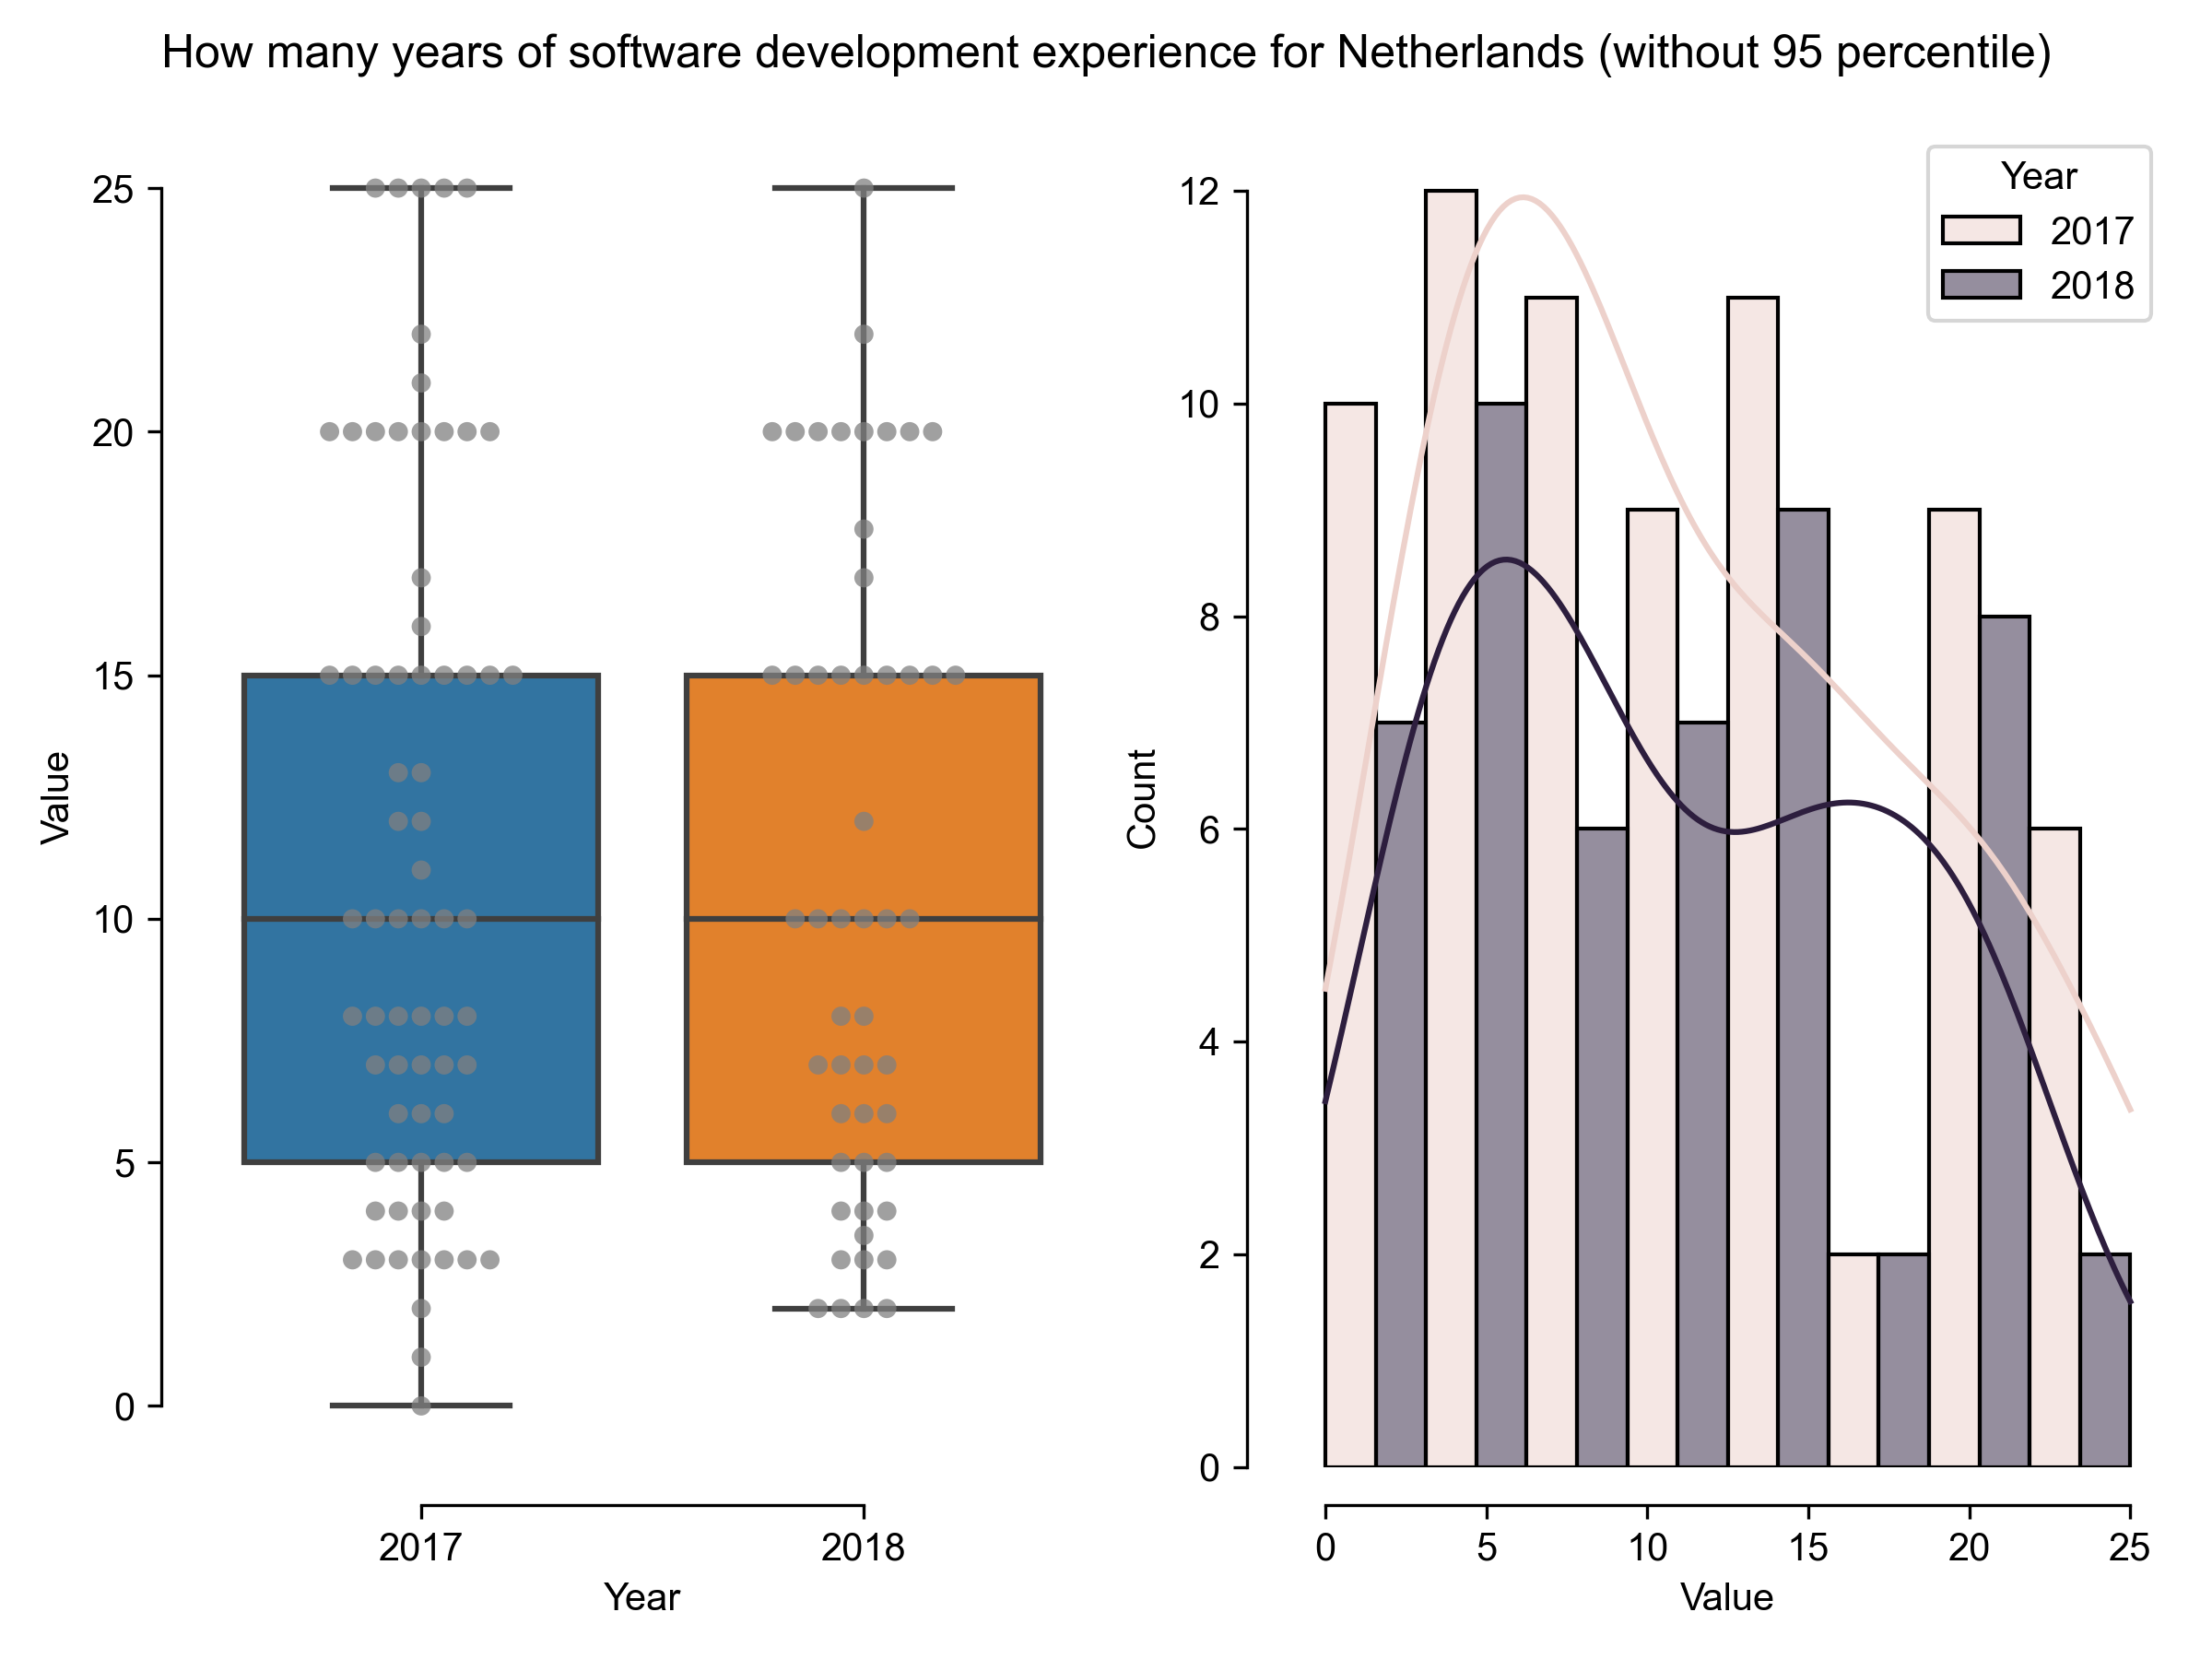
How many years of software development experience for Netherlands (without 95 percentile)
Results in 2018
Results in 2017
count
51
70
mean
10.951
11.1857
std
6.61079
7.02231
min
2
0
25%
5
5
50%
10
10
75%
15
15
max
25
25
Download CSV
2021-08-04T21:05:07.458647
image/svg+xml
Matplotlib v3.4.2, https://matplotlib.org/
2017
2018
Year
0
5
10
15
20
25
Value
0
5
10
15
20
25
Value
0
2
4
6
8
10
12
Count
Year
2017
2018
How many years of software development experience for Netherlands (without 95 percentile)
PNG SVG
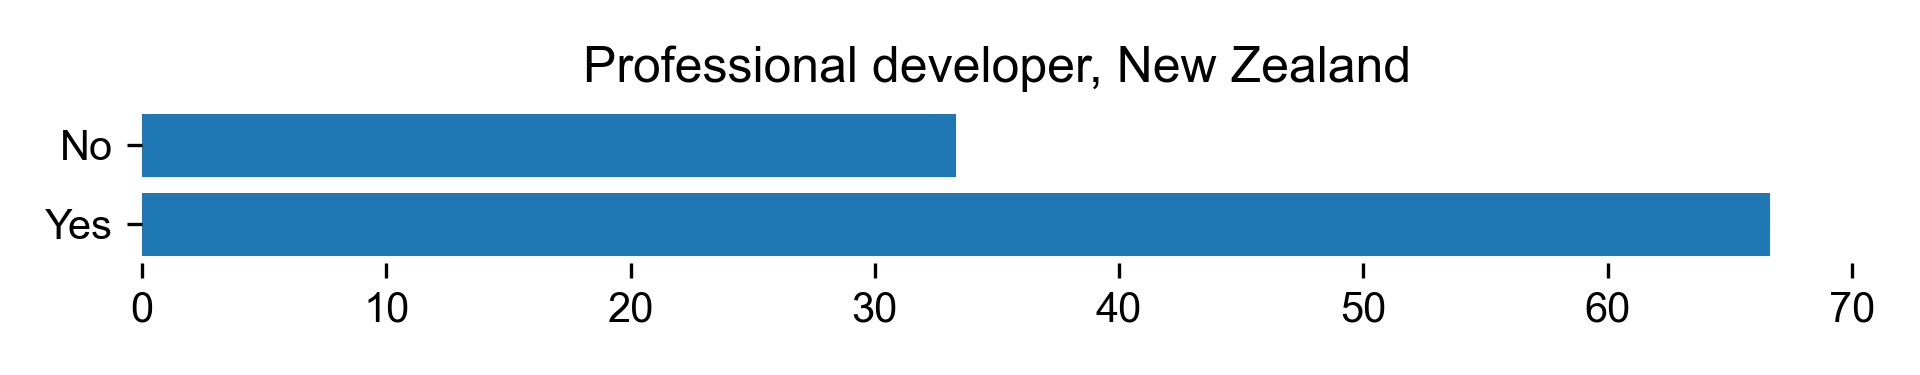
Professional developer for New Zealand
Count
Percentage
Yes
24
66.6667
No
12
33.3333
Download CSV
2021-08-04T21:05:07.773121
image/svg+xml
Matplotlib v3.4.2, https://matplotlib.org/
0
10
20
30
40
50
60
70
Yes
No
Professional developer, New Zealand
PNG SVG
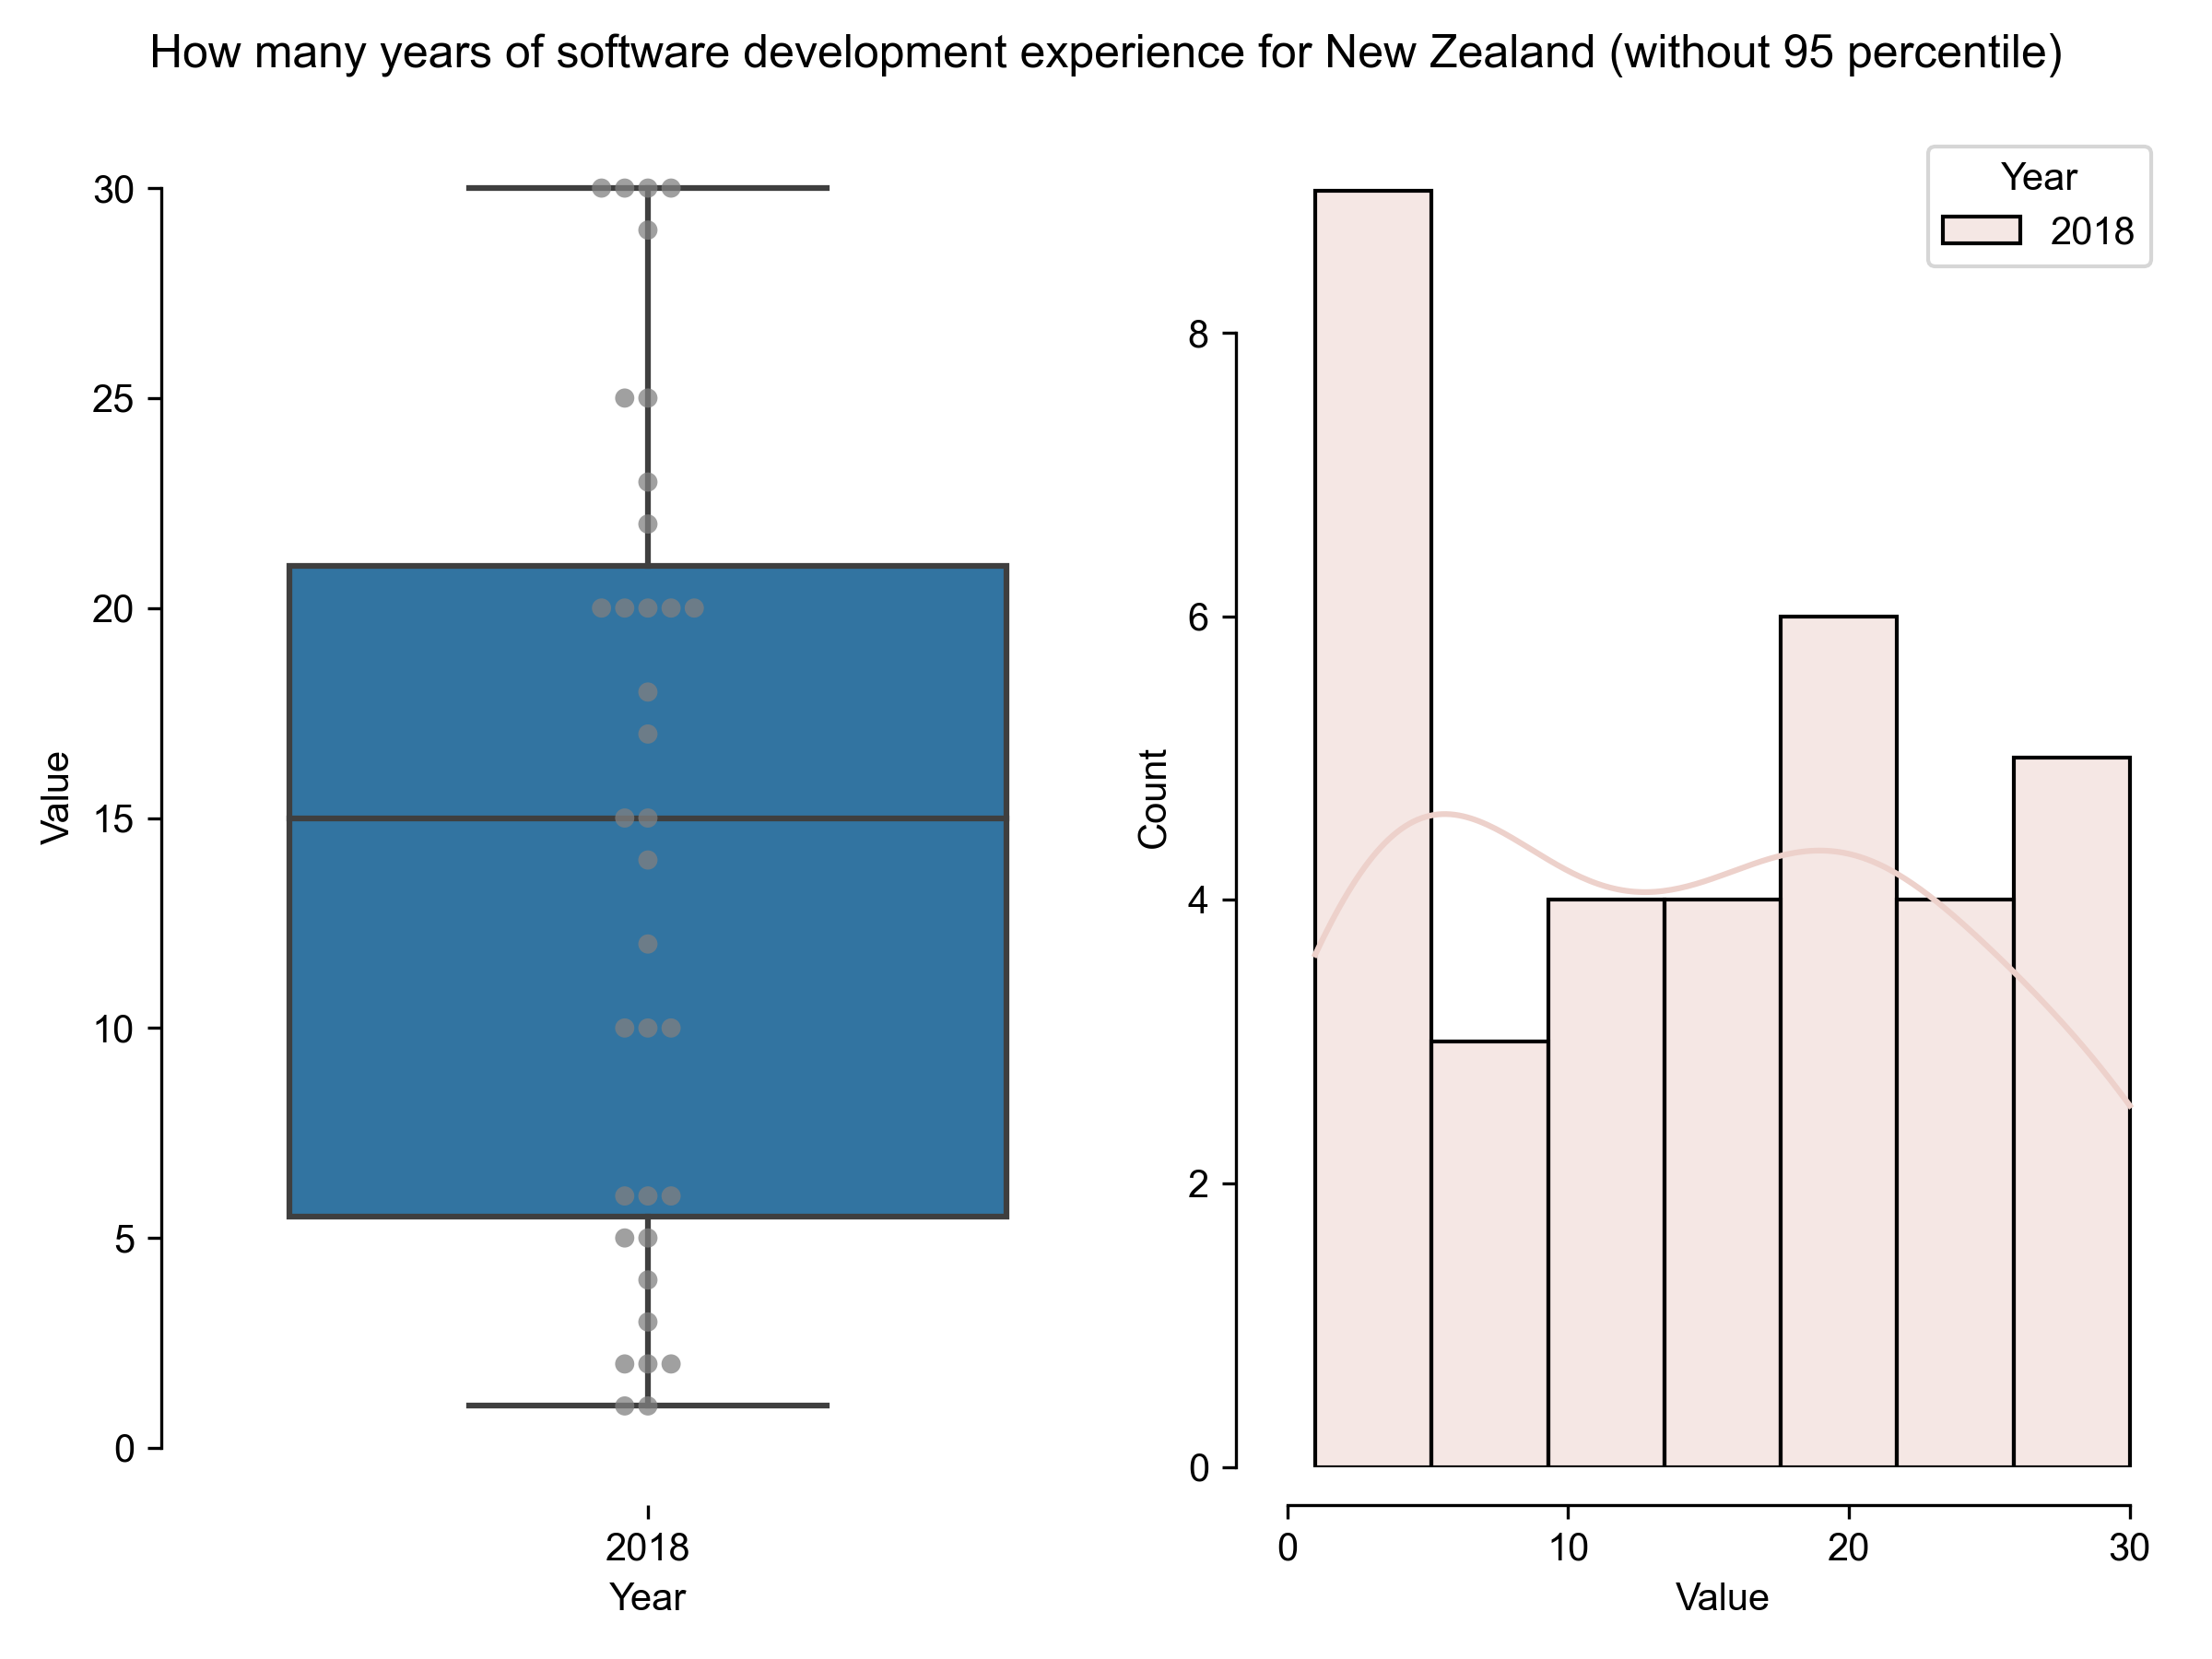
How many years of software development experience for New Zealand (without 95 percentile)
Results in 2018
count
35
mean
14.5143
std
9.74792
min
1
25%
5.5
50%
15
75%
21
max
30
Download CSV
2021-08-04T21:05:08.324160
image/svg+xml
Matplotlib v3.4.2, https://matplotlib.org/
2018
Year
0
5
10
15
20
25
30
Value
0
10
20
30
Value
0
2
4
6
8
Count
Year
2018
How many years of software development experience for New Zealand (without 95 percentile)
PNG SVG
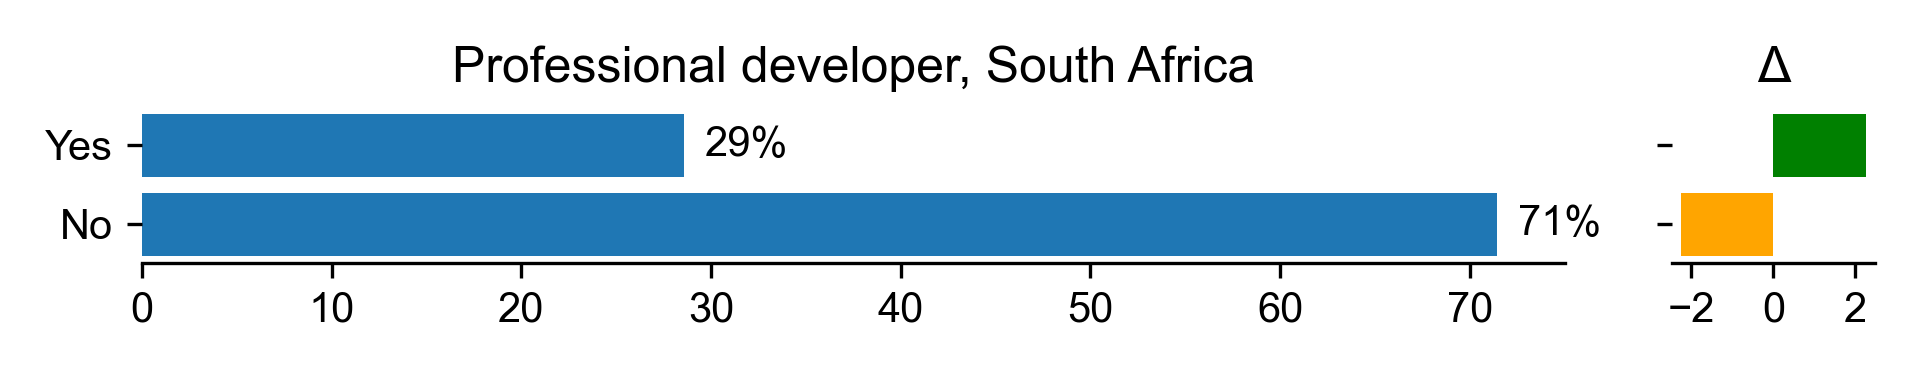
Professional developer for South Africa
Count
Percentage
Percentage in 2017
Difference with previous year
Yes
6
28.5714
26.3158
2.25564
No
15
71.4286
73.6842
-2.25564
Download CSV
2021-08-04T21:05:08.625779
image/svg+xml
Matplotlib v3.4.2, https://matplotlib.org/
0
10
20
30
40
50
60
70
No
Yes
71%
29%
Professional developer, South Africa
−2
0
2
Δ
PNG SVG
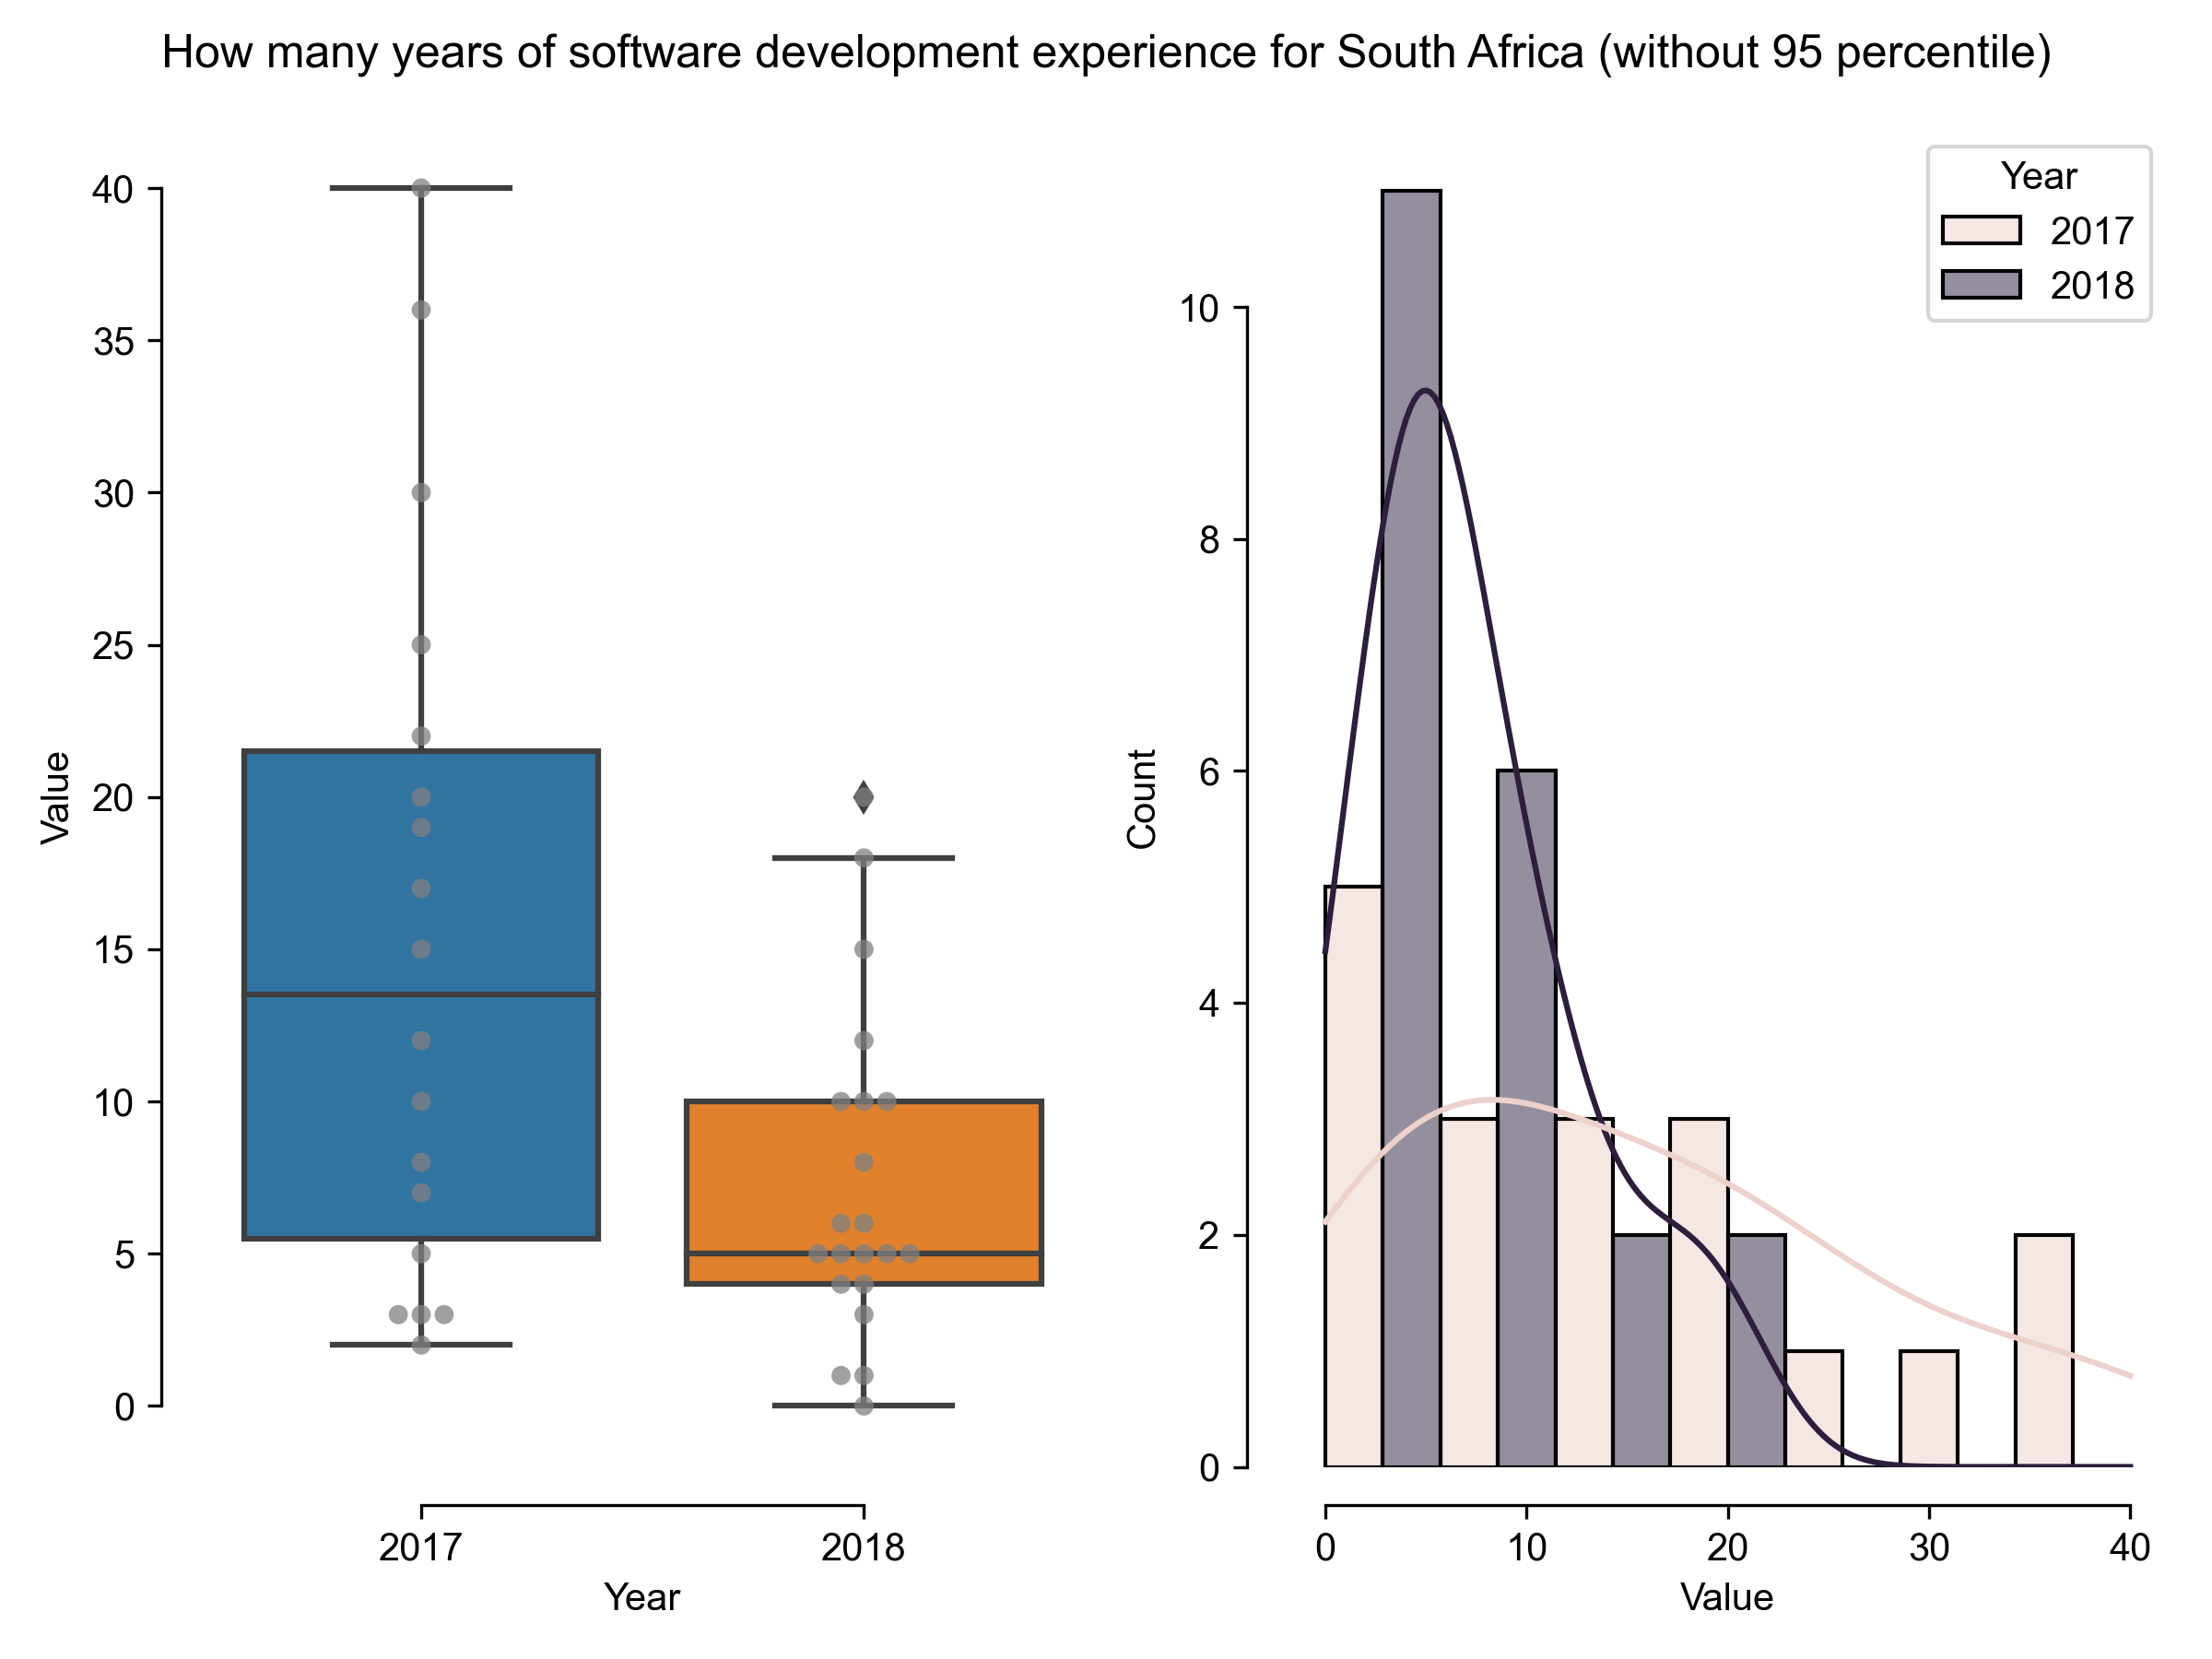
How many years of software development experience for South Africa (without 95 percentile)
Results in 2018
Results in 2017
count
21
18
mean
7.28571
15.3889
std
5.39577
11.7079
min
0
2
25%
4
5.5
50%
5
13.5
75%
10
21.5
max
20
40
Download CSV
2021-08-04T21:05:09.301285
image/svg+xml
Matplotlib v3.4.2, https://matplotlib.org/
2017
2018
Year
0
5
10
15
20
25
30
35
40
Value
0
10
20
30
40
Value
0
2
4
6
8
10
Count
Year
2017
2018
How many years of software development experience for South Africa (without 95 percentile)
PNG SVG
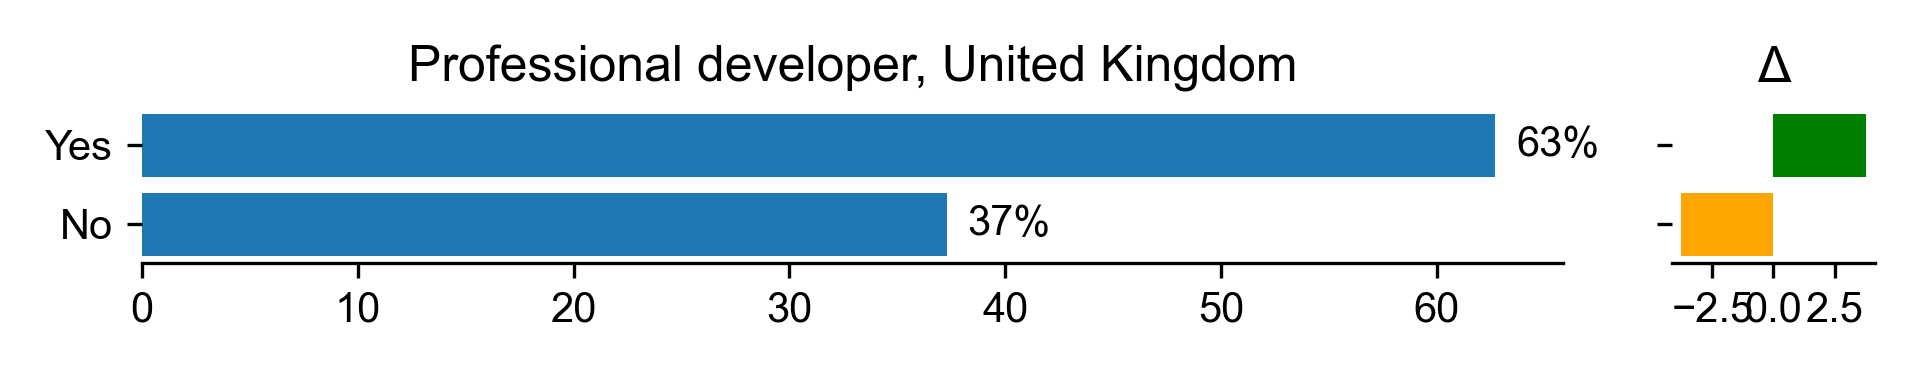
Professional developer for United Kingdom
Count
Percentage
Percentage in 2017
Difference with previous year
Yes
143
62.7193
58.9431
3.77621
No
85
37.2807
41.0569
-3.77621
Download CSV
2021-08-04T21:05:09.701655
image/svg+xml
Matplotlib v3.4.2, https://matplotlib.org/
0
10
20
30
40
50
60
No
Yes
37%
63%
Professional developer, United Kingdom
−2.5
0.0
2.5
Δ
PNG SVG
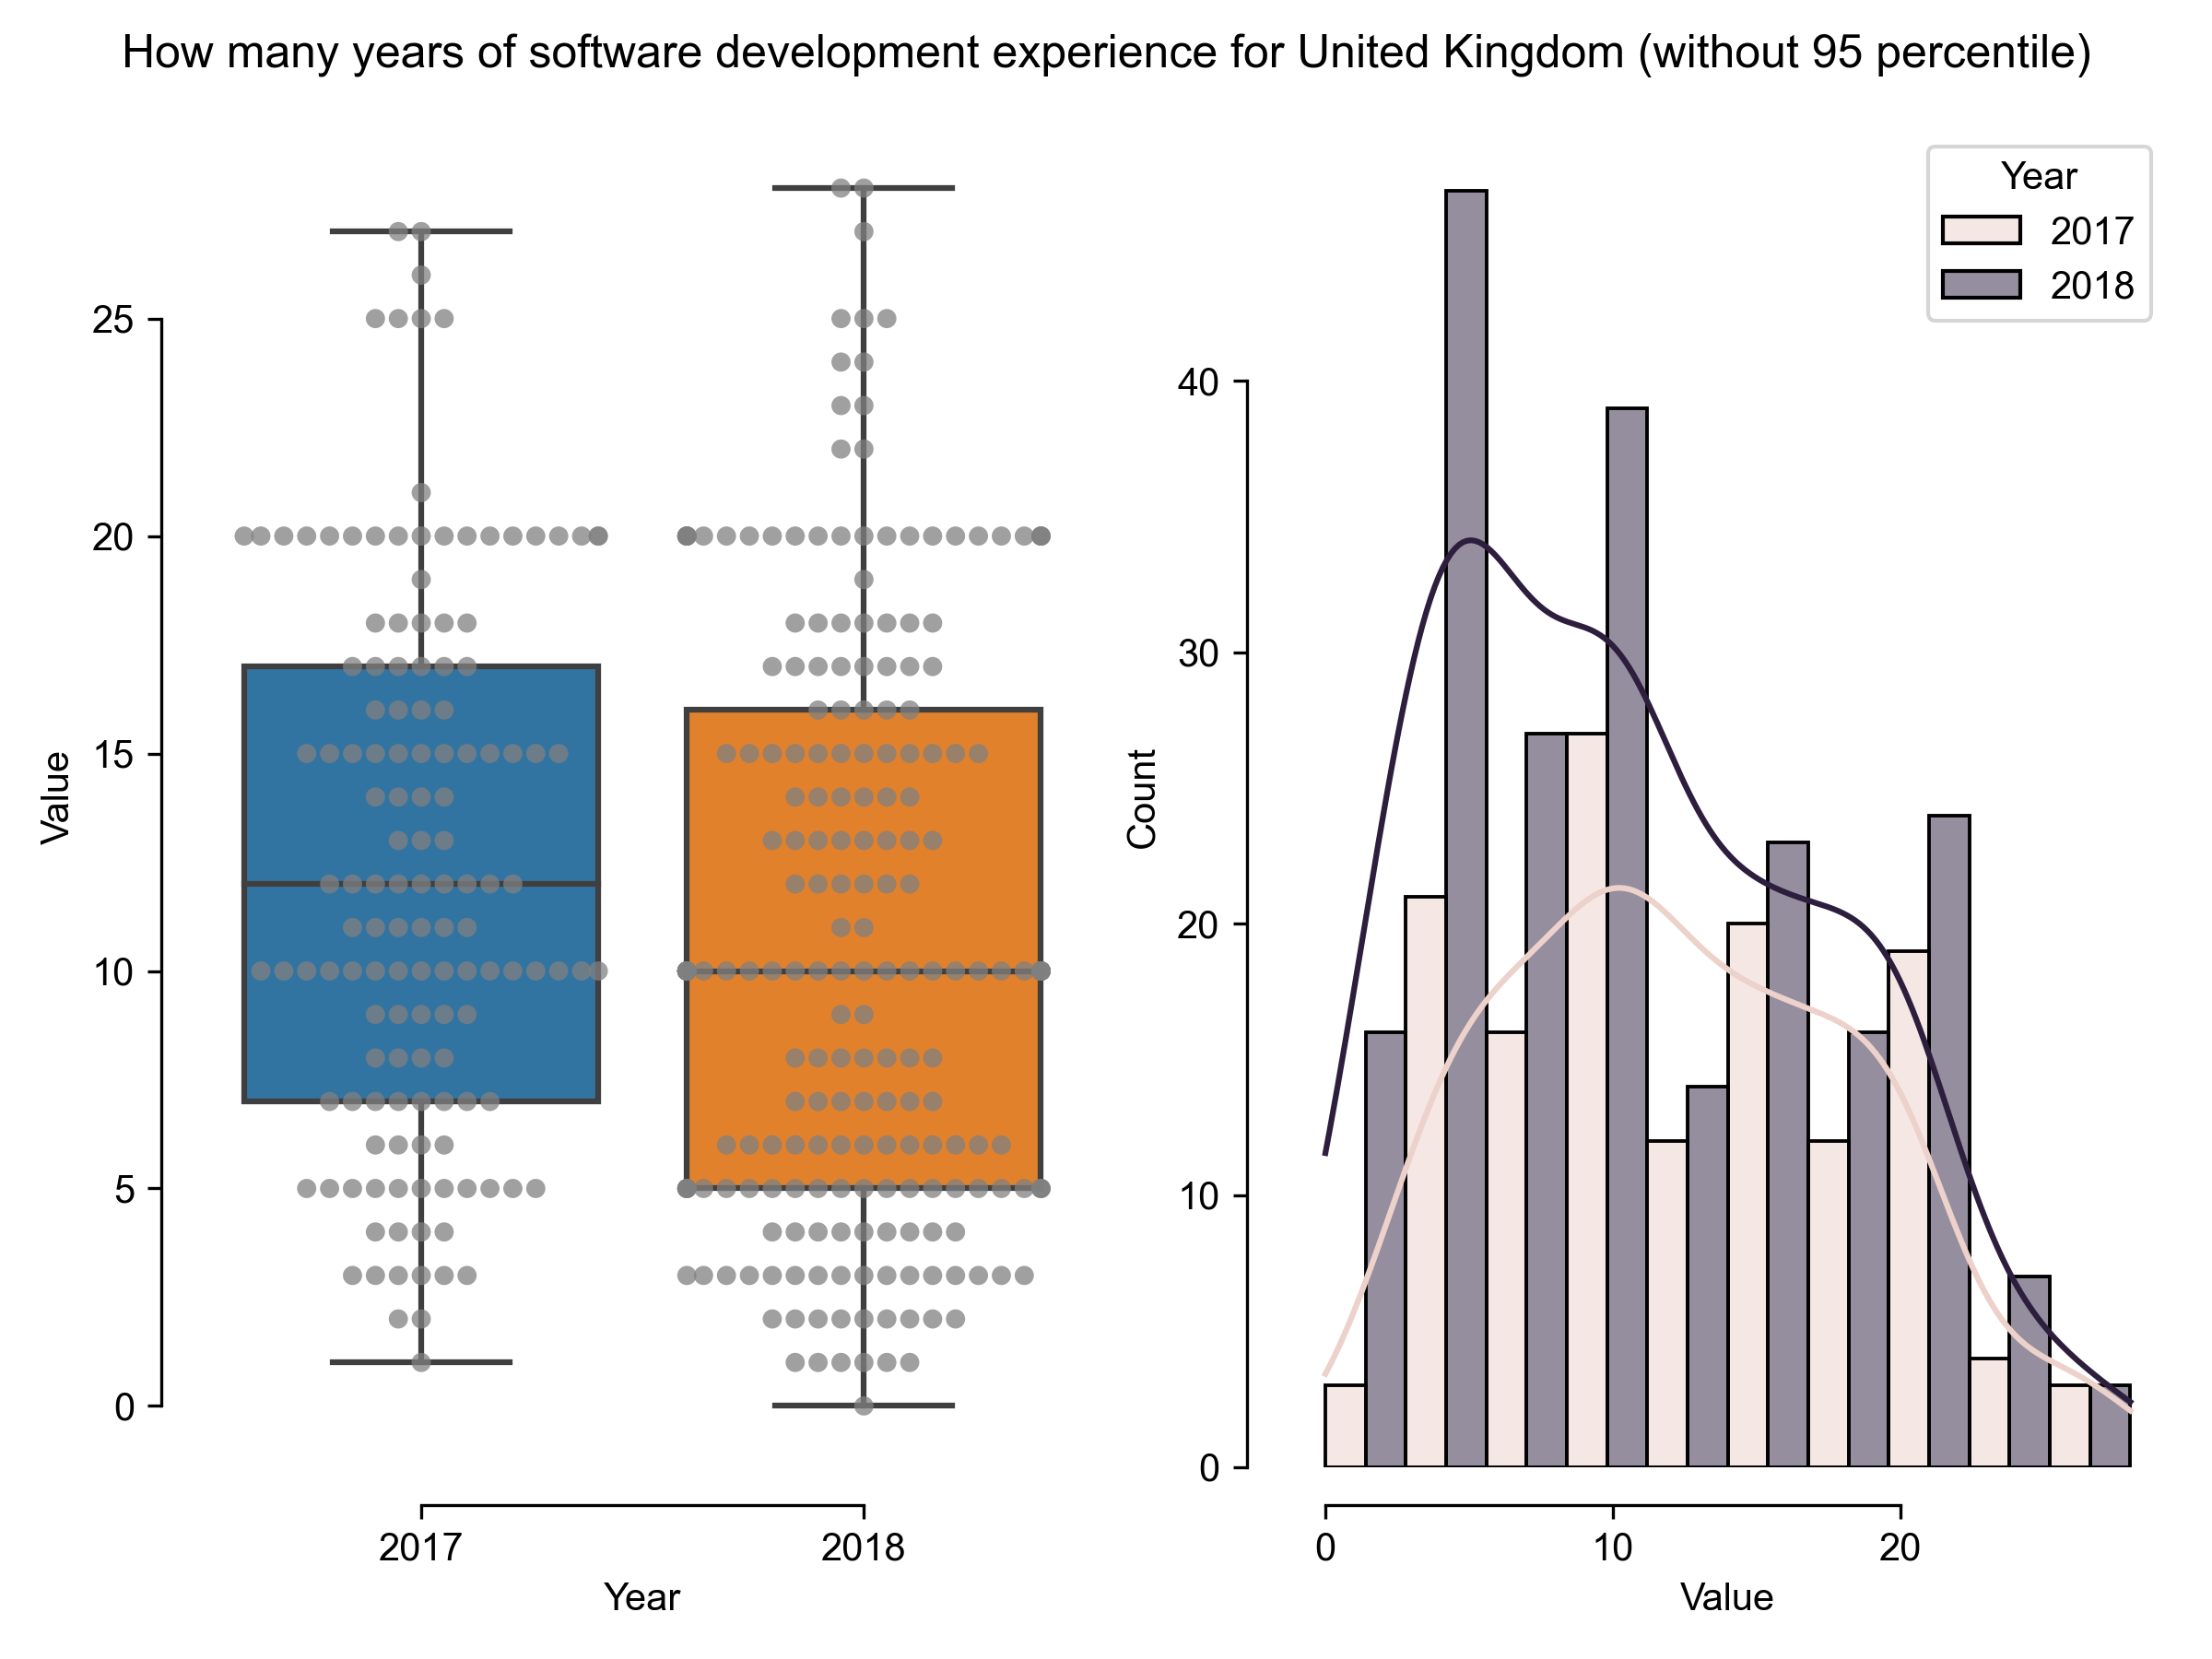
How many years of software development experience for United Kingdom (without 95 percentile)
Results in 2018
Results in 2017
count
216
137
mean
10.7778
12.3796
std
6.61757
6.20144
min
0
1
25%
5
7
50%
10
12
75%
16
17
max
28
27
Download CSV
2021-08-04T21:05:10.474374
image/svg+xml
Matplotlib v3.4.2, https://matplotlib.org/
2017
2018
Year
0
5
10
15
20
25
Value
0
10
20
Value
0
10
20
30
40
Count
Year
2017
2018
How many years of software development experience for United Kingdom (without 95 percentile)
PNG SVG
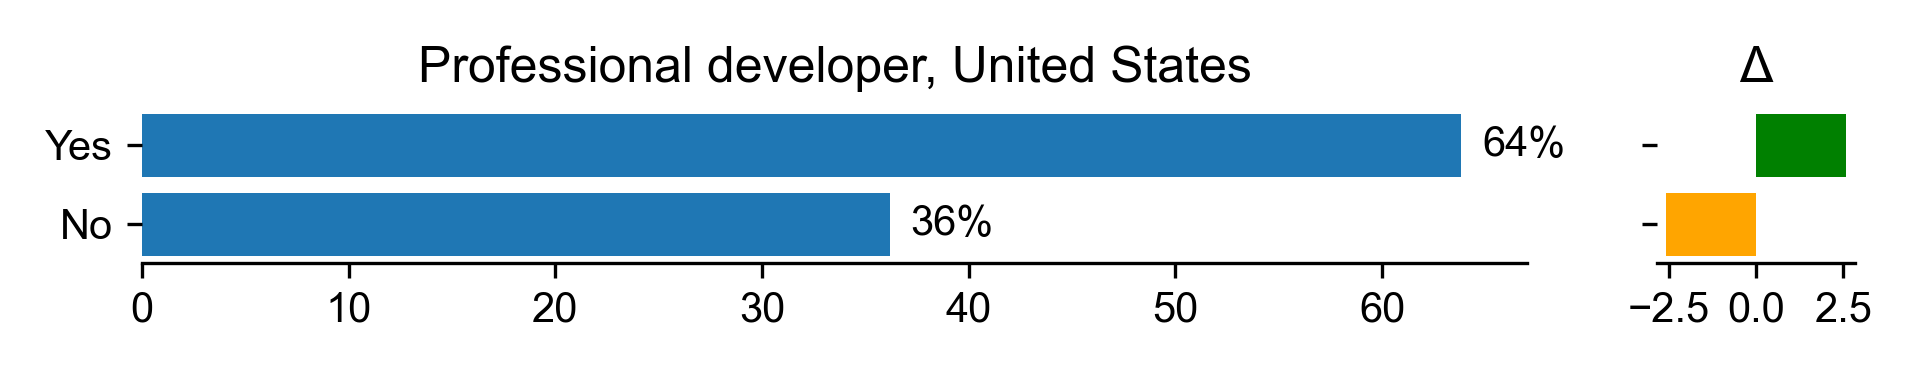
Professional developer for United States
Count
Percentage
Percentage in 2017
Difference with previous year
Yes
90
63.8298
61.25
2.57979
No
51
36.1702
38.75
-2.57979
Download CSV
2021-08-04T21:05:10.821393
image/svg+xml
Matplotlib v3.4.2, https://matplotlib.org/
0
10
20
30
40
50
60
No
Yes
36%
64%
Professional developer, United States
−2.5
0.0
2.5
Δ
PNG SVG
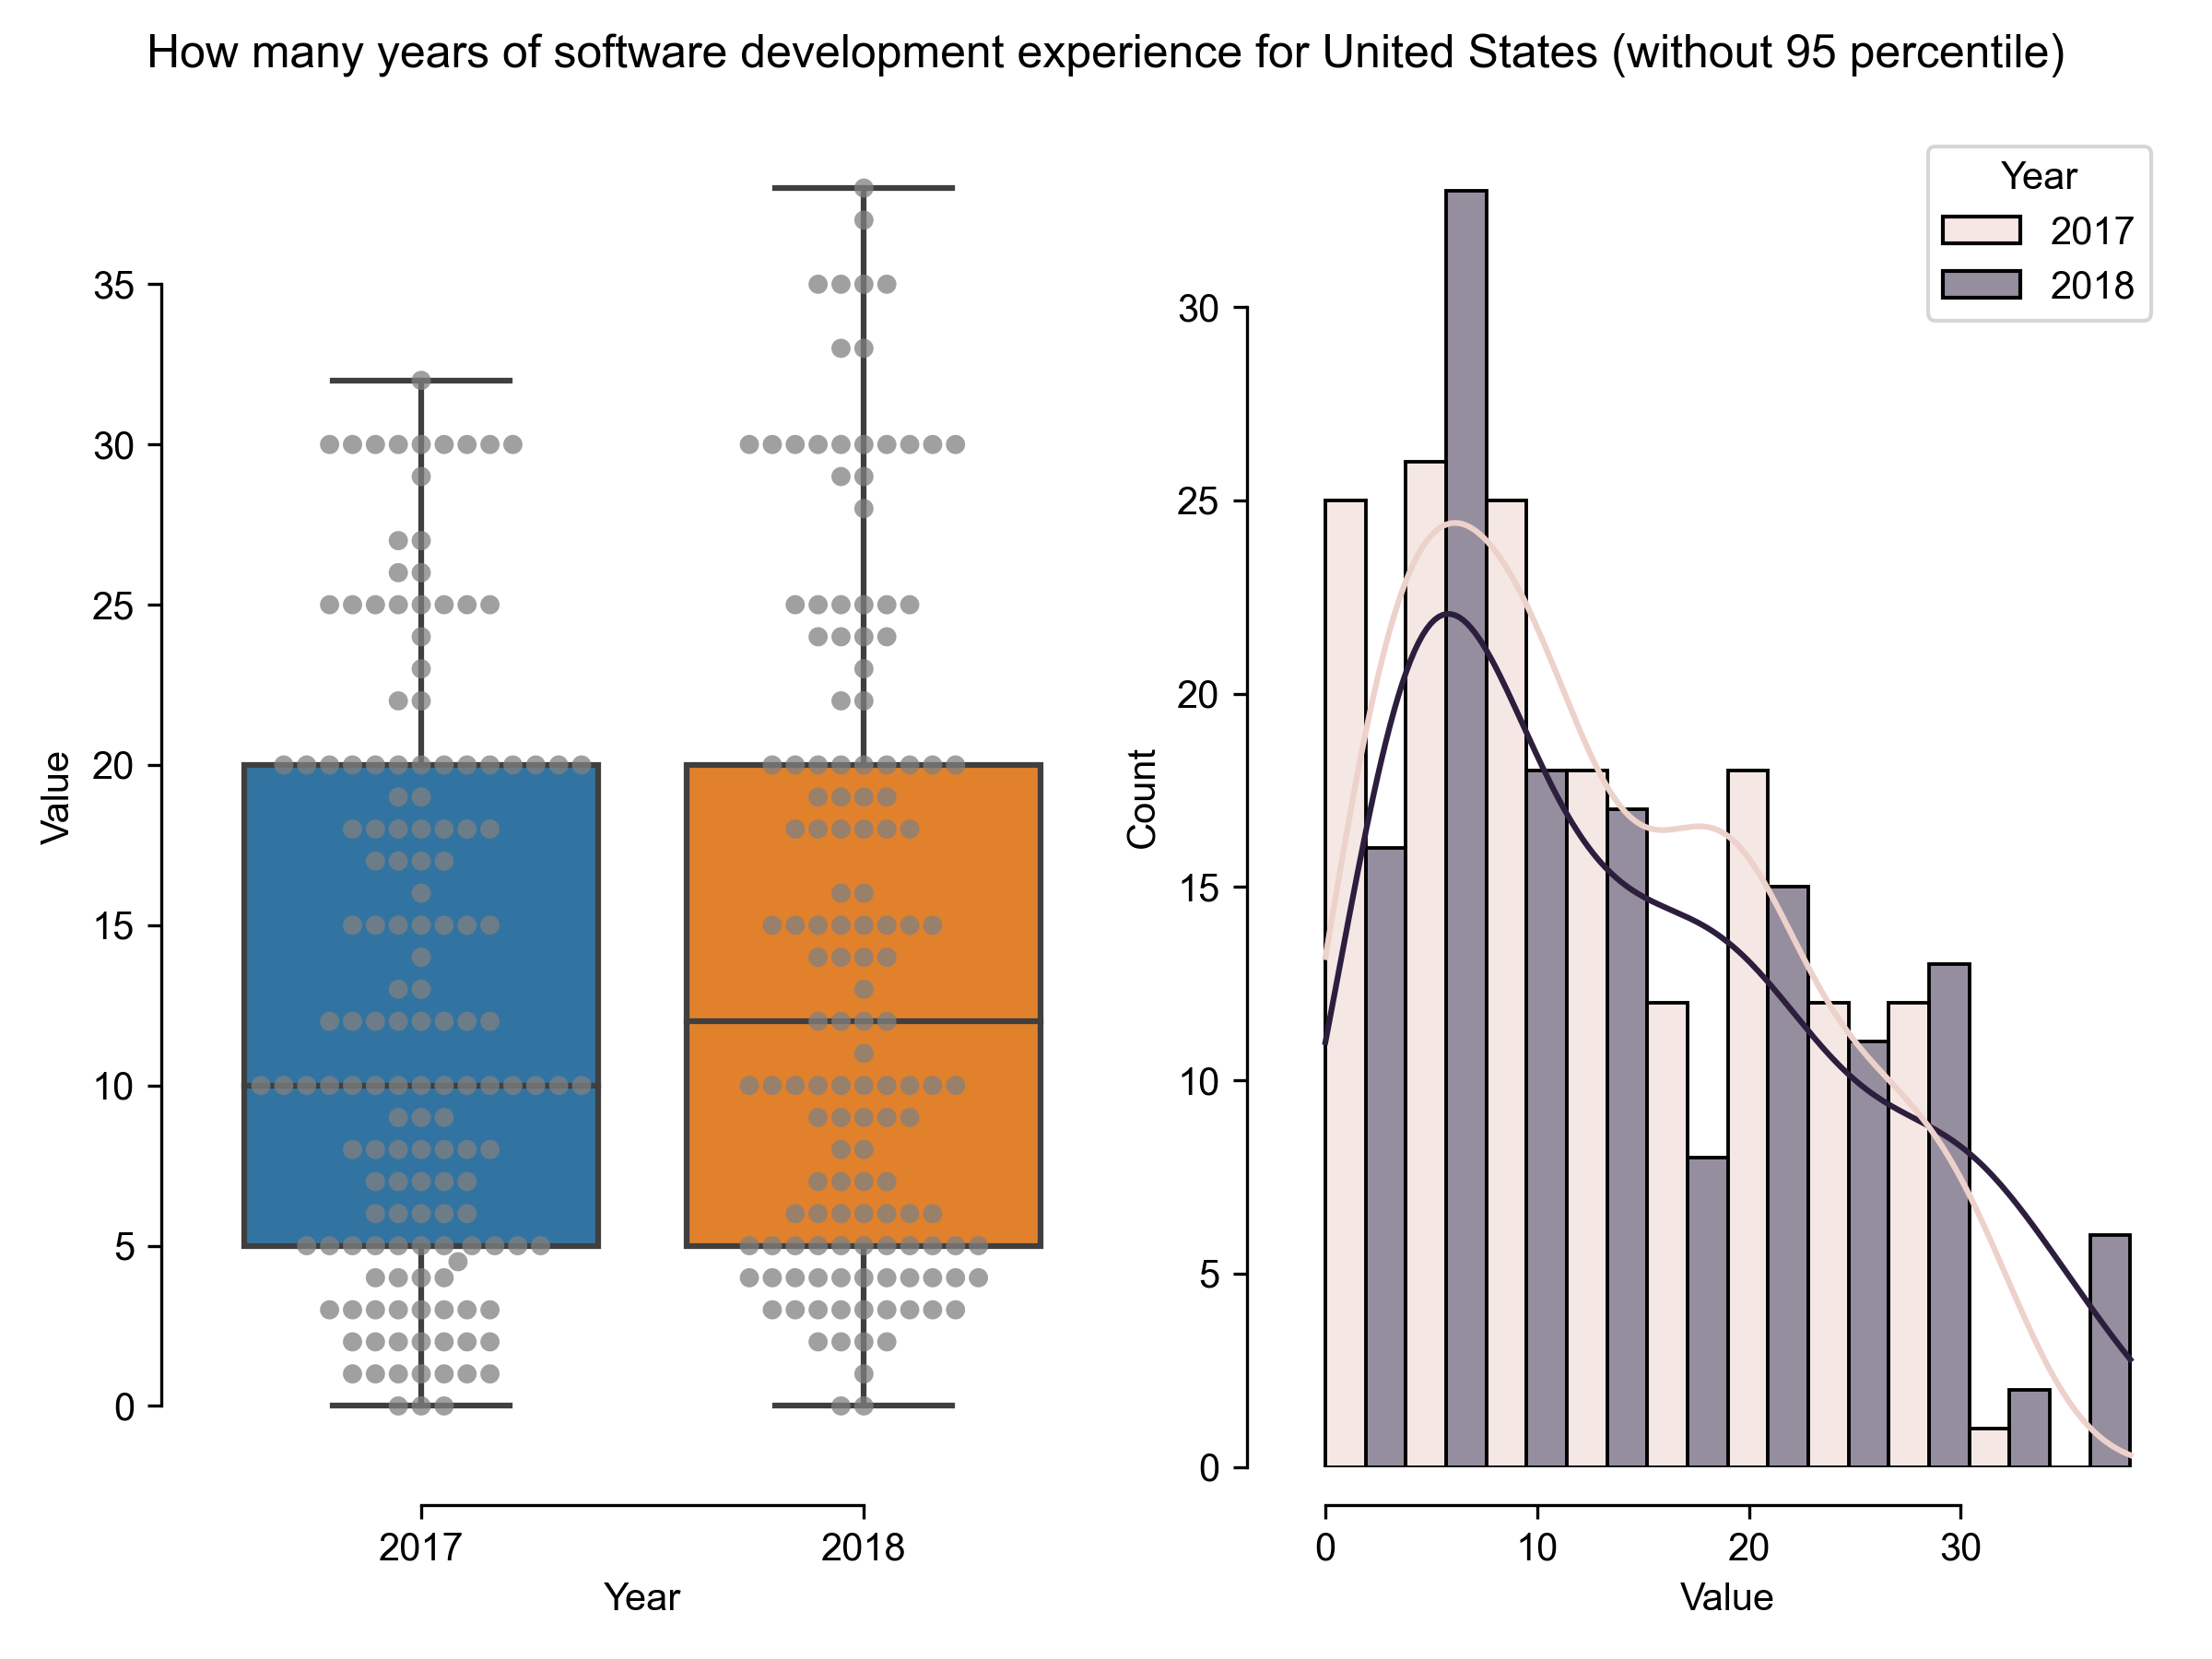
How many years of software development experience for United States (without 95 percentile)
Results in 2018
Results in 2017
count
139
149
mean
14.3165
12.8557
std
10.0355
8.84099
min
0
0
25%
5
5
50%
12
10
75%
20
20
max
38
32
Download CSV
2021-08-04T21:05:11.568263
image/svg+xml
Matplotlib v3.4.2, https://matplotlib.org/
2017
2018
Year
0
5
10
15
20
25
30
35
Value
0
10
20
30
Value
0
5
10
15
20
25
30
Count
Year
2017
2018
How many years of software development experience for United States (without 95 percentile)
PNG SVG
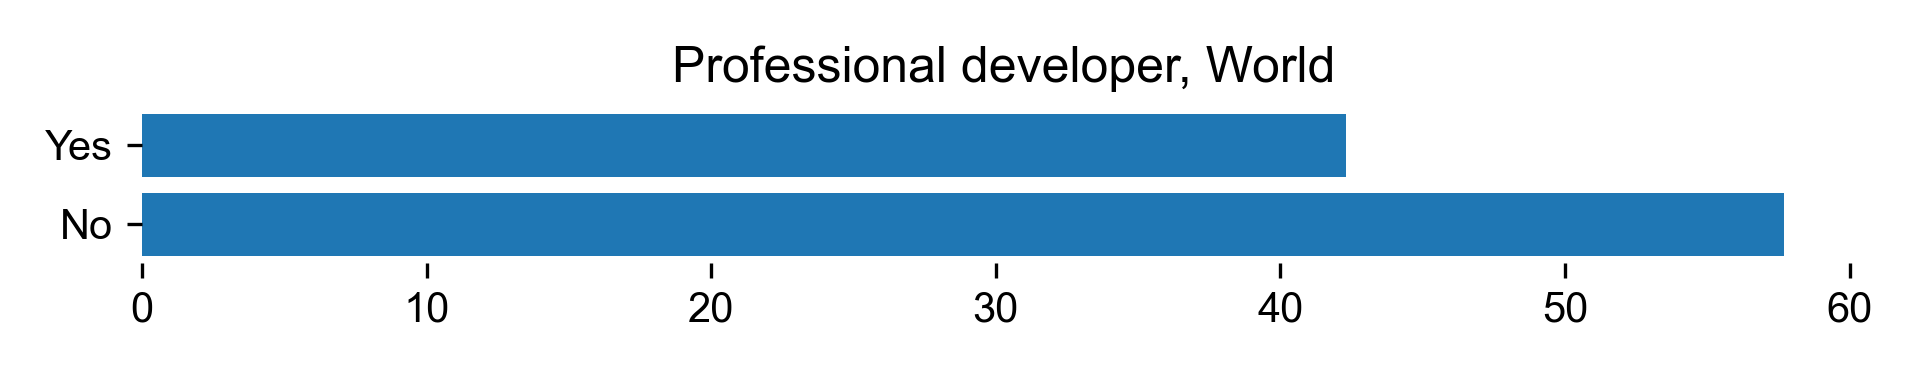
Professional developer for World
Count
Percentage
Yes
22
42.3077
No
30
57.6923
Download CSV
2021-08-04T21:05:11.900779
image/svg+xml
Matplotlib v3.4.2, https://matplotlib.org/
0
10
20
30
40
50
60
No
Yes
Professional developer, World
PNG SVG
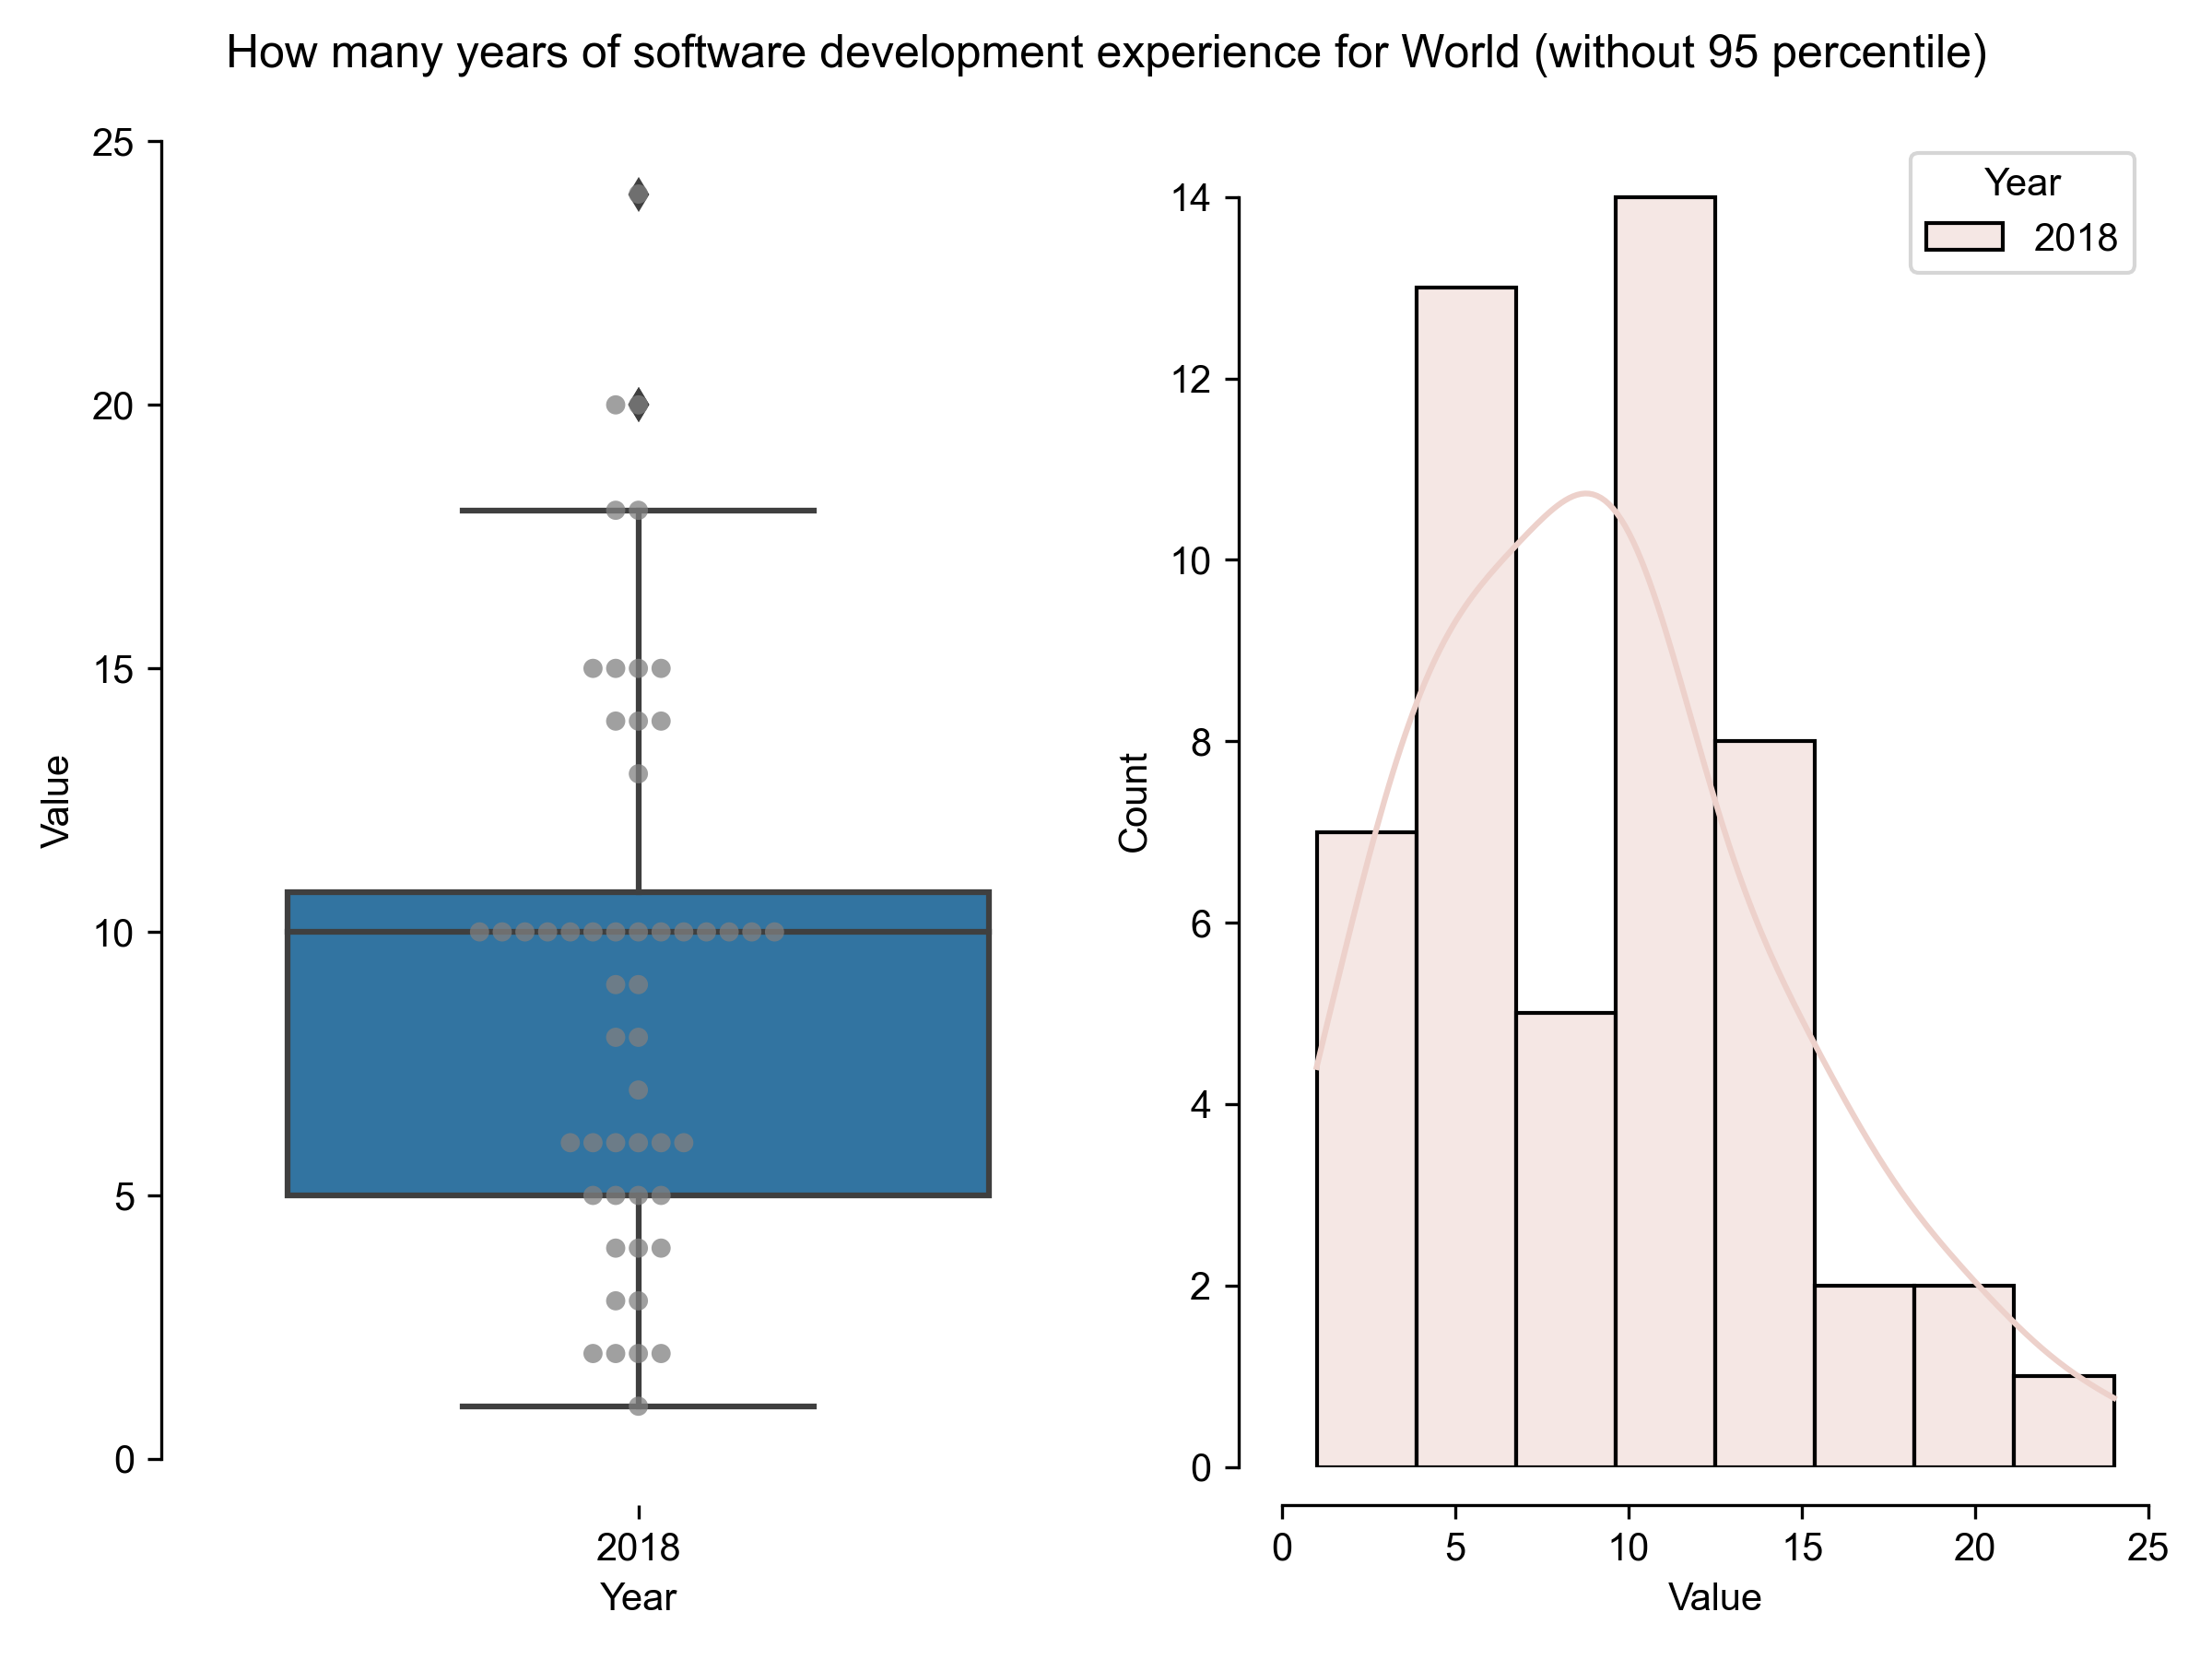
How many years of software development experience for World (without 95 percentile)
Results in 2018
count
52
mean
9.21154
std
5.25184
min
1
25%
5
50%
10
75%
10.75
max
24
Download CSV
2021-08-04T21:05:12.495639
image/svg+xml
Matplotlib v3.4.2, https://matplotlib.org/
2018
Year
0
5
10
15
20
25
Value
0
5
10
15
20
25
Value
0
2
4
6
8
10
12
14
Count
Year
2018
How many years of software development experience for World (without 95 percentile)
PNG SVG