Australia Germany Netherlands New Zealand South Africa United Kingdom United States World
This section comprises sections that focus on the technical and development
aspects of the RSEs’ work. They aim to understand good practices in developing
software.
We chose two broad measures to provide an insight into sustainability: the
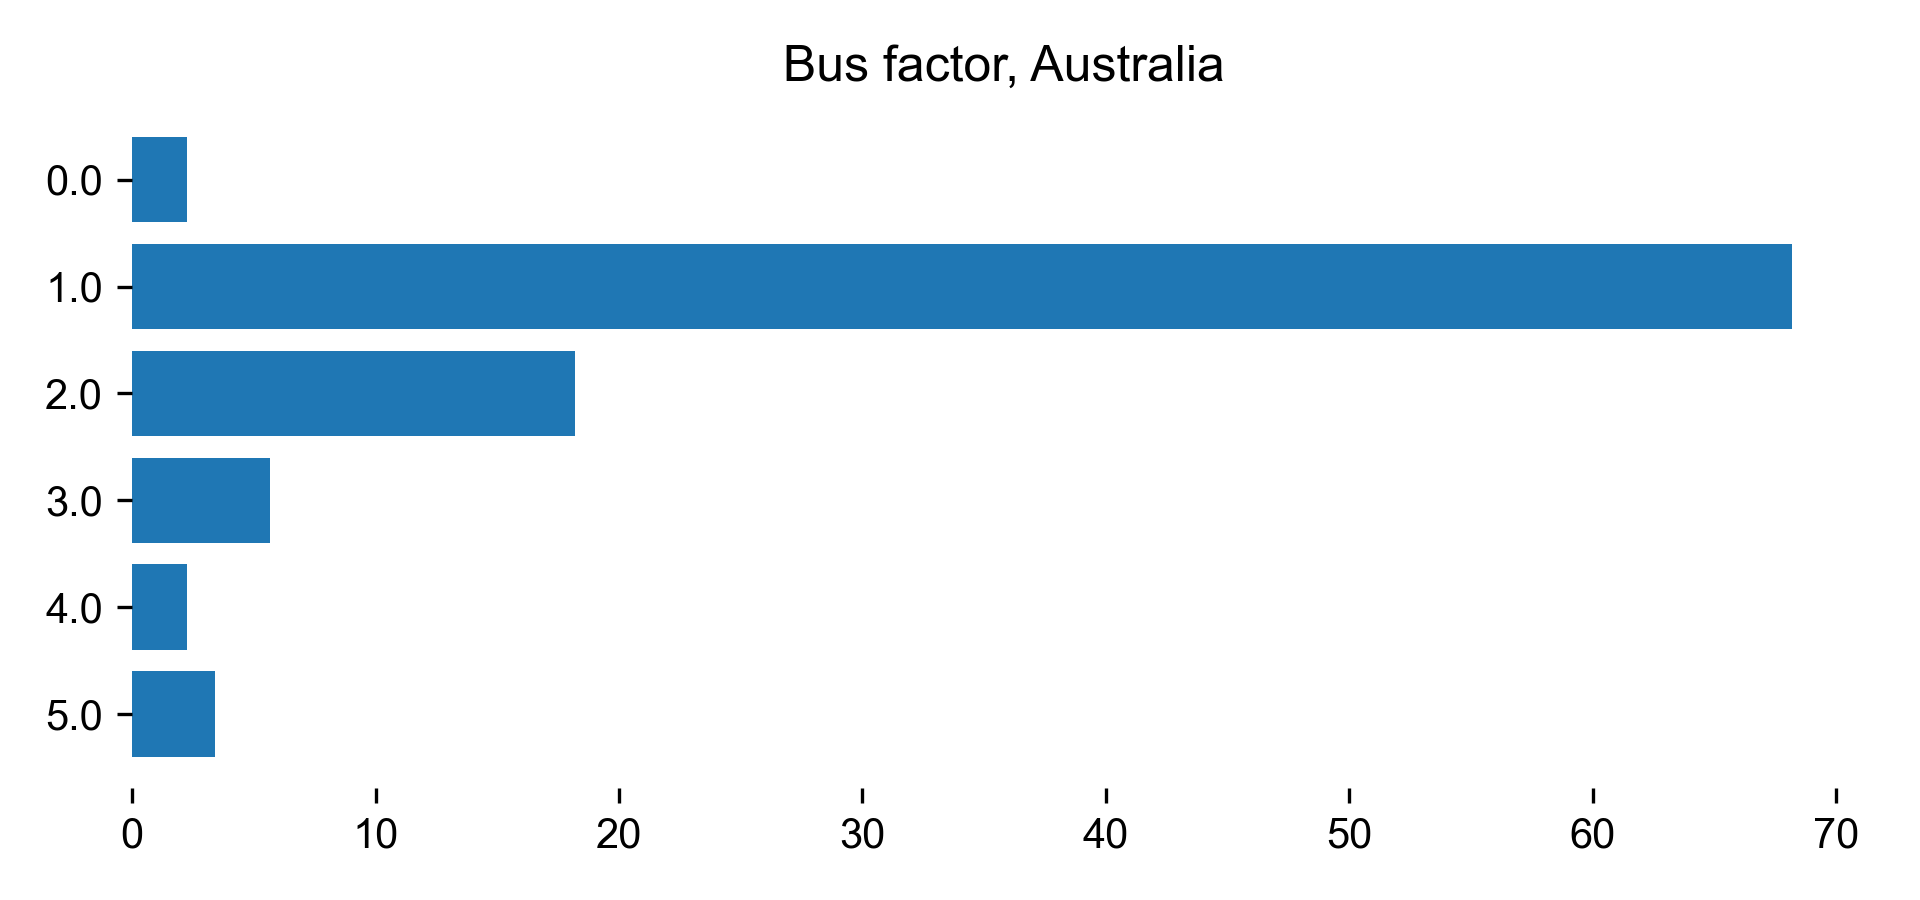
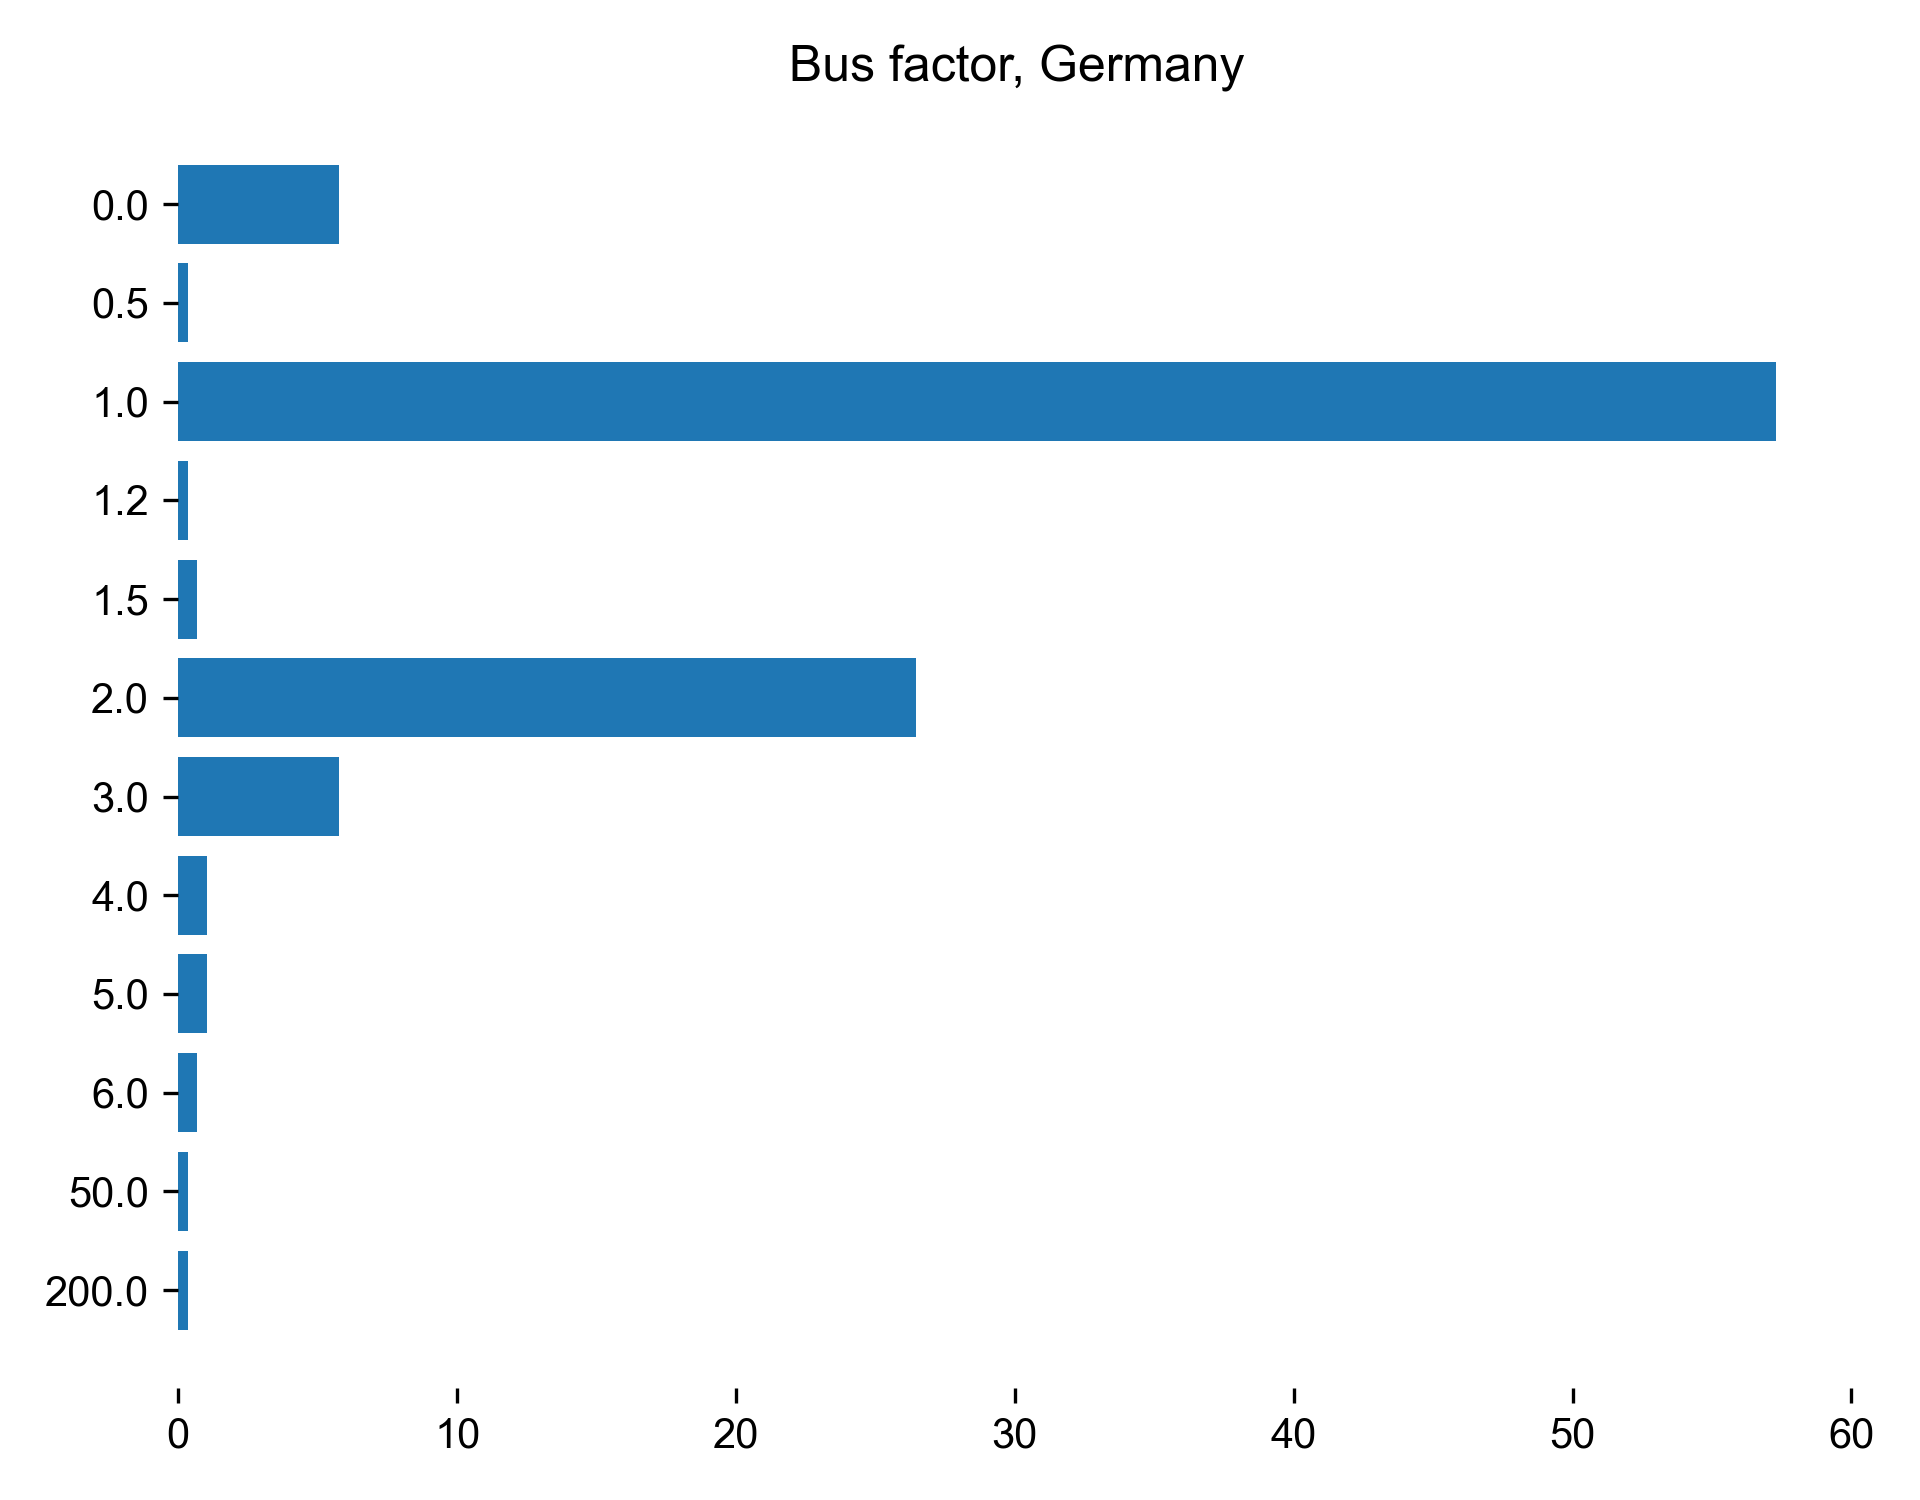
bus factor and technical hand over planning .
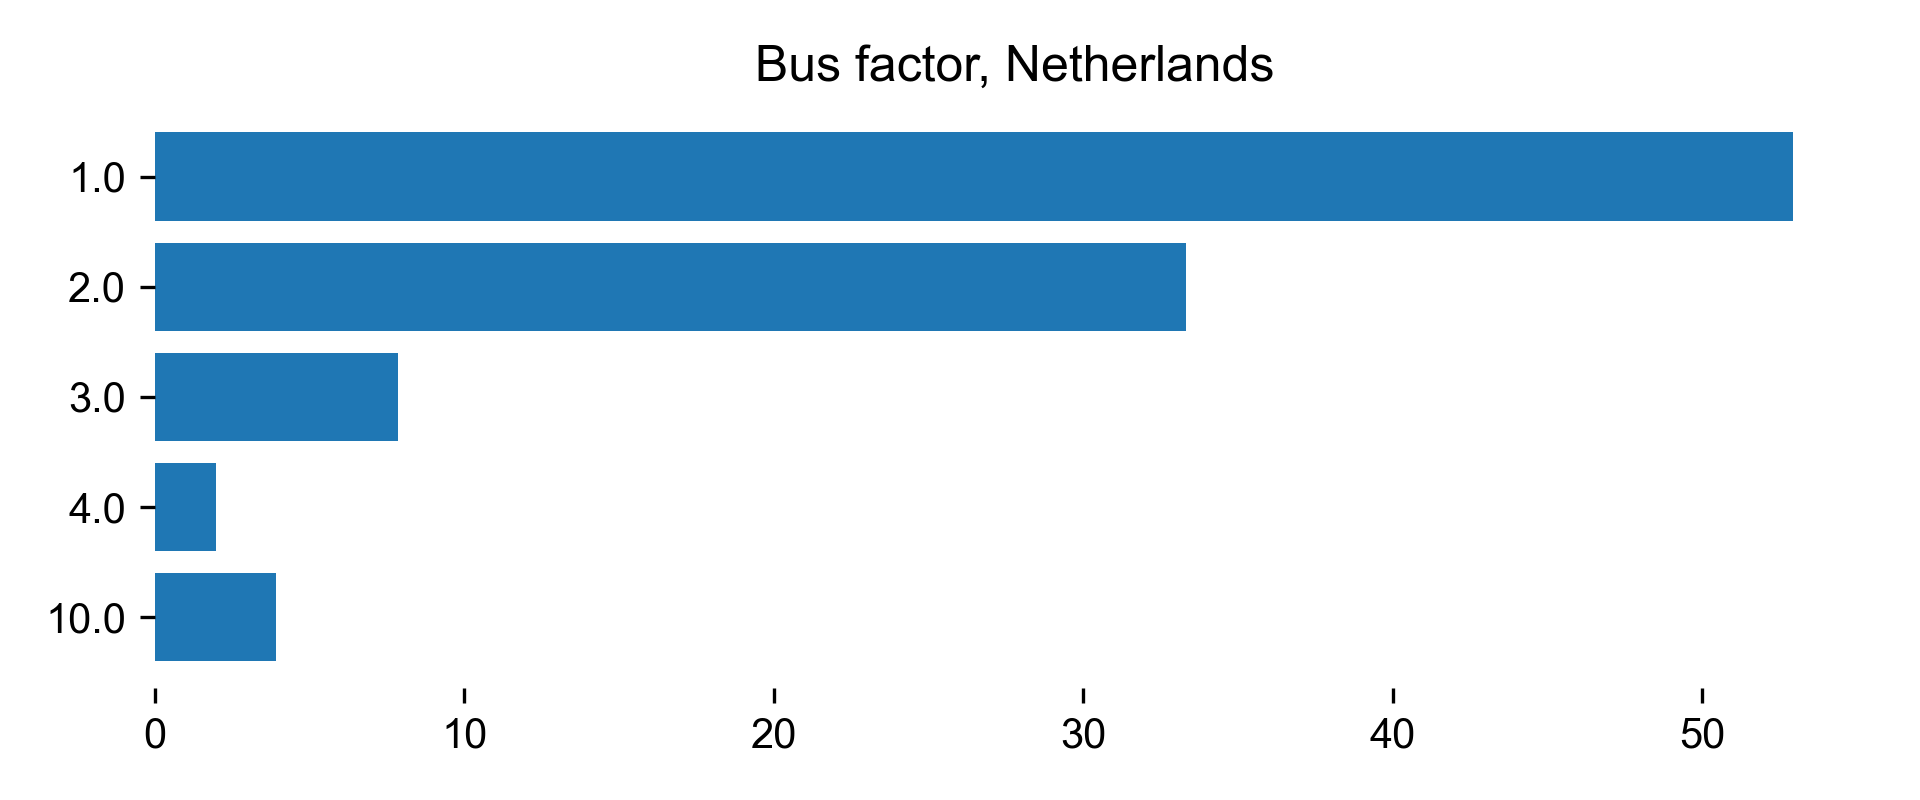
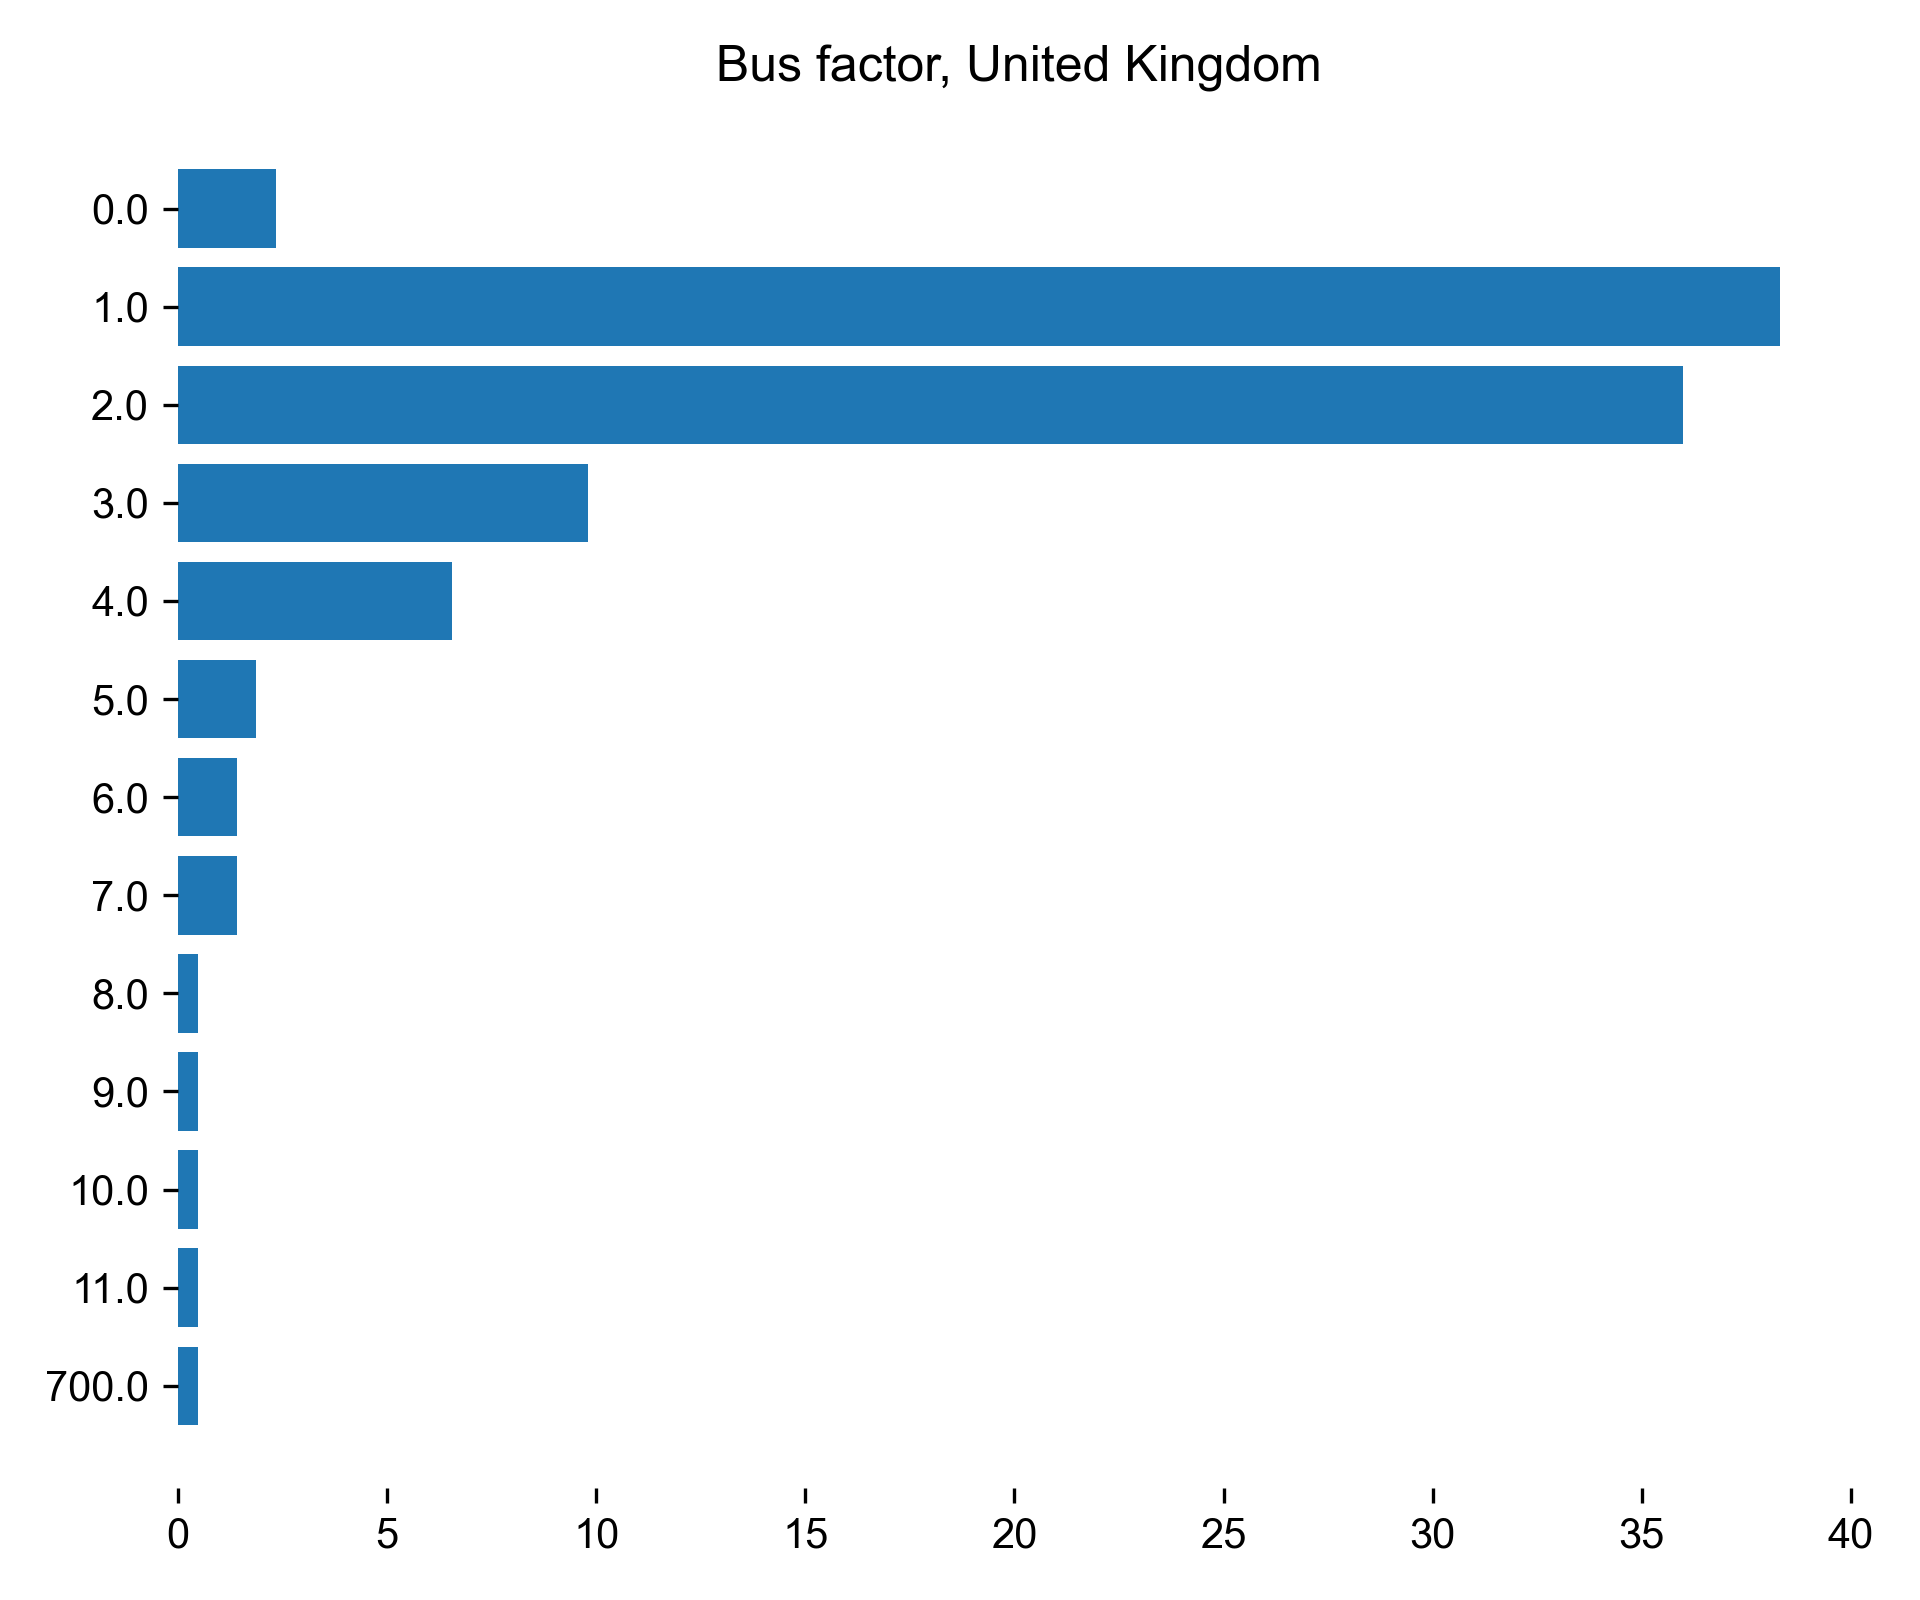
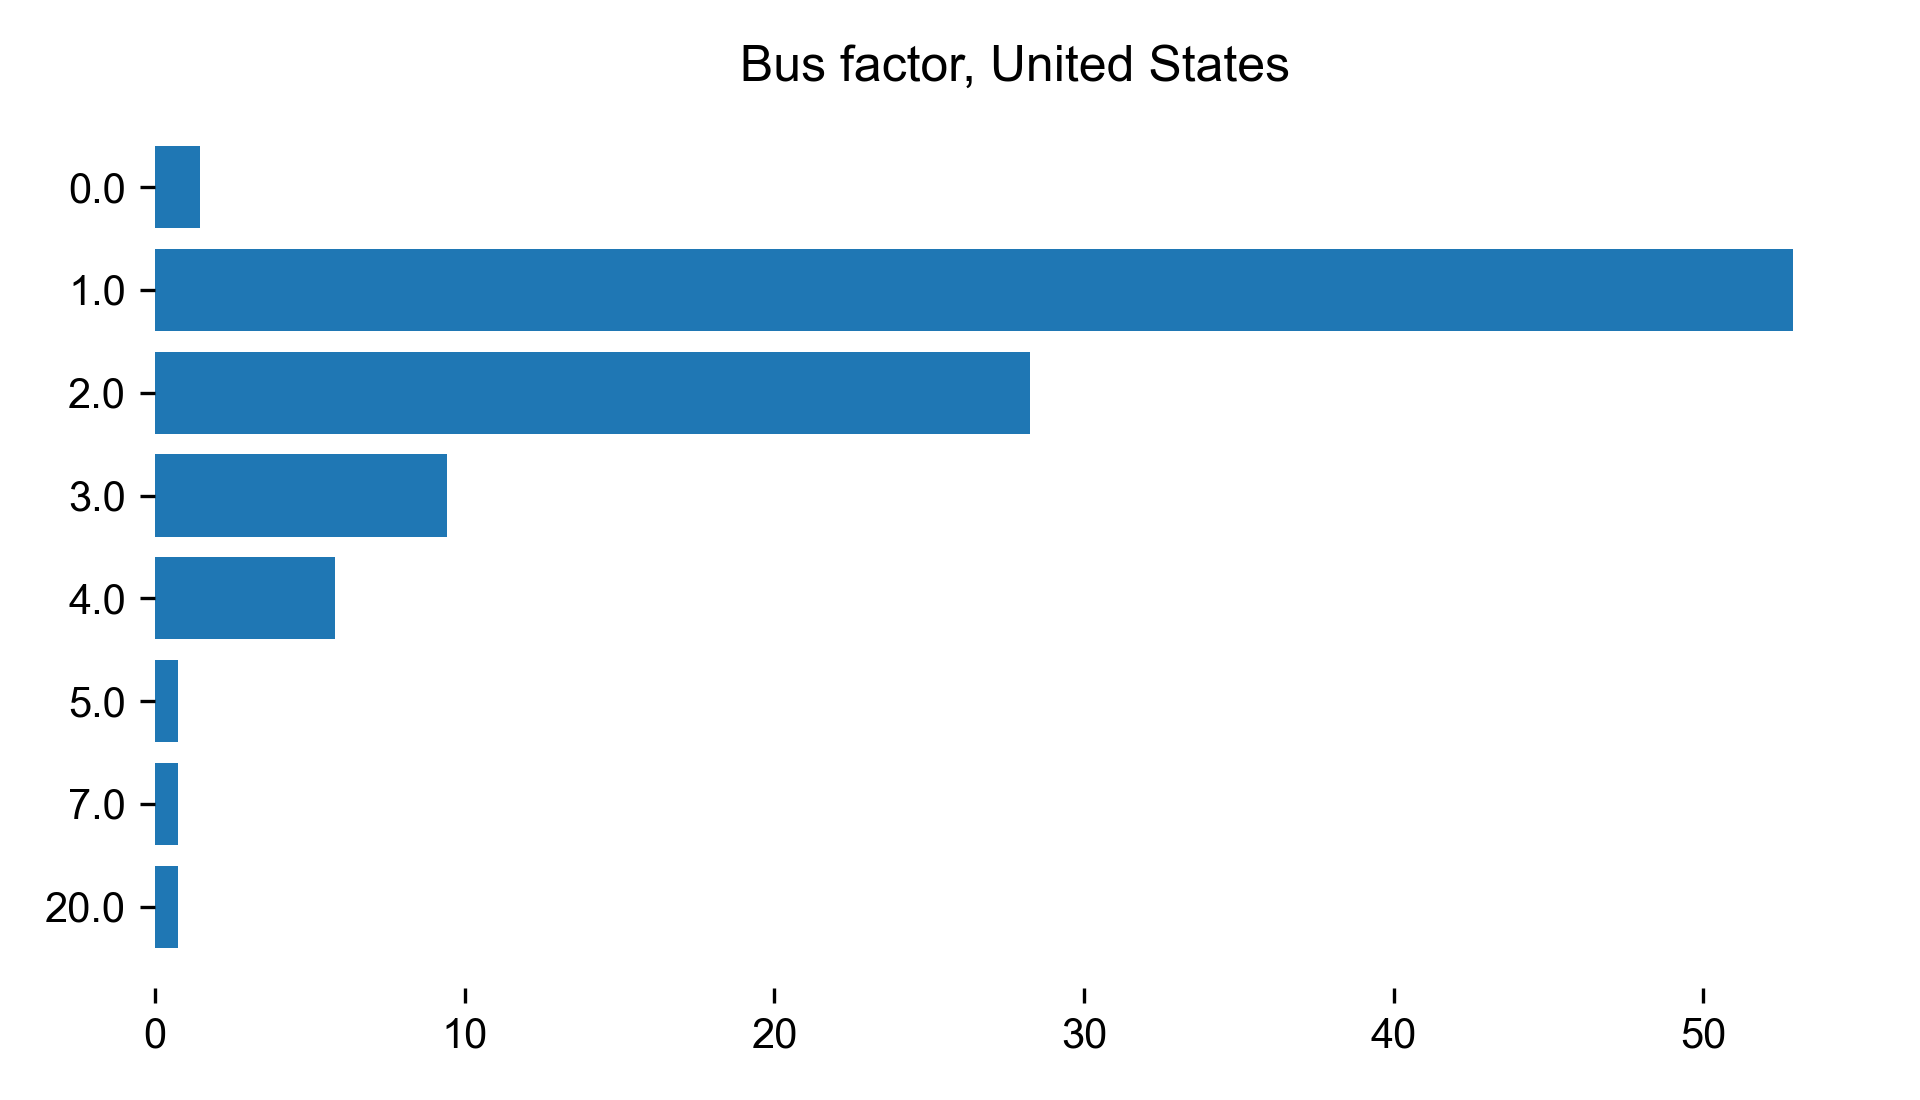
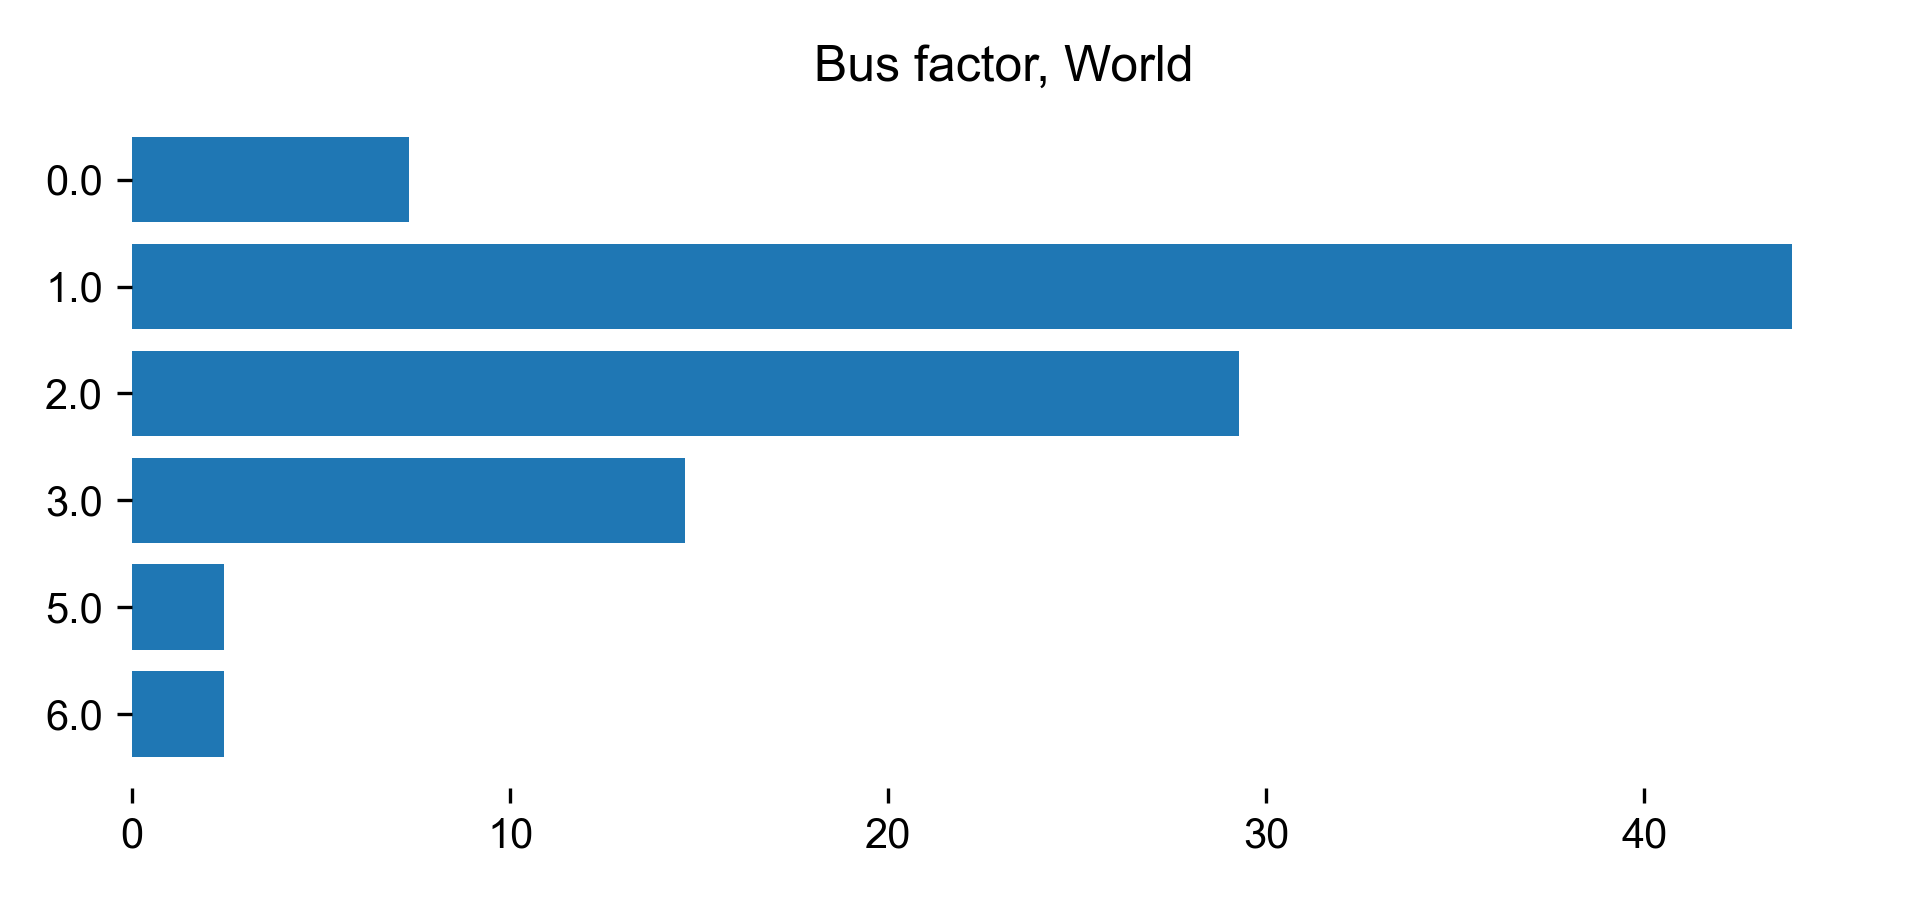
The bus factor is a measure of the number of developers who understand
a specific software project and could, with only a cursory review of the
project, maintain or extend the code. A project with a bus factor of 1 is
completely reliant on only one developer. If this developer finds new
employment, becomes ill or is hit by the titular bus, then the project will
fail. A high bus factor provides some confidence that the project can be
sustained even if a developer leaves.
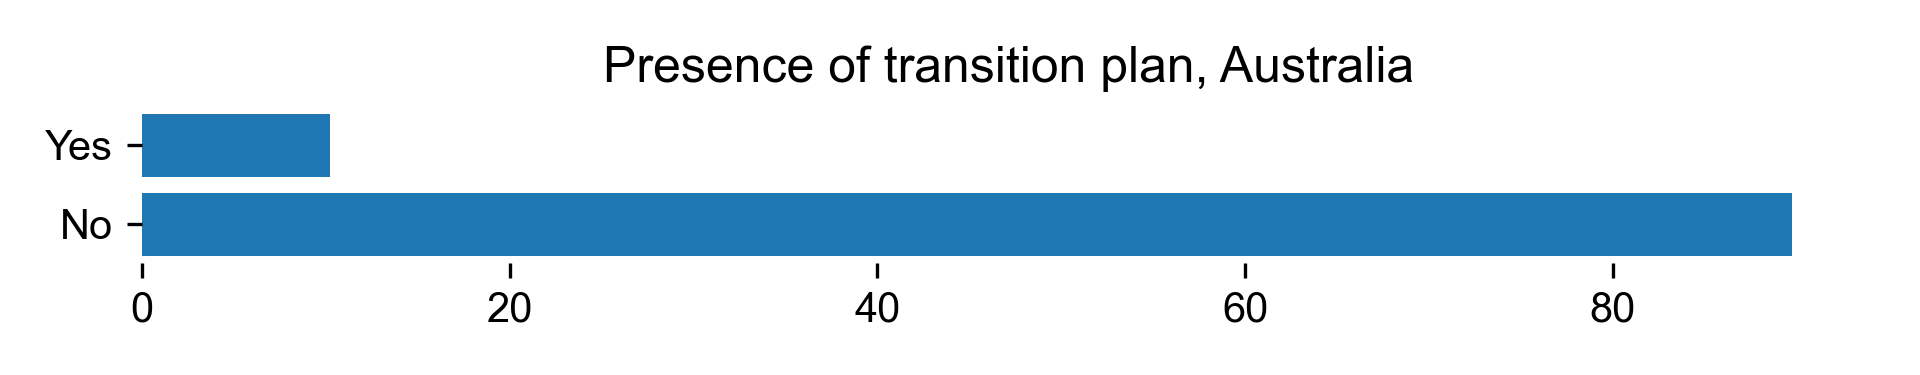
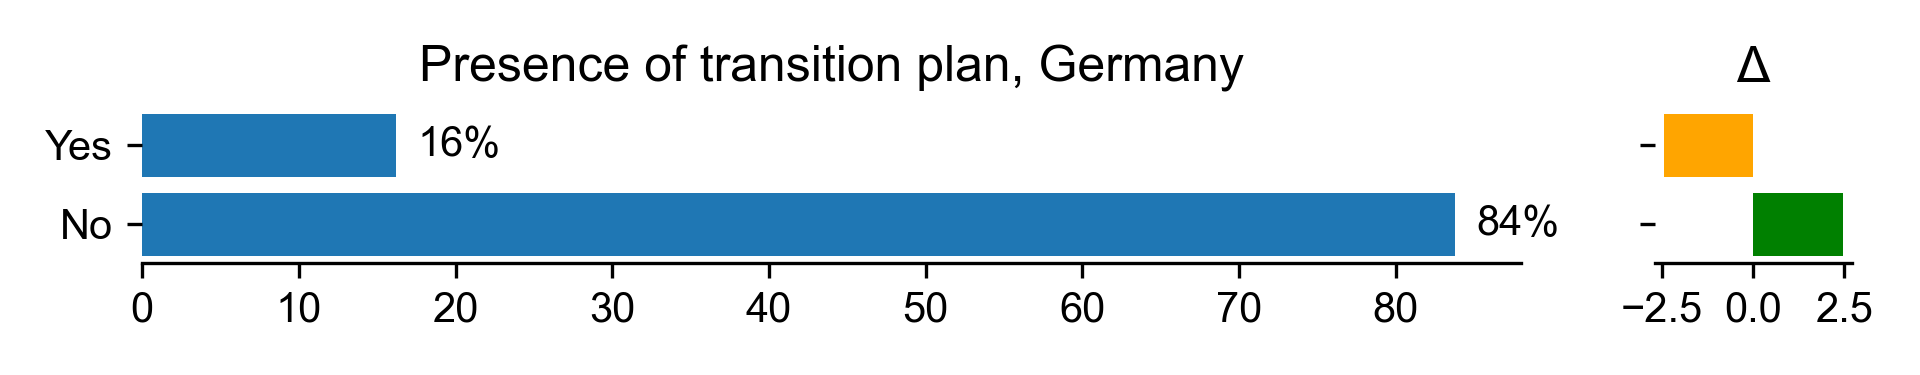
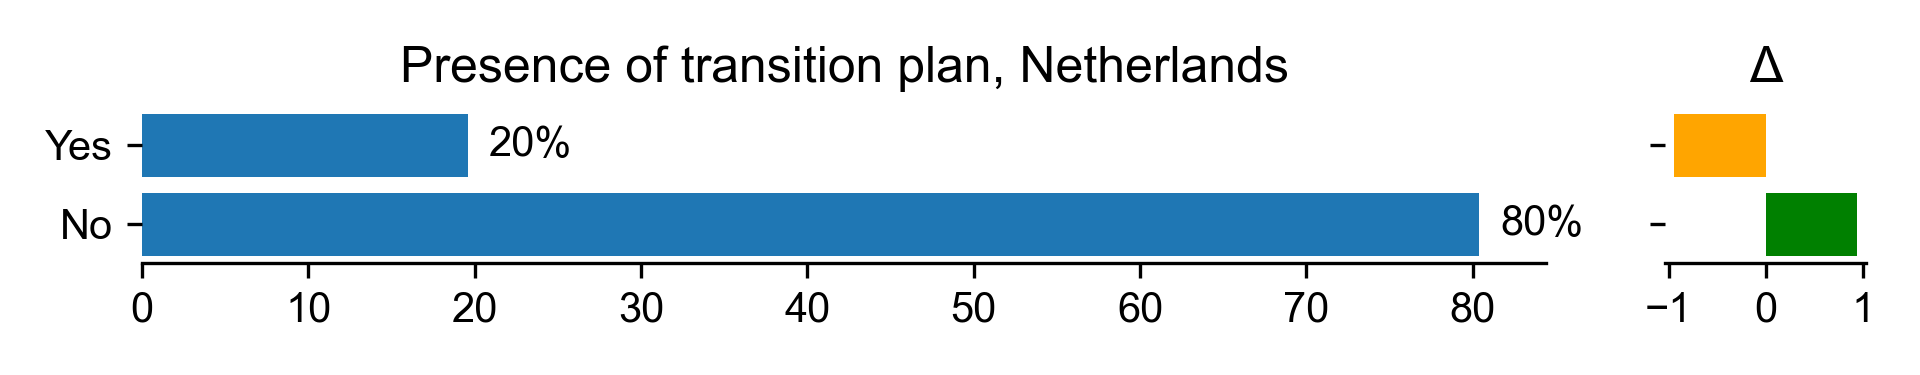
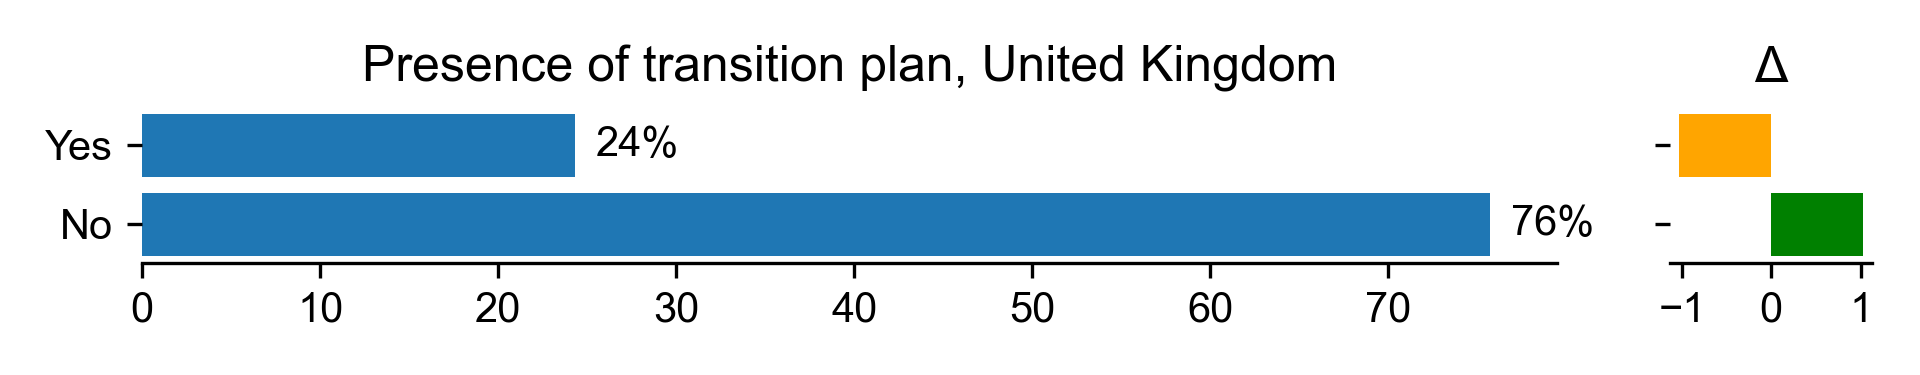
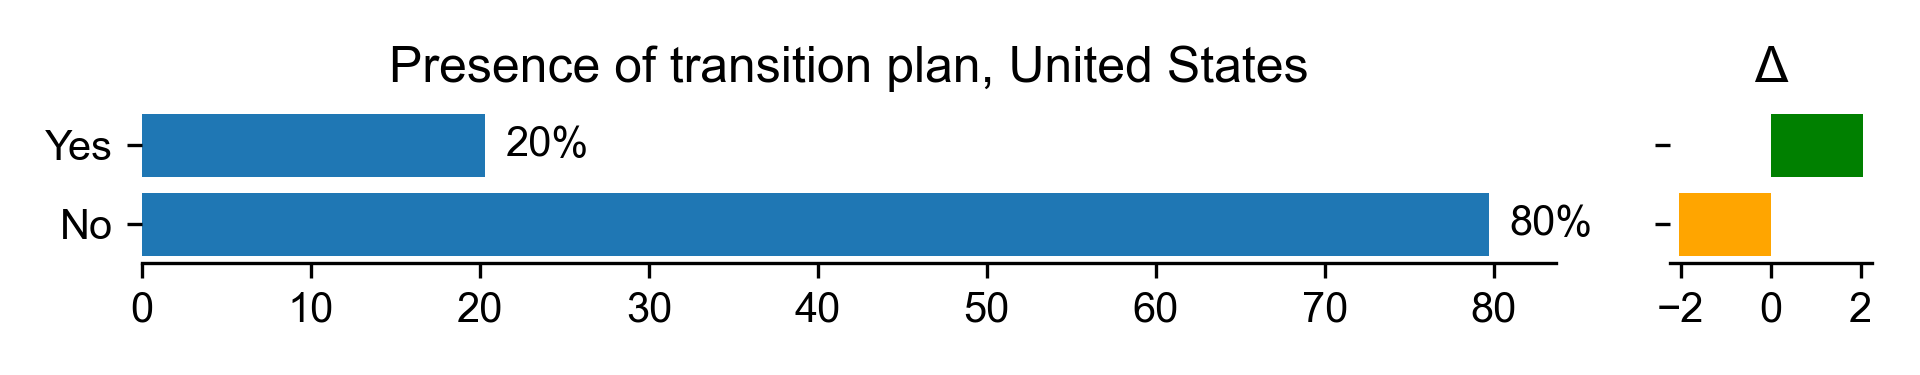
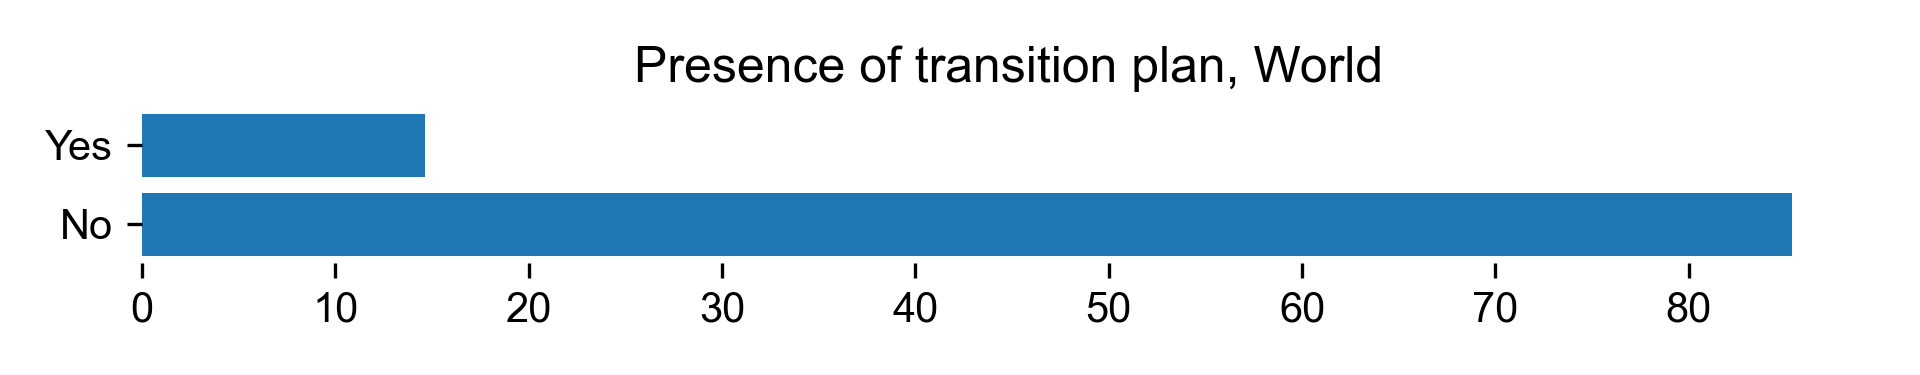
A technical hand over plan is used to introduce a new developer to
a software project. These plans cover basic information, such as the license
and location of the software, a repository, a description of the software
architecture, a summary of development plans and any other information that
a new developer would need to understand the software. A project that has
written (and maintained) a technical hand over plan can withstand the
departure of a developer, even a key developer, significantly better than
one without such a plan.
Developing software requires a set of good practices to ensure the quality of
the subsequent analysis as well as the robustness of the developed software, to
name a few of important aspects. We wanted to see if the implementation of some
simple but essential good practices were a reality beside the bus factor and
technical hand over planning.
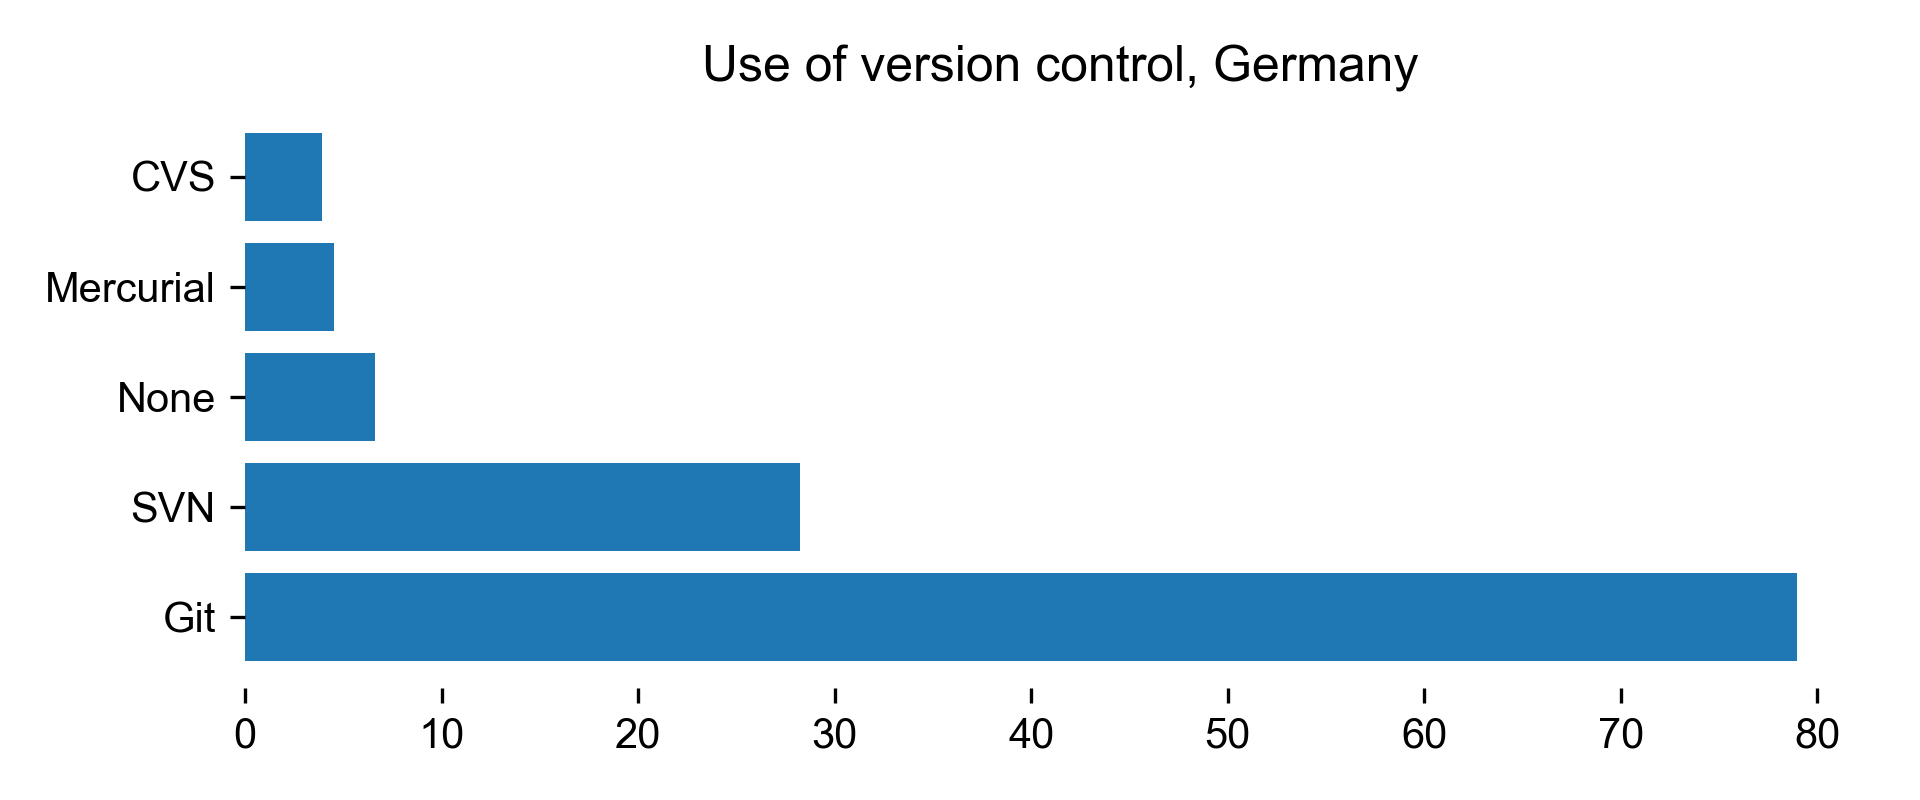
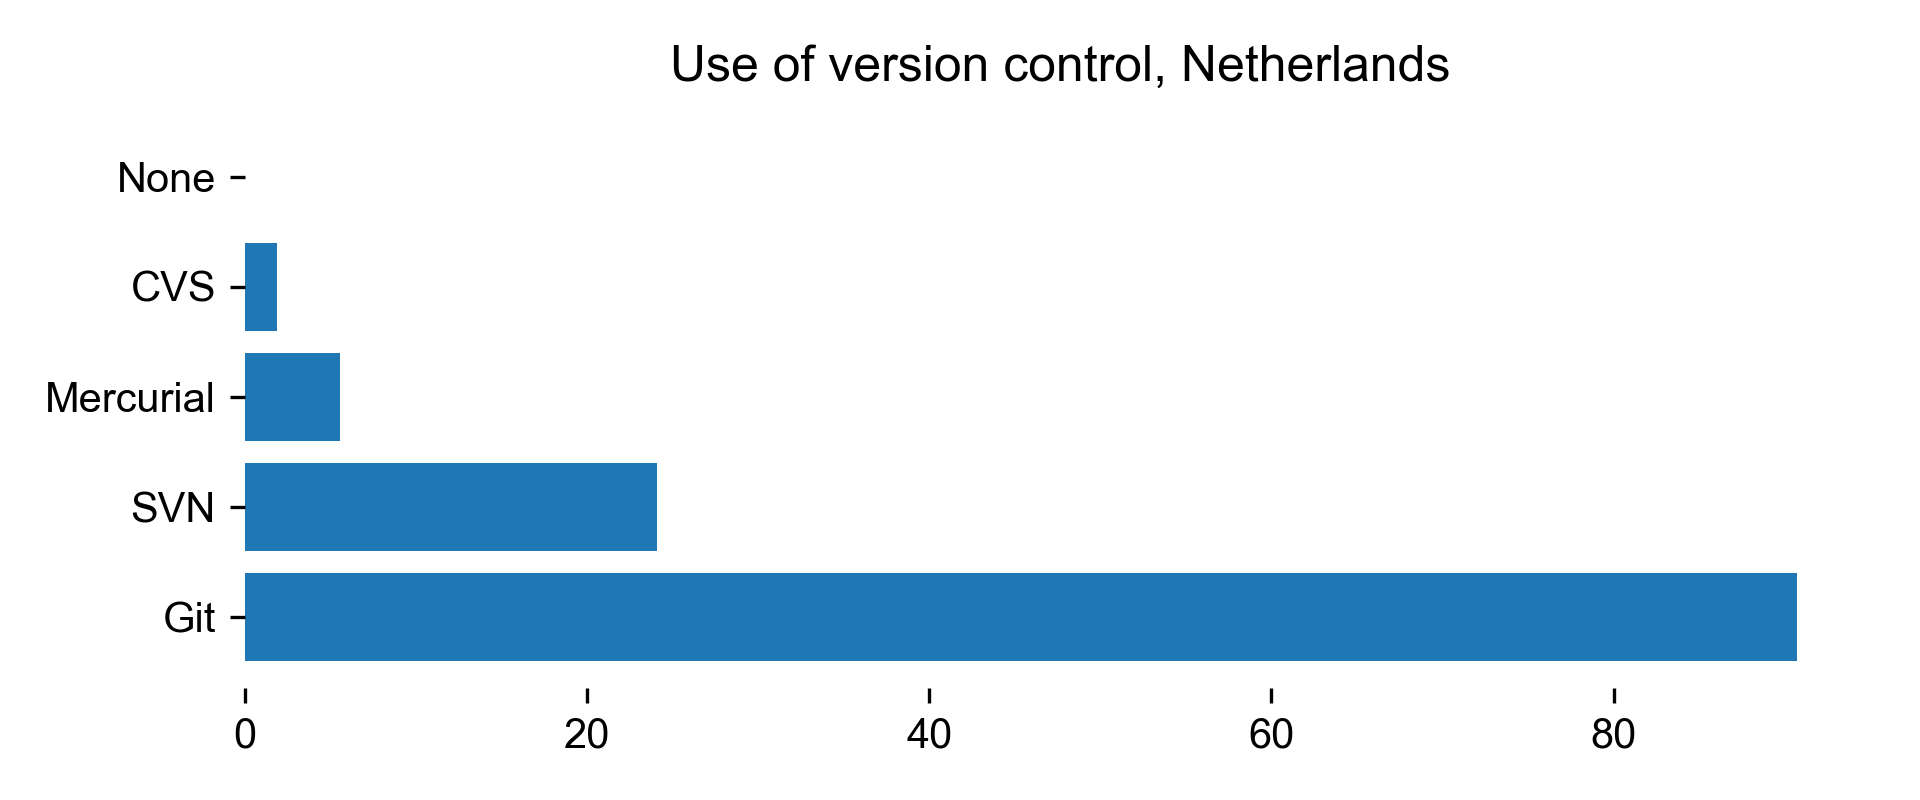
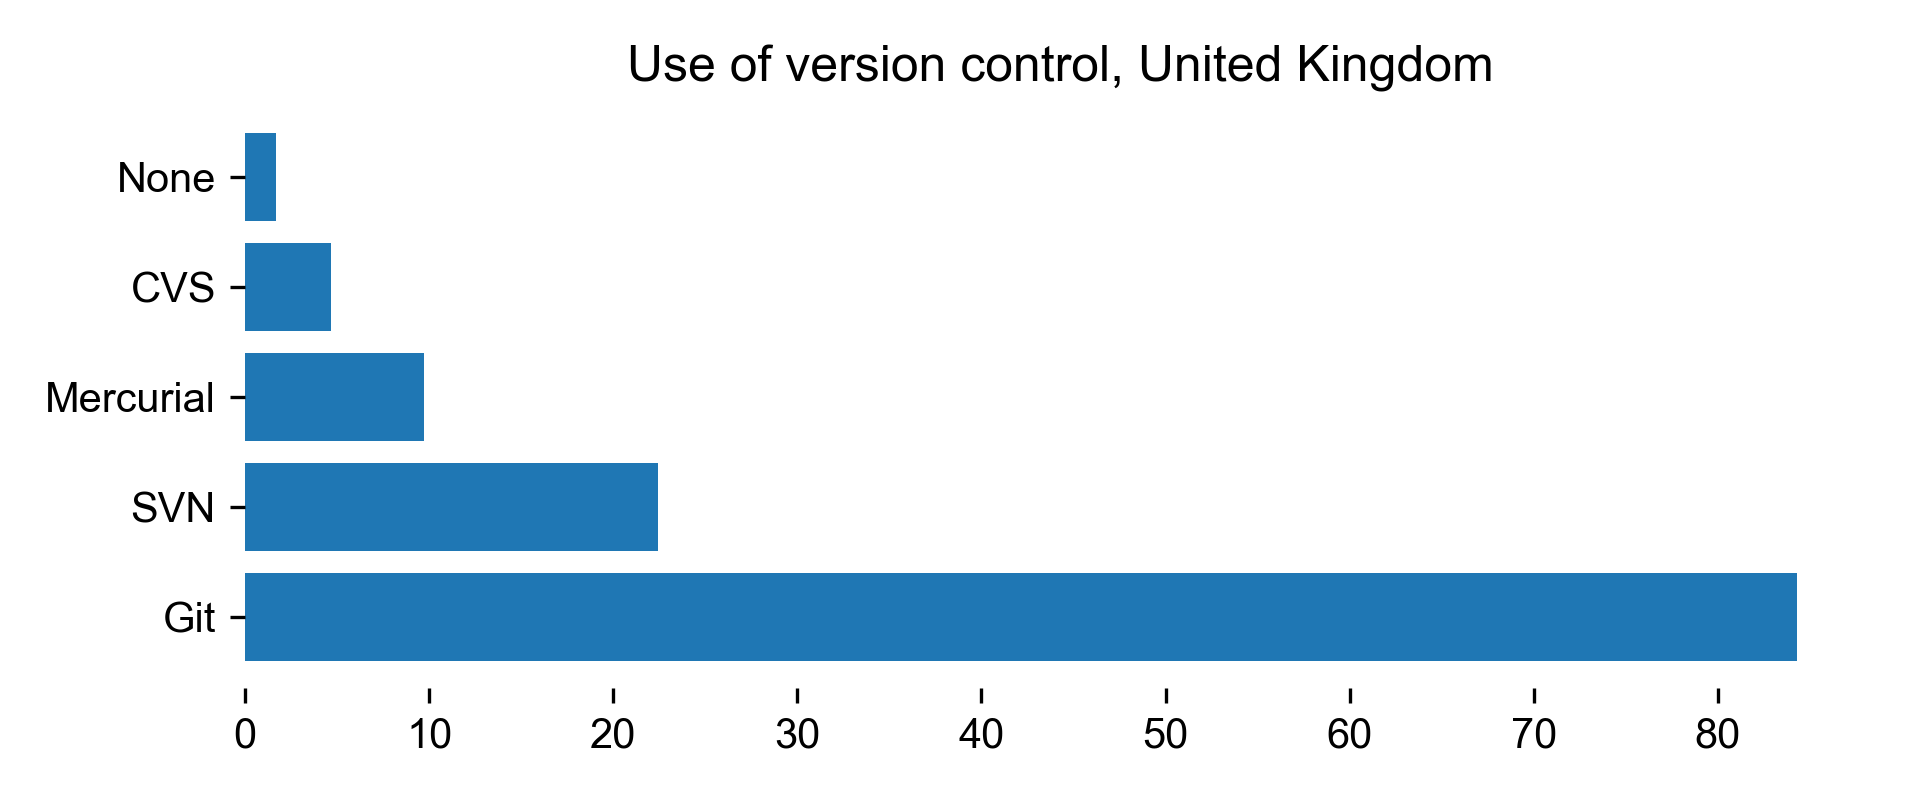
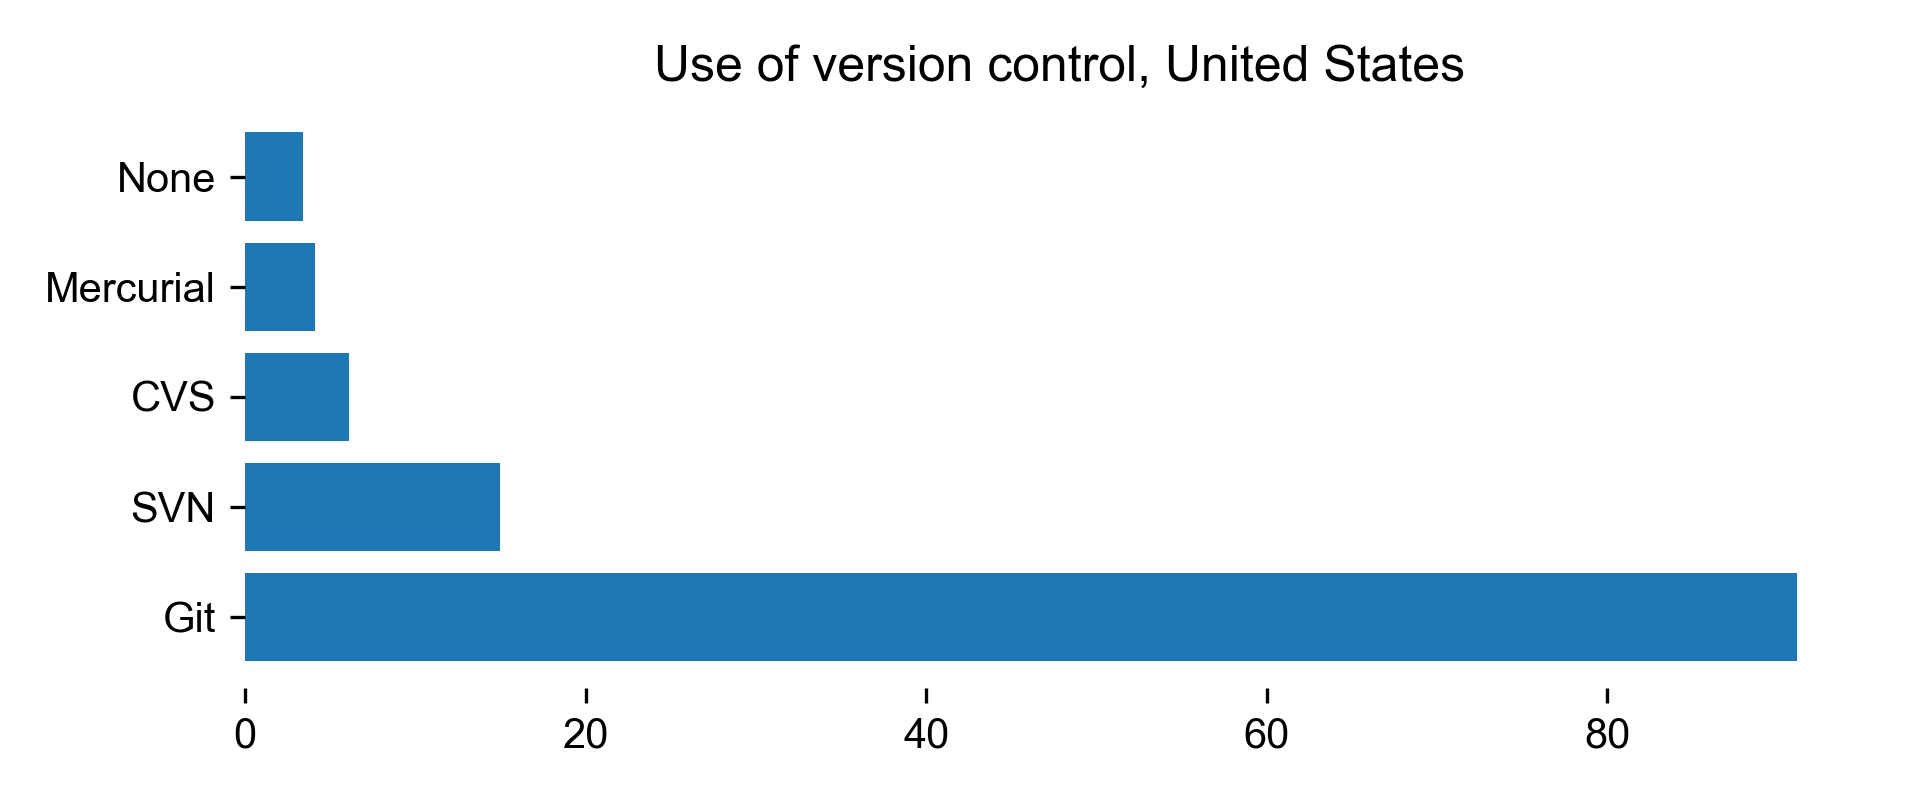
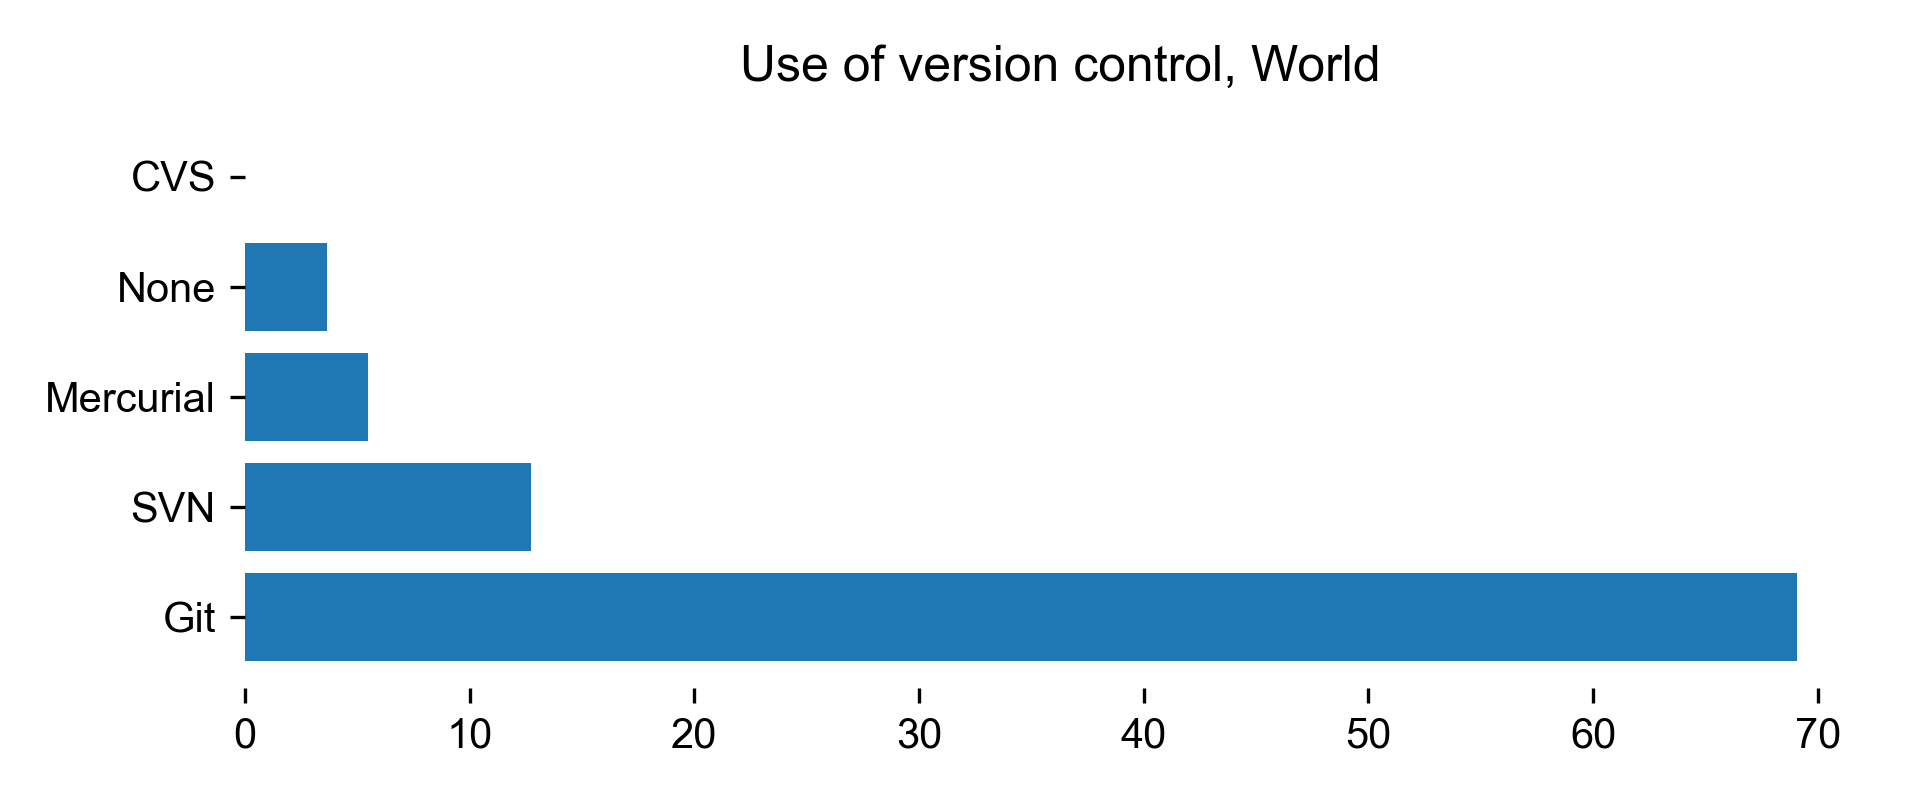
When developing software, version control and testing can be seen as
tool to enhance the quality of the developed software, especially considering
the importance of code review and sharing in public funded places such as
academia.
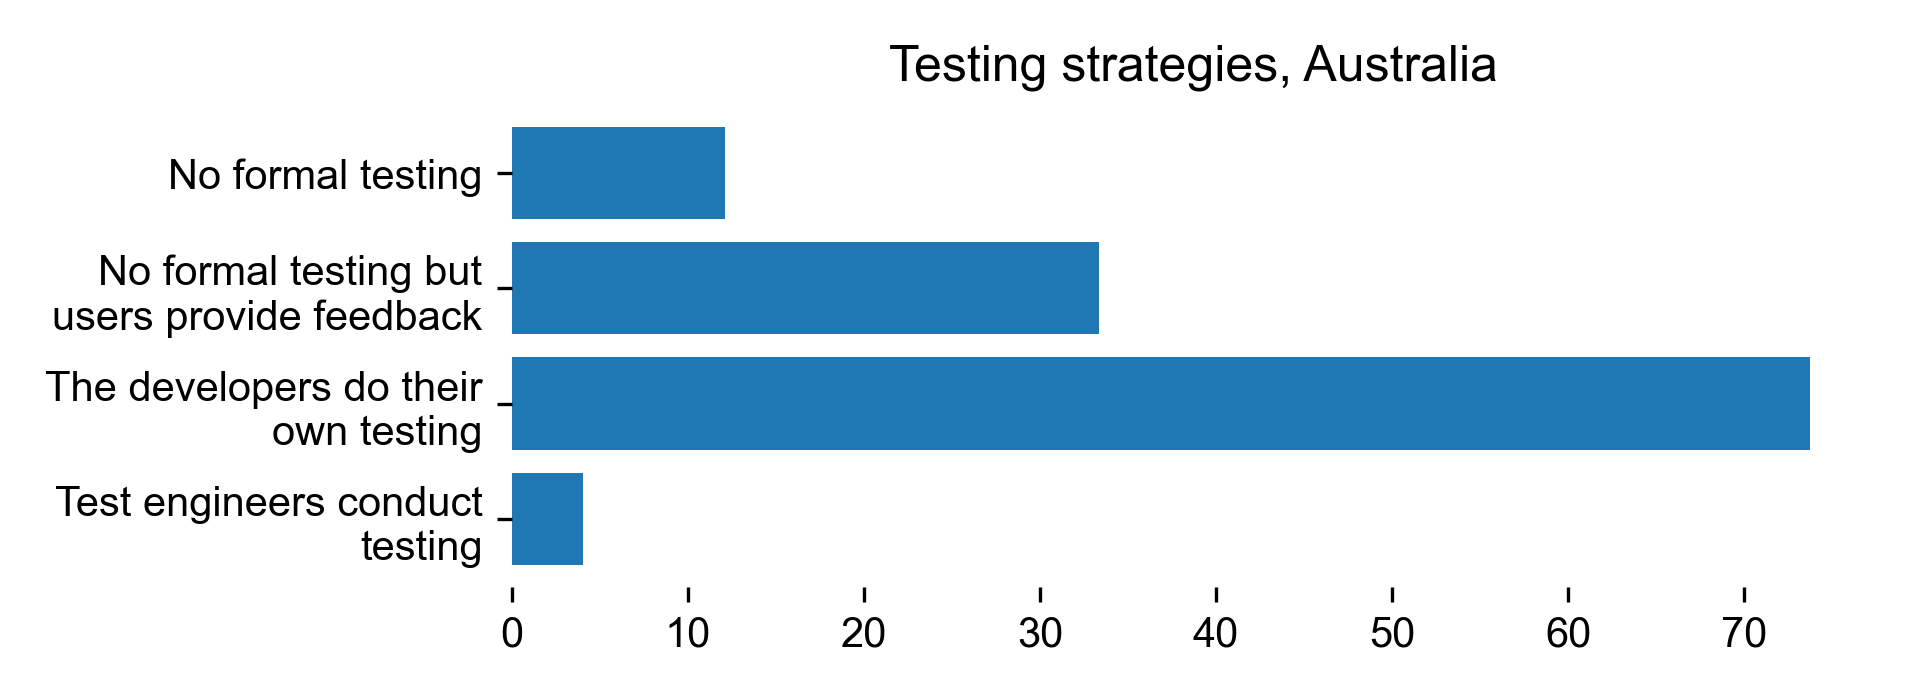
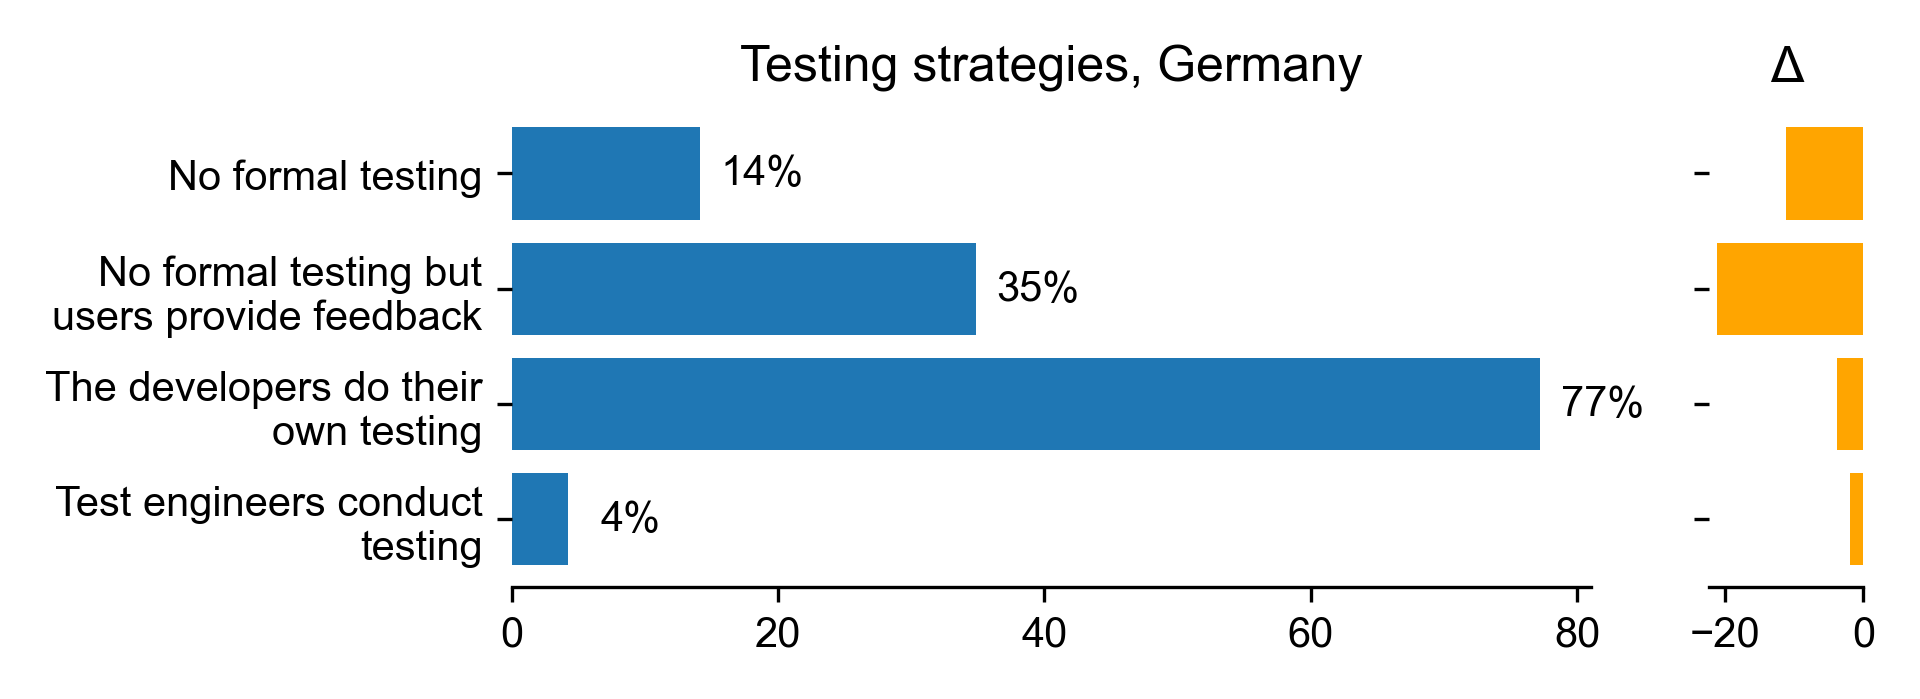
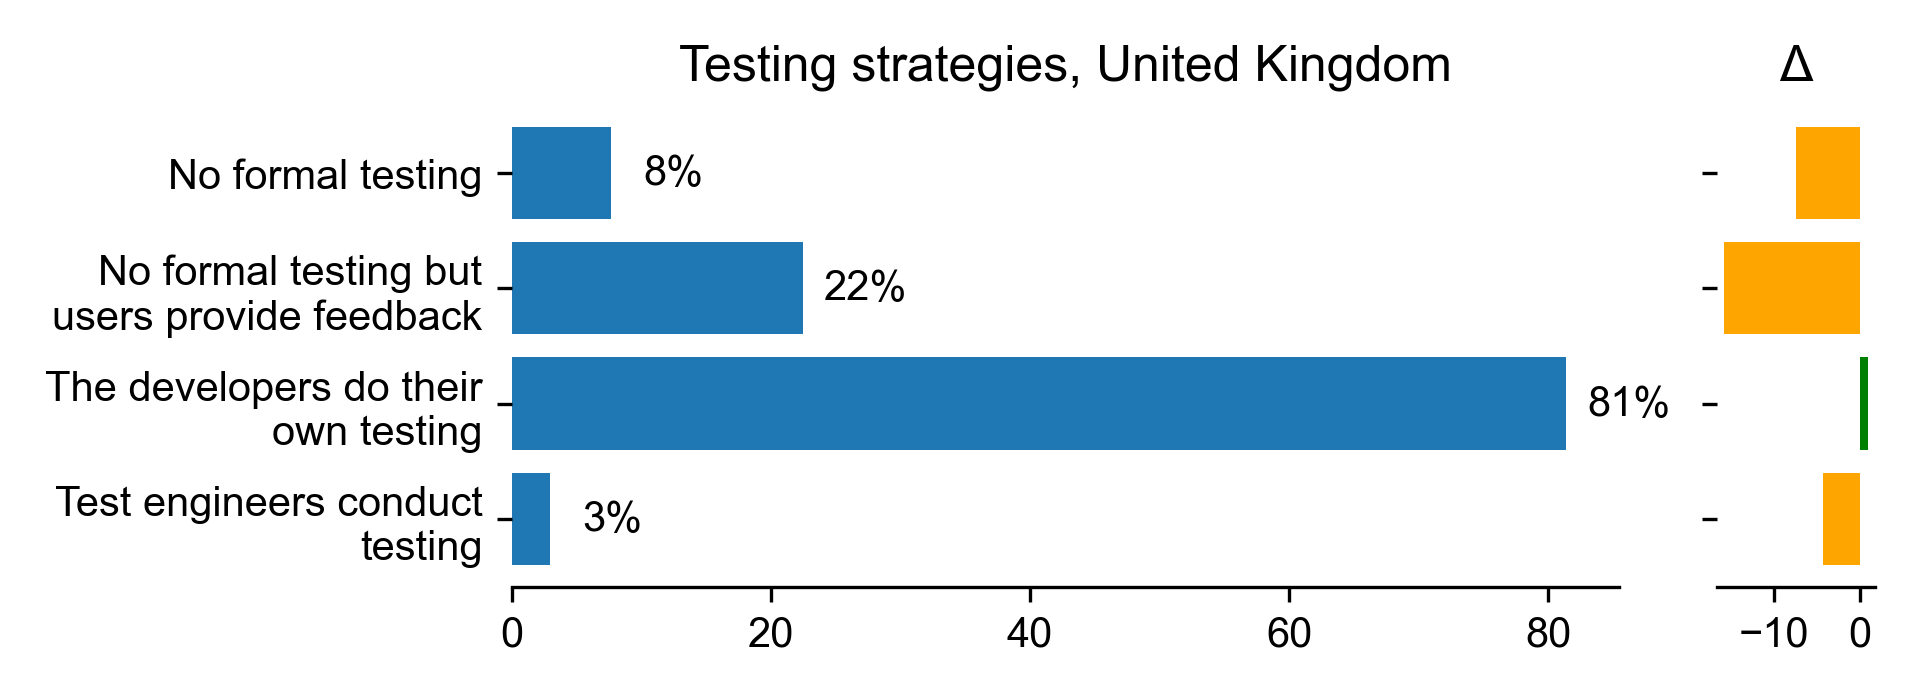
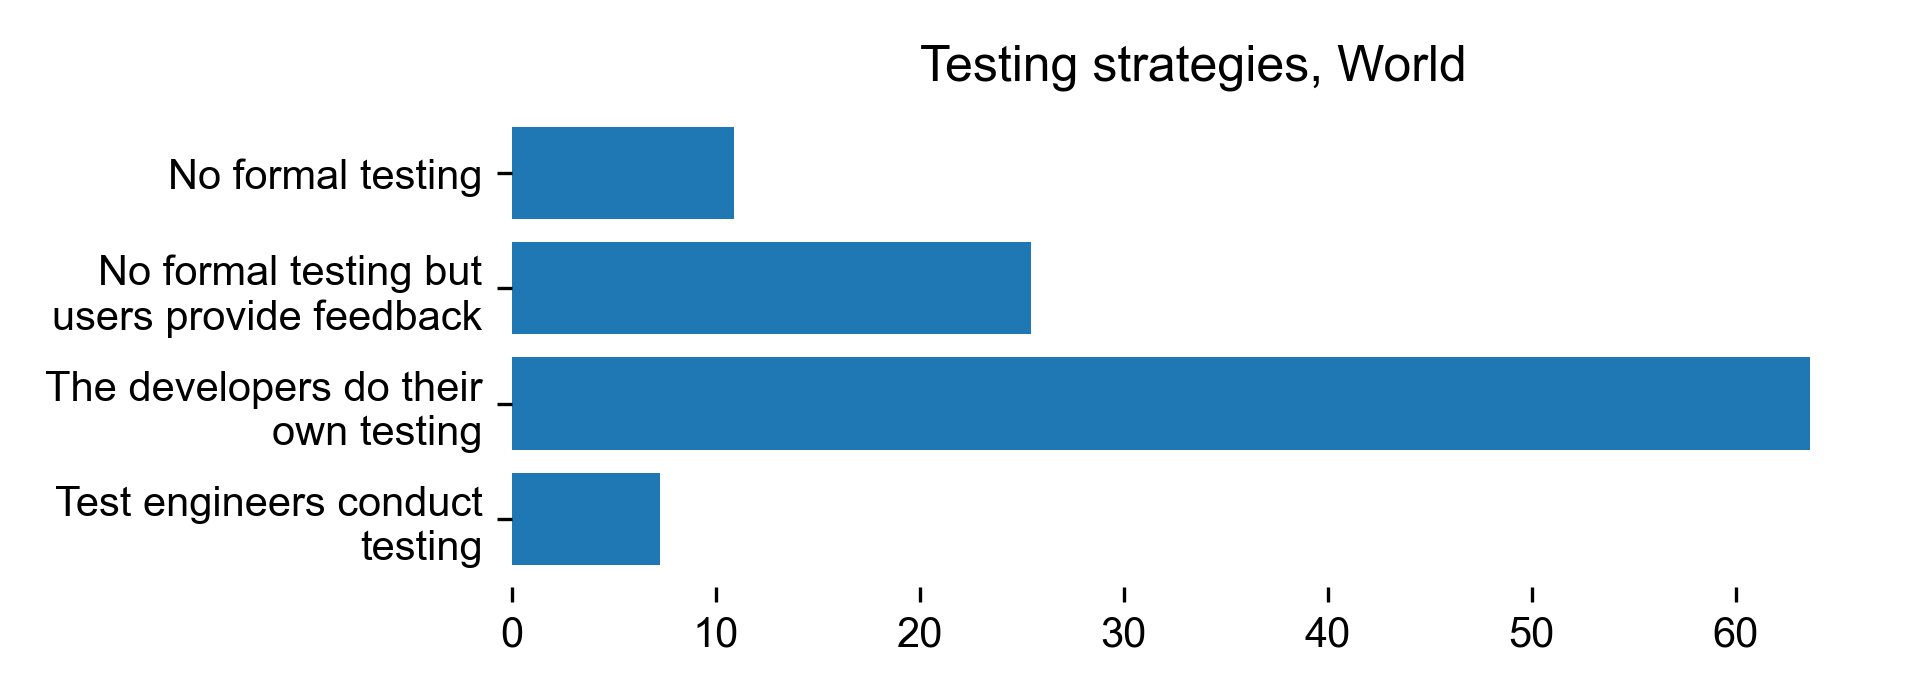
For testing, we asked the participants to choose any of the following testing
methods:
Test engineers conduct testing
Developers conduct testing
Users conduct testing
No formal testing
Obviously, the test engineers conduct testing is the most robust testing method
but may not be possible in smaller projects while no formal testing should not
occur in any ideal scenario, regardless of the size of the project.
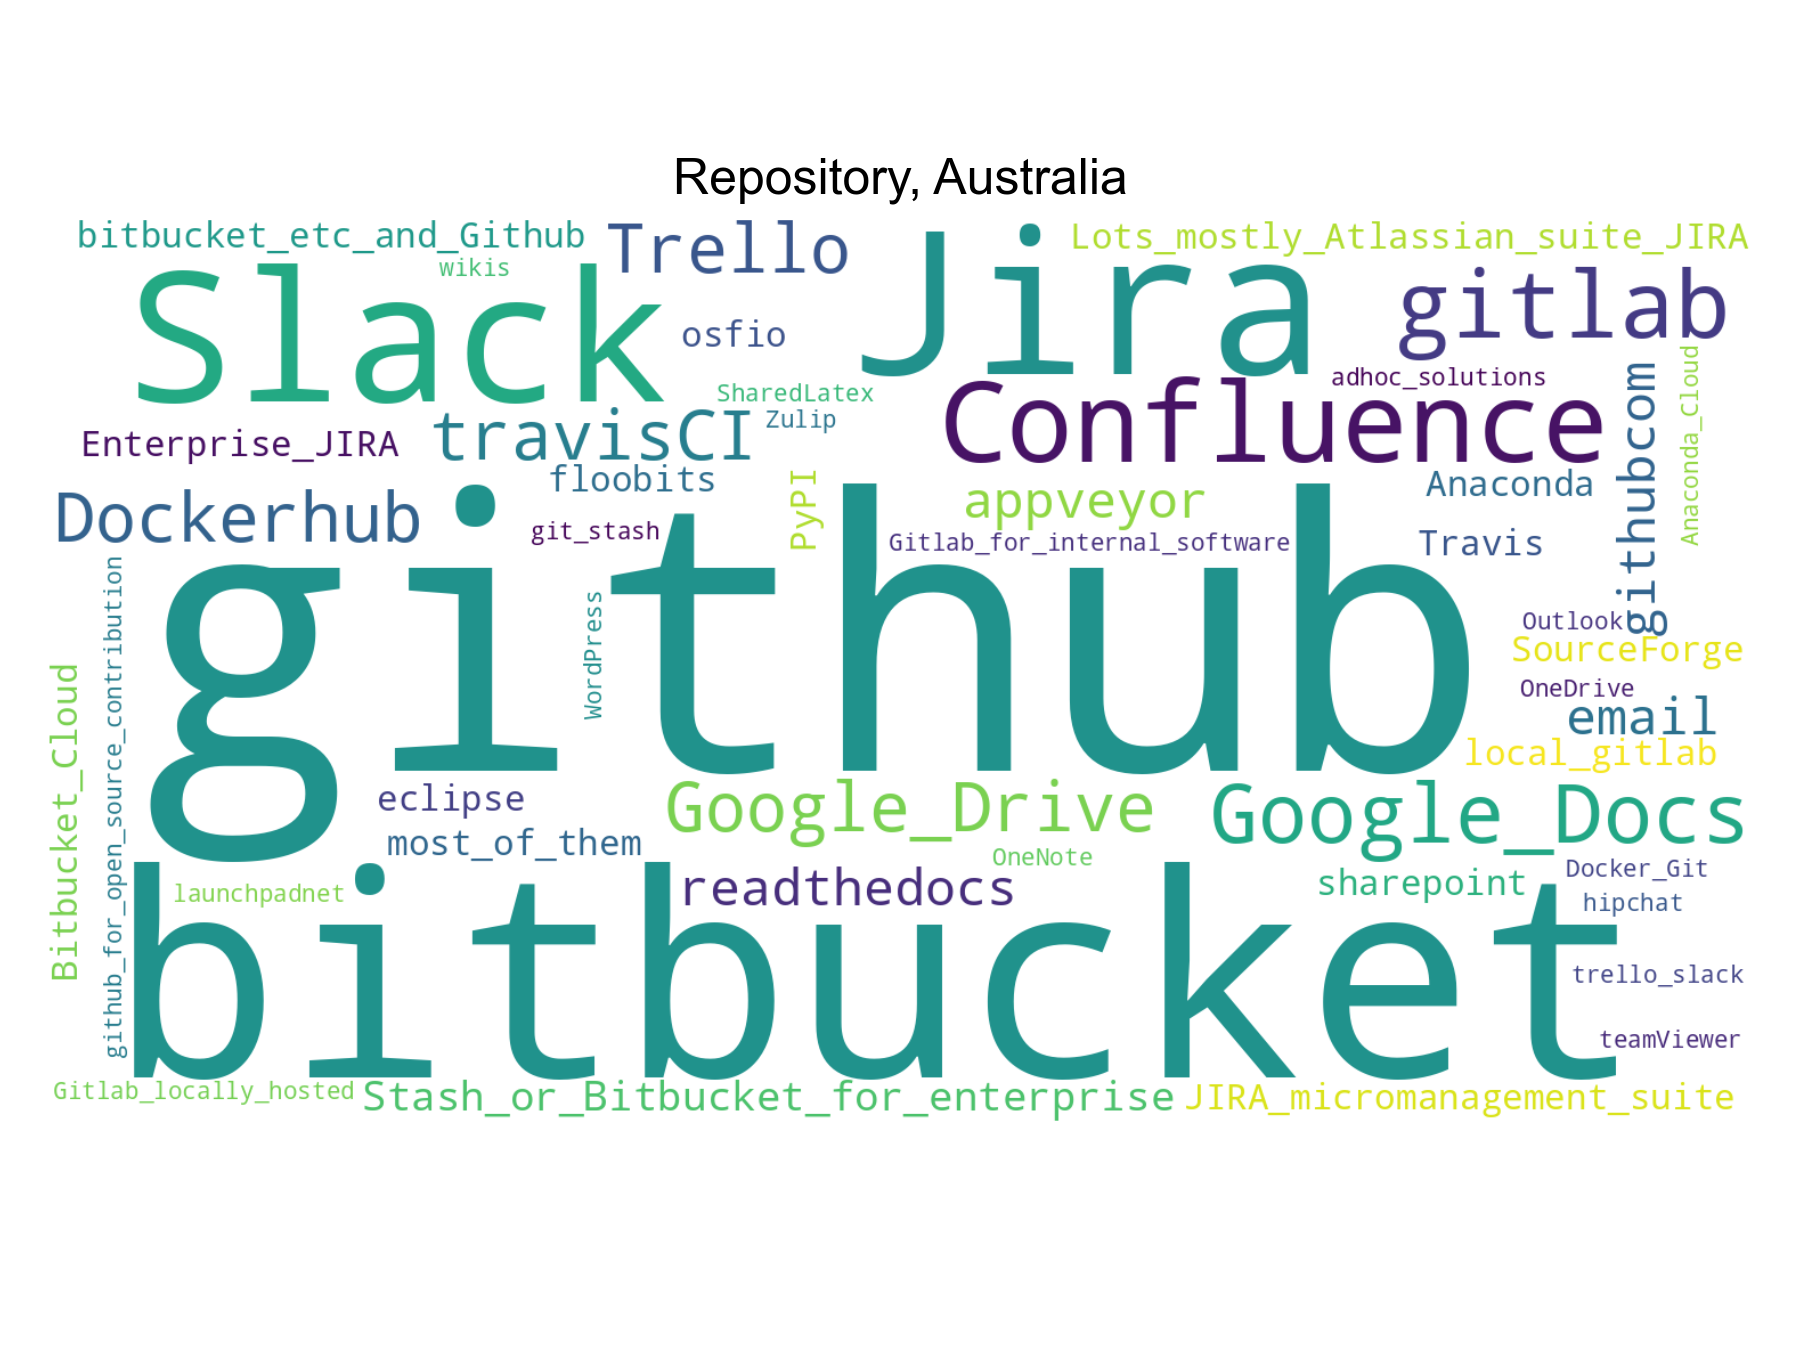
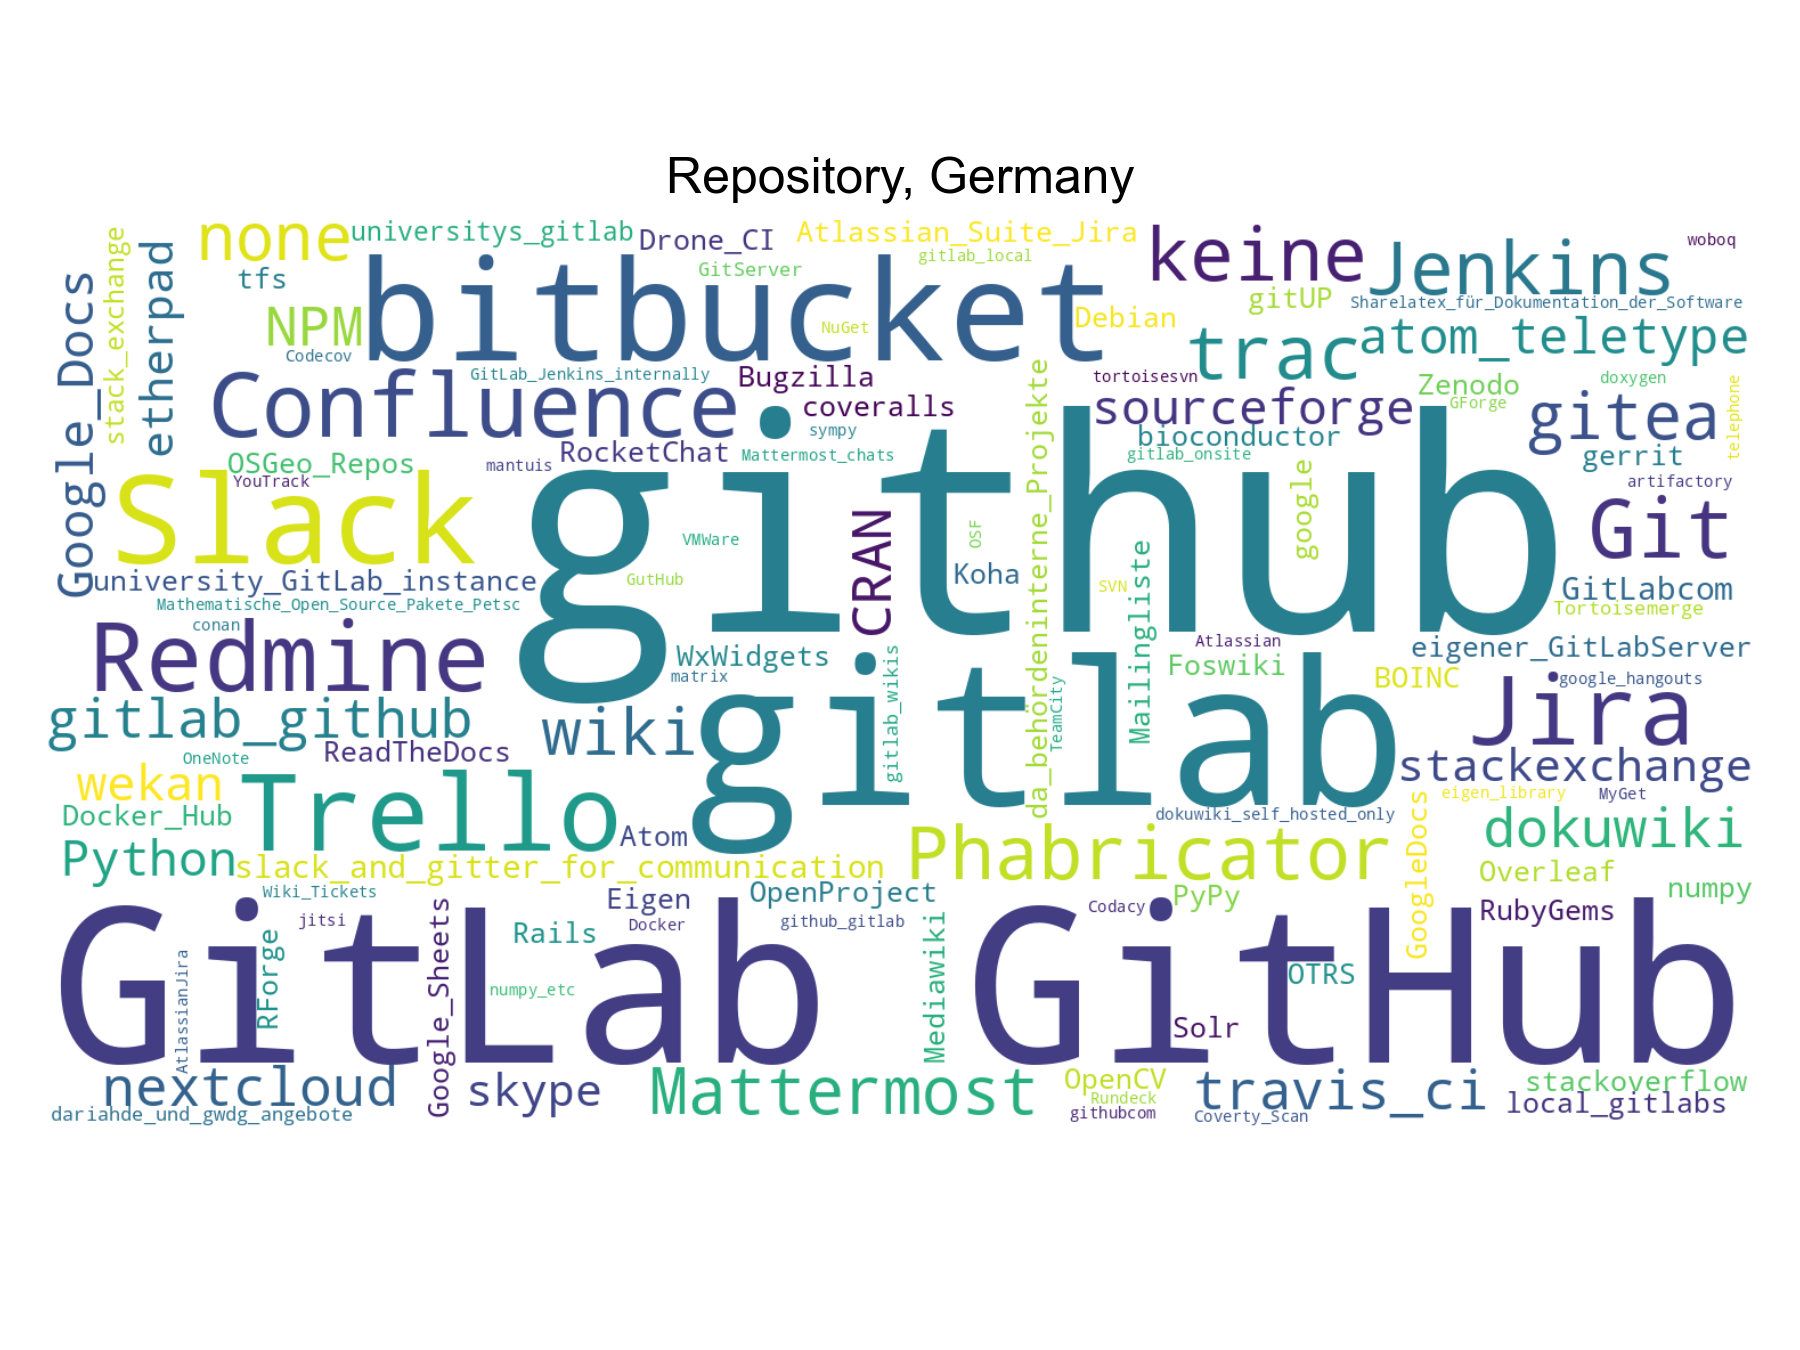
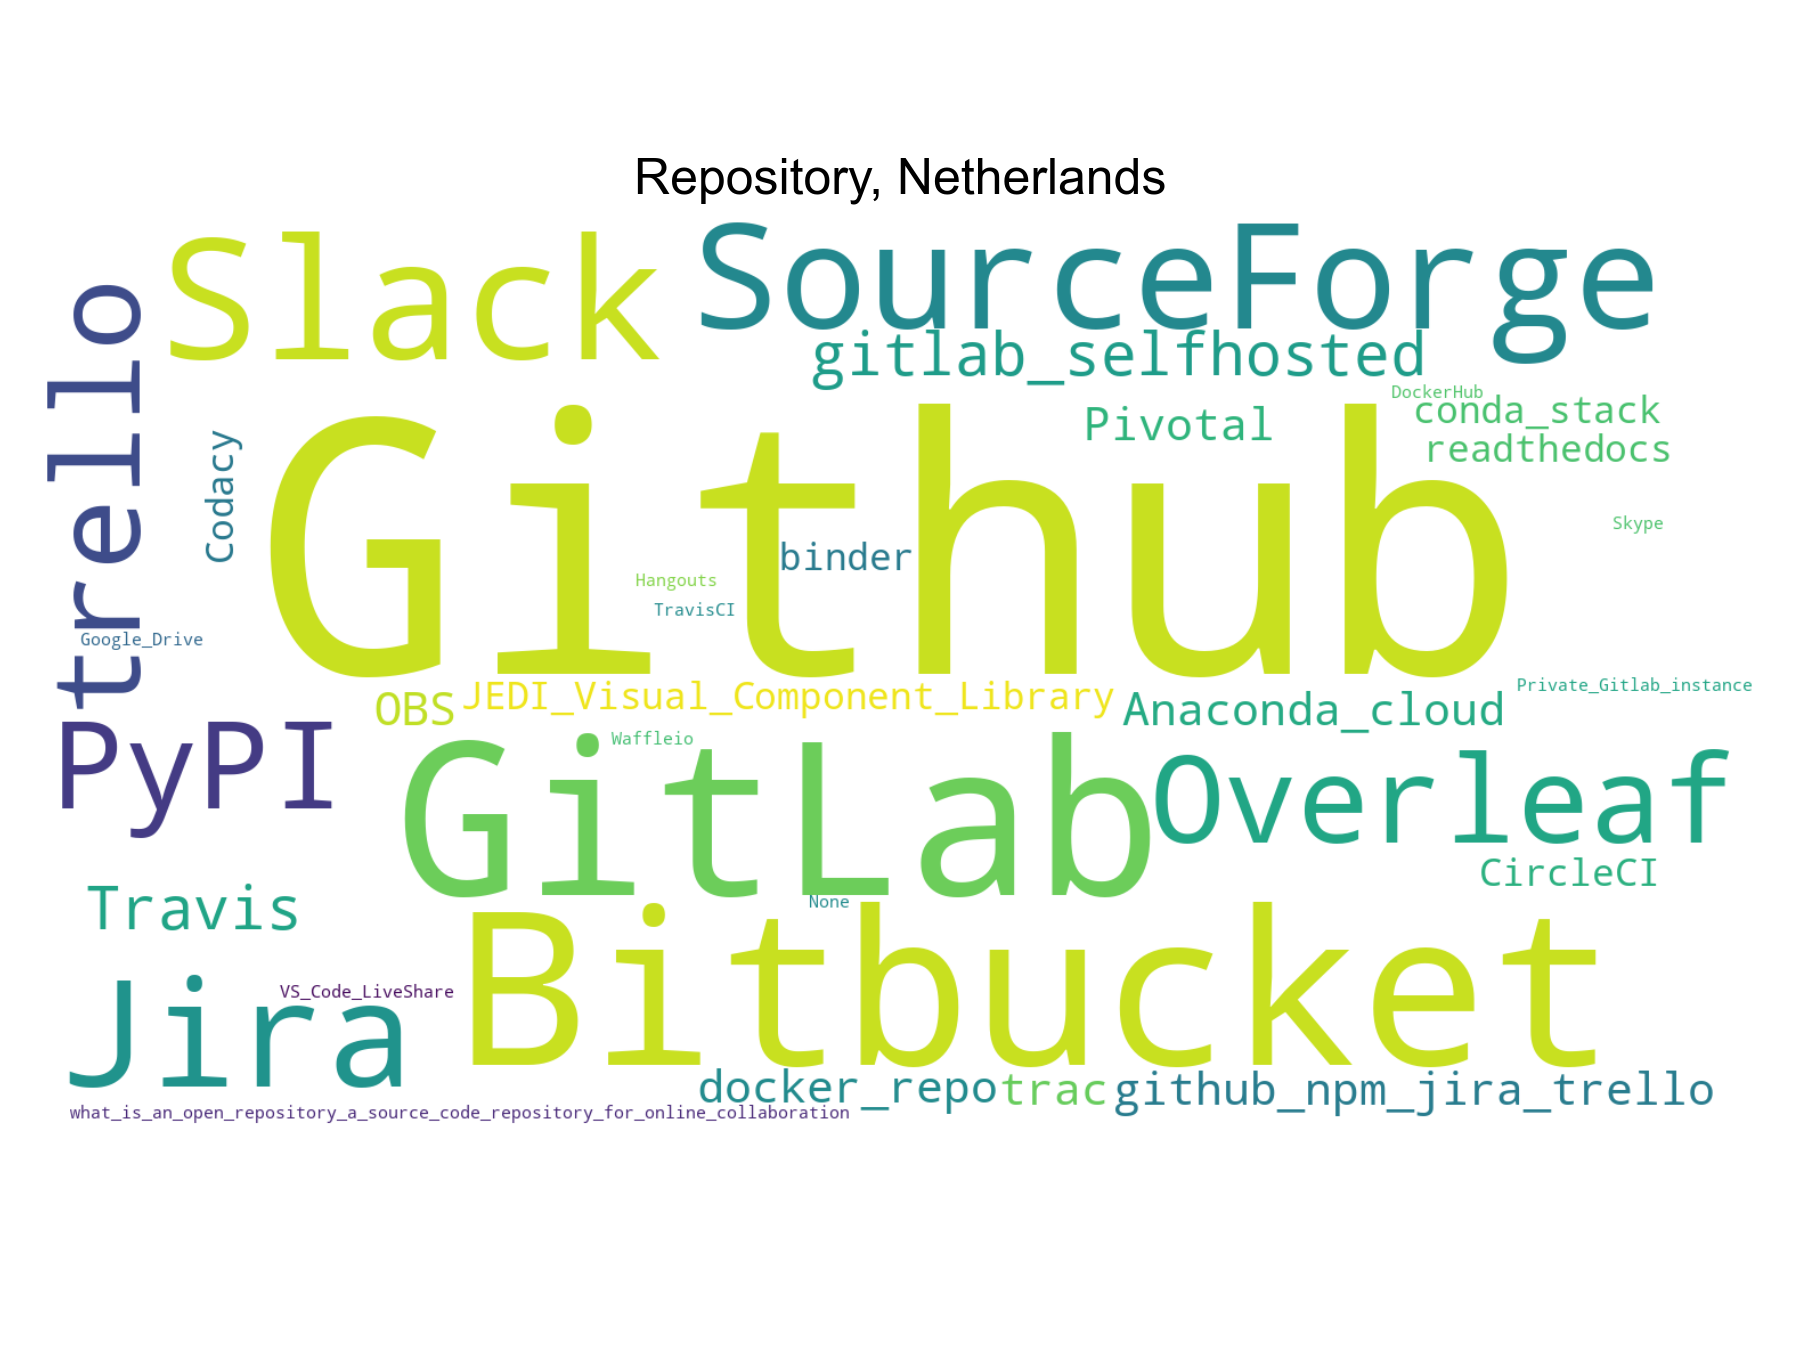
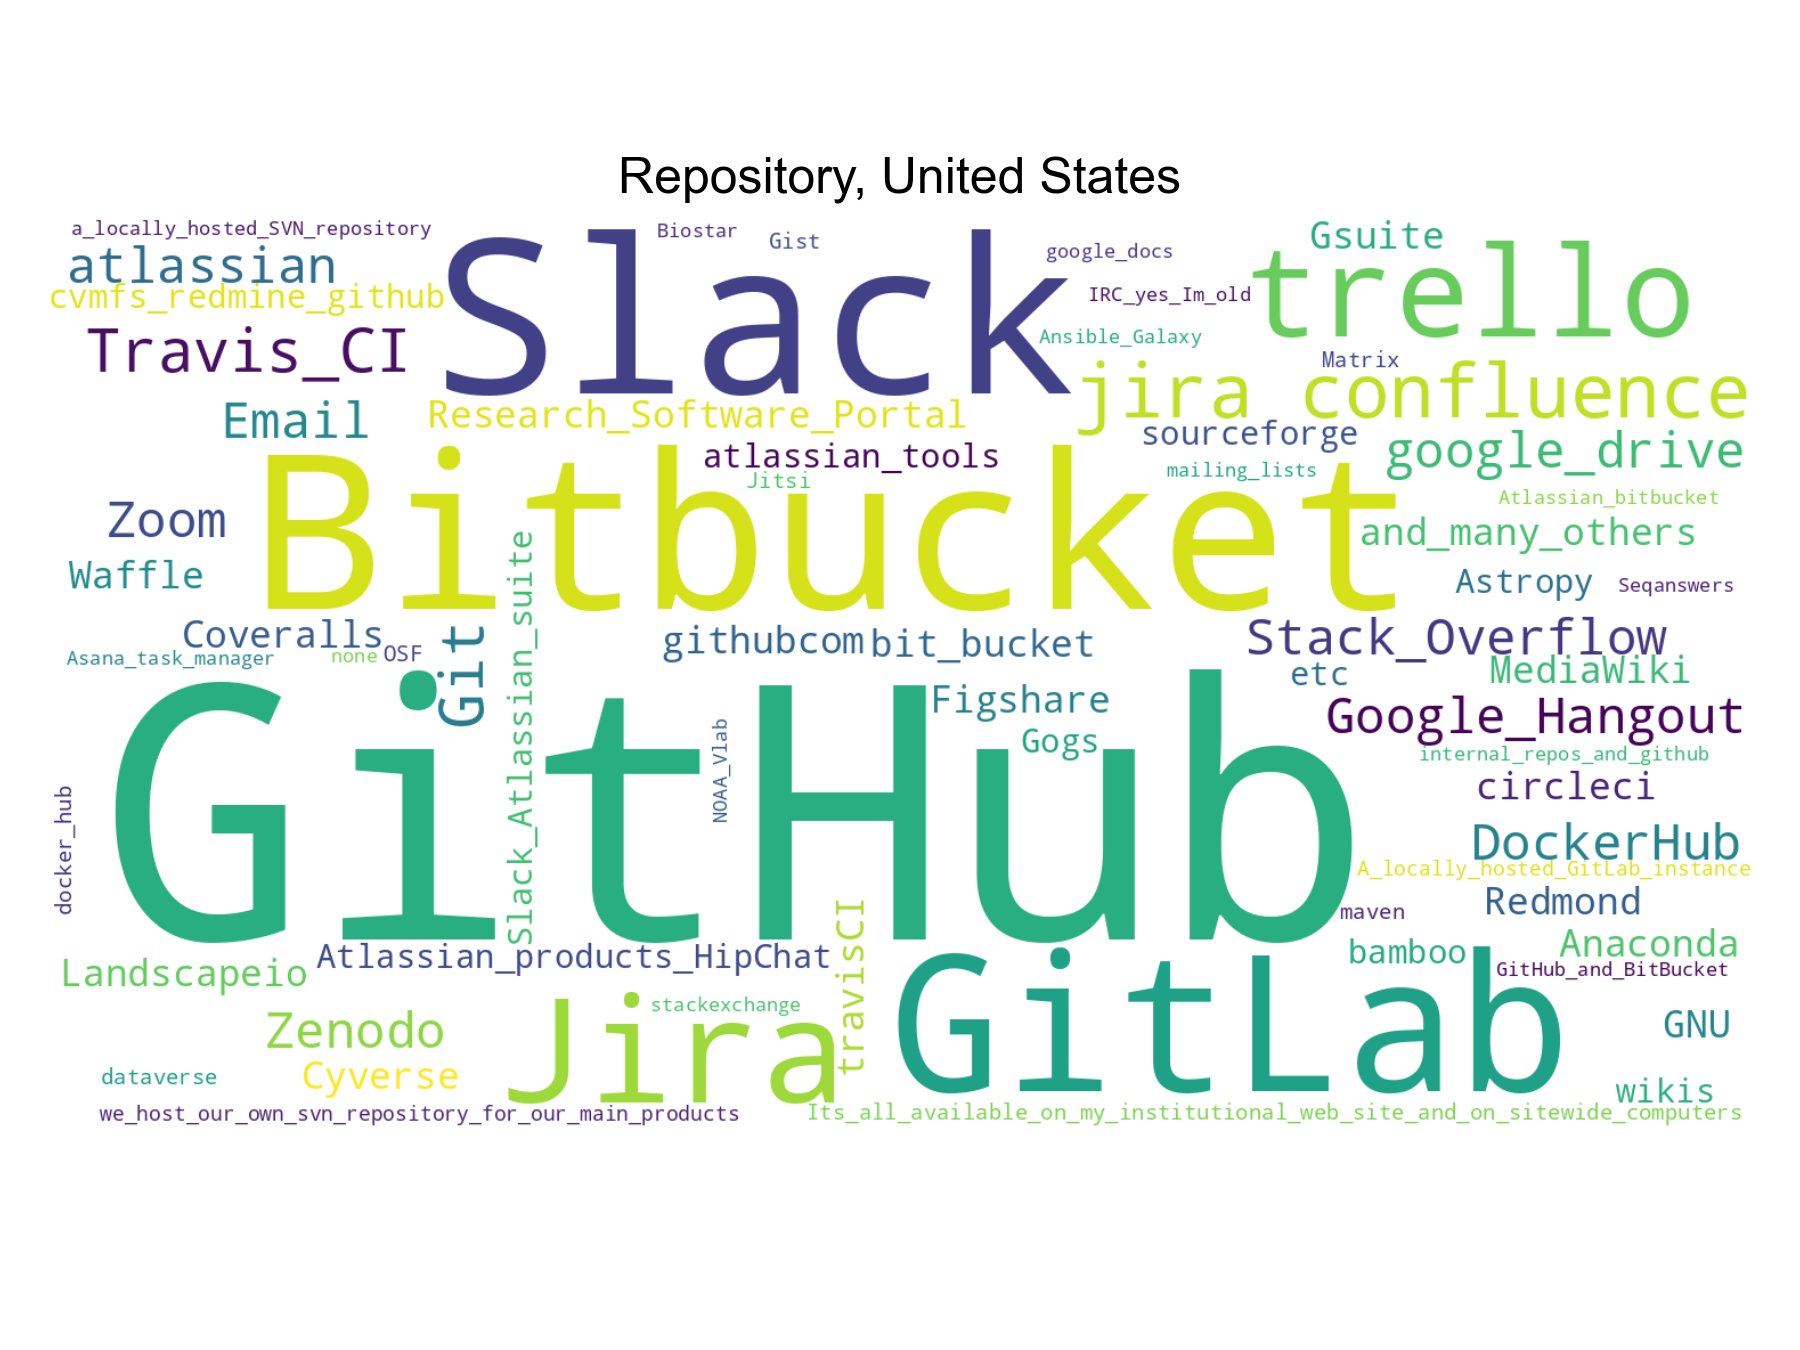
We also asked the participants if they use any version control tools through
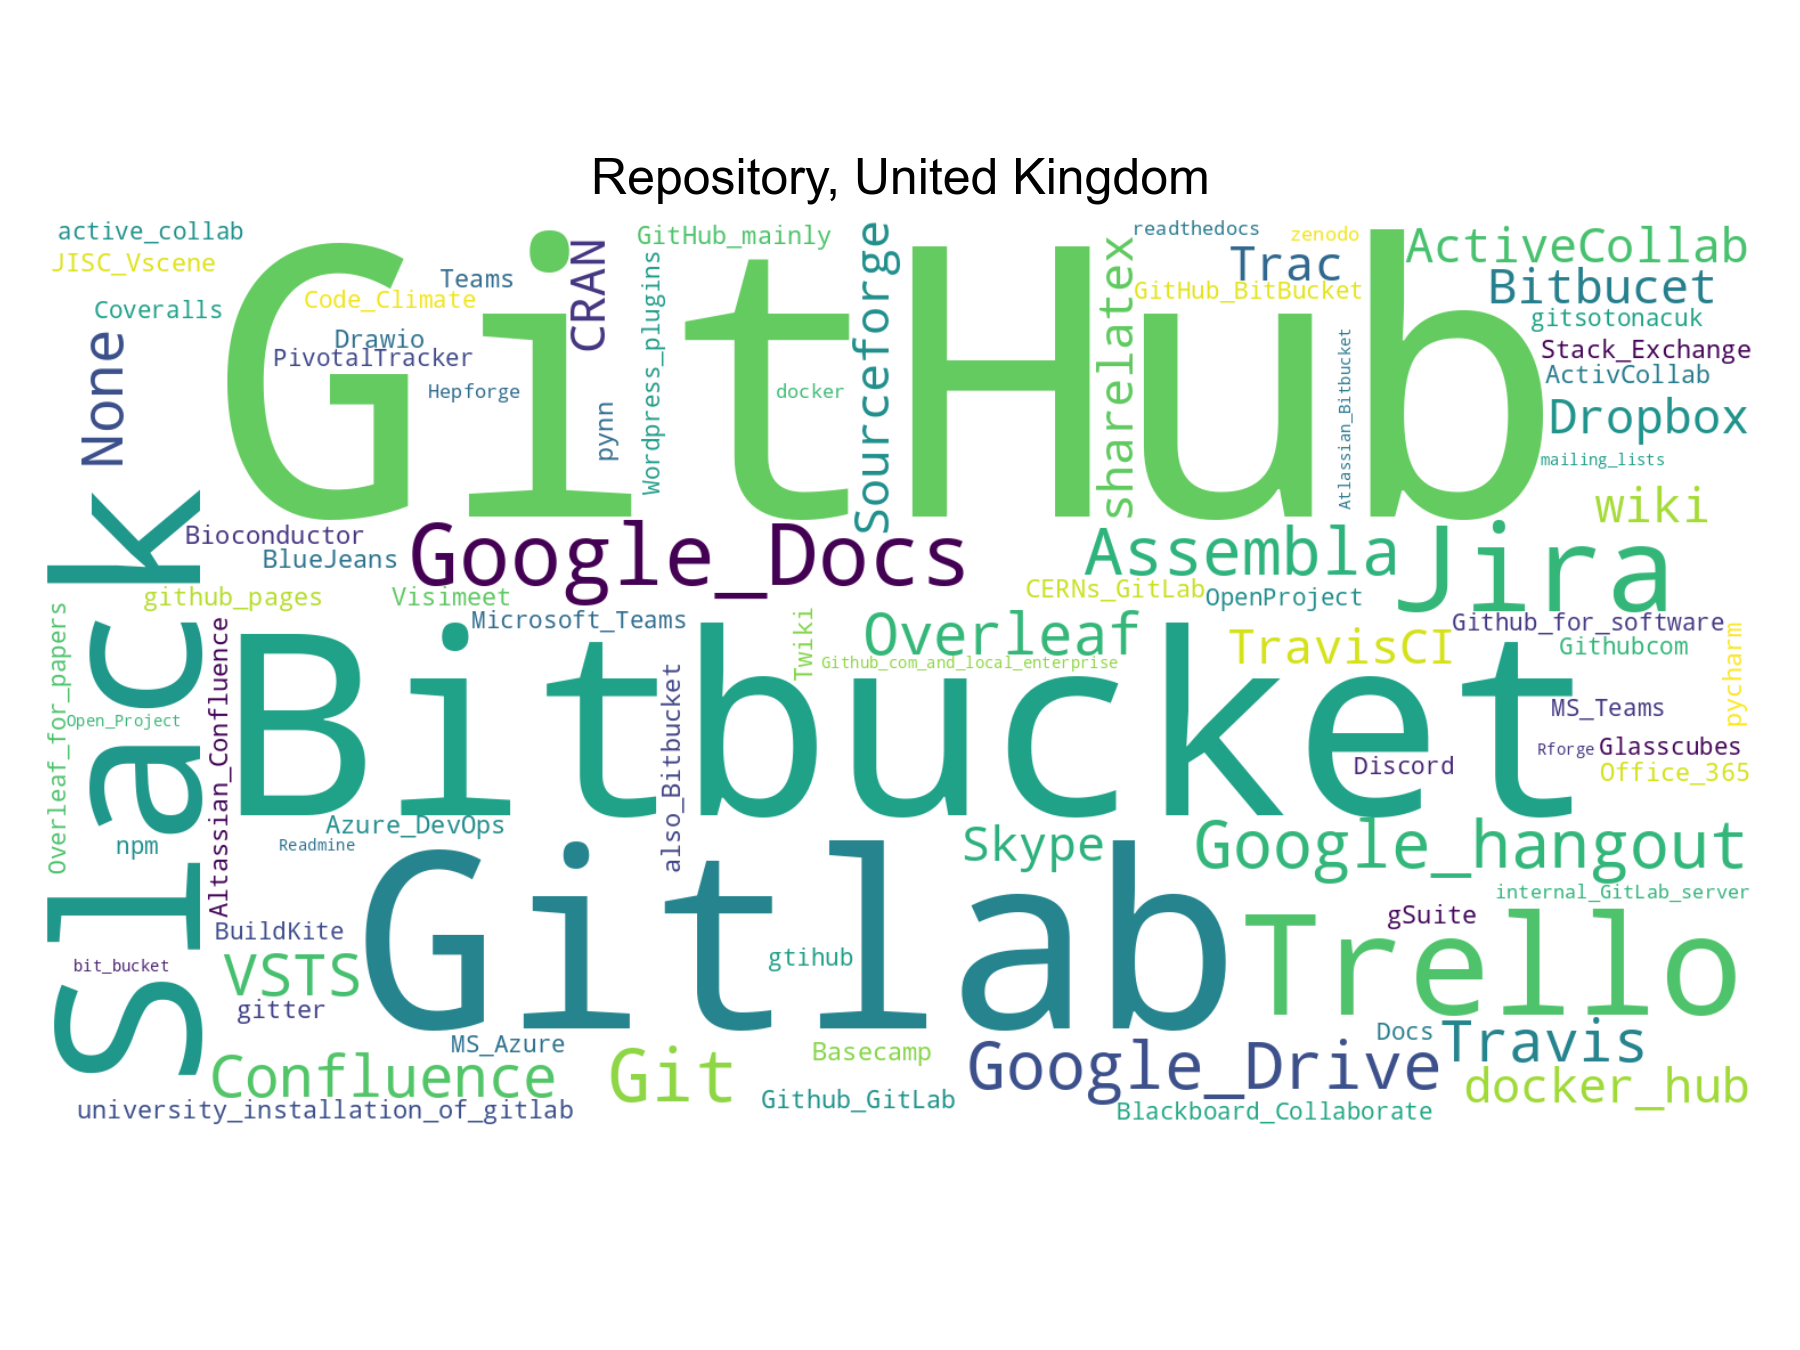
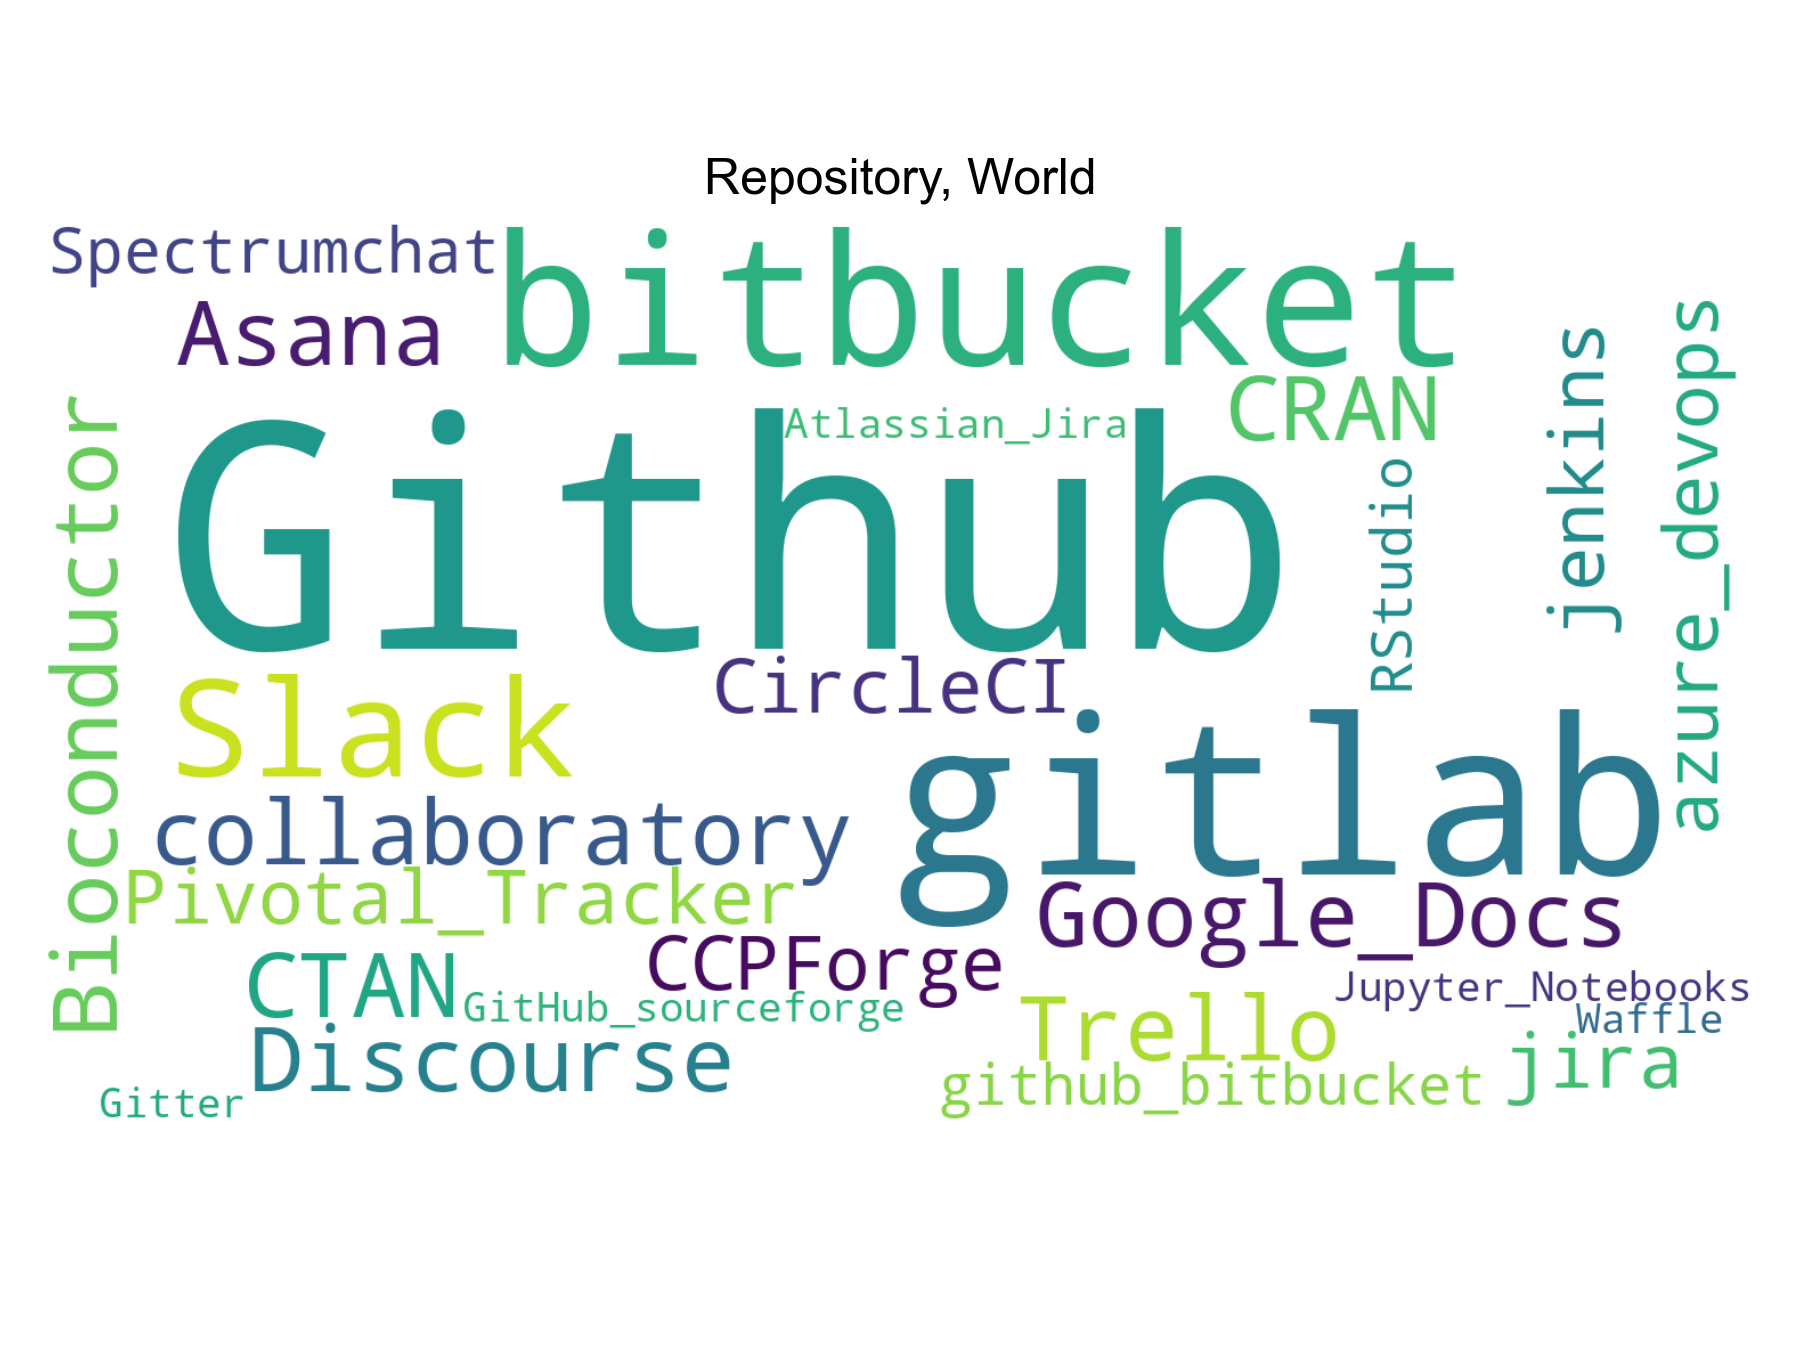
a list of choice. And finally we asked them which repository they are currently
using for their most important project.
Bus factor for Australia
Count
Percentage
0
2
2.27273
1
60
68.1818
2
16
18.1818
3
5
5.68182
4
2
2.27273
5
3
3.40909
Download CSV
2021-08-04T21:01:18.983410
image/svg+xml
Matplotlib v3.4.2, https://matplotlib.org/
0
10
20
30
40
50
60
70
5.0
4.0
3.0
2.0
1.0
0.0
Bus factor, Australia
PNG SVG
Presence of transition plan for Australia
Count
Percentage
Yes
9
10.2273
No
79
89.7727
Download CSV
2021-08-04T21:01:19.192193
image/svg+xml
Matplotlib v3.4.2, https://matplotlib.org/
0
20
40
60
80
No
Yes
Presence of transition plan, Australia
PNG SVG
Use of version control for Australia
Count
Percentage
Git
81
81.8182
SVN
20
20.202
CVS
7
7.07071
Mercurial
4
4.0404
None
2
2.0202
Download CSV
2021-08-04T21:01:19.469283
image/svg+xml
Matplotlib v3.4.2, https://matplotlib.org/
0
10
20
30
40
50
60
70
80
Git
SVN
CVS
Mercurial
None
Use of version control, Australia
PNG SVG
Testing strategies for Australia
Count
Percentage
No formal testing
12
12.1212
No formal testing but users provide feedback
33
33.3333
The developers do their own testing
73
73.7374
Test engineers conduct testing
4
4.0404
Download CSV
2021-08-04T21:01:19.829289
image/svg+xml
Matplotlib v3.4.2, https://matplotlib.org/
0
10
20
30
40
50
60
70
Test engineers conduct
testing
The developers do their
own testing
No formal testing but
users provide feedback
No formal testing
Testing strategies, Australia
PNG SVG
2021-08-04T21:01:21.269950
image/svg+xml
Matplotlib v3.4.2, https://matplotlib.org/
Repository, Australia
PNG SVG
Bus factor for Germany
Count
Percentage
0
17
5.76271
0.5
1
0.338983
1
169
57.2881
1.2
1
0.338983
1.5
2
0.677966
2
78
26.4407
3
17
5.76271
4
3
1.01695
5
3
1.01695
6
2
0.677966
50
1
0.338983
200
1
0.338983
Download CSV
2021-08-04T21:01:21.991403
image/svg+xml
Matplotlib v3.4.2, https://matplotlib.org/
0
10
20
30
40
50
60
200.0
50.0
6.0
5.0
4.0
3.0
2.0
1.5
1.2
1.0
0.5
0.0
Bus factor, Germany
PNG SVG
Presence of transition plan for Germany
Count
Percentage
Percentage in 2017
Difference with previous year
Yes
48
16.2162
18.6667
-2.45045
No
248
83.7838
81.3333
2.45045
Download CSV
2021-08-04T21:01:22.281666
image/svg+xml
Matplotlib v3.4.2, https://matplotlib.org/
0
10
20
30
40
50
60
70
80
No
Yes
84%
16%
Presence of transition plan, Germany
−2.5
0.0
2.5
Δ
PNG SVG
Use of version control for Germany
Count
Percentage
Git
263
78.979
SVN
94
28.2282
None
22
6.60661
Mercurial
15
4.5045
CVS
13
3.9039
Download CSV
2021-08-04T21:01:22.616917
image/svg+xml
Matplotlib v3.4.2, https://matplotlib.org/
0
10
20
30
40
50
60
70
80
Git
SVN
None
Mercurial
CVS
Use of version control, Germany
PNG SVG
Testing strategies for Germany
Count
Percentage
Percentage in 2017
Difference with previous year
No formal testing
47
14.1141
25.2308
-11.1167
No formal testing but users provide feedback
116
34.8348
56
-21.1652
The developers do their own testing
257
77.1772
80.9231
-3.7459
Test engineers conduct testing
14
4.2042
6.15385
-1.94964
Download CSV
2021-08-04T21:01:22.969727
image/svg+xml
Matplotlib v3.4.2, https://matplotlib.org/
0
20
40
60
80
Test engineers conduct
testing
The developers do their
own testing
No formal testing but
users provide feedback
No formal testing
4%
77%
35%
14%
Testing strategies, Germany
−20
0
Δ
PNG SVG
2021-08-04T21:01:25.051521
image/svg+xml
Matplotlib v3.4.2, https://matplotlib.org/
Repository, Germany
PNG SVG
Bus factor for Netherlands
Count
Percentage
1
27
52.9412
2
17
33.3333
3
4
7.84314
4
1
1.96078
10
2
3.92157
Download CSV
2021-08-04T21:01:25.712431
image/svg+xml
Matplotlib v3.4.2, https://matplotlib.org/
0
10
20
30
40
50
10.0
4.0
3.0
2.0
1.0
Bus factor, Netherlands
PNG SVG
Presence of transition plan for Netherlands
Count
Percentage
Percentage in 2017
Difference with previous year
Yes
10
19.6078
20.5479
-0.940102
No
41
80.3922
79.4521
0.940102
Download CSV
2021-08-04T21:01:25.954732
image/svg+xml
Matplotlib v3.4.2, https://matplotlib.org/
0
10
20
30
40
50
60
70
80
No
Yes
80%
20%
Presence of transition plan, Netherlands
−1
0
1
Δ
PNG SVG
Use of version control for Netherlands
Count
Percentage
Git
49
90.7407
SVN
13
24.0741
Mercurial
3
5.55556
CVS
1
1.85185
None
0
0
Download CSV
2021-08-04T21:01:26.263675
image/svg+xml
Matplotlib v3.4.2, https://matplotlib.org/
0
20
40
60
80
Git
SVN
Mercurial
CVS
None
Use of version control, Netherlands
PNG SVG
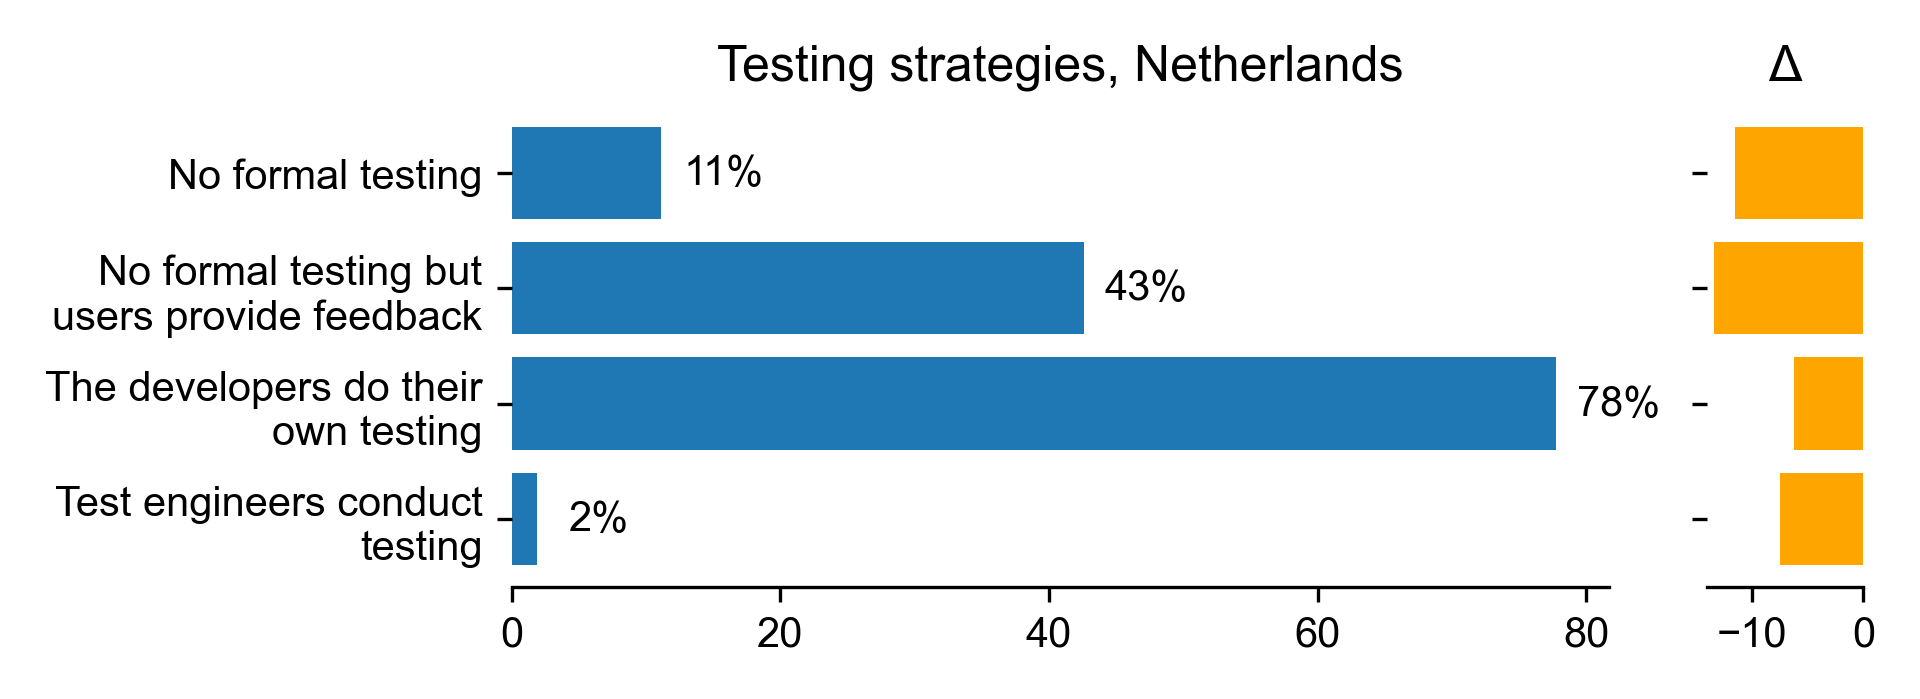
Testing strategies for Netherlands
Count
Percentage
Percentage in 2017
Difference with previous year
No formal testing
6
11.1111
22.6667
-11.5556
No formal testing but users provide feedback
23
42.5926
56
-13.4074
The developers do their own testing
42
77.7778
84
-6.22222
Test engineers conduct testing
1
1.85185
9.33333
-7.48148
Download CSV
2021-08-04T21:01:26.580261
image/svg+xml
Matplotlib v3.4.2, https://matplotlib.org/
0
20
40
60
80
Test engineers conduct
testing
The developers do their
own testing
No formal testing but
users provide feedback
No formal testing
2%
78%
43%
11%
Testing strategies, Netherlands
−10
0
Δ
PNG SVG
2021-08-04T21:01:27.937166
image/svg+xml
Matplotlib v3.4.2, https://matplotlib.org/
Repository, Netherlands
PNG SVG
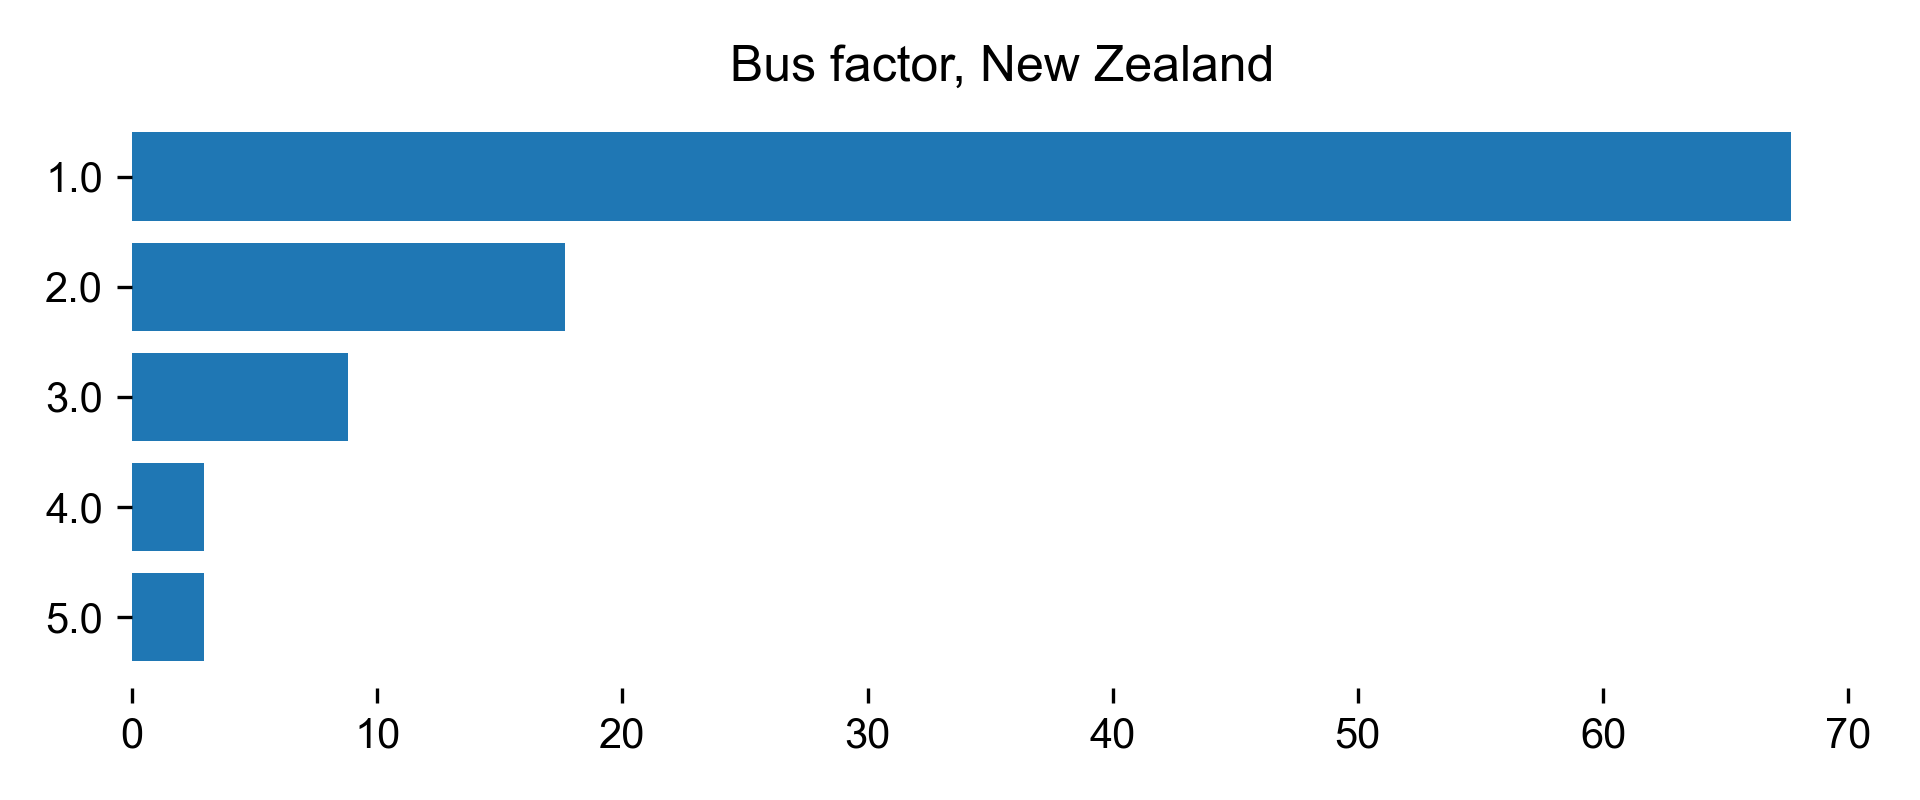
Bus factor for New Zealand
Count
Percentage
1
23
67.6471
2
6
17.6471
3
3
8.82353
4
1
2.94118
5
1
2.94118
Download CSV
2021-08-04T21:01:28.520177
image/svg+xml
Matplotlib v3.4.2, https://matplotlib.org/
0
10
20
30
40
50
60
70
5.0
4.0
3.0
2.0
1.0
Bus factor, New Zealand
PNG SVG
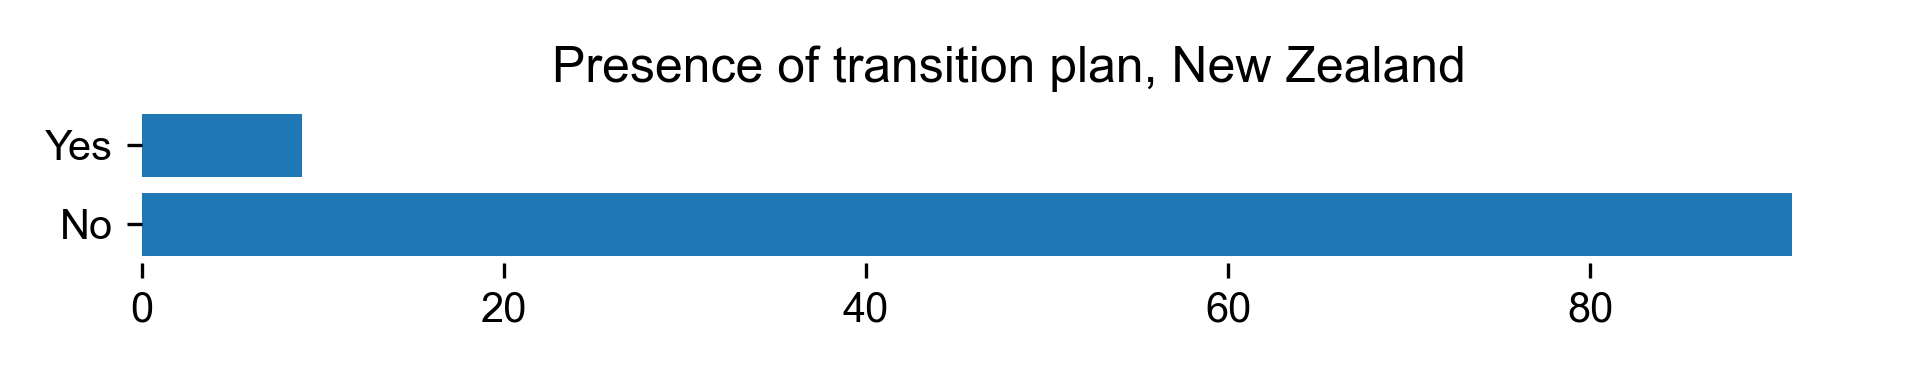
Presence of transition plan for New Zealand
Count
Percentage
Yes
3
8.82353
No
31
91.1765
Download CSV
2021-08-04T21:01:28.722503
image/svg+xml
Matplotlib v3.4.2, https://matplotlib.org/
0
20
40
60
80
No
Yes
Presence of transition plan, New Zealand
PNG SVG
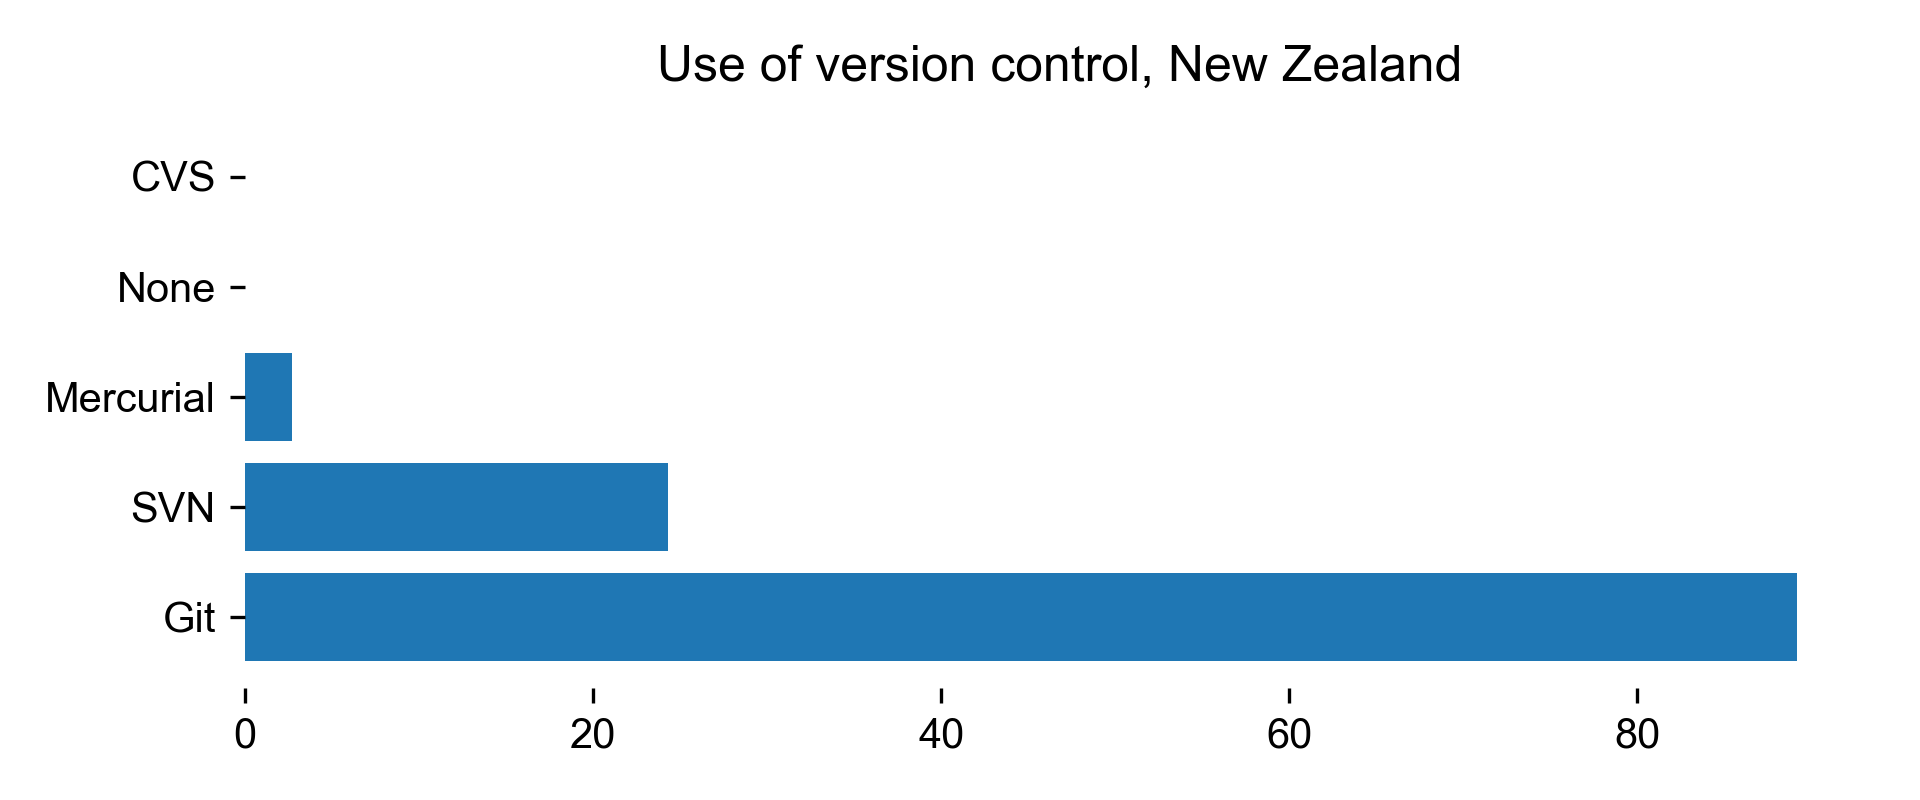
Use of version control for New Zealand
Count
Percentage
Git
33
89.1892
SVN
9
24.3243
Mercurial
1
2.7027
CVS
0
0
None
0
0
Download CSV
2021-08-04T21:01:28.979994
image/svg+xml
Matplotlib v3.4.2, https://matplotlib.org/
0
20
40
60
80
Git
SVN
Mercurial
None
CVS
Use of version control, New Zealand
PNG SVG
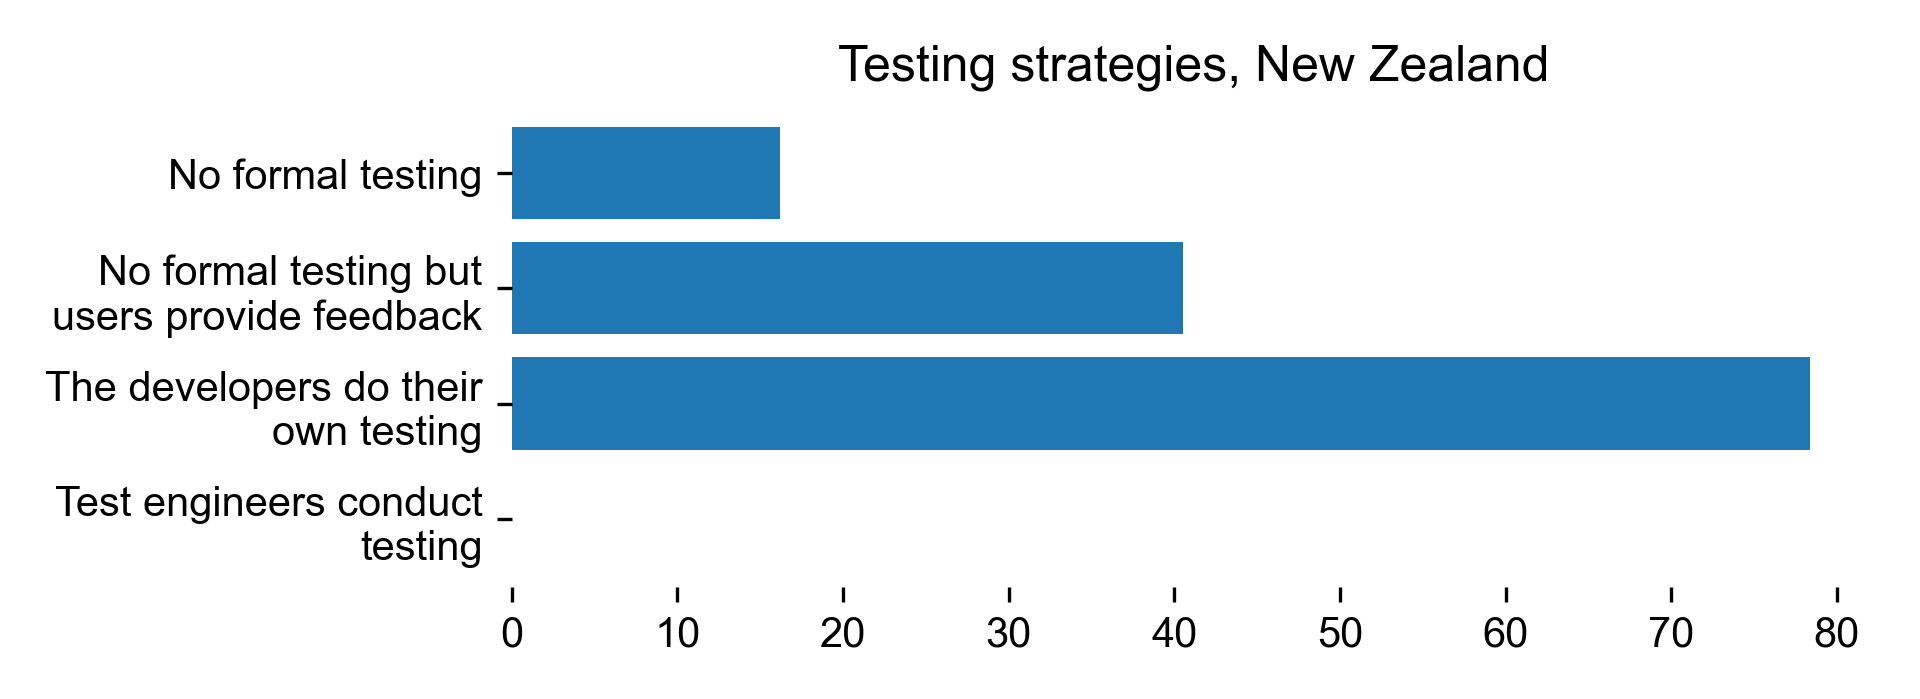
Testing strategies for New Zealand
Count
Percentage
No formal testing
6
16.2162
No formal testing but users provide feedback
15
40.5405
The developers do their own testing
29
78.3784
Test engineers conduct testing
0
0
Download CSV
2021-08-04T21:01:29.261872
image/svg+xml
Matplotlib v3.4.2, https://matplotlib.org/
0
10
20
30
40
50
60
70
80
Test engineers conduct
testing
The developers do their
own testing
No formal testing but
users provide feedback
No formal testing
Testing strategies, New Zealand
PNG SVG
2021-08-04T21:01:30.380468
image/svg+xml
Matplotlib v3.4.2, https://matplotlib.org/
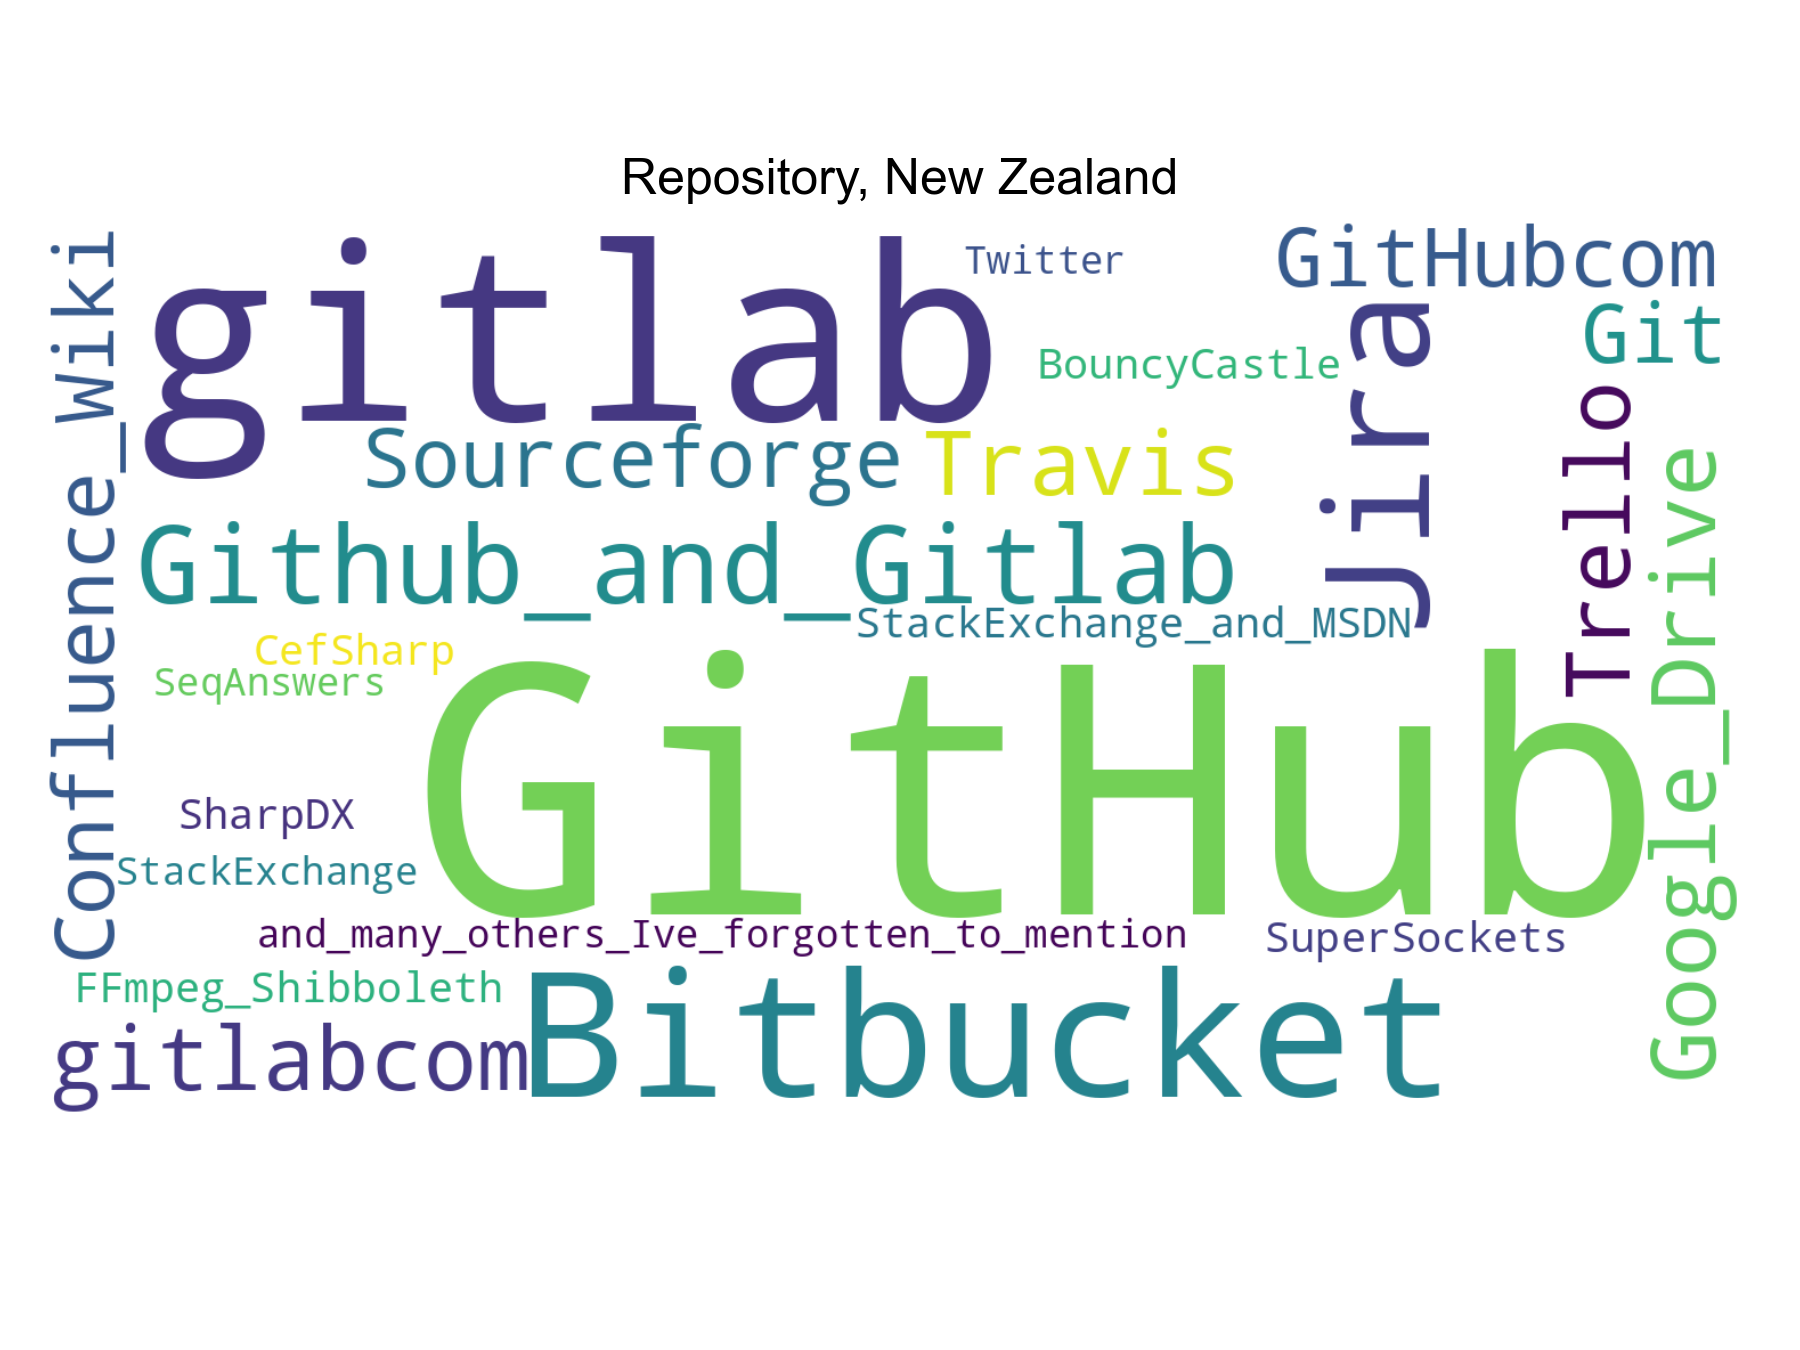
Repository, New Zealand
PNG SVG
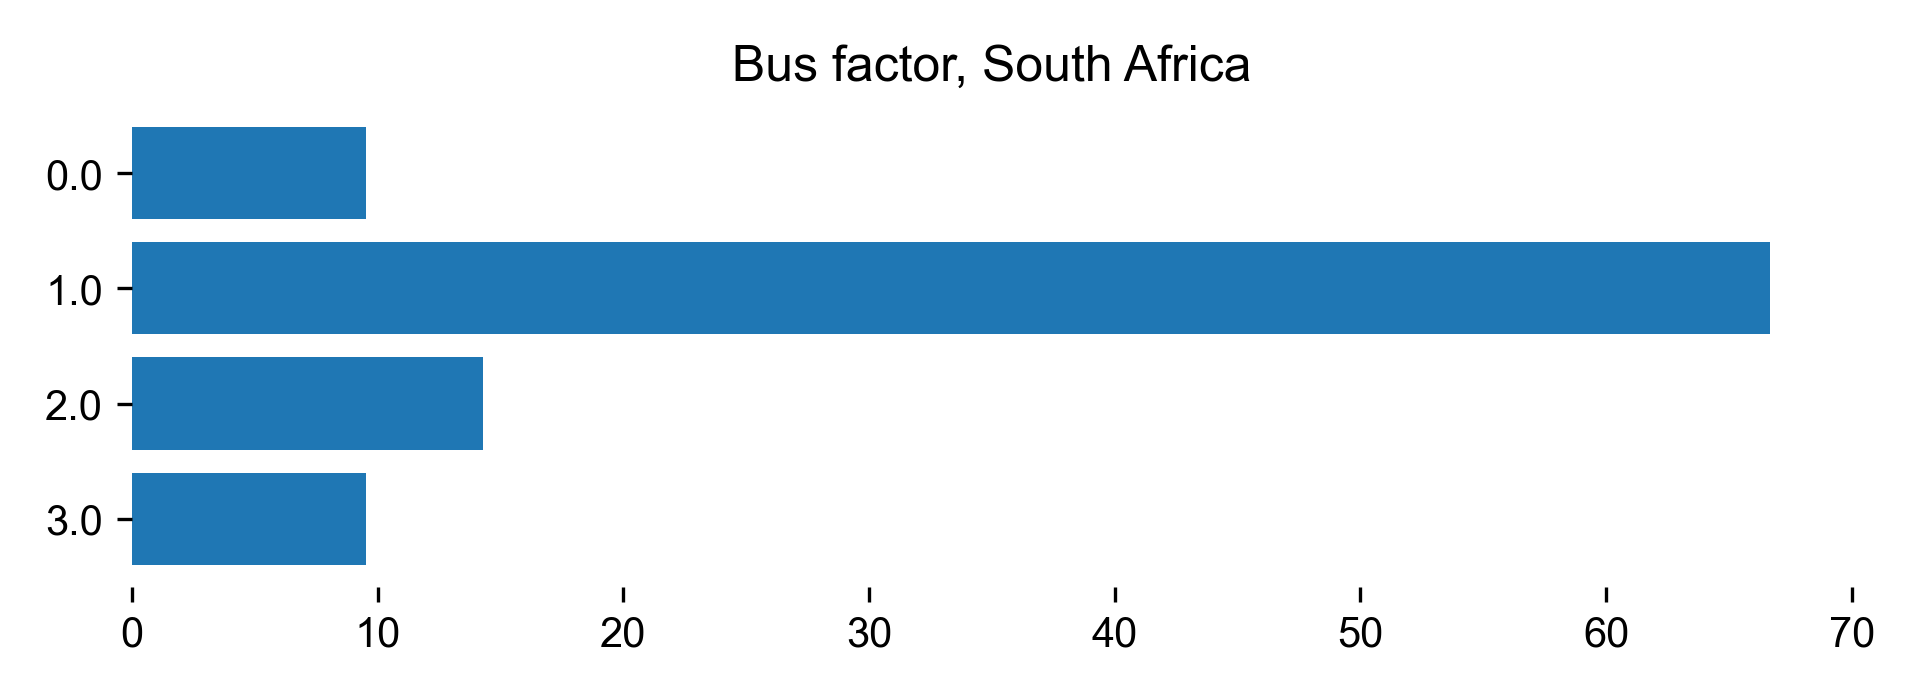
Bus factor for South Africa
Count
Percentage
0
2
9.52381
1
14
66.6667
2
3
14.2857
3
2
9.52381
Download CSV
2021-08-04T21:01:30.939284
image/svg+xml
Matplotlib v3.4.2, https://matplotlib.org/
0
10
20
30
40
50
60
70
3.0
2.0
1.0
0.0
Bus factor, South Africa
PNG SVG
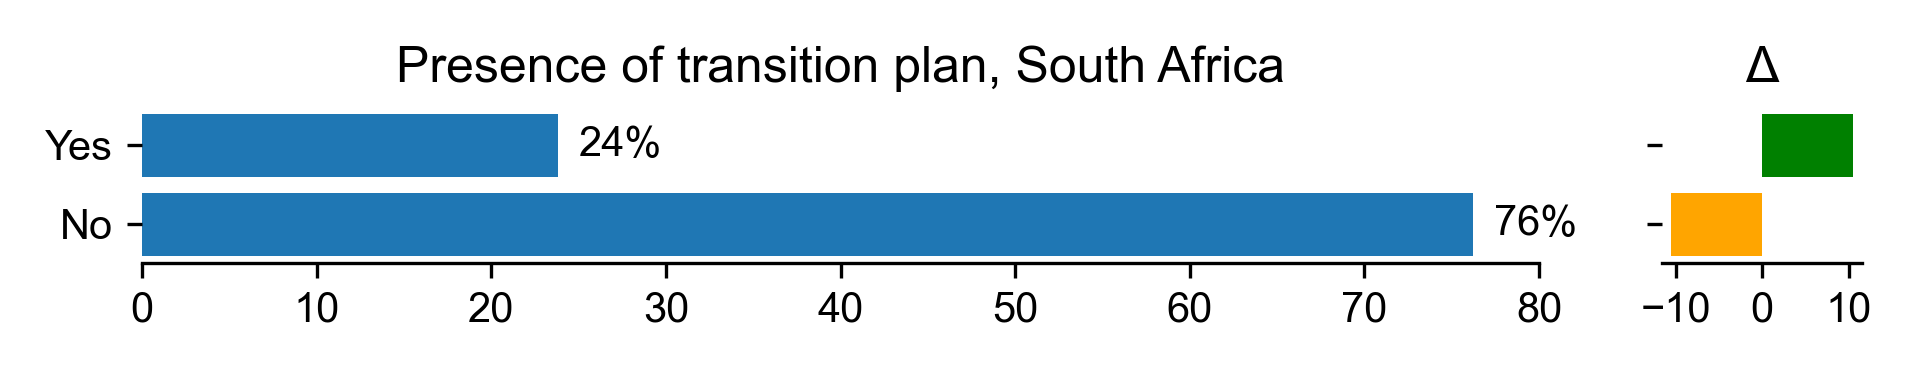
Presence of transition plan for South Africa
Count
Percentage
Percentage in 2017
Difference with previous year
Yes
5
23.8095
13.3333
10.4762
No
16
76.1905
86.6667
-10.4762
Download CSV
2021-08-04T21:01:31.178008
image/svg+xml
Matplotlib v3.4.2, https://matplotlib.org/
0
10
20
30
40
50
60
70
80
No
Yes
76%
24%
Presence of transition plan, South Africa
−10
0
10
Δ
PNG SVG
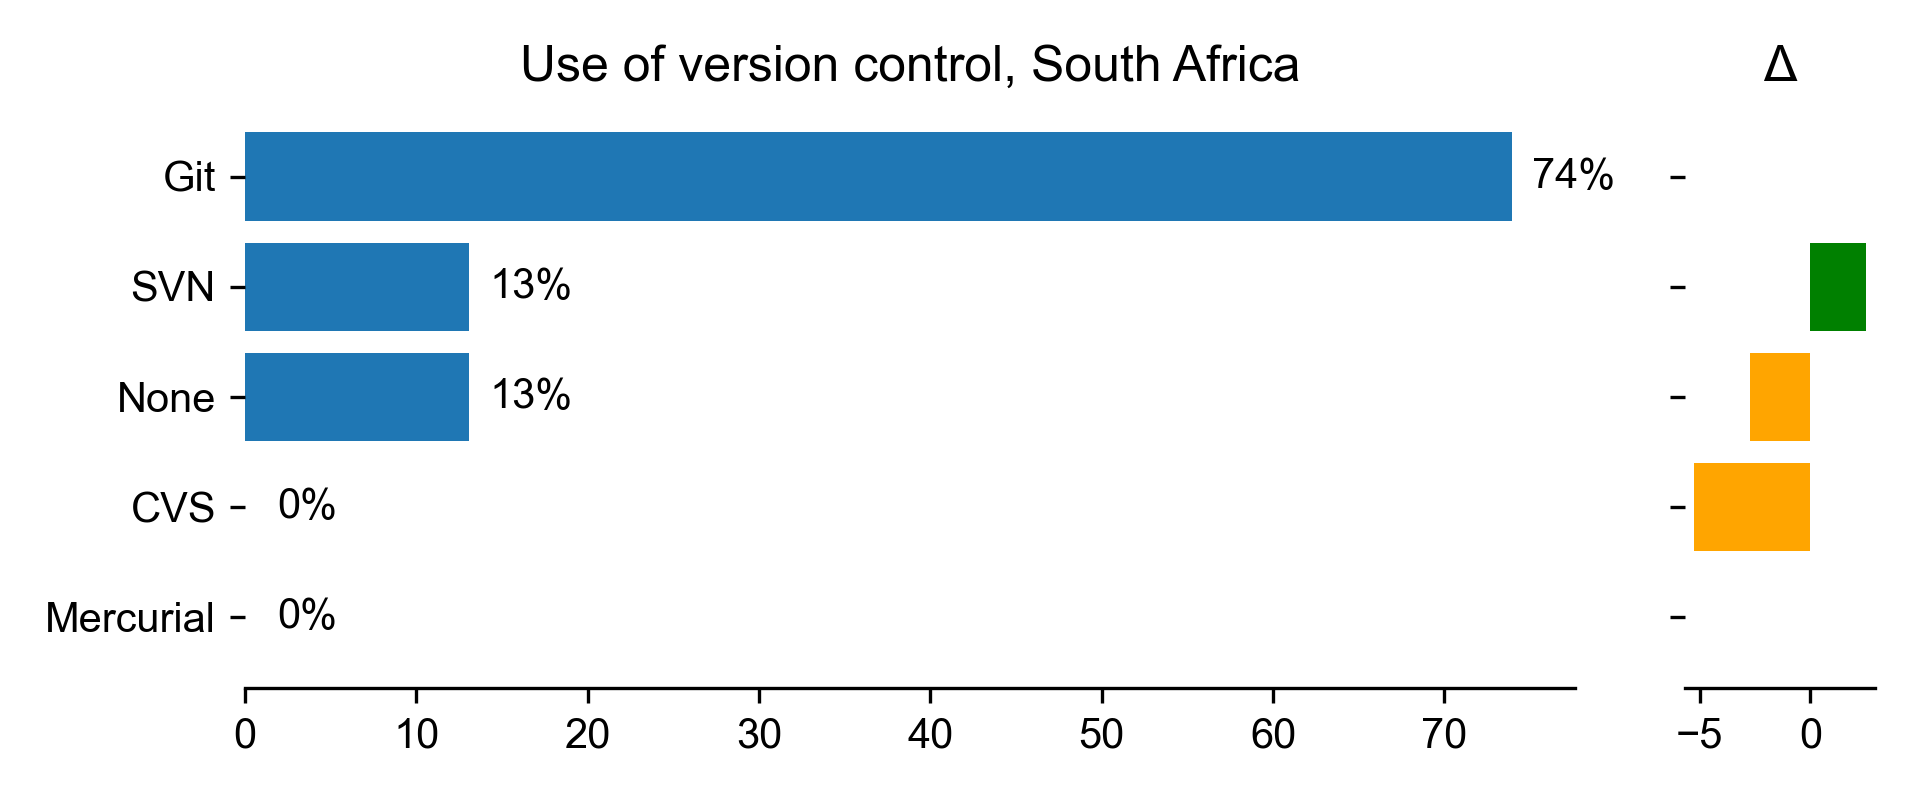
Use of version control for South Africa
Count
Percentage
Percentage in 2017
Difference with previous year
Git
17
73.913
nan
nan
SVN
3
13.0435
10.5263
2.51716
None
3
13.0435
15.7895
-2.746
CVS
0
0
5.26316
-5.26316
Mercurial
0
0
0
0
Download CSV
2021-08-04T21:01:31.541206
image/svg+xml
Matplotlib v3.4.2, https://matplotlib.org/
0
10
20
30
40
50
60
70
Mercurial
CVS
None
SVN
Git
0%
0%
13%
13%
74%
Use of version control, South Africa
−5
0
Δ
PNG SVG
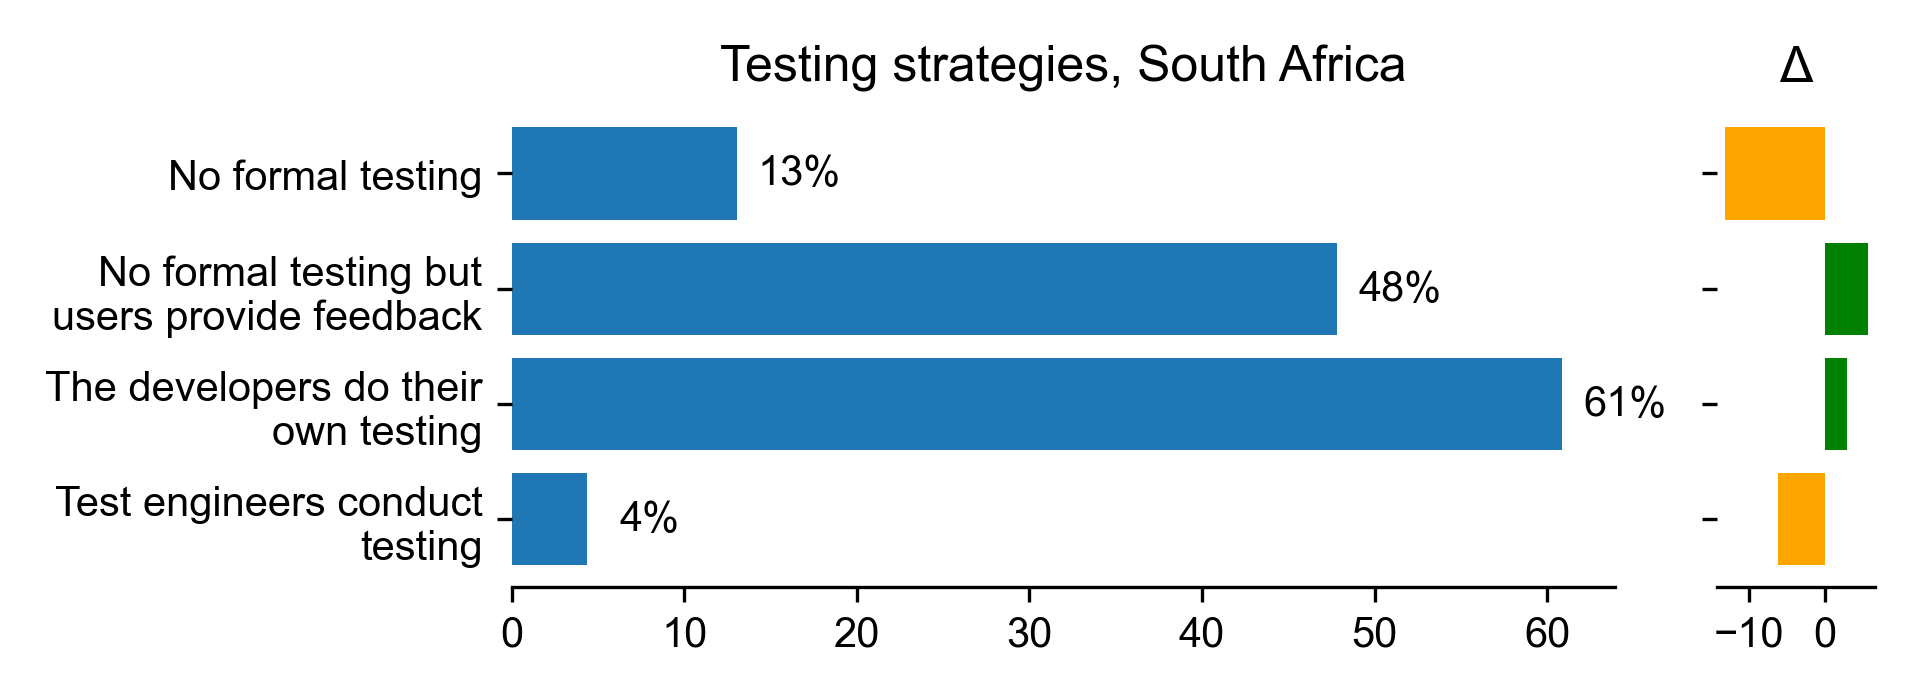
Testing strategies for South Africa
Count
Percentage
Percentage in 2017
Difference with previous year
No formal testing
3
13.0435
26.3158
-13.2723
No formal testing but users provide feedback
11
47.8261
42.1053
5.72082
The developers do their own testing
14
60.8696
57.8947
2.97483
Test engineers conduct testing
1
4.34783
10.5263
-6.17849
Download CSV
2021-08-04T21:01:31.907609
image/svg+xml
Matplotlib v3.4.2, https://matplotlib.org/
0
10
20
30
40
50
60
Test engineers conduct
testing
The developers do their
own testing
No formal testing but
users provide feedback
No formal testing
4%
61%
48%
13%
Testing strategies, South Africa
−10
0
Δ
PNG SVG
2021-08-04T21:01:33.205478
image/svg+xml
Matplotlib v3.4.2, https://matplotlib.org/
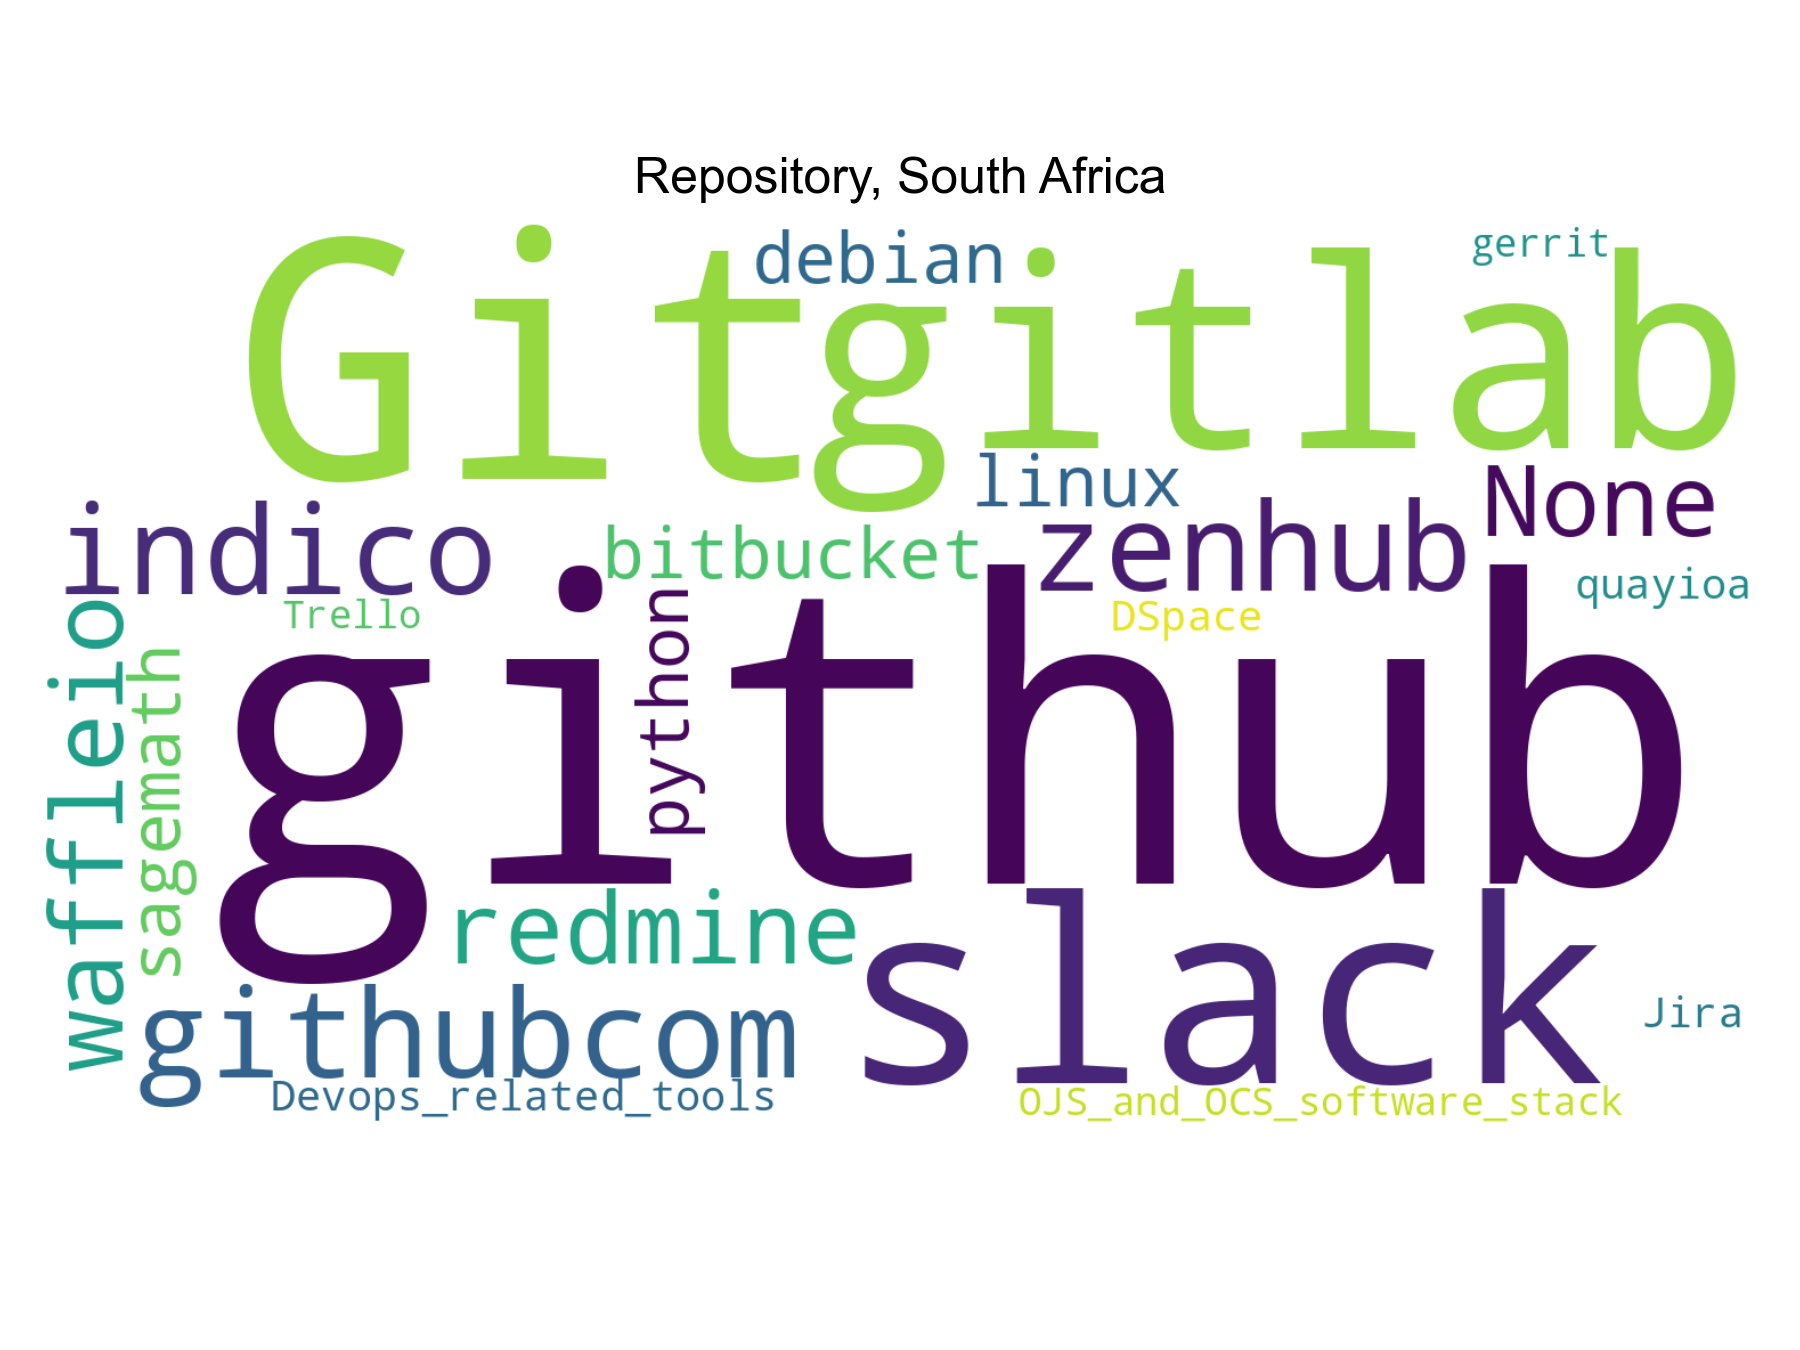
Repository, South Africa
PNG SVG
Bus factor for United Kingdom
Count
Percentage
0
5
2.33645
1
82
38.3178
2
77
35.9813
3
21
9.81308
4
14
6.54206
5
4
1.86916
6
3
1.40187
7
3
1.40187
8
1
0.46729
9
1
0.46729
10
1
0.46729
11
1
0.46729
700
1
0.46729
Download CSV
2021-08-04T21:01:33.960209
image/svg+xml
Matplotlib v3.4.2, https://matplotlib.org/
0
5
10
15
20
25
30
35
40
700.0
11.0
10.0
9.0
8.0
7.0
6.0
5.0
4.0
3.0
2.0
1.0
0.0
Bus factor, United Kingdom
PNG SVG
Presence of transition plan for United Kingdom
Count
Percentage
Percentage in 2017
Difference with previous year
Yes
52
24.2991
25.3275
-1.02845
No
162
75.7009
74.6725
1.02845
Download CSV
2021-08-04T21:01:34.254390
image/svg+xml
Matplotlib v3.4.2, https://matplotlib.org/
0
10
20
30
40
50
60
70
No
Yes
76%
24%
Presence of transition plan, United Kingdom
−1
0
1
Δ
PNG SVG
Use of version control for United Kingdom
Count
Percentage
Git
199
84.322
SVN
53
22.4576
Mercurial
23
9.74576
CVS
11
4.66102
None
4
1.69492
Download CSV
2021-08-04T21:01:34.701869
image/svg+xml
Matplotlib v3.4.2, https://matplotlib.org/
0
10
20
30
40
50
60
70
80
Git
SVN
Mercurial
CVS
None
Use of version control, United Kingdom
PNG SVG
Testing strategies for United Kingdom
Count
Percentage
Percentage in 2017
Difference with previous year
No formal testing
18
7.62712
15.0407
-7.41353
No formal testing but users provide feedback
53
22.4576
38.2114
-15.7538
The developers do their own testing
192
81.3559
80.4878
0.868127
Test engineers conduct testing
7
2.9661
7.31707
-4.35097
Download CSV
2021-08-04T21:01:35.053652
image/svg+xml
Matplotlib v3.4.2, https://matplotlib.org/
0
20
40
60
80
Test engineers conduct
testing
The developers do their
own testing
No formal testing but
users provide feedback
No formal testing
3%
81%
22%
8%
Testing strategies, United Kingdom
−10
0
Δ
PNG SVG
2021-08-04T21:01:36.769394
image/svg+xml
Matplotlib v3.4.2, https://matplotlib.org/
Repository, United Kingdom
PNG SVG
Bus factor for United States
Count
Percentage
0
2
1.44928
1
73
52.8986
2
39
28.2609
3
13
9.42029
4
8
5.7971
5
1
0.724638
7
1
0.724638
20
1
0.724638
Download CSV
2021-08-04T21:01:37.459847
image/svg+xml
Matplotlib v3.4.2, https://matplotlib.org/
0
10
20
30
40
50
20.0
7.0
5.0
4.0
3.0
2.0
1.0
0.0
Bus factor, United States
PNG SVG
Presence of transition plan for United States
Count
Percentage
Percentage in 2017
Difference with previous year
Yes
28
20.2899
18.2482
2.04168
No
110
79.7101
81.7518
-2.04168
Download CSV
2021-08-04T21:01:37.733010
image/svg+xml
Matplotlib v3.4.2, https://matplotlib.org/
0
10
20
30
40
50
60
70
80
No
Yes
80%
20%
Presence of transition plan, United States
−2
0
2
Δ
PNG SVG
Use of version control for United States
Count
Percentage
Git
134
91.1565
SVN
22
14.966
CVS
9
6.12245
Mercurial
6
4.08163
None
5
3.40136
Download CSV
2021-08-04T21:01:38.089889
image/svg+xml
Matplotlib v3.4.2, https://matplotlib.org/
0
20
40
60
80
Git
SVN
CVS
Mercurial
None
Use of version control, United States
PNG SVG
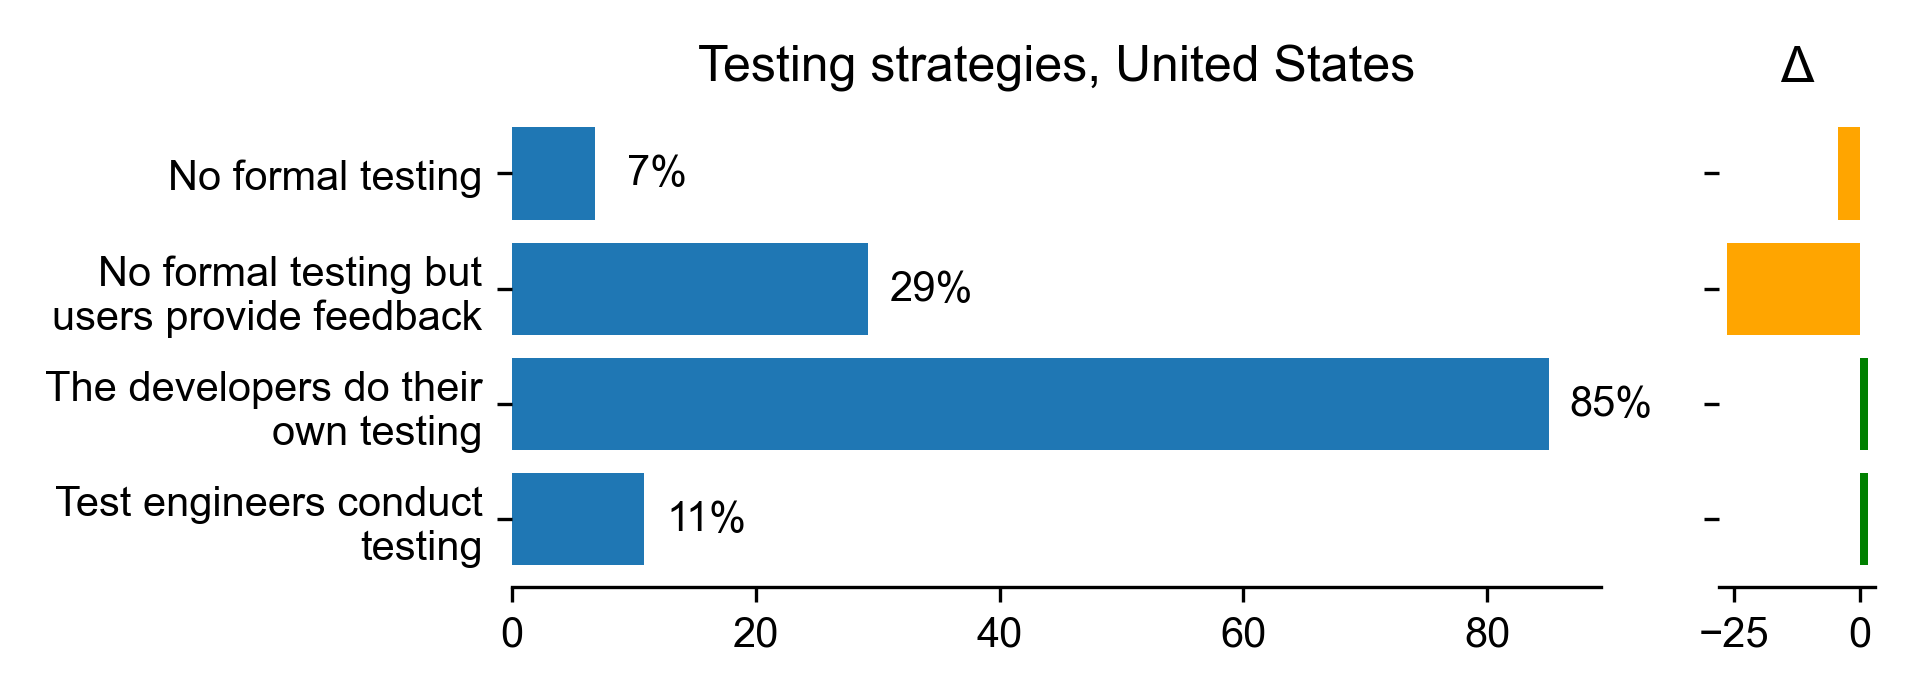
Testing strategies for United States
Count
Percentage
Percentage in 2017
Difference with previous year
No formal testing
10
6.80272
11.0429
-4.24022
No formal testing but users provide feedback
43
29.2517
55.8282
-26.5765
The developers do their own testing
125
85.034
83.4356
1.59843
Test engineers conduct testing
16
10.8844
9.20245
1.6819
Download CSV
2021-08-04T21:01:38.435847
image/svg+xml
Matplotlib v3.4.2, https://matplotlib.org/
0
20
40
60
80
Test engineers conduct
testing
The developers do their
own testing
No formal testing but
users provide feedback
No formal testing
11%
85%
29%
7%
Testing strategies, United States
−25
0
Δ
PNG SVG
2021-08-04T21:01:39.928485
image/svg+xml
Matplotlib v3.4.2, https://matplotlib.org/
Repository, United States
PNG SVG
Bus factor for World
Count
Percentage
0
3
7.31707
1
18
43.9024
2
12
29.2683
3
6
14.6341
5
1
2.43902
6
1
2.43902
Download CSV
2021-08-04T21:01:40.533188
image/svg+xml
Matplotlib v3.4.2, https://matplotlib.org/
0
10
20
30
40
6.0
5.0
3.0
2.0
1.0
0.0
Bus factor, World
PNG SVG
Presence of transition plan for World
Count
Percentage
Yes
6
14.6341
No
35
85.3659
Download CSV
2021-08-04T21:01:40.751999
image/svg+xml
Matplotlib v3.4.2, https://matplotlib.org/
0
10
20
30
40
50
60
70
80
No
Yes
Presence of transition plan, World
PNG SVG
Use of version control for World
Count
Percentage
Git
38
69.0909
SVN
7
12.7273
Mercurial
3
5.45455
None
2
3.63636
CVS
0
0
Download CSV
2021-08-04T21:01:41.043330
image/svg+xml
Matplotlib v3.4.2, https://matplotlib.org/
0
10
20
30
40
50
60
70
Git
SVN
Mercurial
None
CVS
Use of version control, World
PNG SVG
Testing strategies for World
Count
Percentage
No formal testing
6
10.9091
No formal testing but users provide feedback
14
25.4545
The developers do their own testing
35
63.6364
Test engineers conduct testing
4
7.27273
Download CSV
2021-08-04T21:01:41.433382
image/svg+xml
Matplotlib v3.4.2, https://matplotlib.org/
0
10
20
30
40
50
60
Test engineers conduct
testing
The developers do their
own testing
No formal testing but
users provide feedback
No formal testing
Testing strategies, World
PNG SVG
2021-08-04T21:01:42.577078
image/svg+xml
Matplotlib v3.4.2, https://matplotlib.org/
Repository, World
PNG SVG