Collaboration and training
- Australia
- Germany
- Netherlands
- New Zealand
- South Africa
- United Kingdom
- United States
- World
Questions in this section:
- Who uses the code that you write? (one choice)
- Do you always work with the same researchers, or do you regularly change the
researchers you work with? (one choice)
- Are you part of a dedicated research software group within your institution?
(yes-no)
- How many software projects are you currently involved in? (numeric)
- How many software developers typically work on your projects? (numeric)
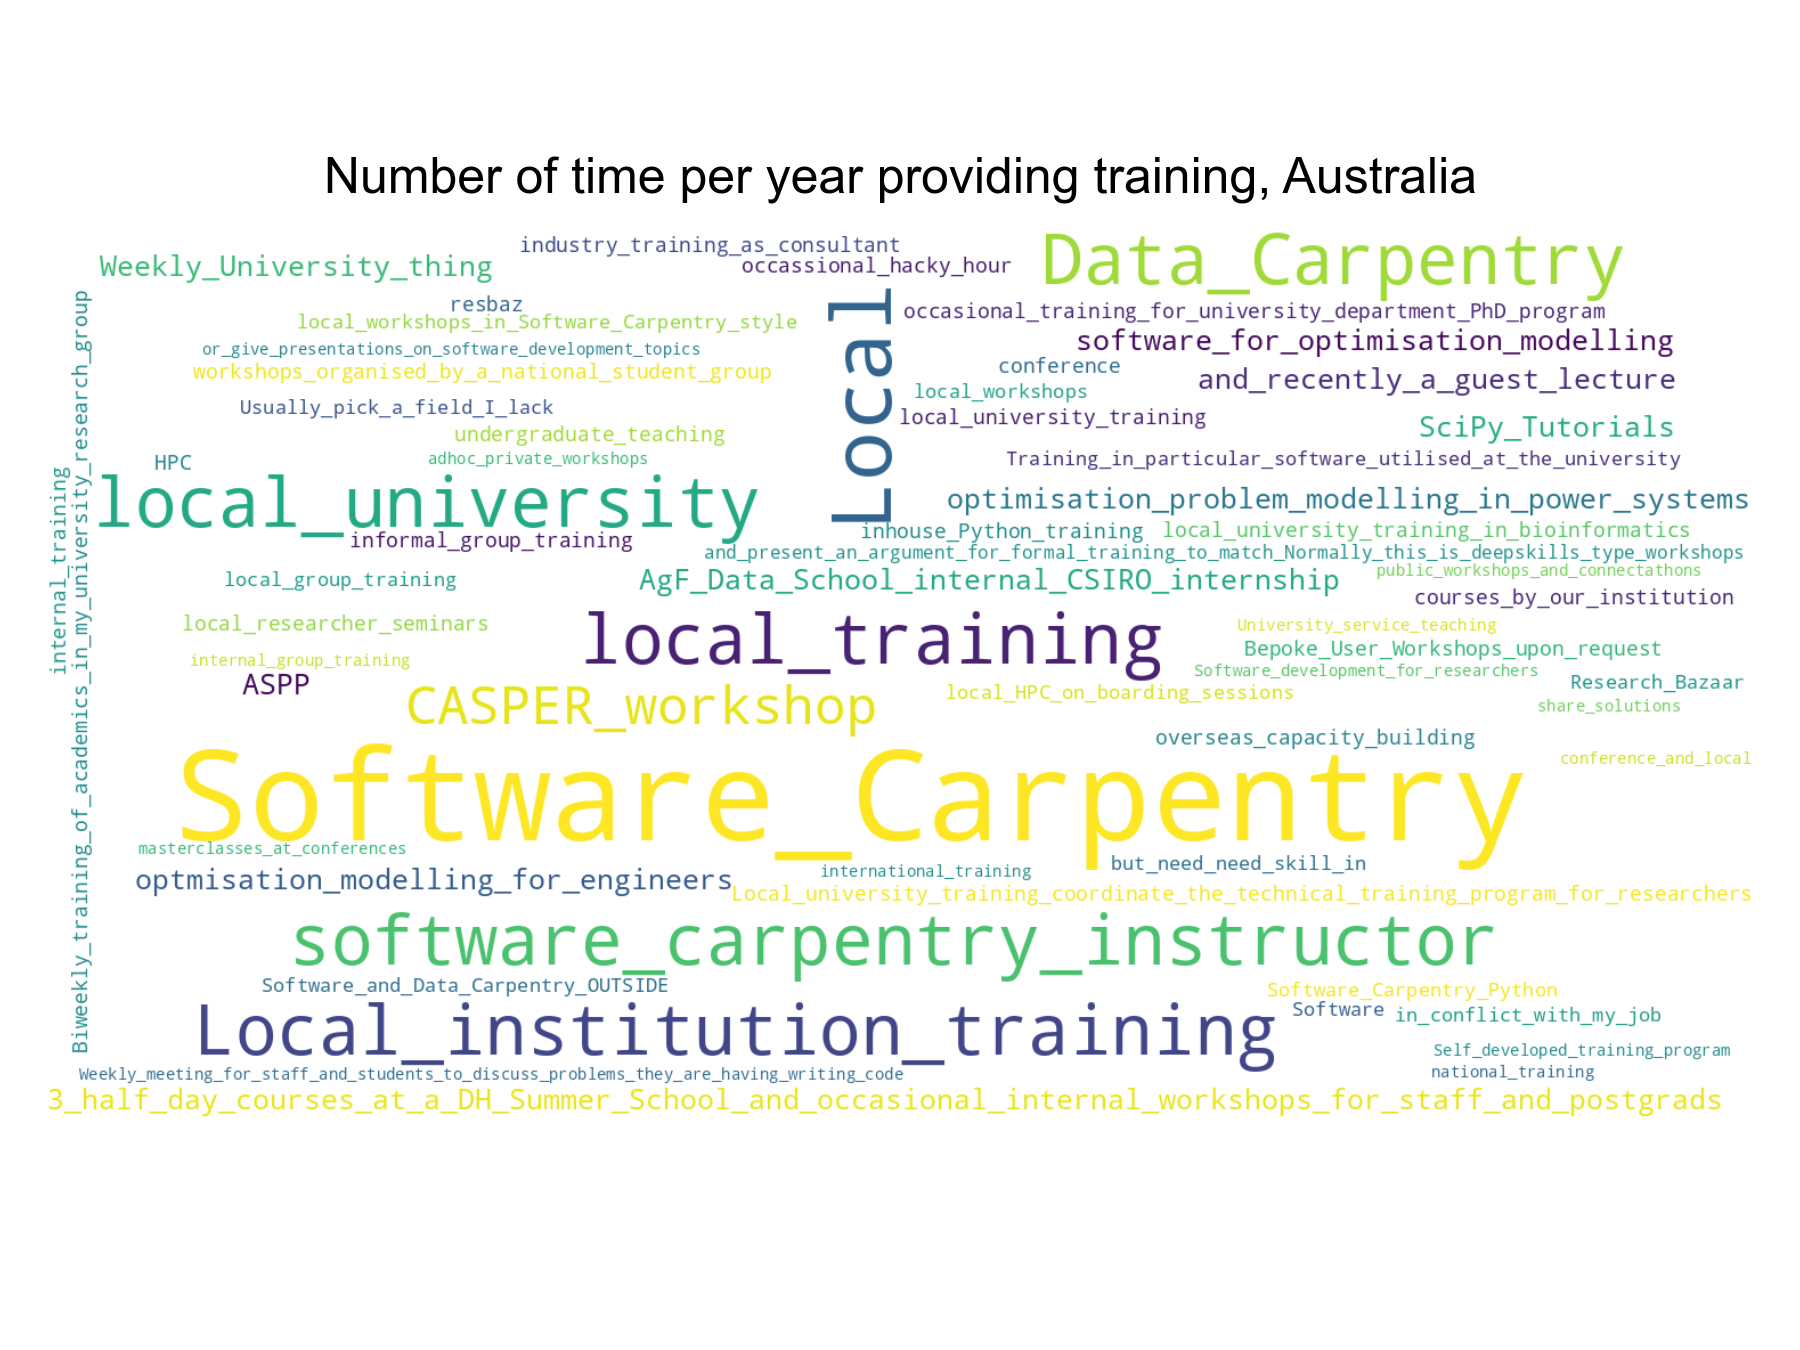
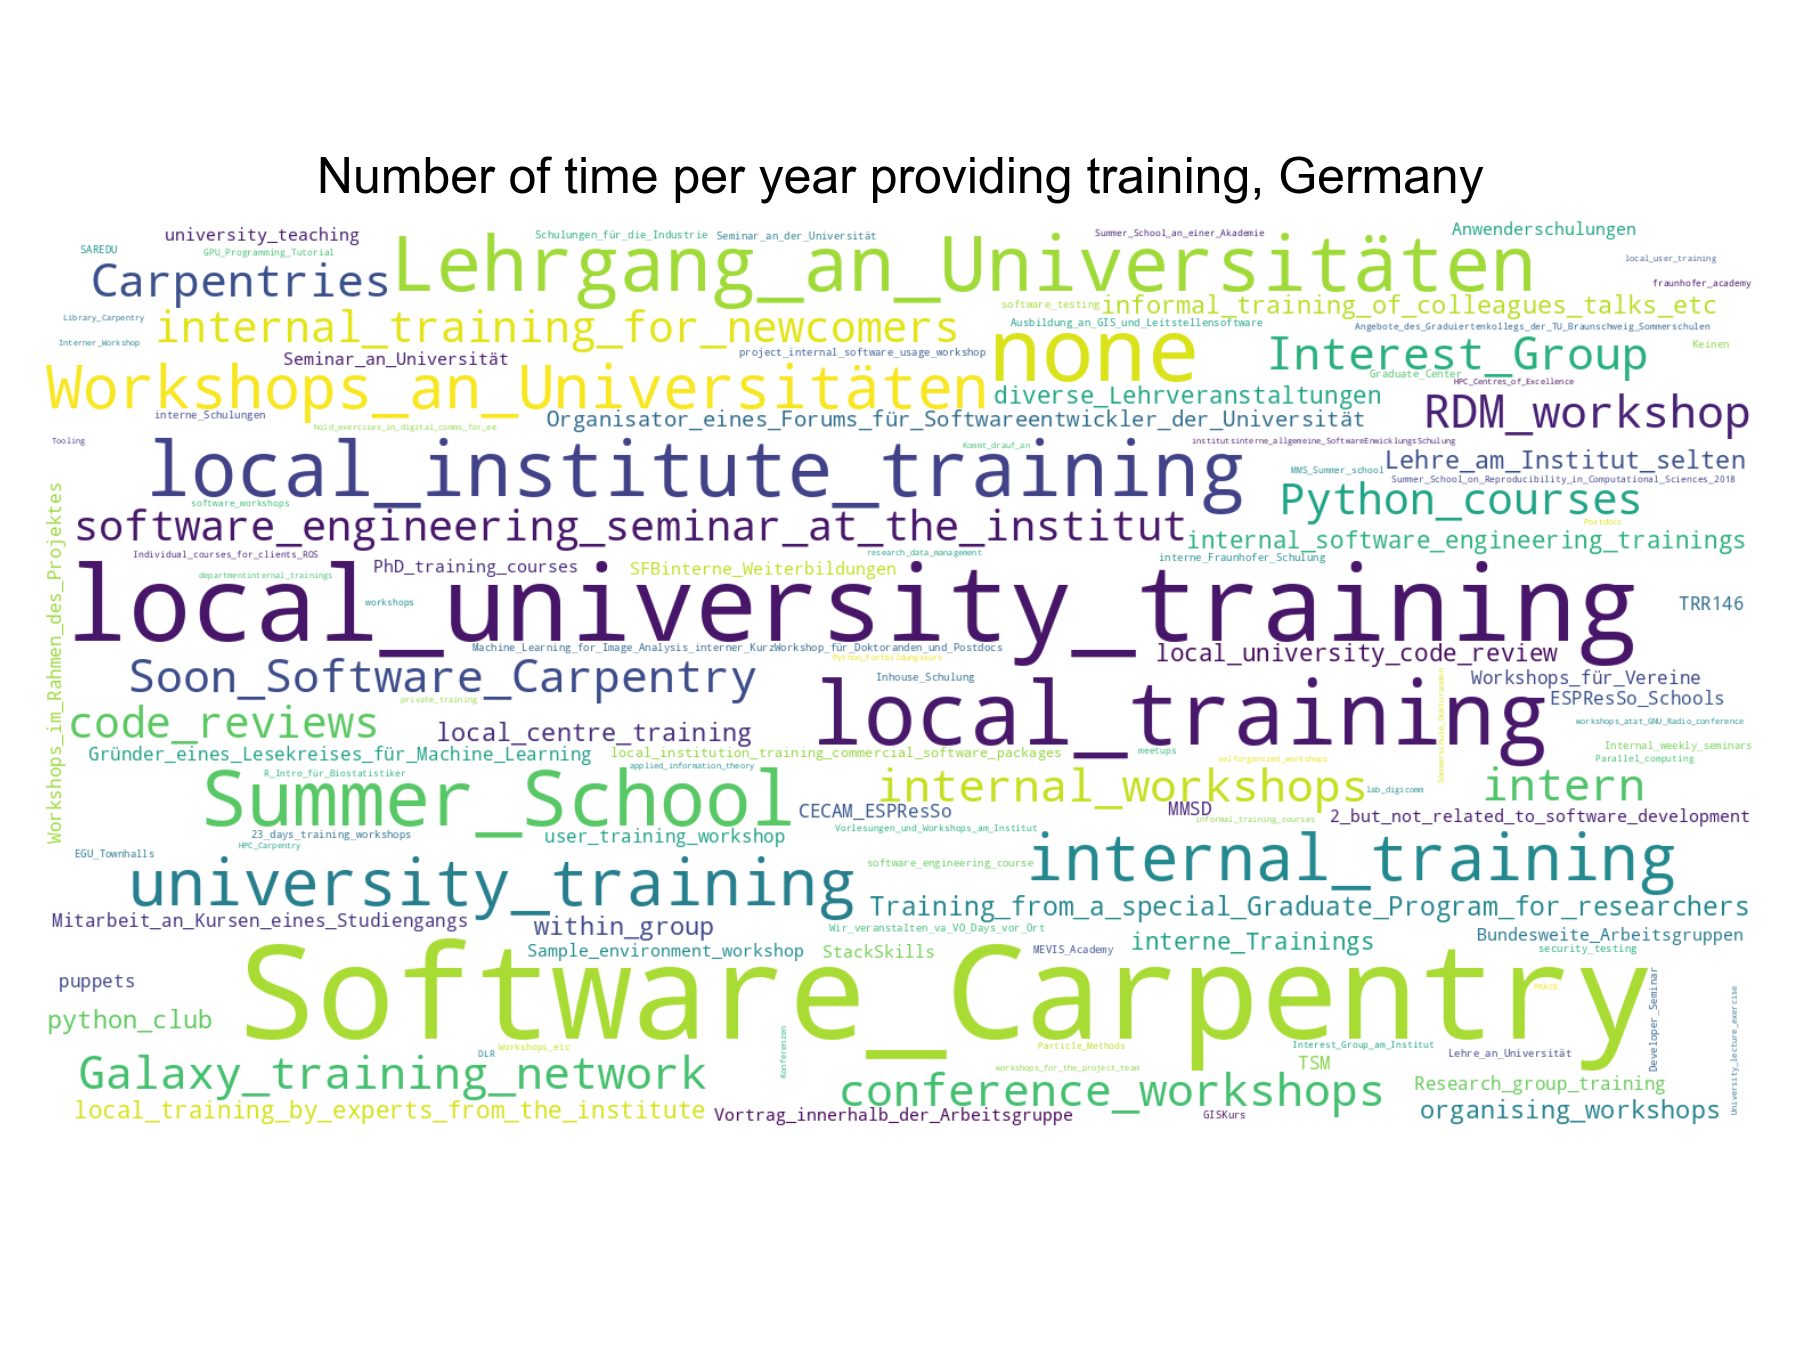
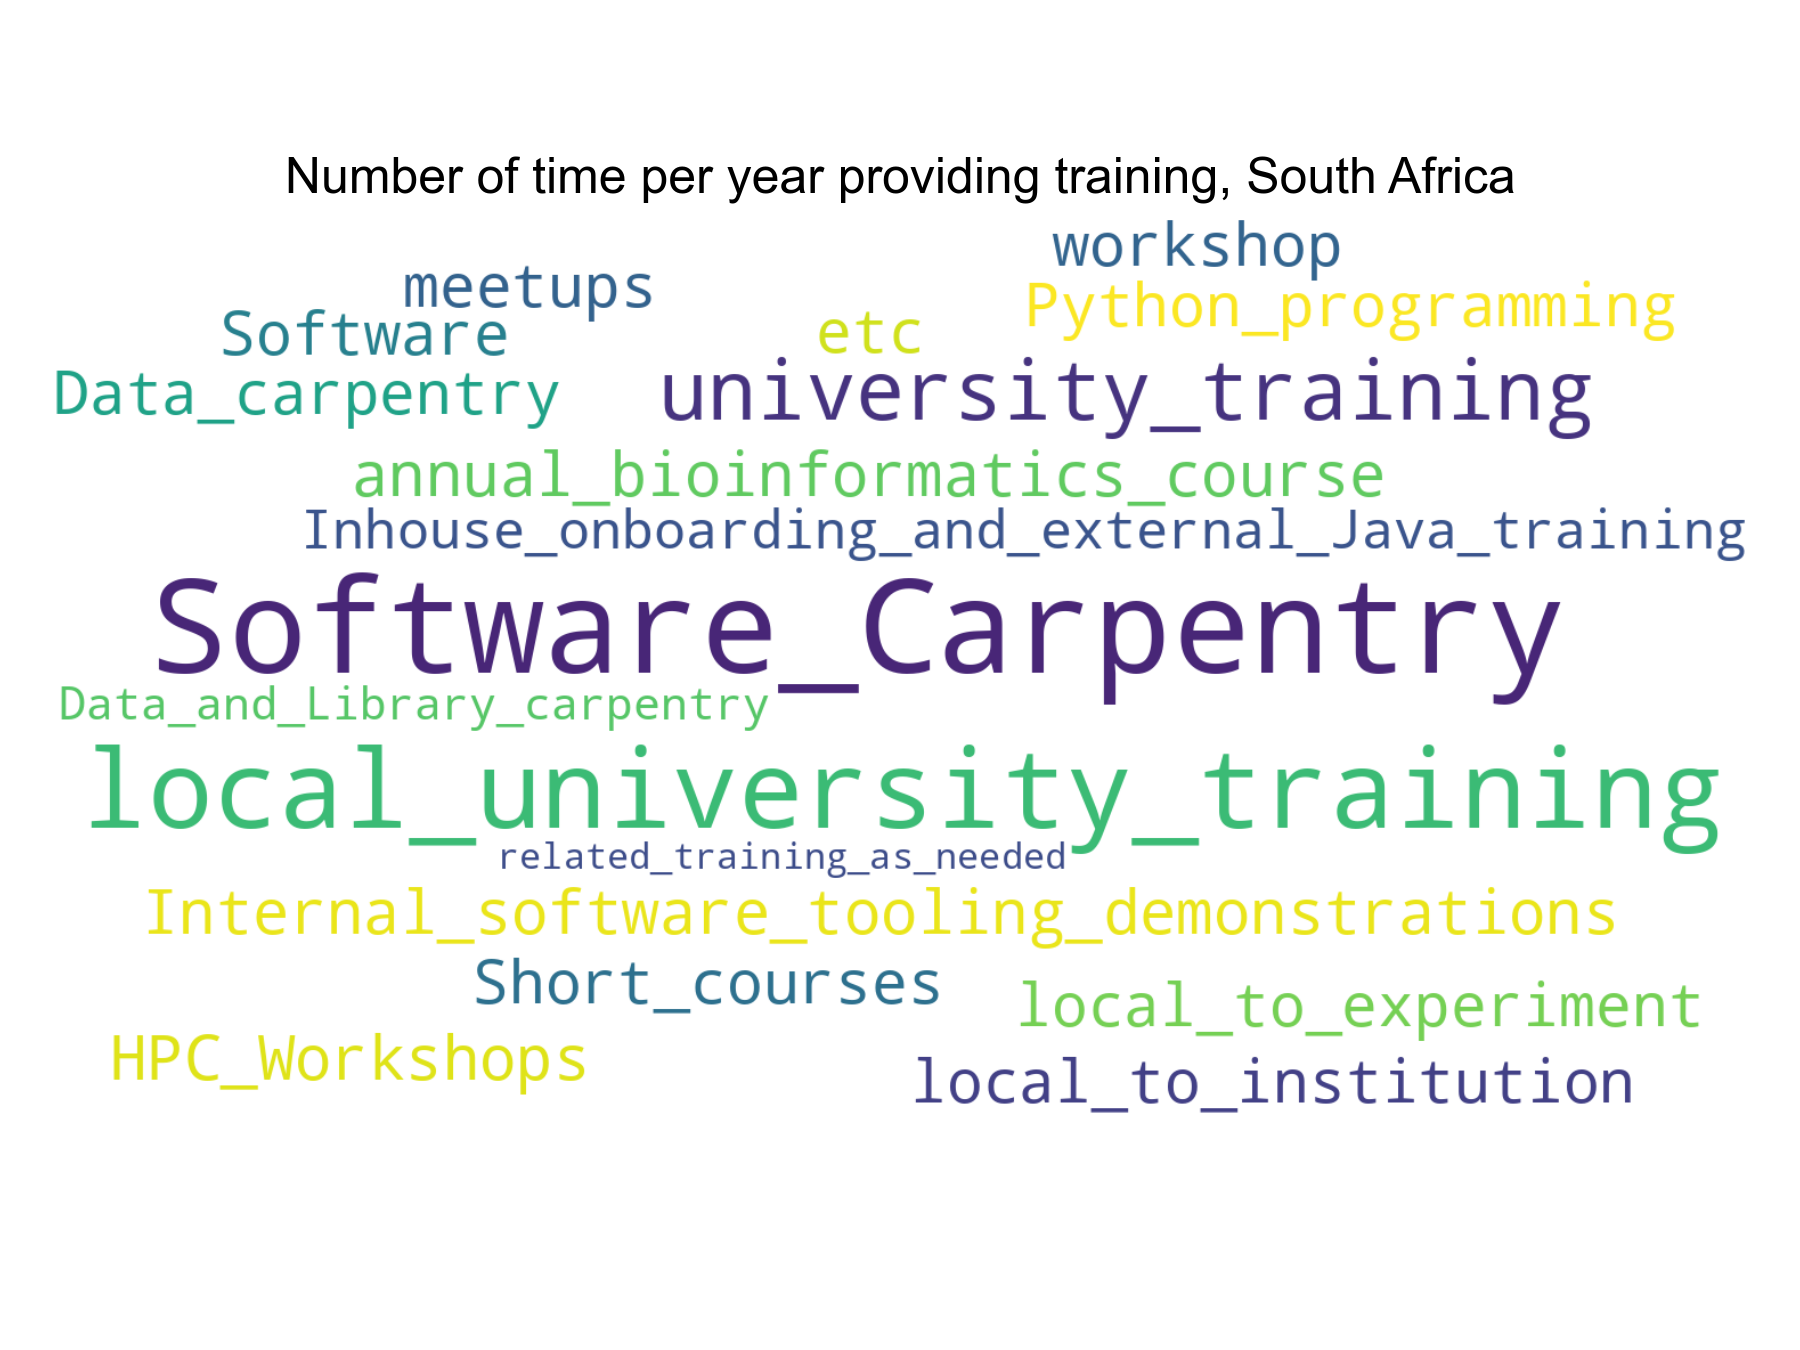
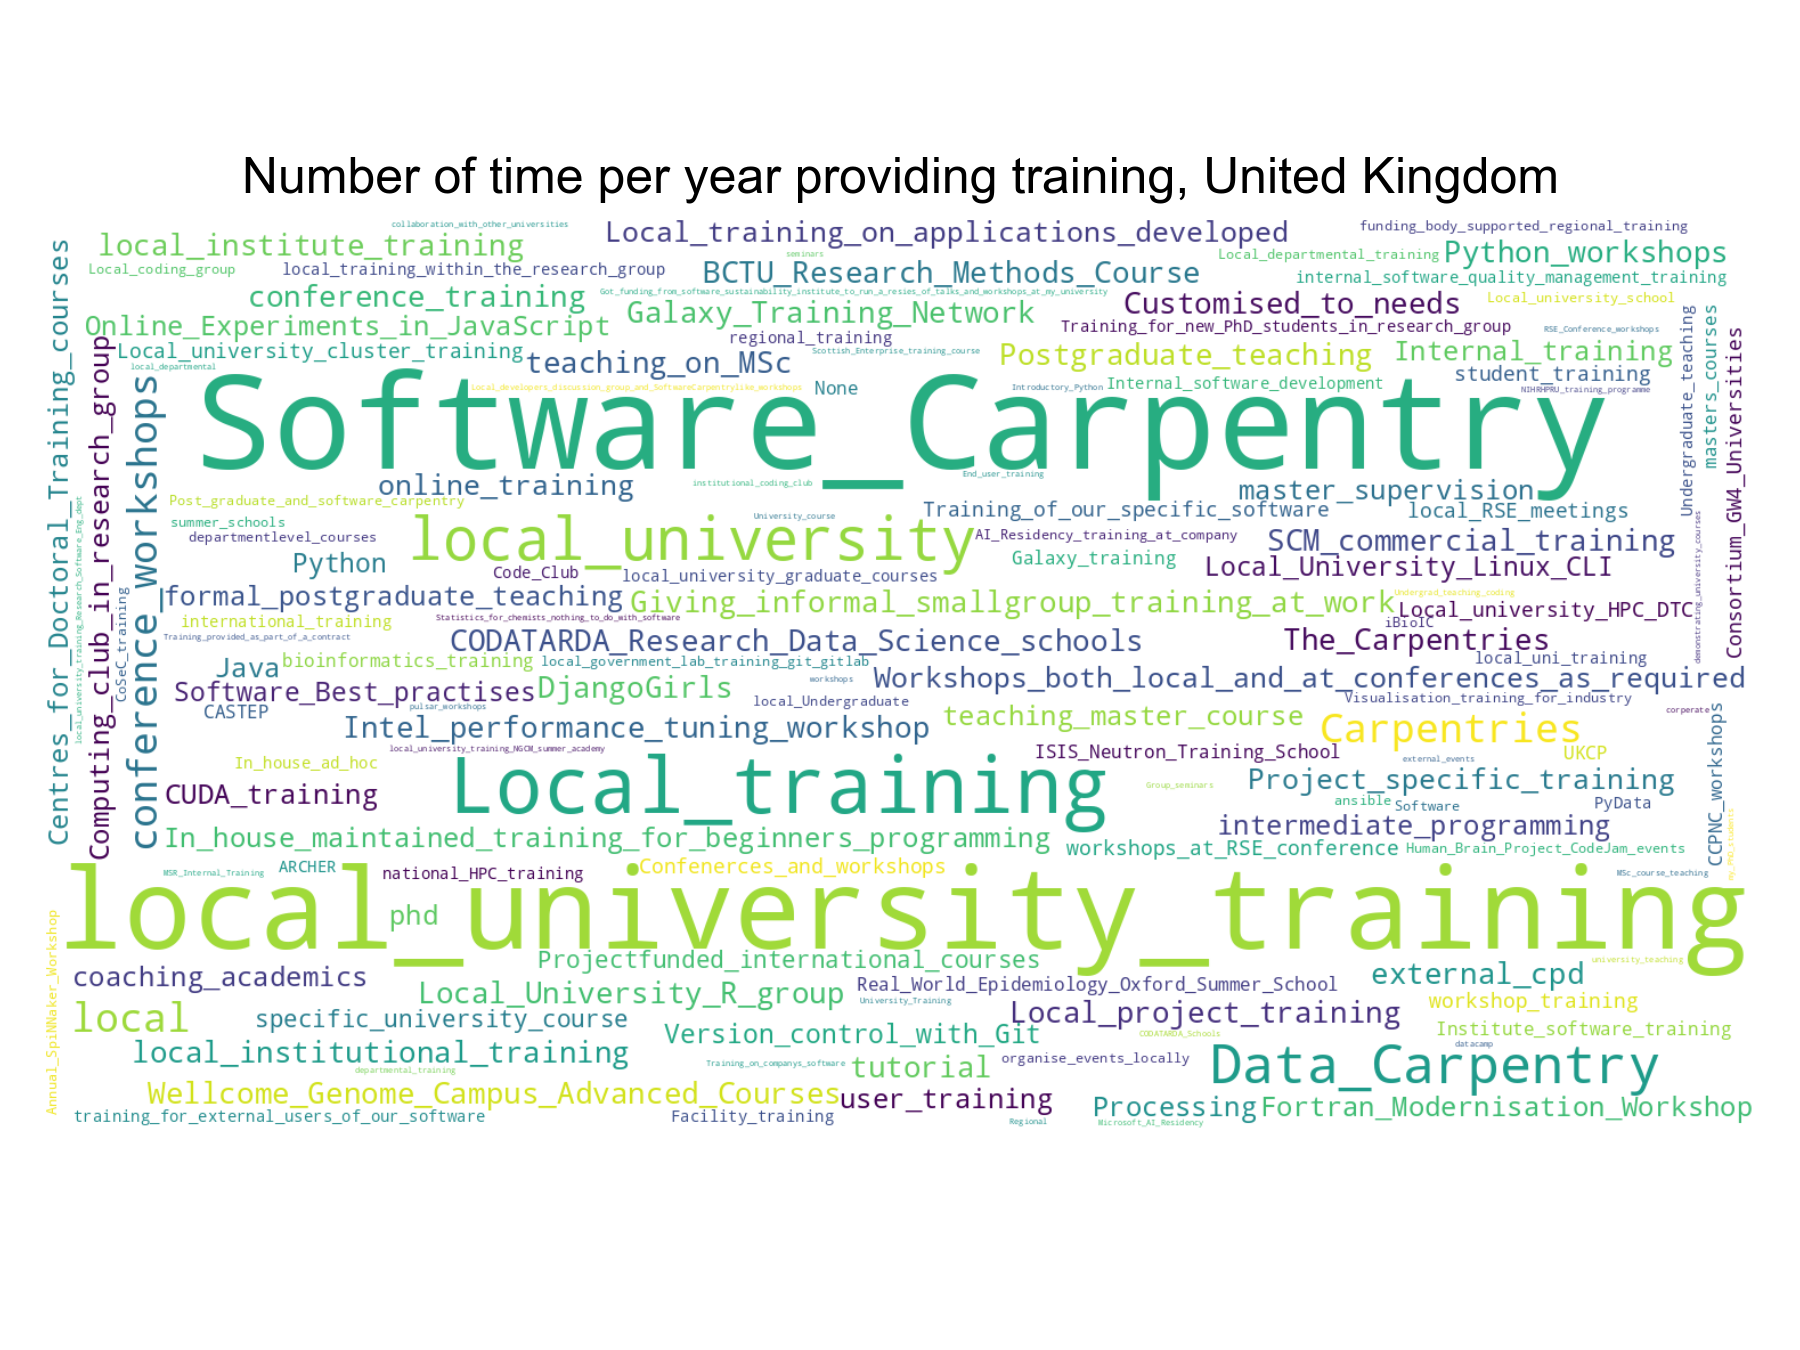
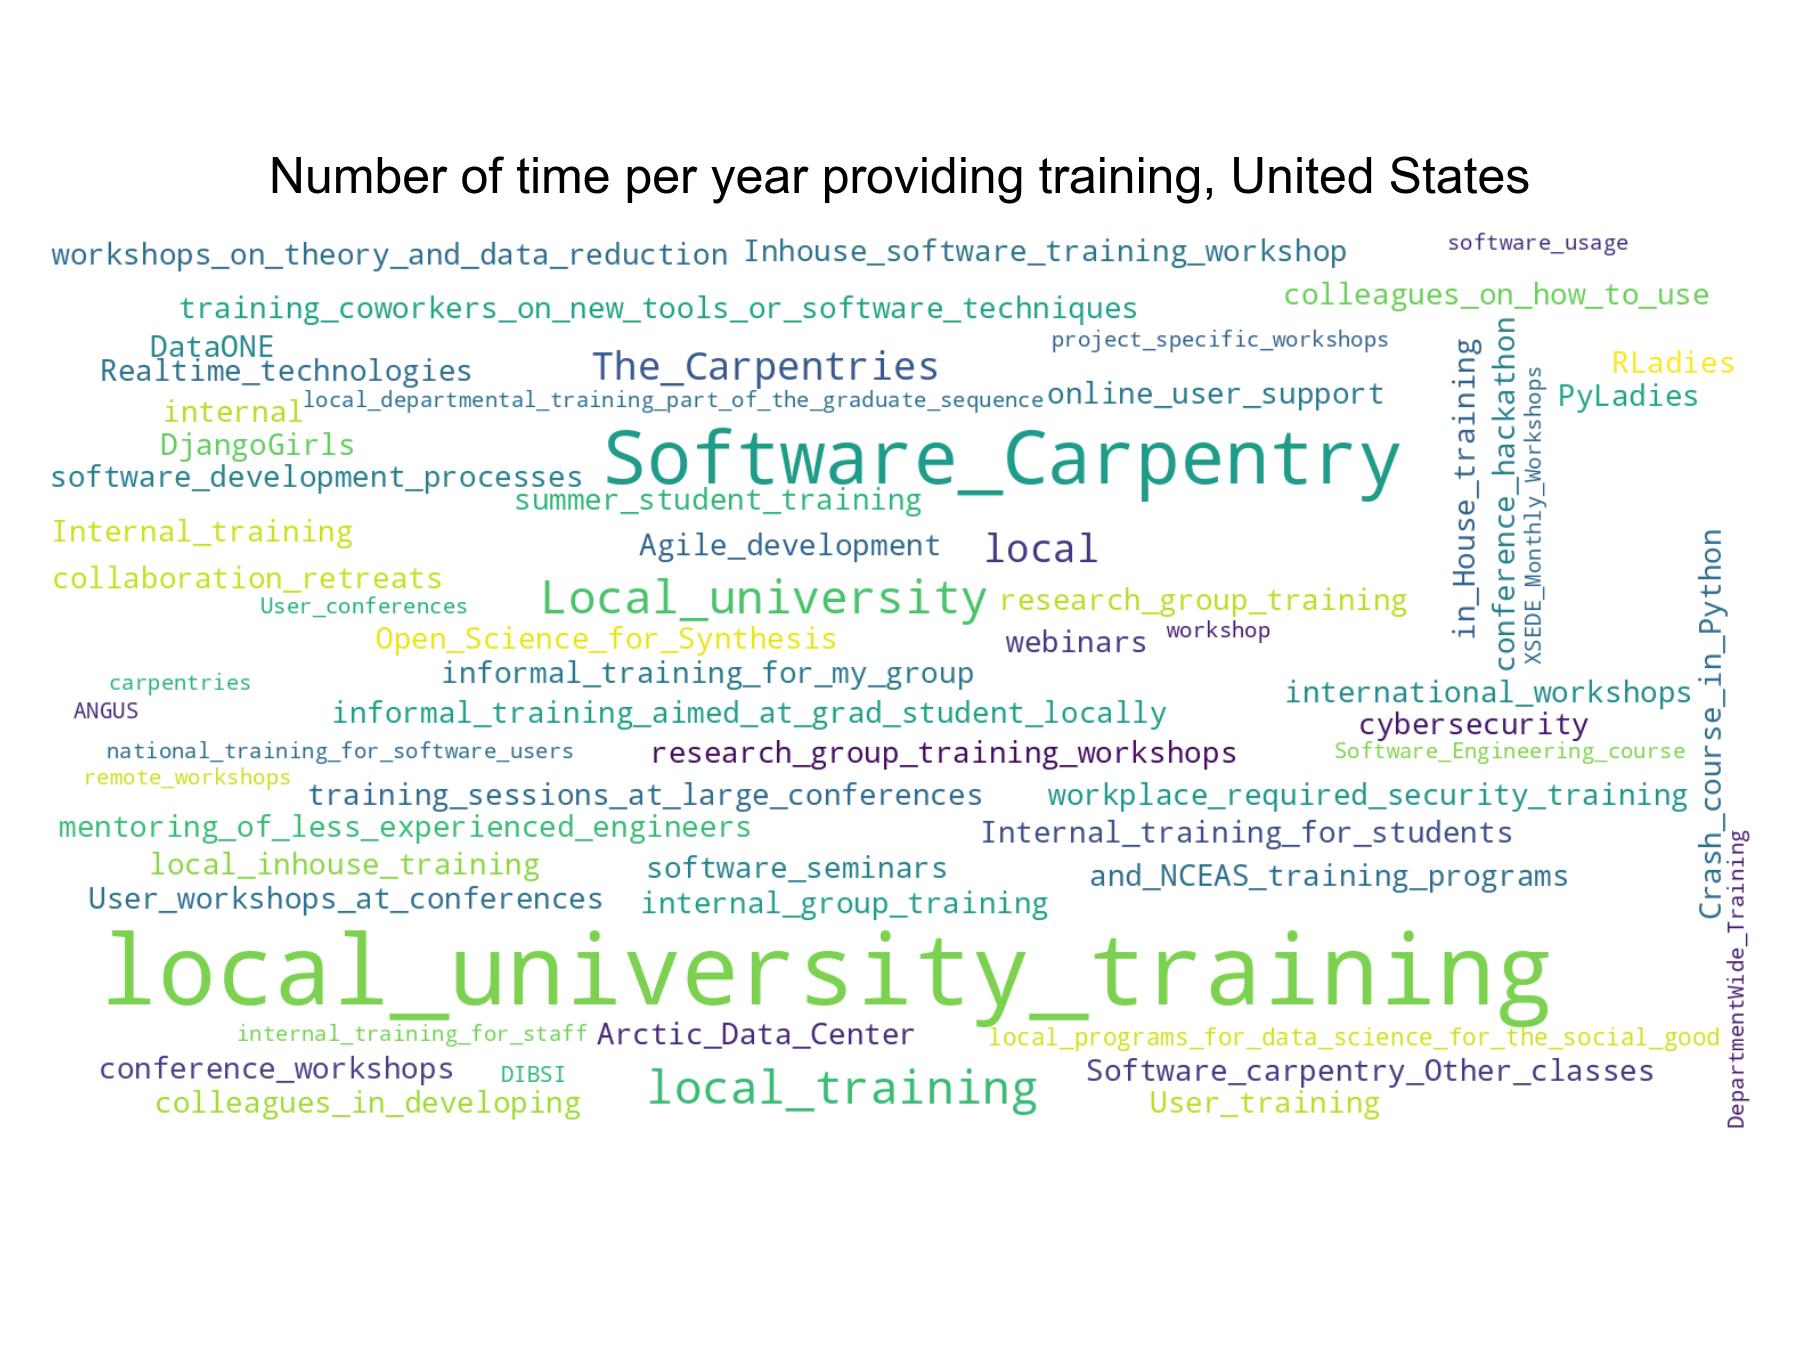
- On average, how many times a year do you take part in providing training?
(numeric)
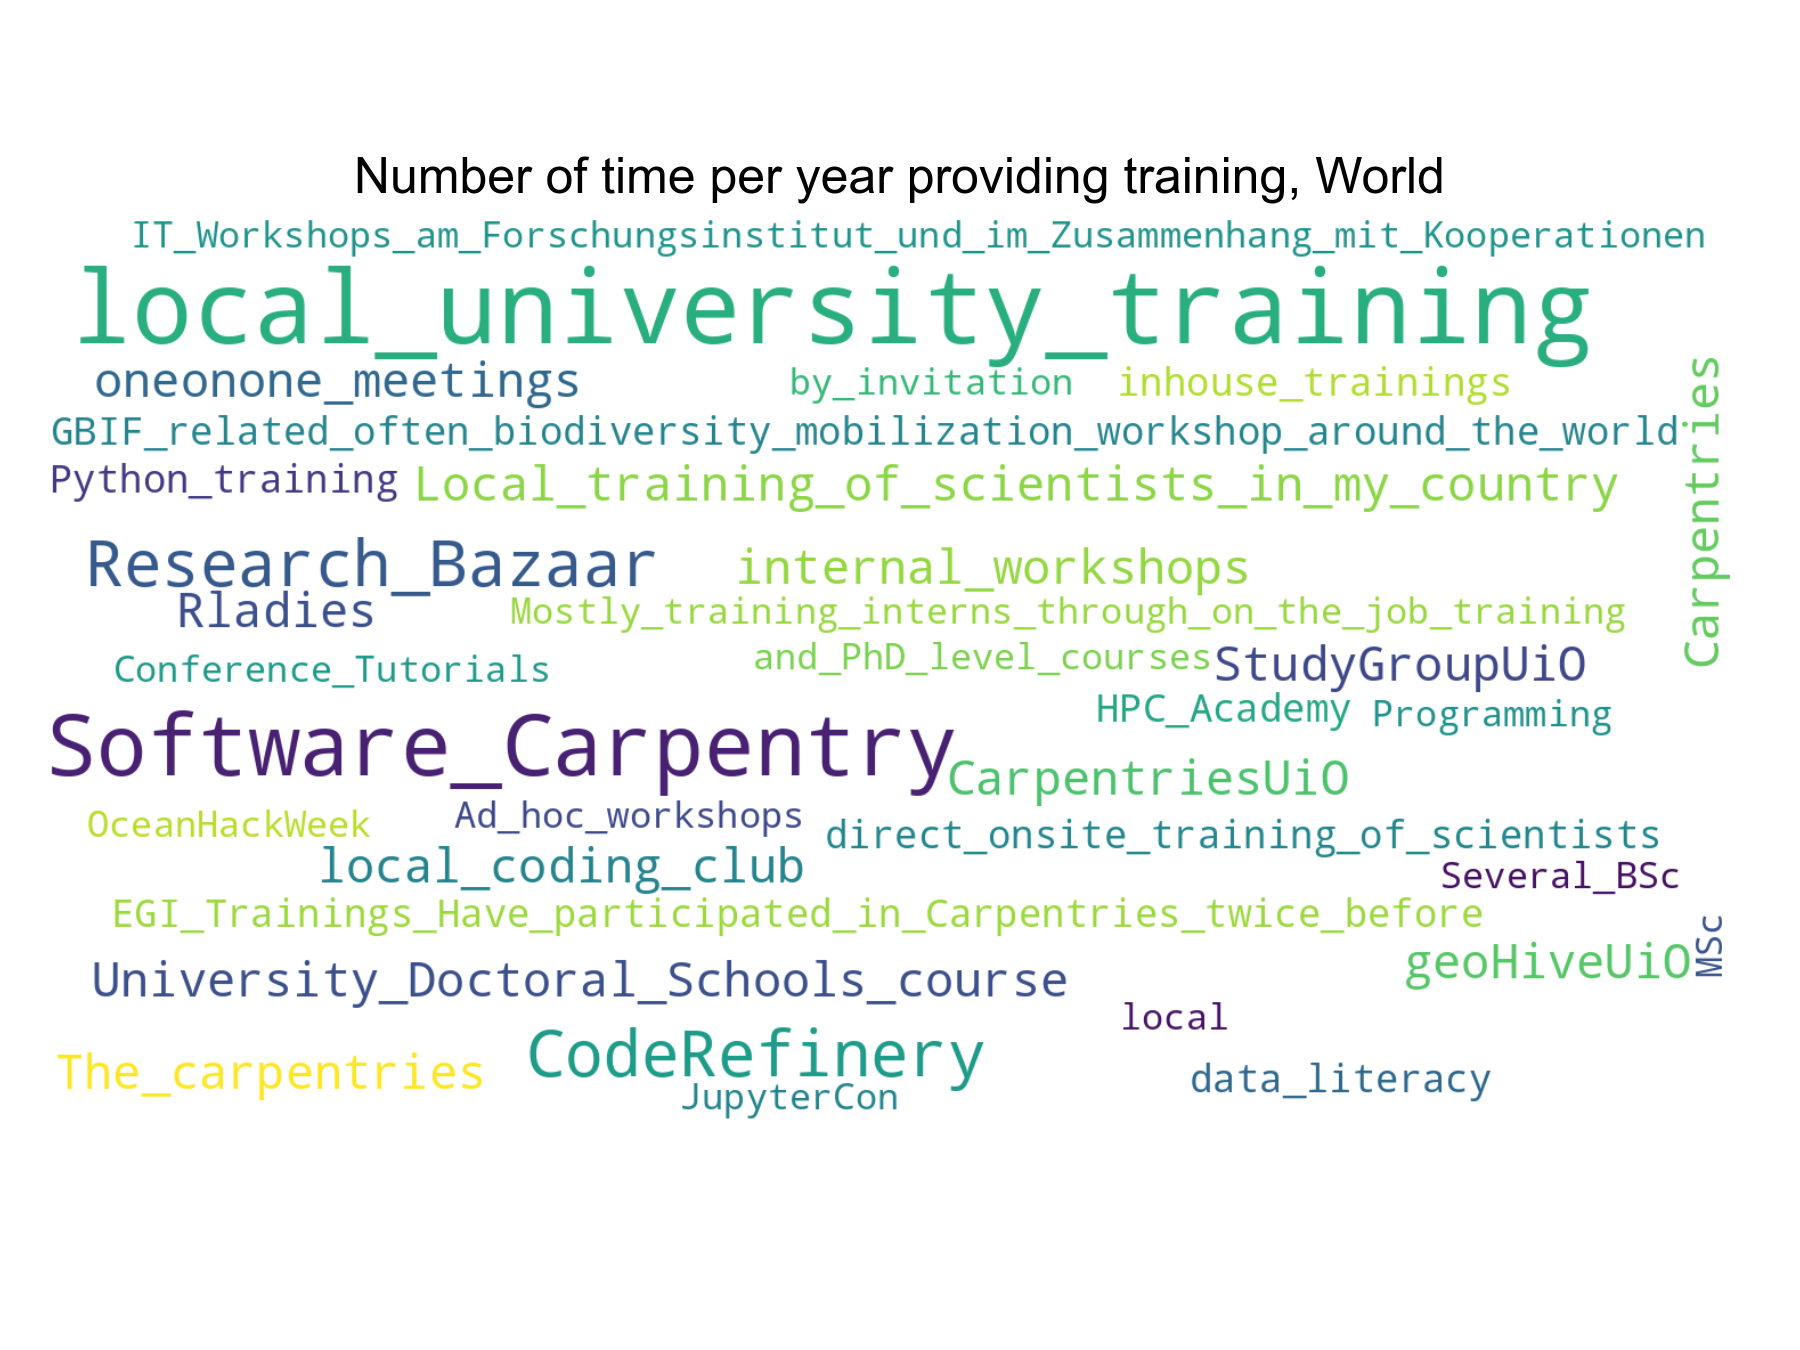
- What training programs are you involved with (comma separated list, e.g.,
Software Carpentry, local university training, etc.)? (free text)
Australia
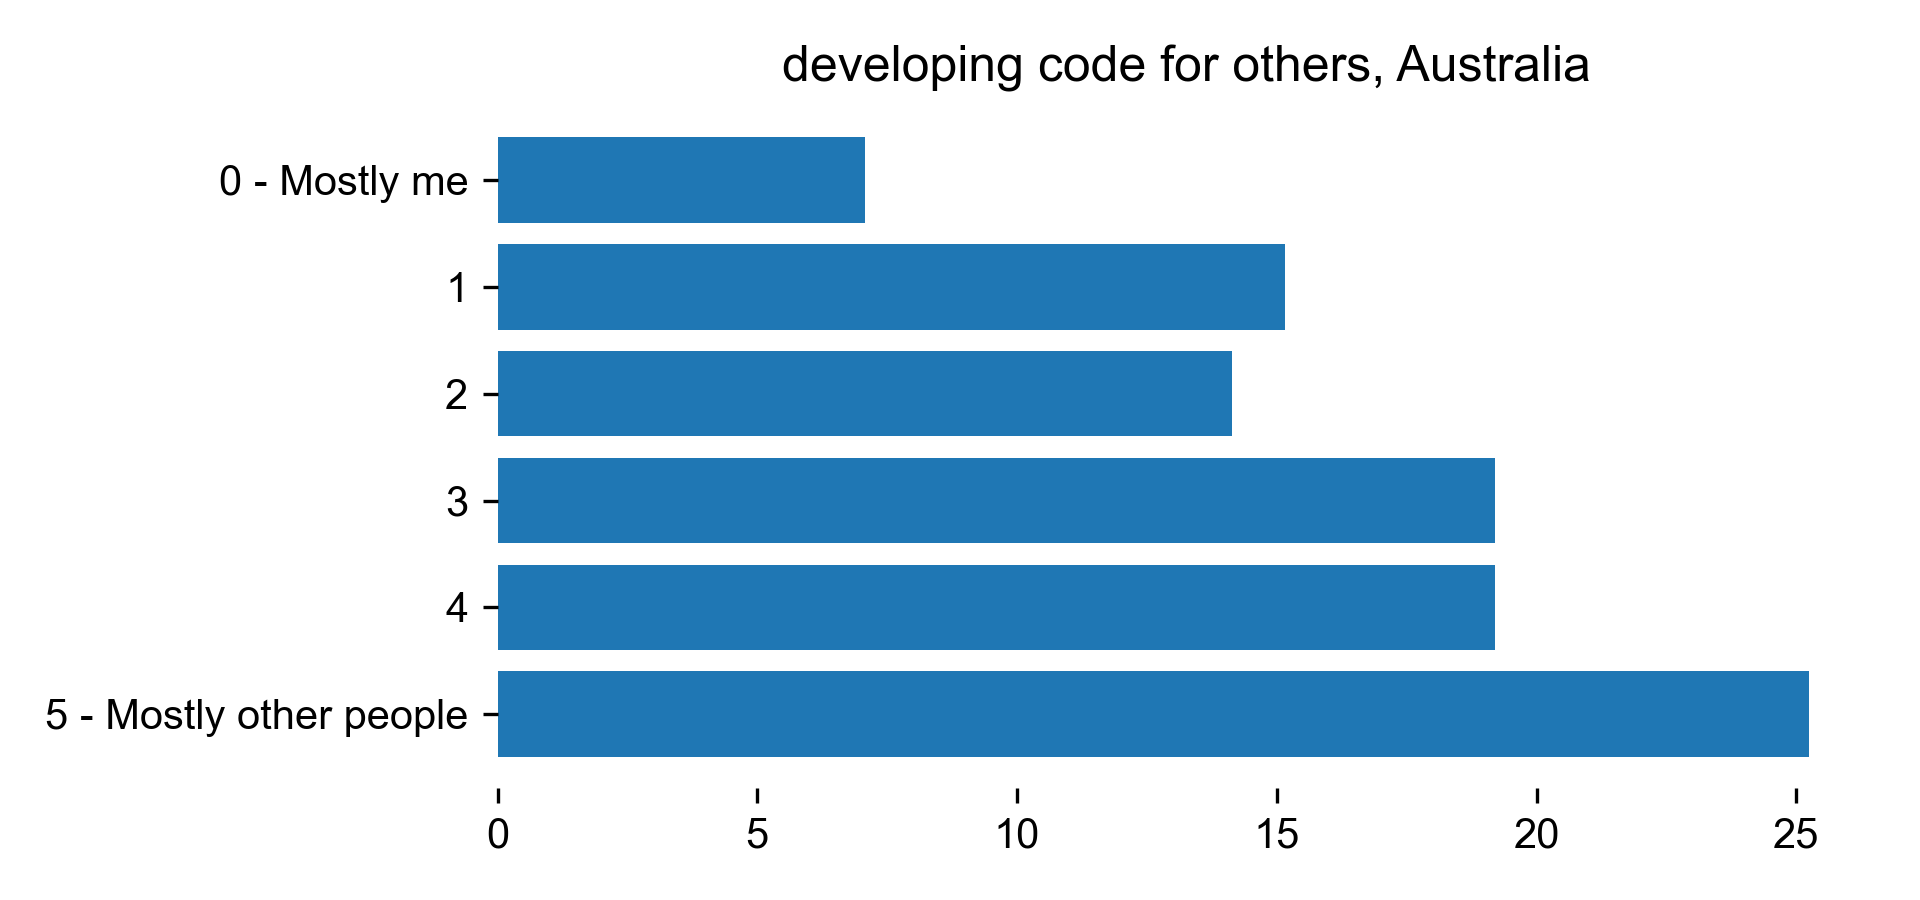
Developing code for others
| developing code for others for Australia |
Count |
Percentage |
| 0 - Mostly me |
7 |
7.07071 |
| 1 |
15 |
15.1515 |
| 2 |
14 |
14.1414 |
| 3 |
19 |
19.1919 |
| 4 |
19 |
19.1919 |
| 5 - Mostly other people |
25 |
25.2525 |
Download CSV
PNG SVG
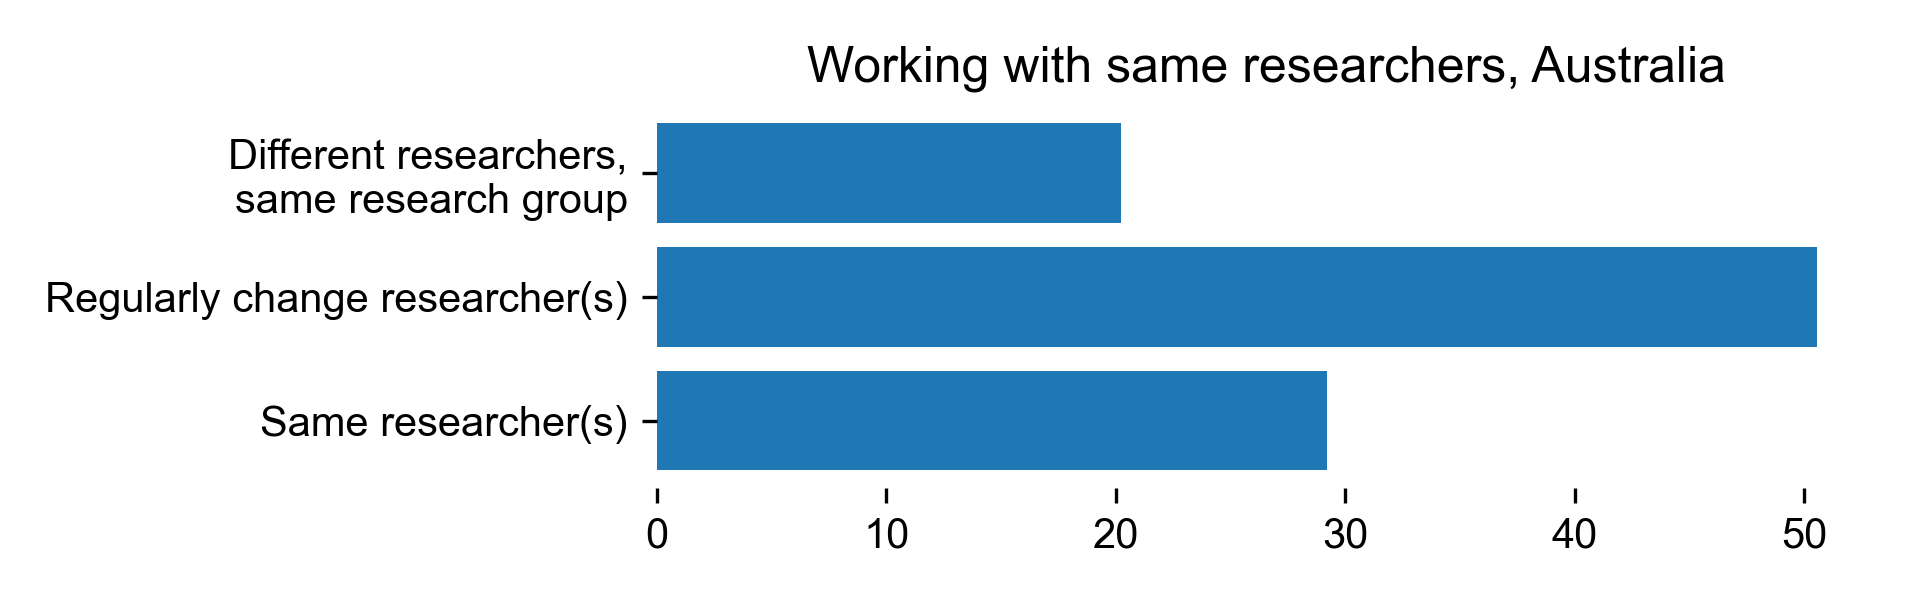
Working with same researchers
| Working with same researchers for Australia |
Count |
Percentage |
| Different researchers, same research group |
18 |
20.2247 |
| Regularly change researcher(s) |
45 |
50.5618 |
| Same researcher(s) |
26 |
29.2135 |
Download CSV
PNG SVG
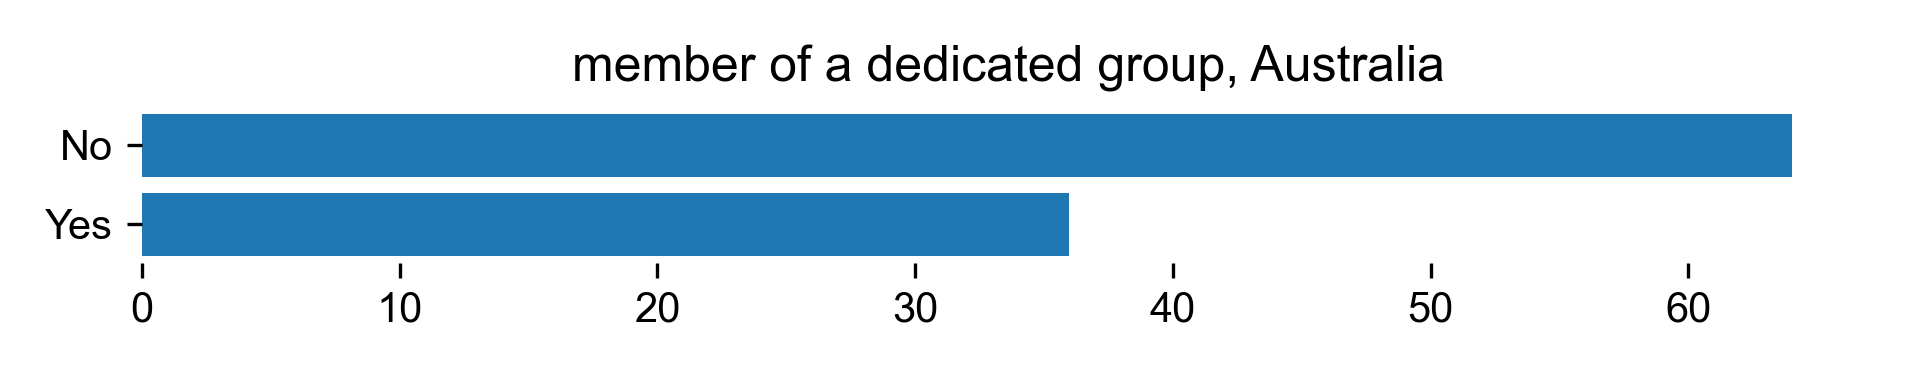
Part of dedicated group
| member of a dedicated group for Australia |
Count |
Percentage |
| No |
57 |
64.0449 |
| Yes |
32 |
35.9551 |
Download CSV
PNG SVG
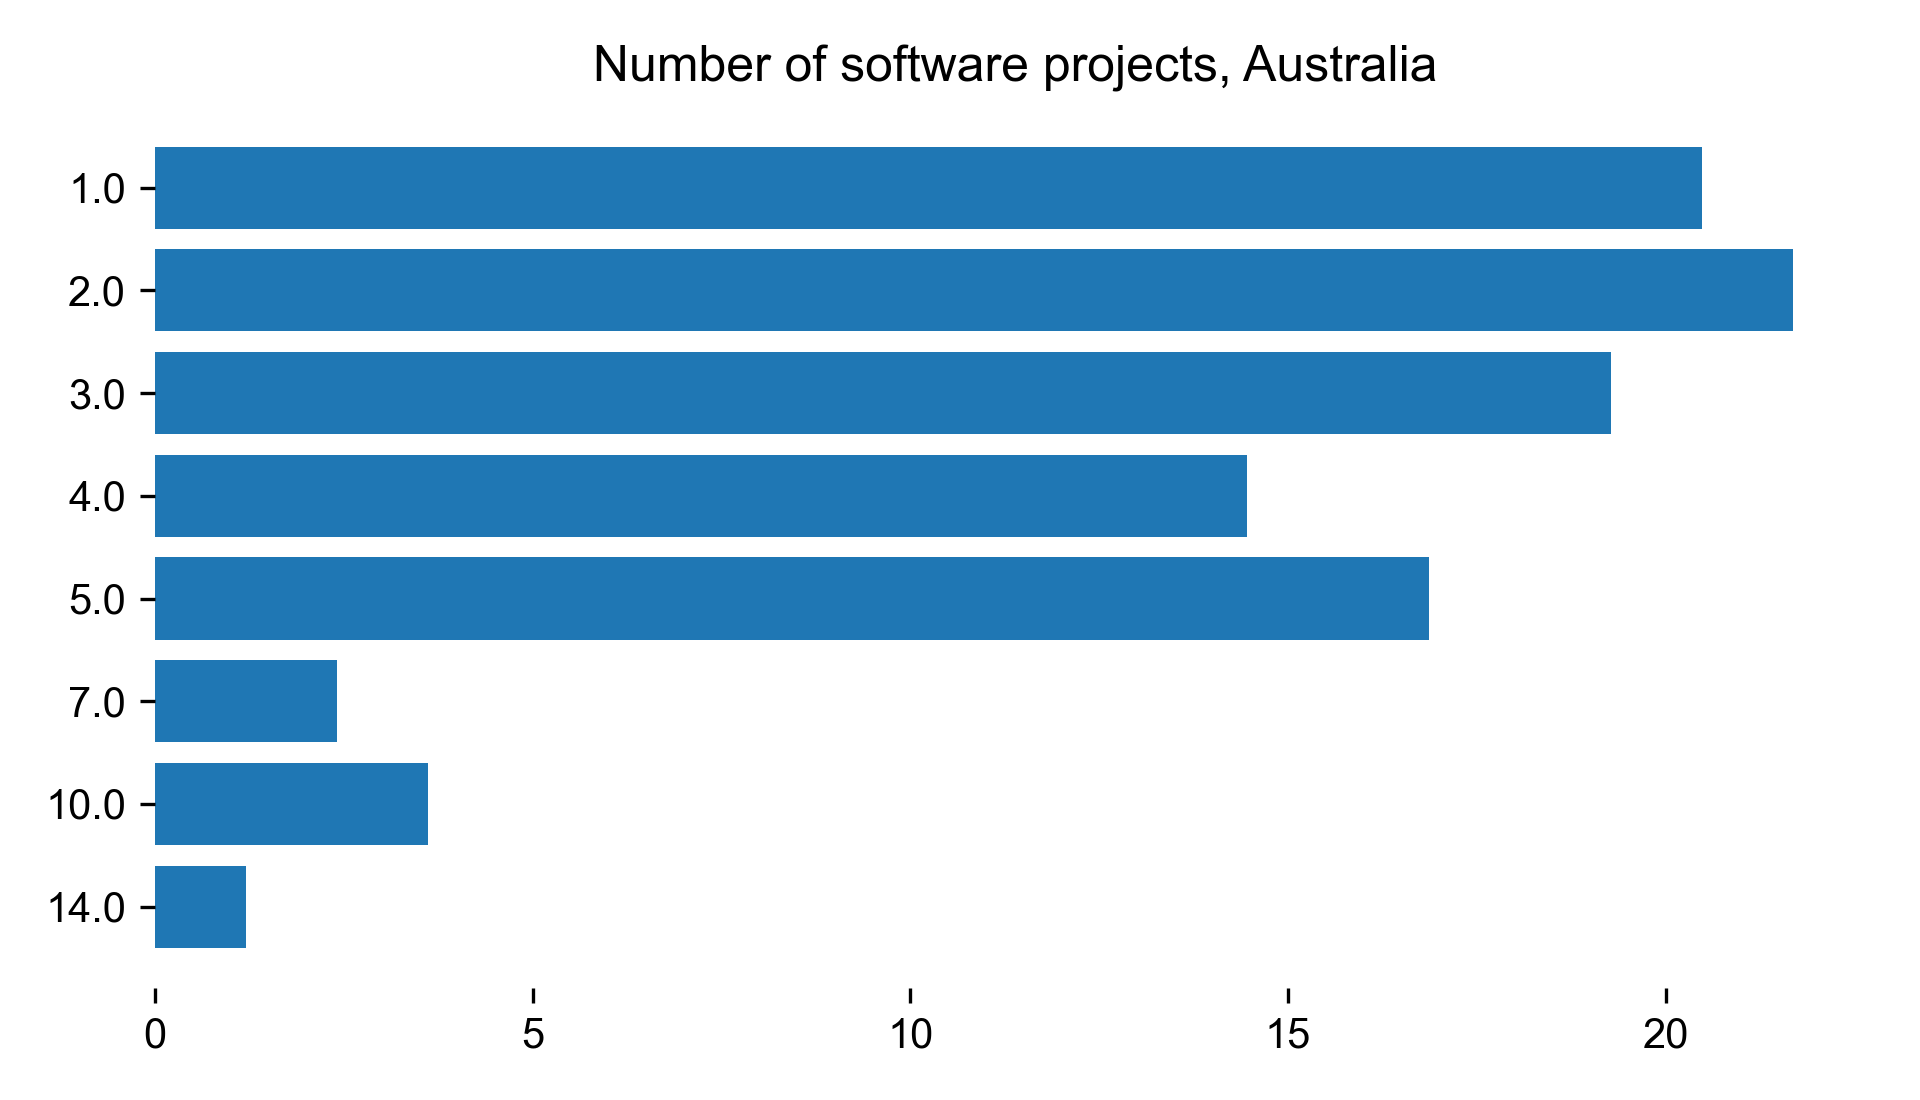
Number of projects
| Number of software projects for Australia |
Count |
Percentage |
| 1 |
17 |
20.4819 |
| 2 |
18 |
21.6867 |
| 3 |
16 |
19.2771 |
| 4 |
12 |
14.4578 |
| 5 |
14 |
16.8675 |
| 7 |
2 |
2.40964 |
| 10 |
3 |
3.61446 |
| 14 |
1 |
1.20482 |
Download CSV
PNG SVG
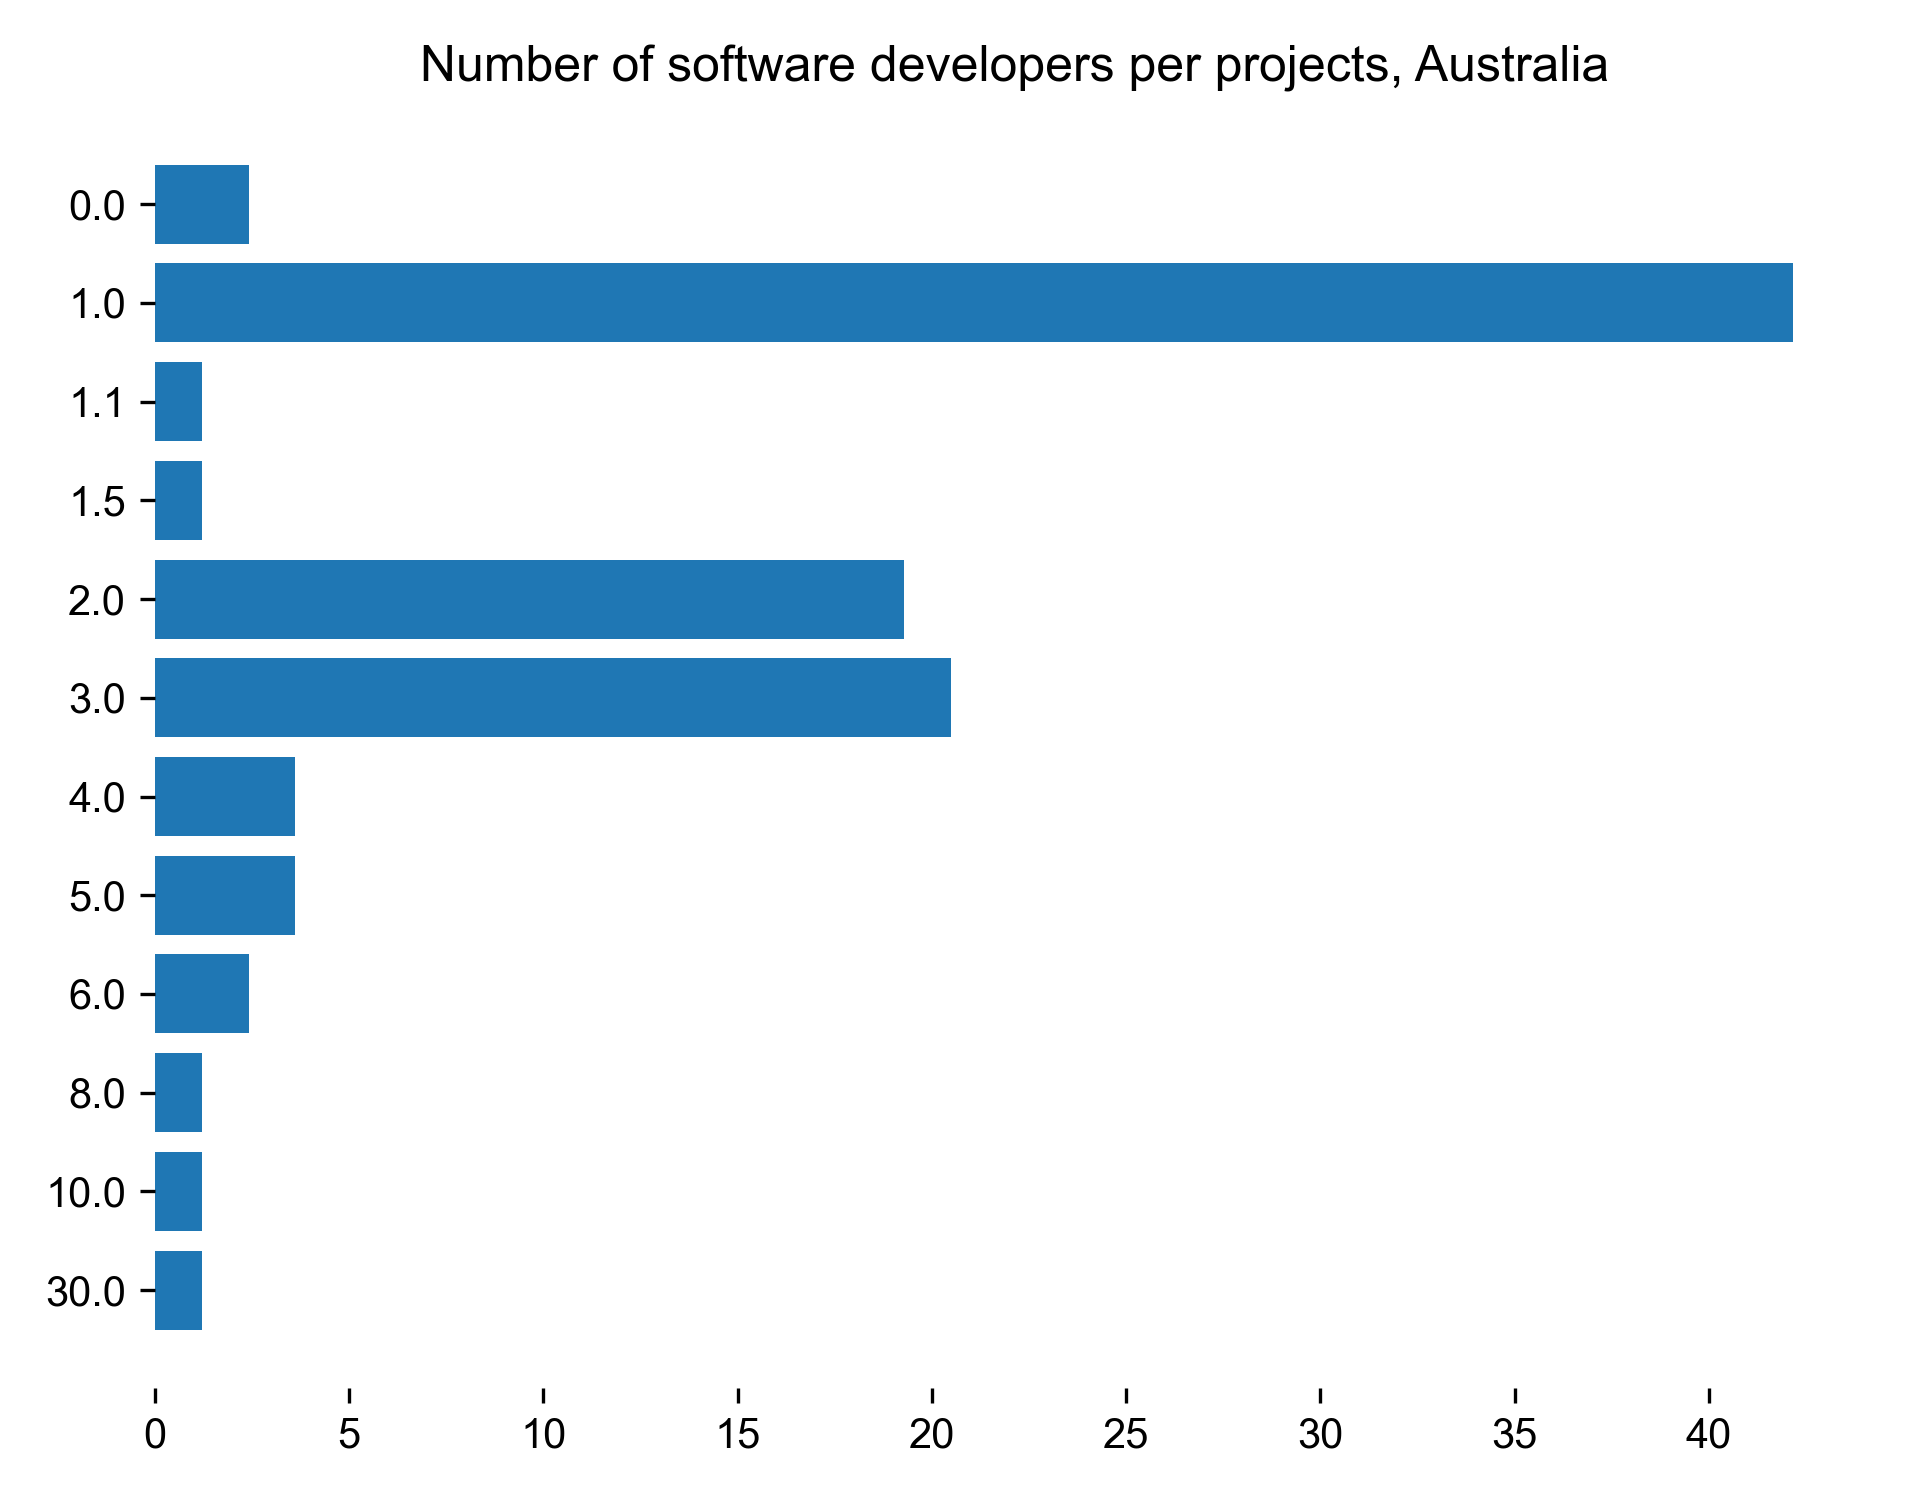
| Number of software developers per projects for Australia |
Count |
Percentage |
| 0 |
2 |
2.40964 |
| 1 |
35 |
42.1687 |
| 1.1 |
1 |
1.20482 |
| 1.5 |
1 |
1.20482 |
| 2 |
16 |
19.2771 |
| 3 |
17 |
20.4819 |
| 4 |
3 |
3.61446 |
| 5 |
3 |
3.61446 |
| 6 |
2 |
2.40964 |
| 8 |
1 |
1.20482 |
| 10 |
1 |
1.20482 |
| 30 |
1 |
1.20482 |
Download CSV
PNG SVG
Training
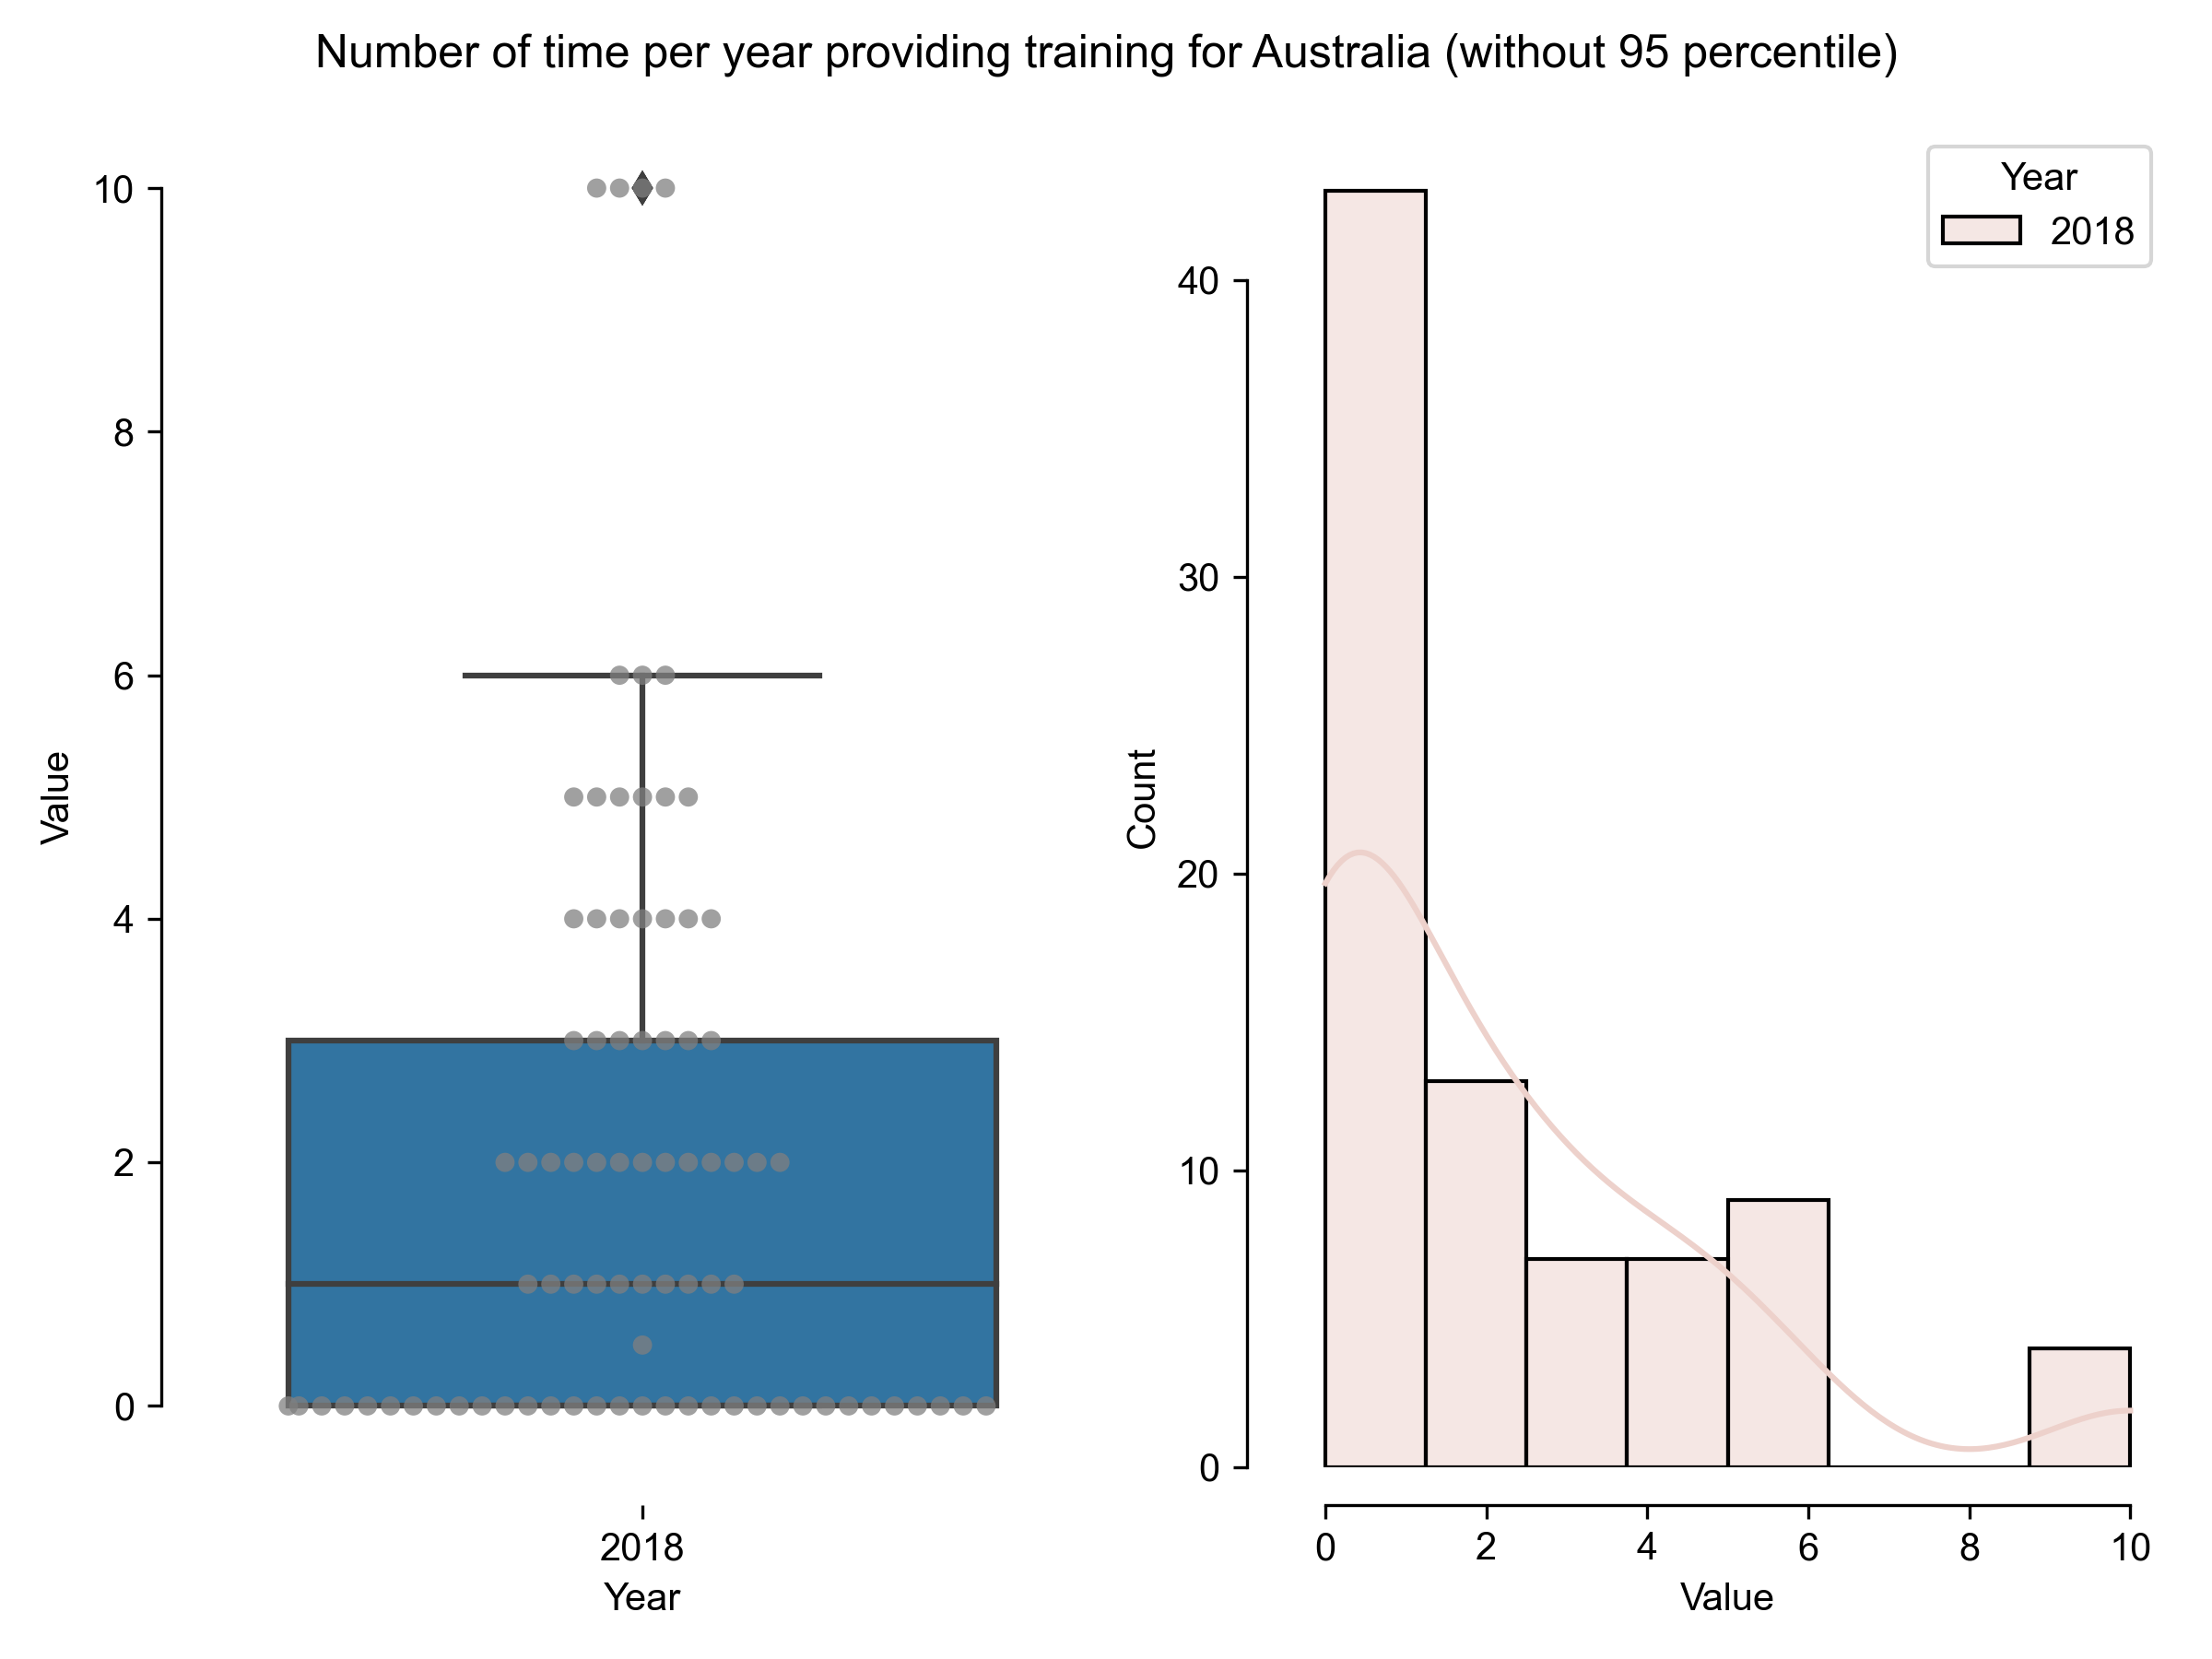
| Number of time per year providing training for Australia (without 95 percentile) |
Results in 2018 |
| count |
83 |
| mean |
2.09036 |
| std |
2.54849 |
| min |
0 |
| 25% |
0 |
| 50% |
1 |
| 75% |
3 |
| max |
10 |
Download CSV
PNG SVG
PNG SVG
Germany
Developing code for others
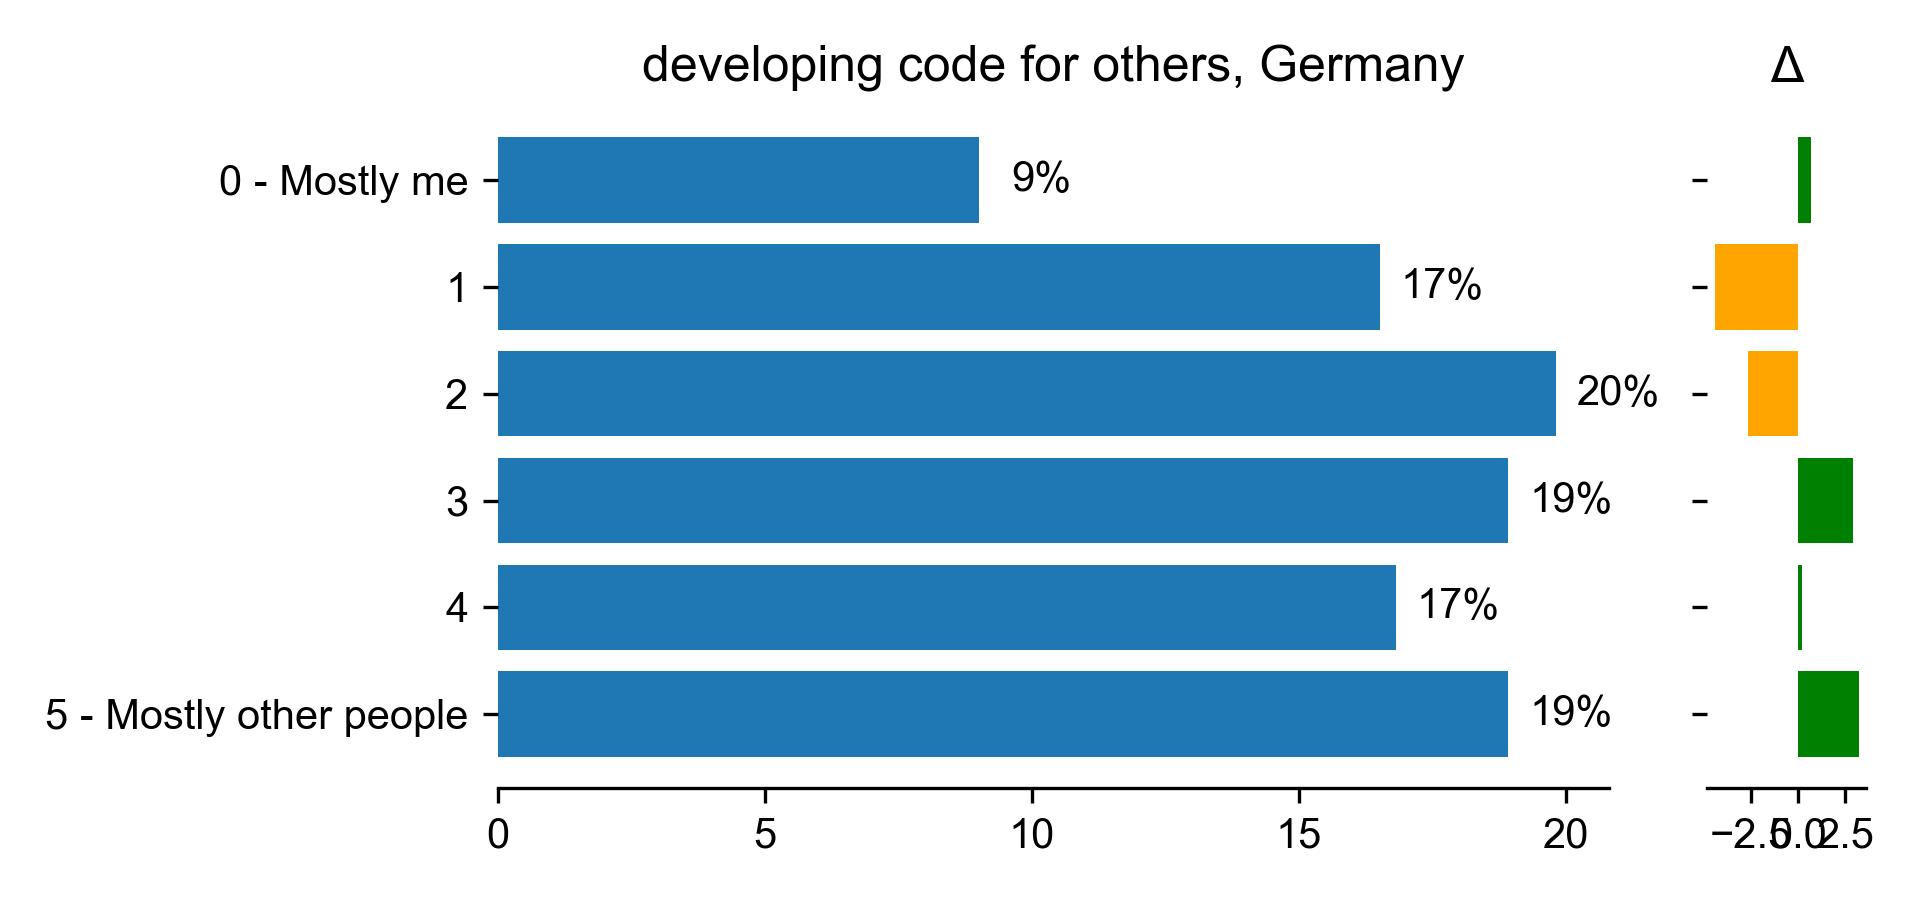
| developing code for others for Germany |
Count |
Percentage |
Percentage in 2017 |
Difference with previous year |
| 0 - Mostly me |
30 |
9.00901 |
8.30769 |
0.701317 |
| 1 |
55 |
16.5165 |
20.9231 |
-4.40656 |
| 2 |
66 |
19.8198 |
22.4615 |
-2.64172 |
| 3 |
63 |
18.9189 |
16 |
2.91892 |
| 4 |
56 |
16.8168 |
16.6154 |
0.201432 |
| 5 - Mostly other people |
63 |
18.9189 |
15.6923 |
3.22661 |
Download CSV
PNG SVG
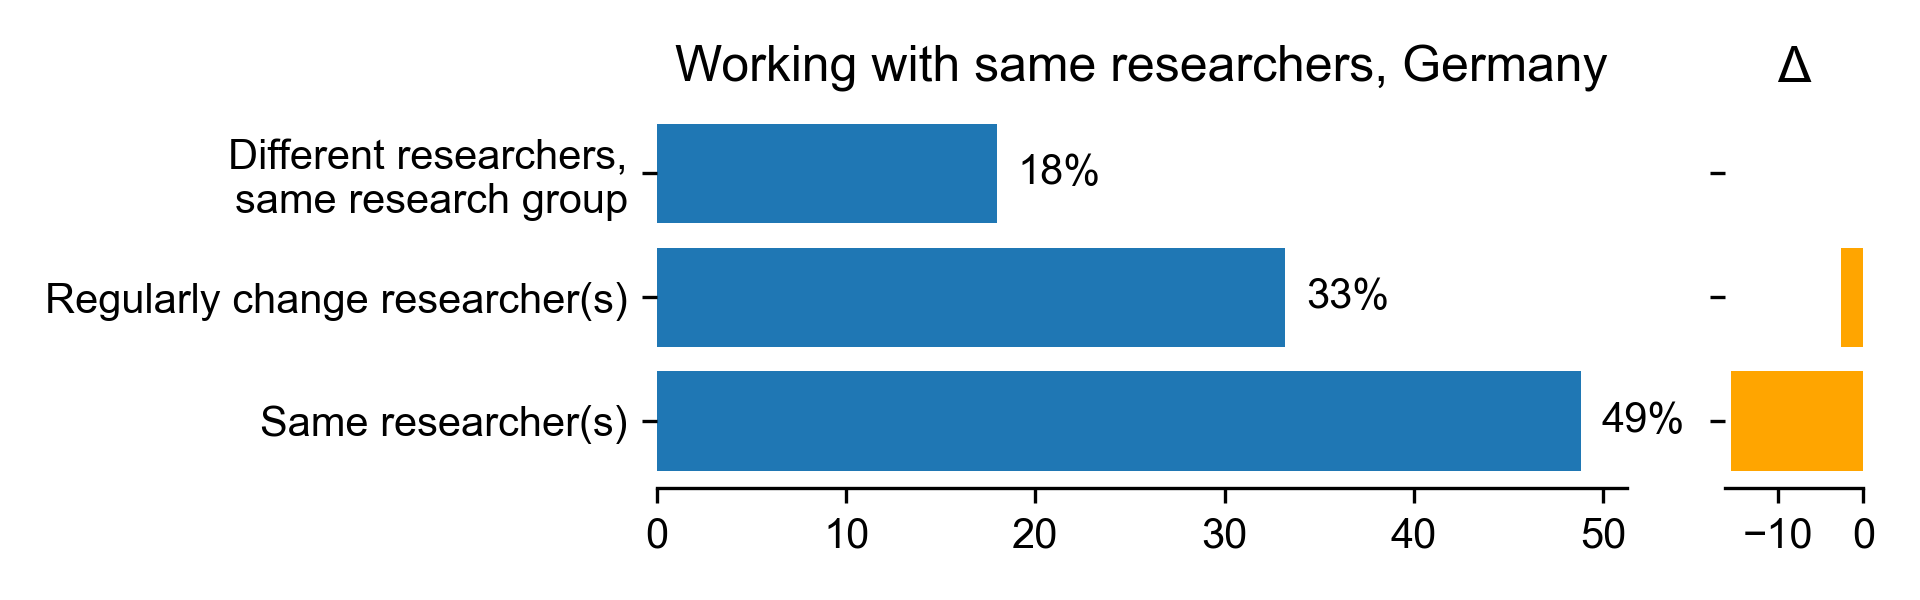
Working with same researchers
| Working with same researchers for Germany |
Count |
Percentage |
Percentage in 2017 |
Difference with previous year |
| Different researchers, same research group |
53 |
17.9661 |
nan |
nan |
| Regularly change researcher(s) |
98 |
33.2203 |
35.786 |
-2.56561 |
| Same researcher(s) |
144 |
48.8136 |
64.214 |
-15.4005 |
Download CSV
PNG SVG
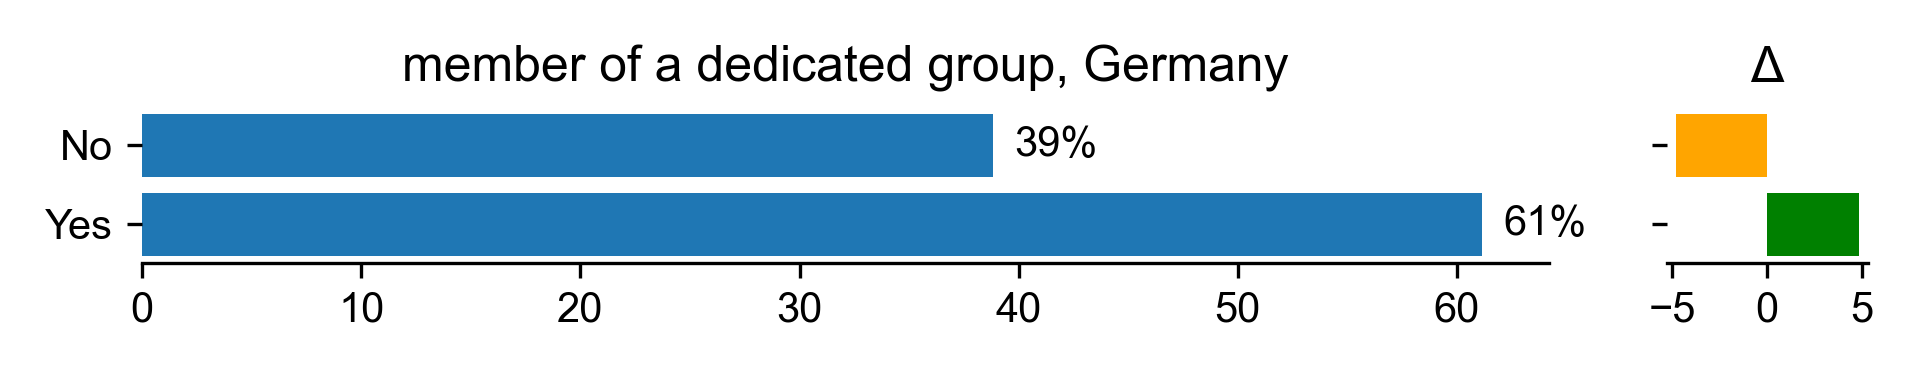
Part of dedicated group
| member of a dedicated group for Germany |
Count |
Percentage |
Percentage in 2017 |
Difference with previous year |
| No |
115 |
38.8514 |
43.6667 |
-4.81532 |
| Yes |
181 |
61.1486 |
56.3333 |
4.81532 |
Download CSV
PNG SVG
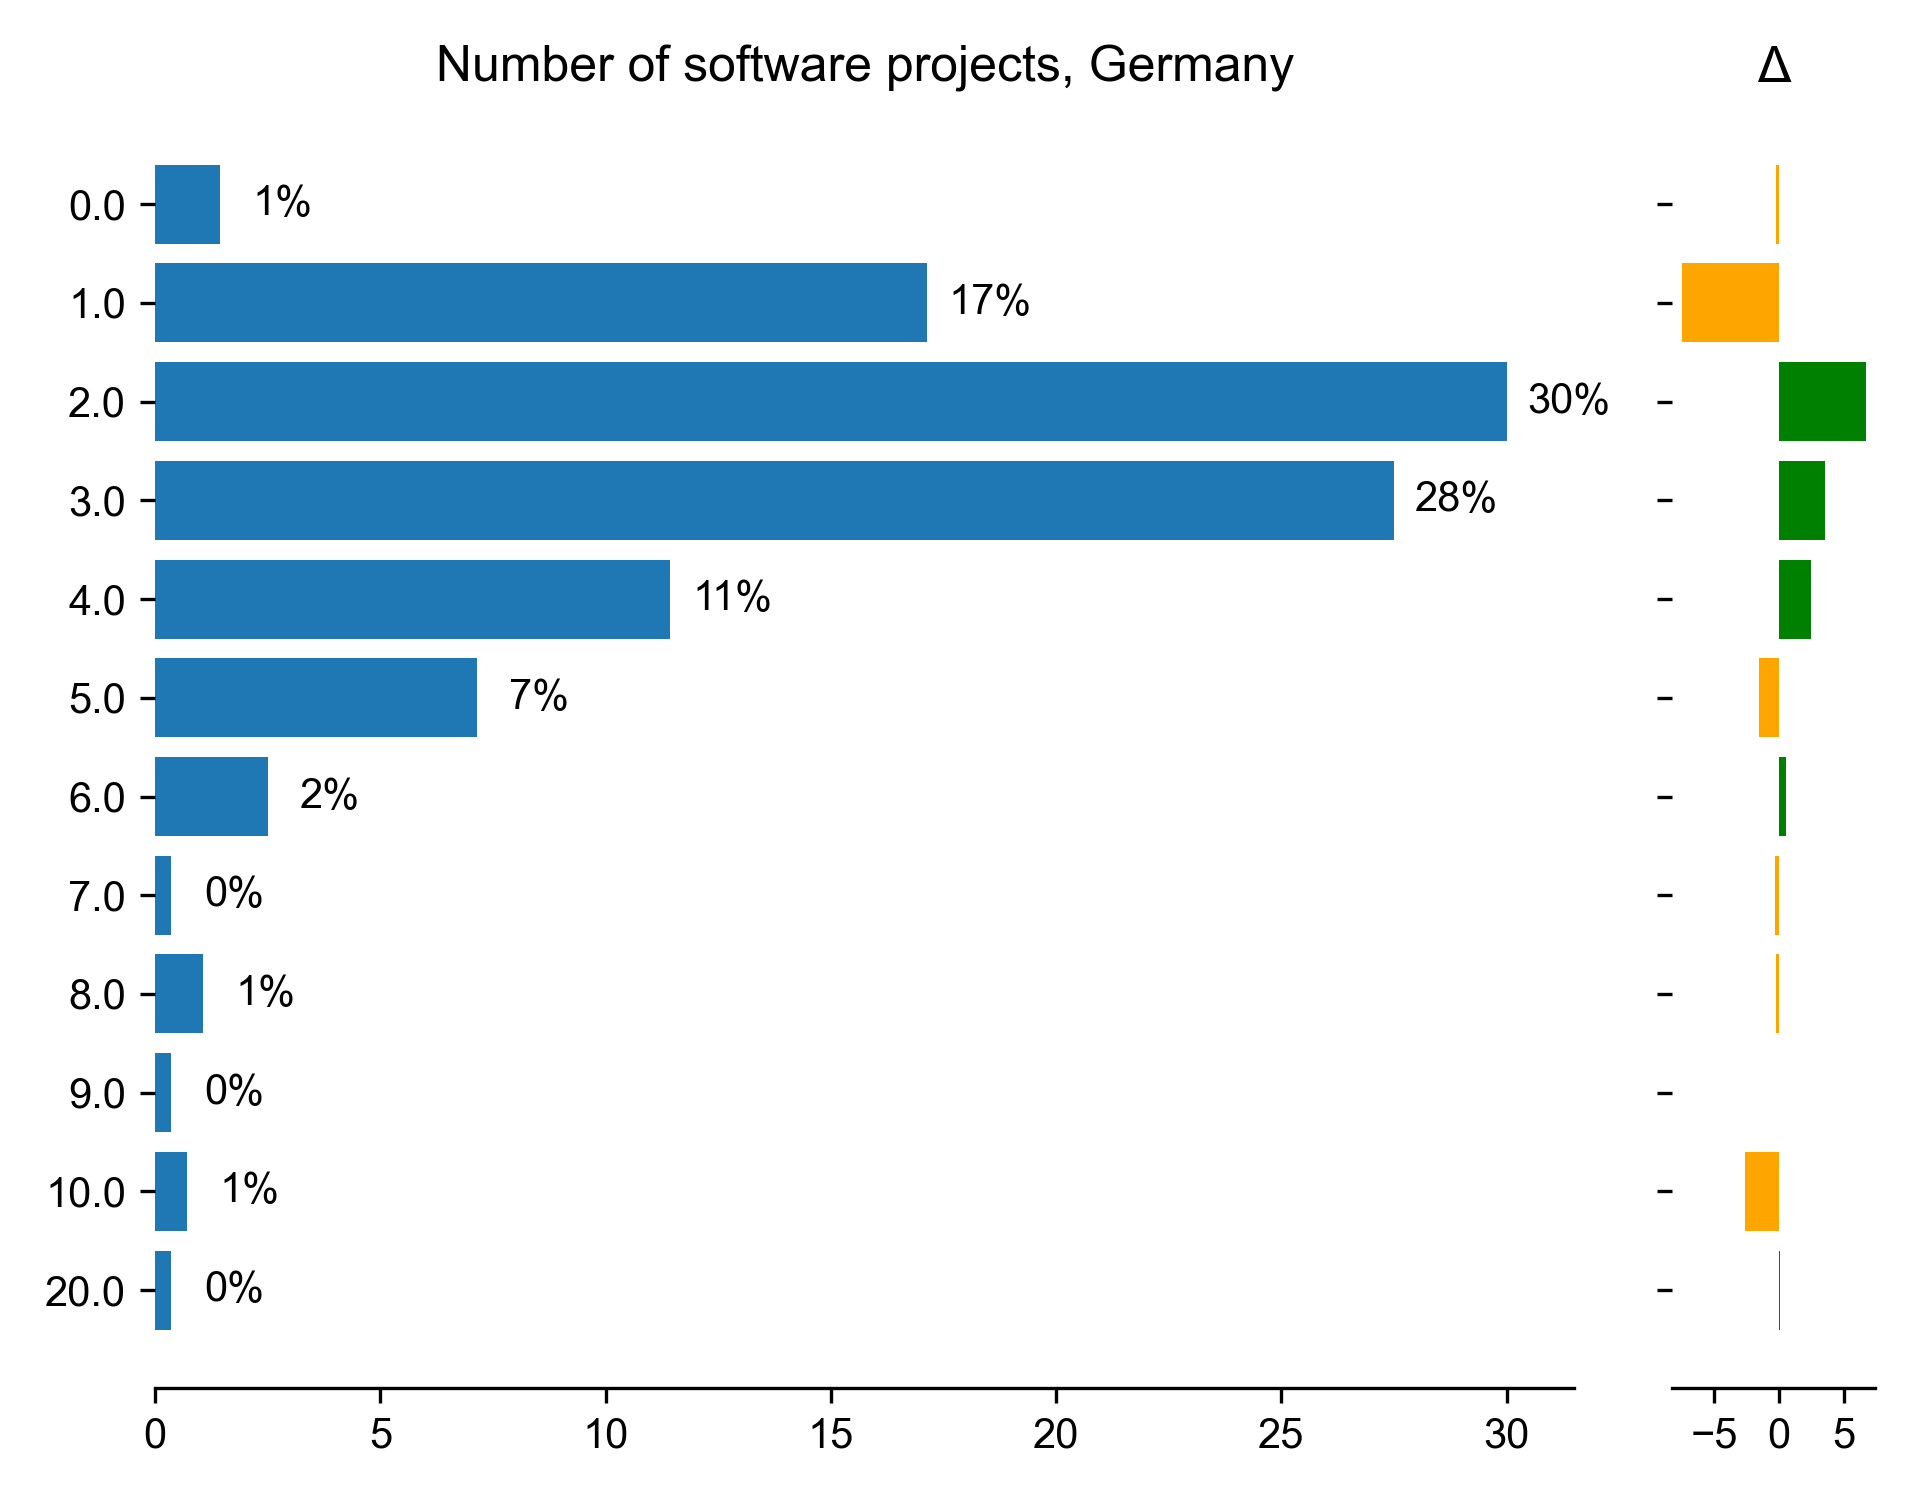
Number of projects
| Number of software projects for Germany |
Count |
Percentage |
Percentage in 2017 |
Difference with previous year |
| 0 |
4 |
1.42857 |
1.66667 |
-0.238095 |
| 1 |
48 |
17.1429 |
24.6667 |
-7.52381 |
| 2 |
84 |
30 |
23.3333 |
6.66667 |
| 3 |
77 |
27.5 |
24 |
3.5 |
| 4 |
32 |
11.4286 |
9 |
2.42857 |
| 5 |
20 |
7.14286 |
8.66667 |
-1.52381 |
| 6 |
7 |
2.5 |
2 |
0.5 |
| 7 |
1 |
0.357143 |
0.666667 |
-0.309524 |
| 8 |
3 |
1.07143 |
1.33333 |
-0.261905 |
| 9 |
1 |
0.357143 |
nan |
nan |
| 10 |
2 |
0.714286 |
3.33333 |
-2.61905 |
| 20 |
1 |
0.357143 |
0.333333 |
0.0238095 |
Download CSV
PNG SVG
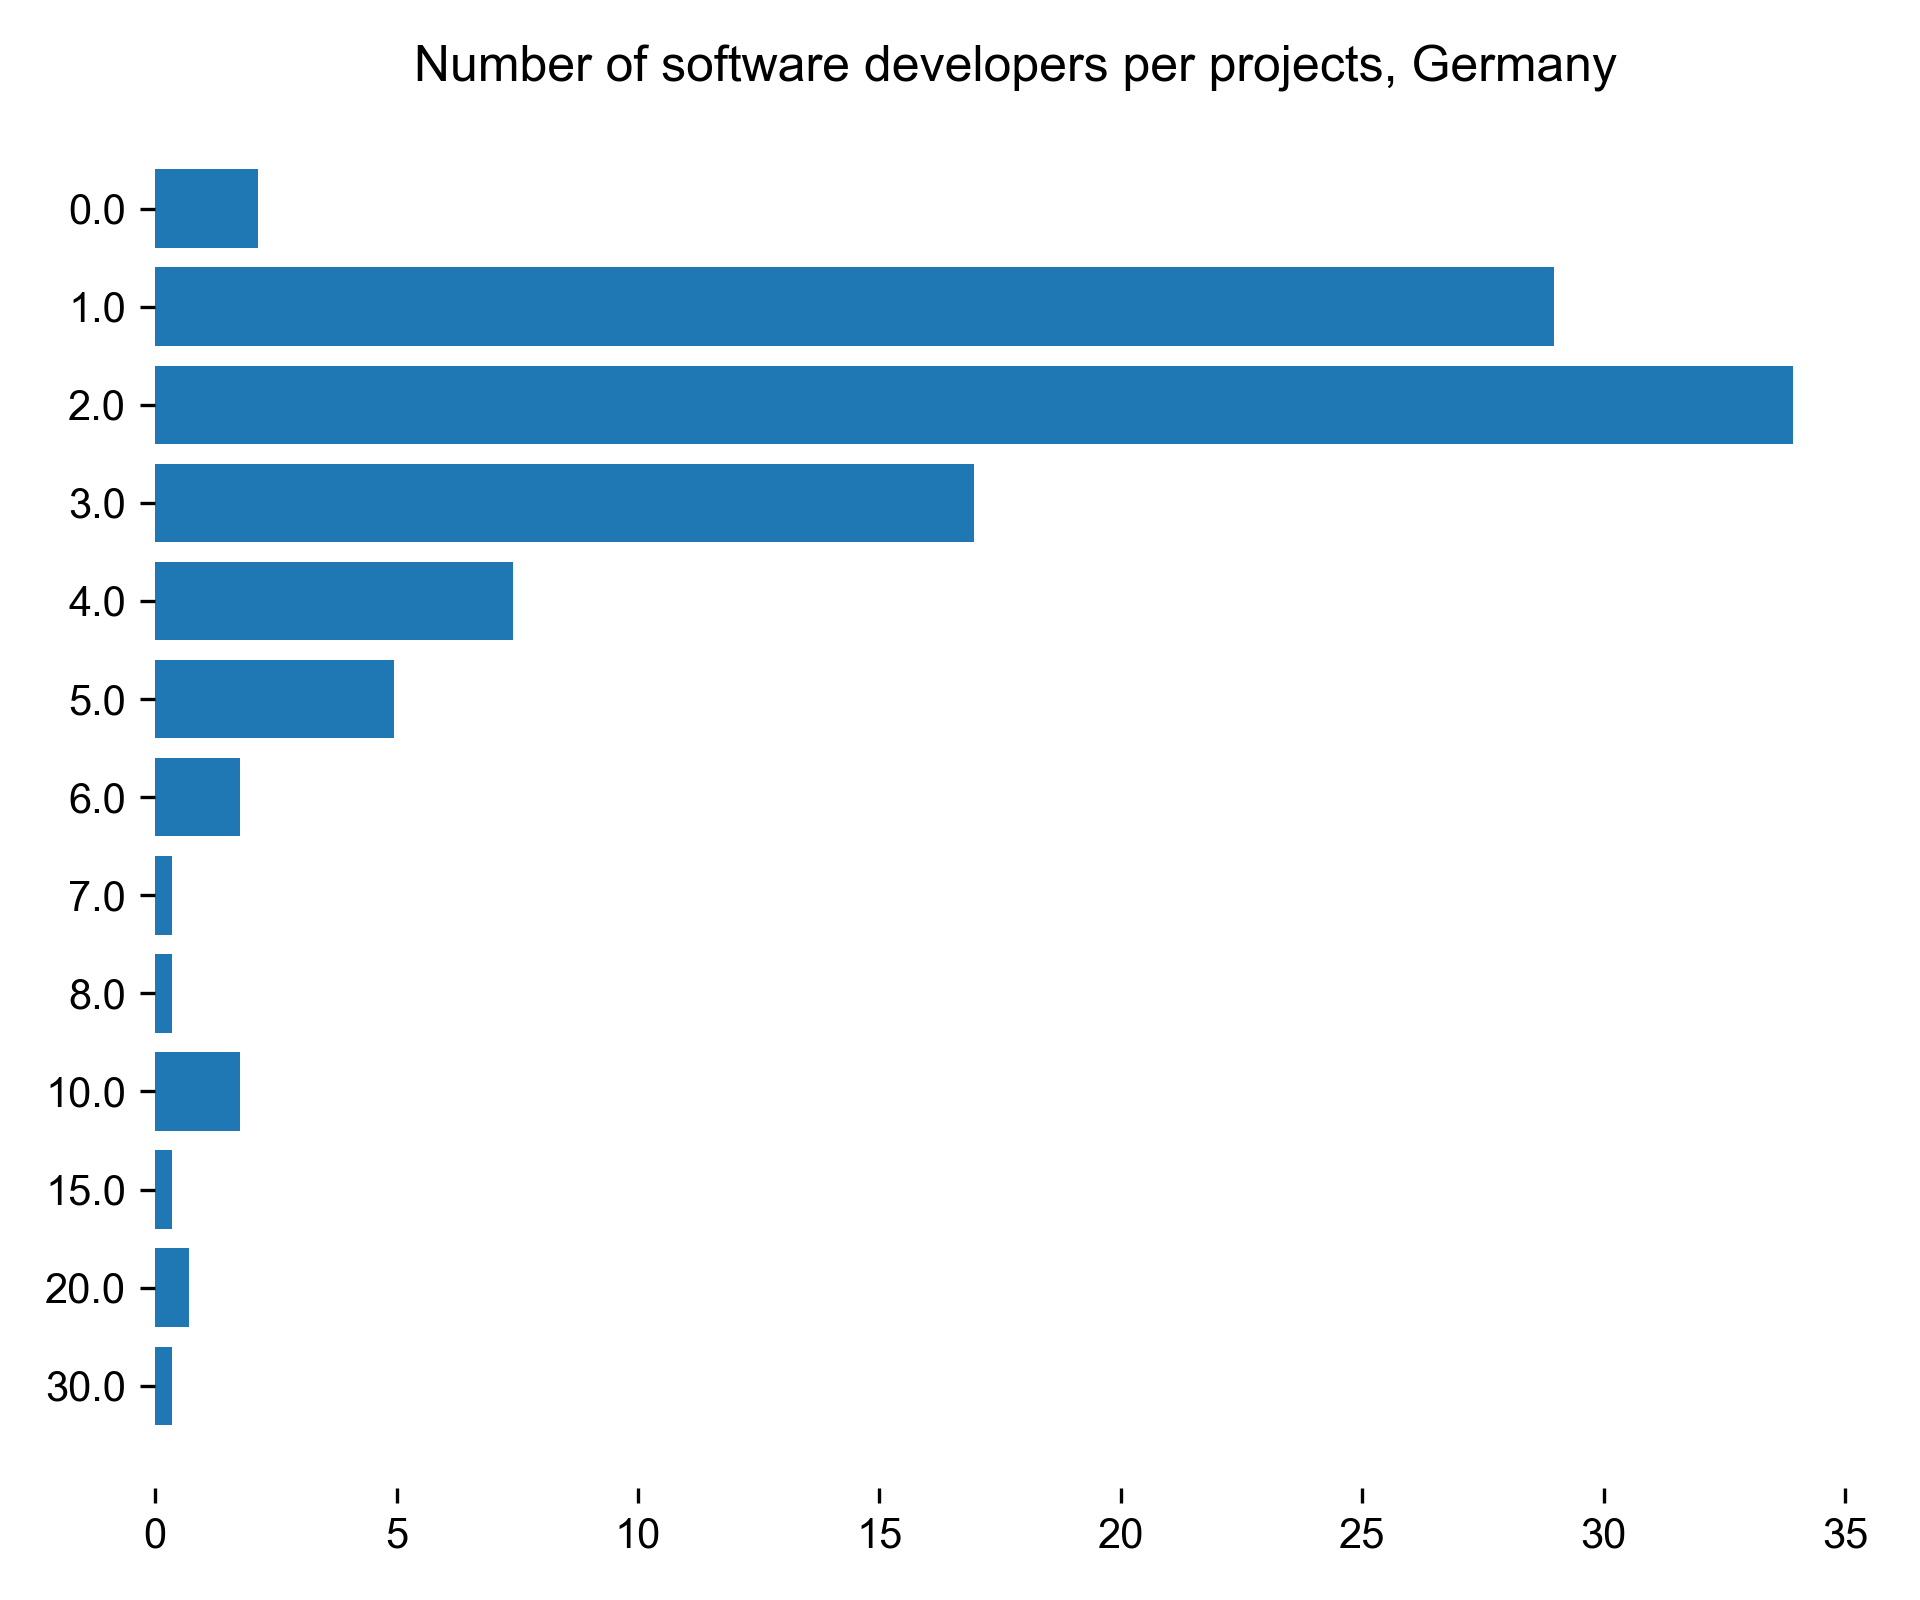
| Number of software developers per projects for Germany |
Count |
Percentage |
| 0 |
6 |
2.12014 |
| 1 |
82 |
28.9753 |
| 2 |
96 |
33.9223 |
| 3 |
48 |
16.9611 |
| 4 |
21 |
7.42049 |
| 5 |
14 |
4.947 |
| 6 |
5 |
1.76678 |
| 7 |
1 |
0.353357 |
| 8 |
1 |
0.353357 |
| 10 |
5 |
1.76678 |
| 15 |
1 |
0.353357 |
| 20 |
2 |
0.706714 |
| 30 |
1 |
0.353357 |
Download CSV
PNG SVG
Training
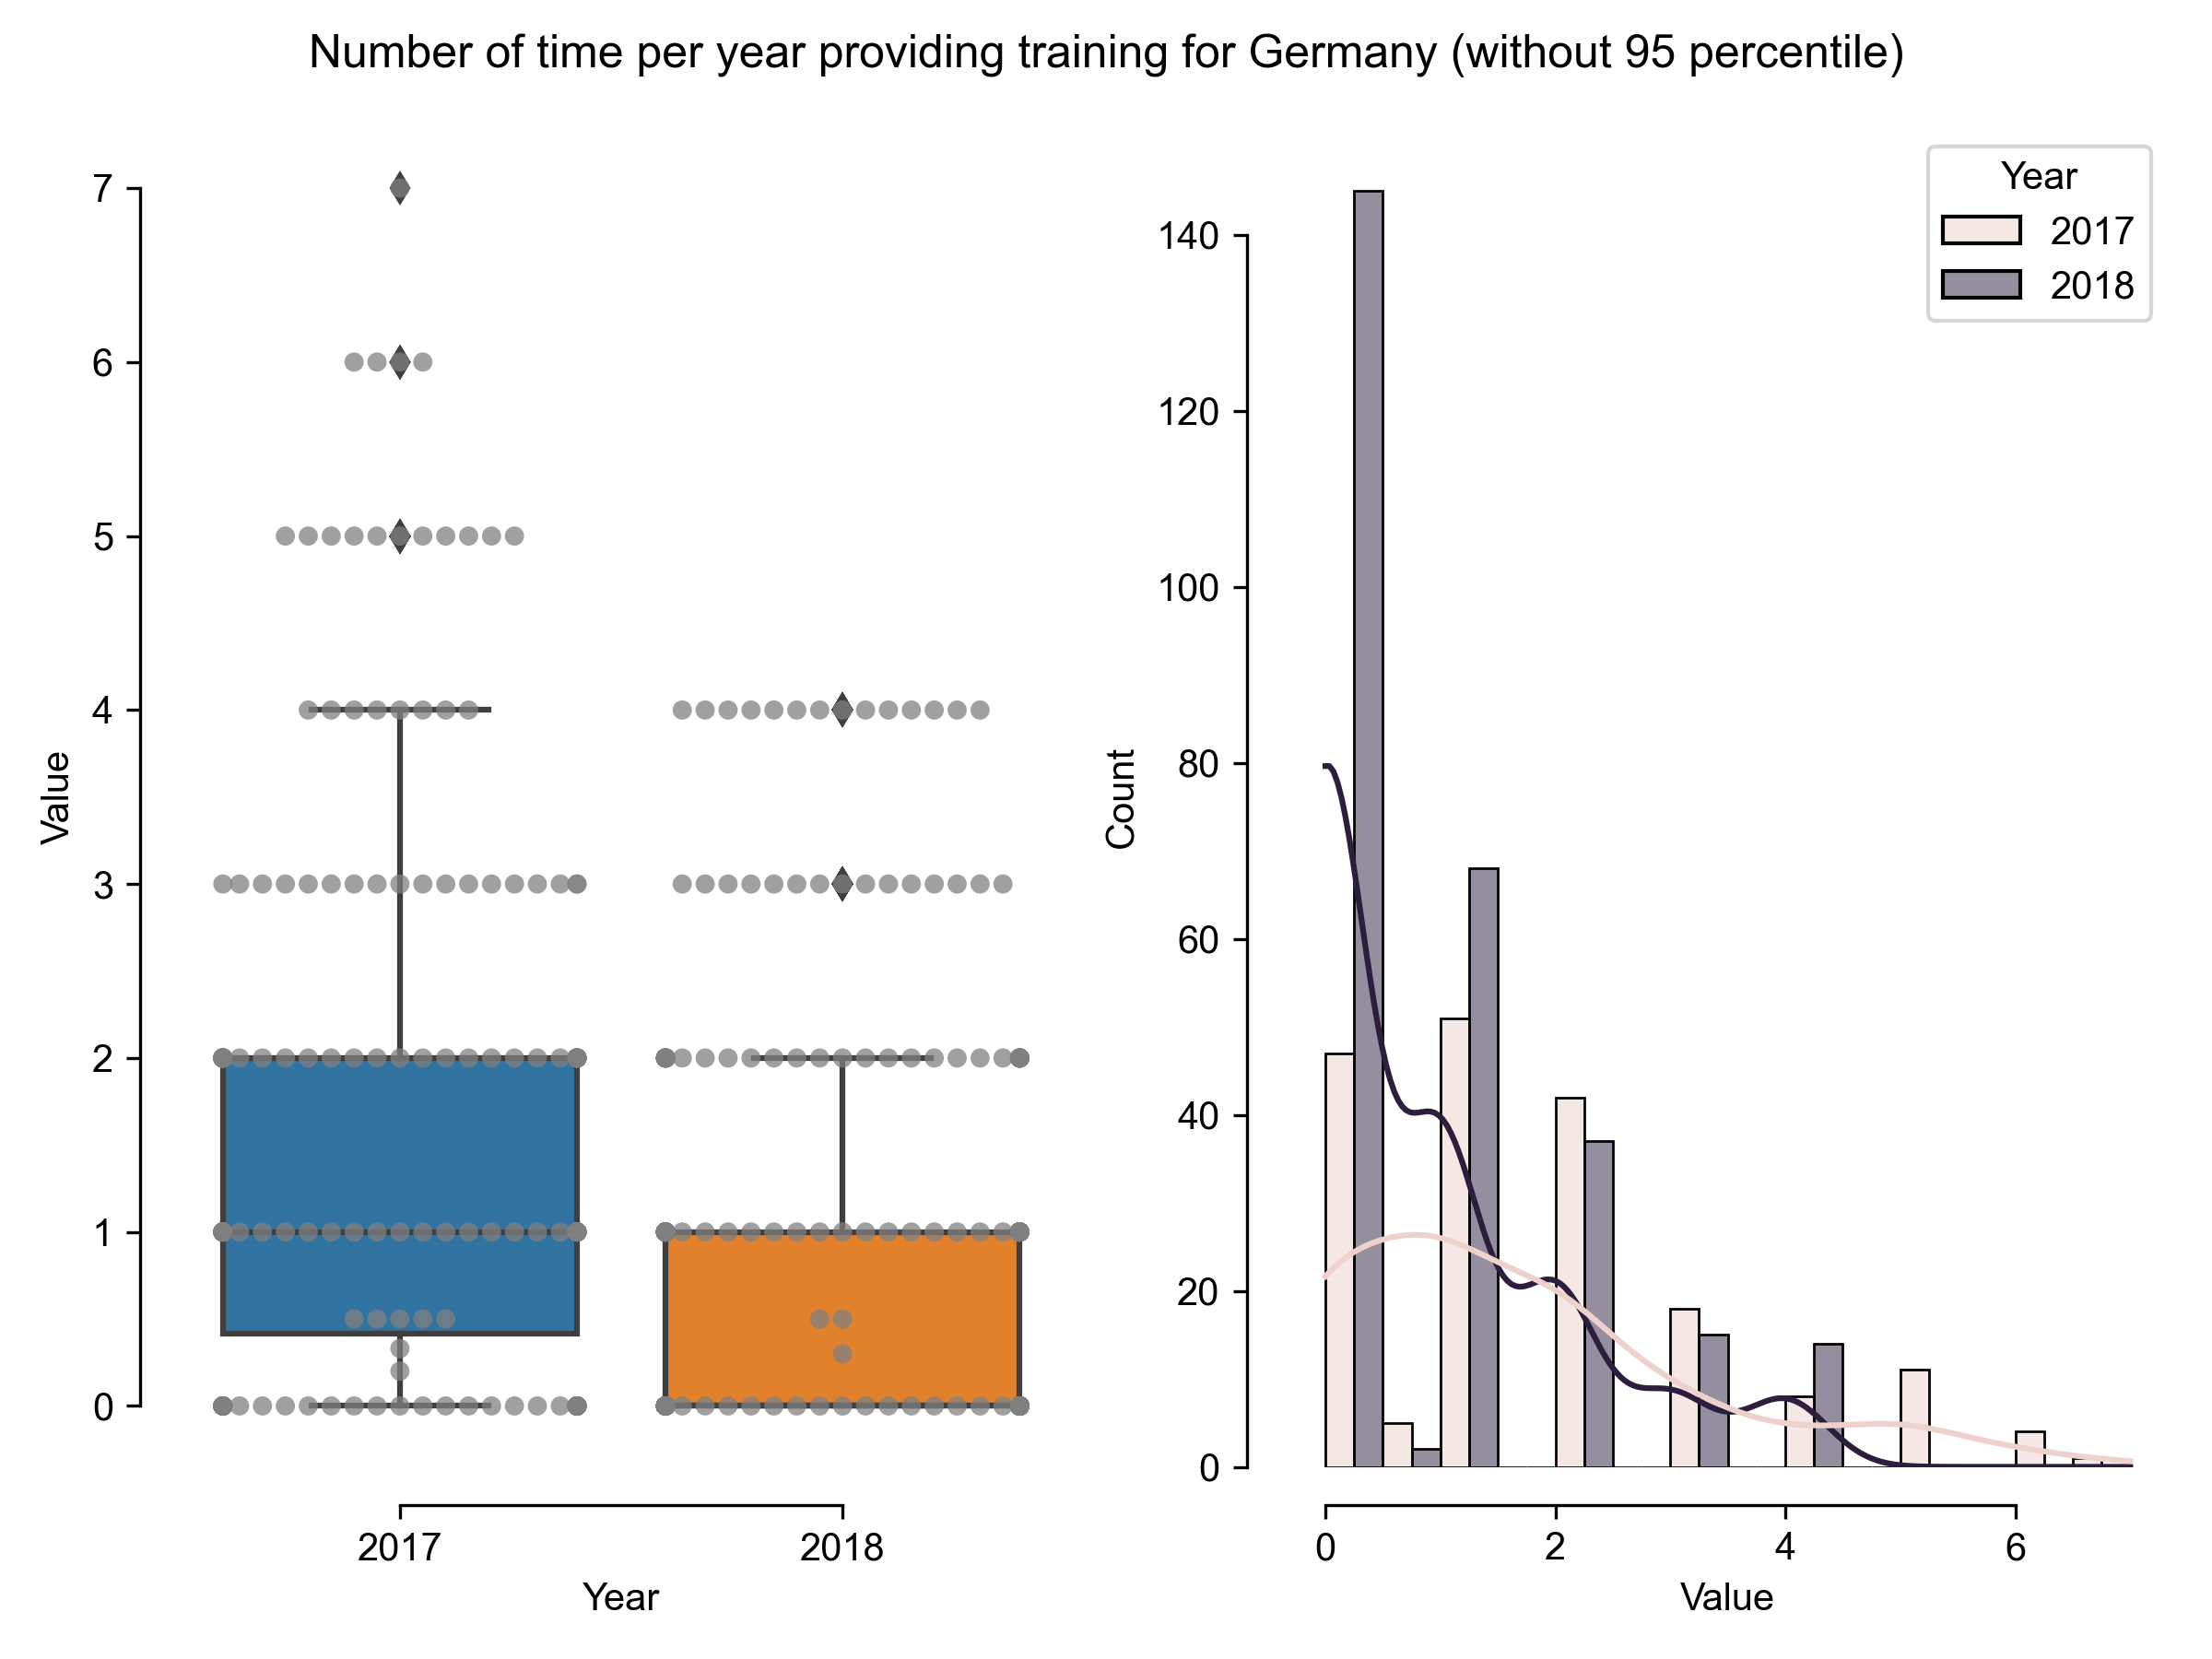
| Number of time per year providing training for Germany (without 95 percentile) |
Results in 2018 |
Results in 2017 |
| count |
281 |
187 |
| mean |
0.869395 |
1.65791 |
| std |
1.13892 |
1.58011 |
| min |
0 |
0 |
| 25% |
0 |
0.415 |
| 50% |
0 |
1 |
| 75% |
1 |
2 |
| max |
4 |
7 |
Download CSV
PNG SVG
PNG SVG
Netherlands
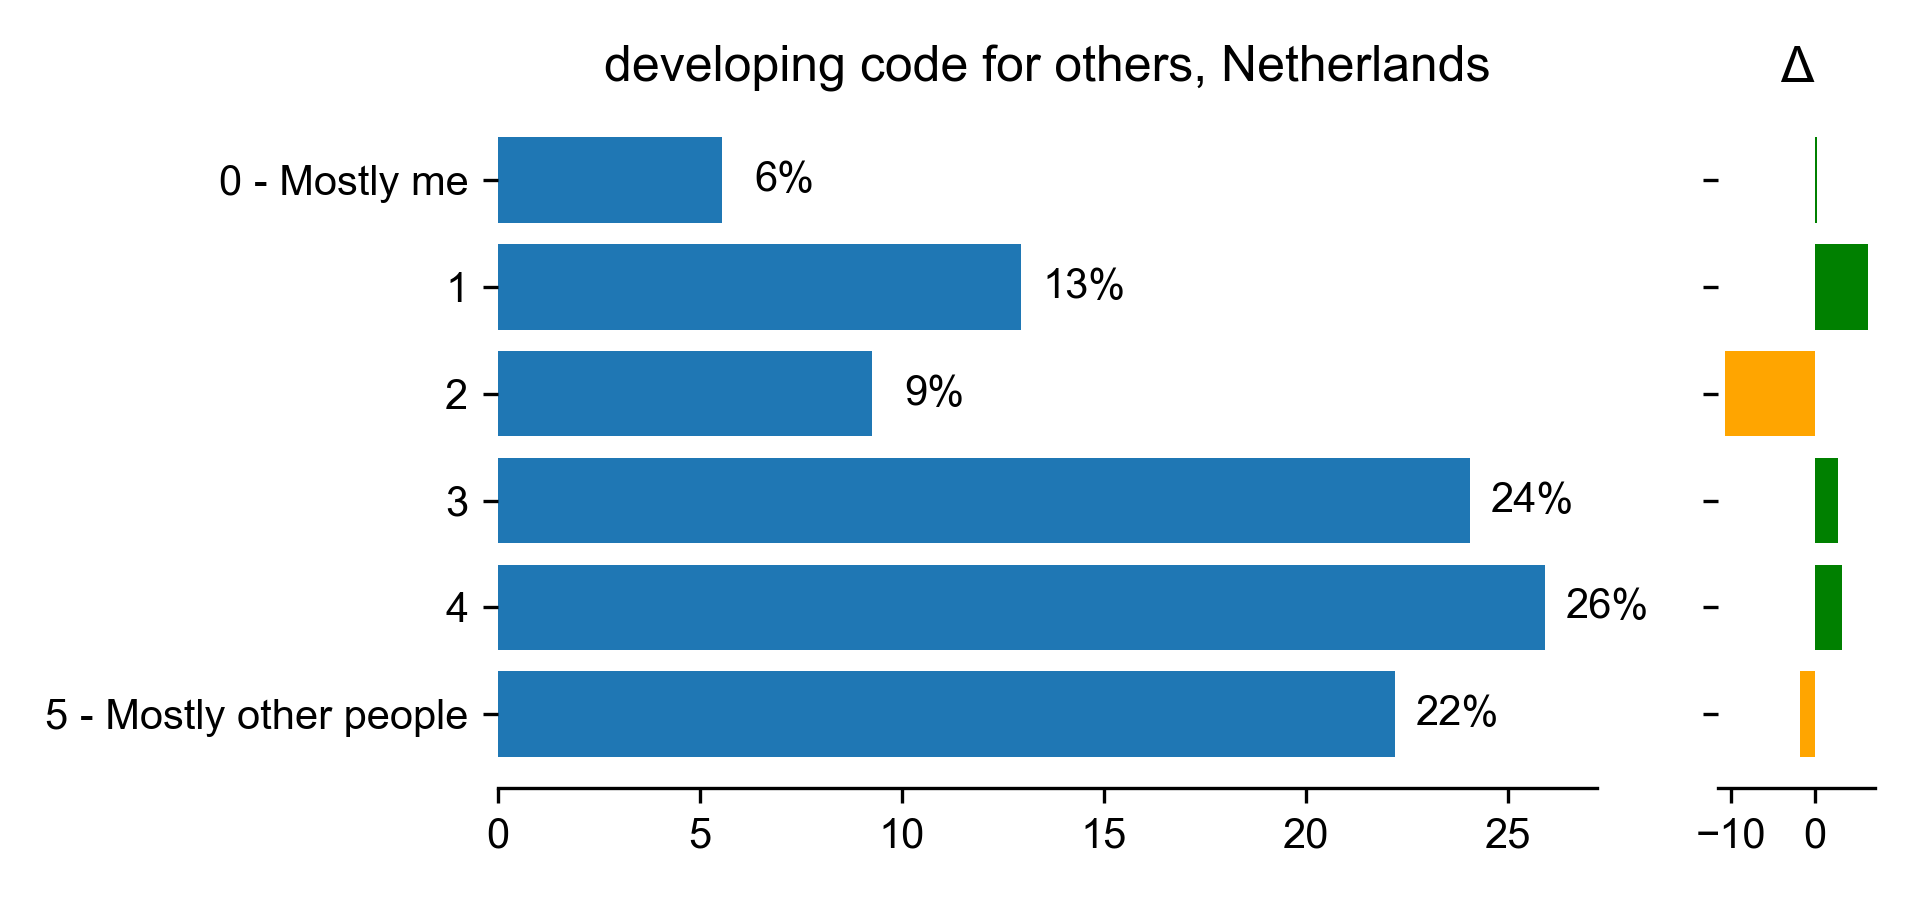
Developing code for others
| developing code for others for Netherlands |
Count |
Percentage |
Percentage in 2017 |
Difference with previous year |
| 0 - Mostly me |
3 |
5.55556 |
5.33333 |
0.222222 |
| 1 |
7 |
12.963 |
6.66667 |
6.2963 |
| 2 |
5 |
9.25926 |
20 |
-10.7407 |
| 3 |
13 |
24.0741 |
21.3333 |
2.74074 |
| 4 |
14 |
25.9259 |
22.6667 |
3.25926 |
| 5 - Mostly other people |
12 |
22.2222 |
24 |
-1.77778 |
Download CSV
PNG SVG
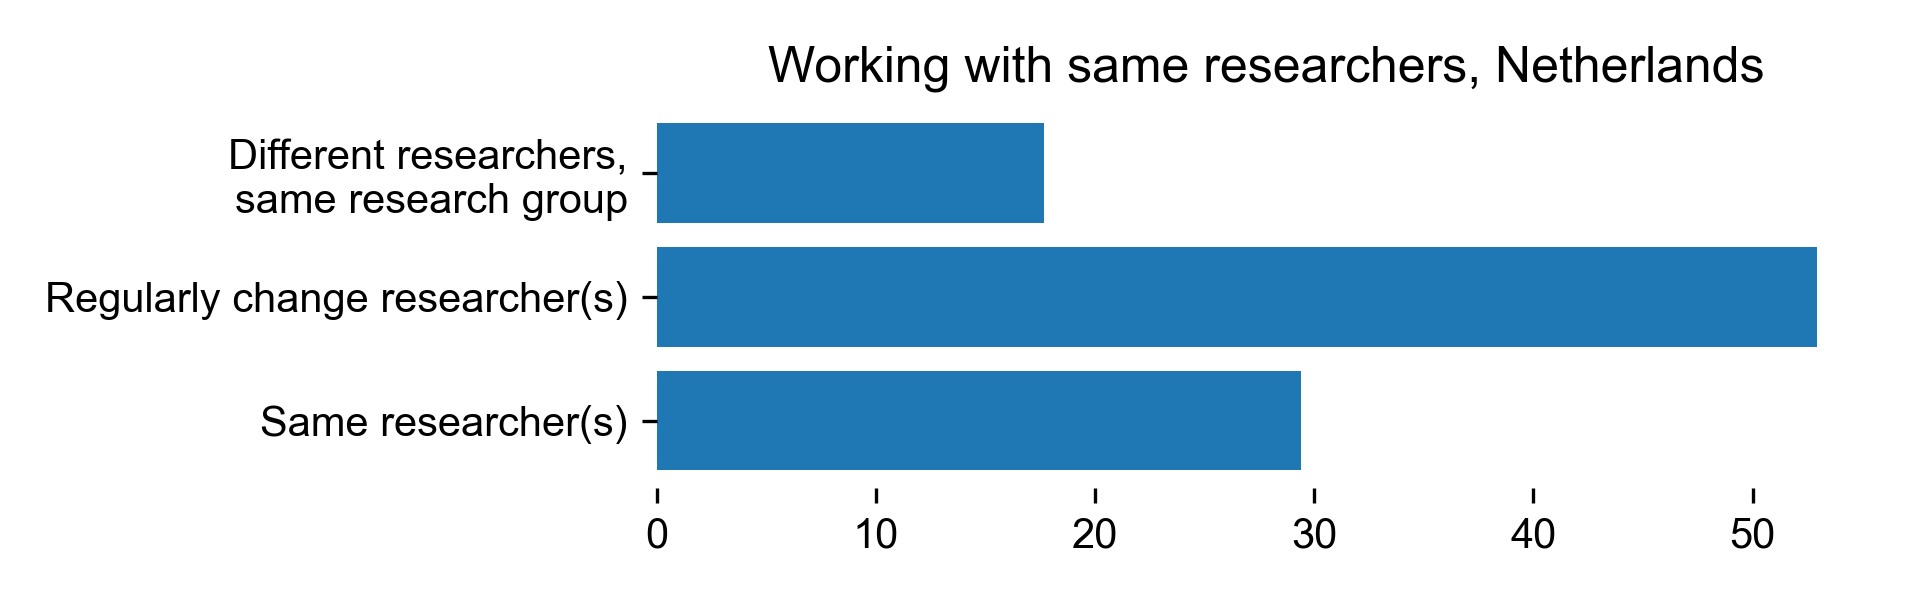
Working with same researchers
| Working with same researchers for Netherlands |
Count |
Percentage |
| Different researchers, same research group |
9 |
17.6471 |
| Regularly change researcher(s) |
27 |
52.9412 |
| Same researcher(s) |
15 |
29.4118 |
Download CSV
PNG SVG
Part of dedicated group
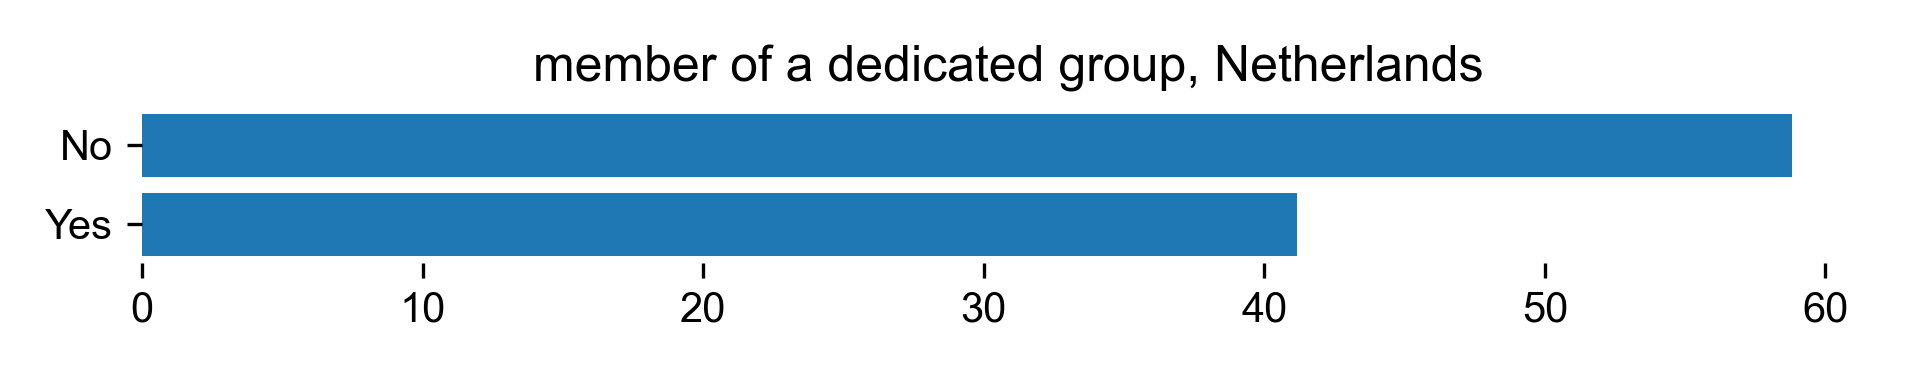
| member of a dedicated group for Netherlands |
Count |
Percentage |
| No |
30 |
58.8235 |
| Yes |
21 |
41.1765 |
Download CSV
PNG SVG
Number of projects
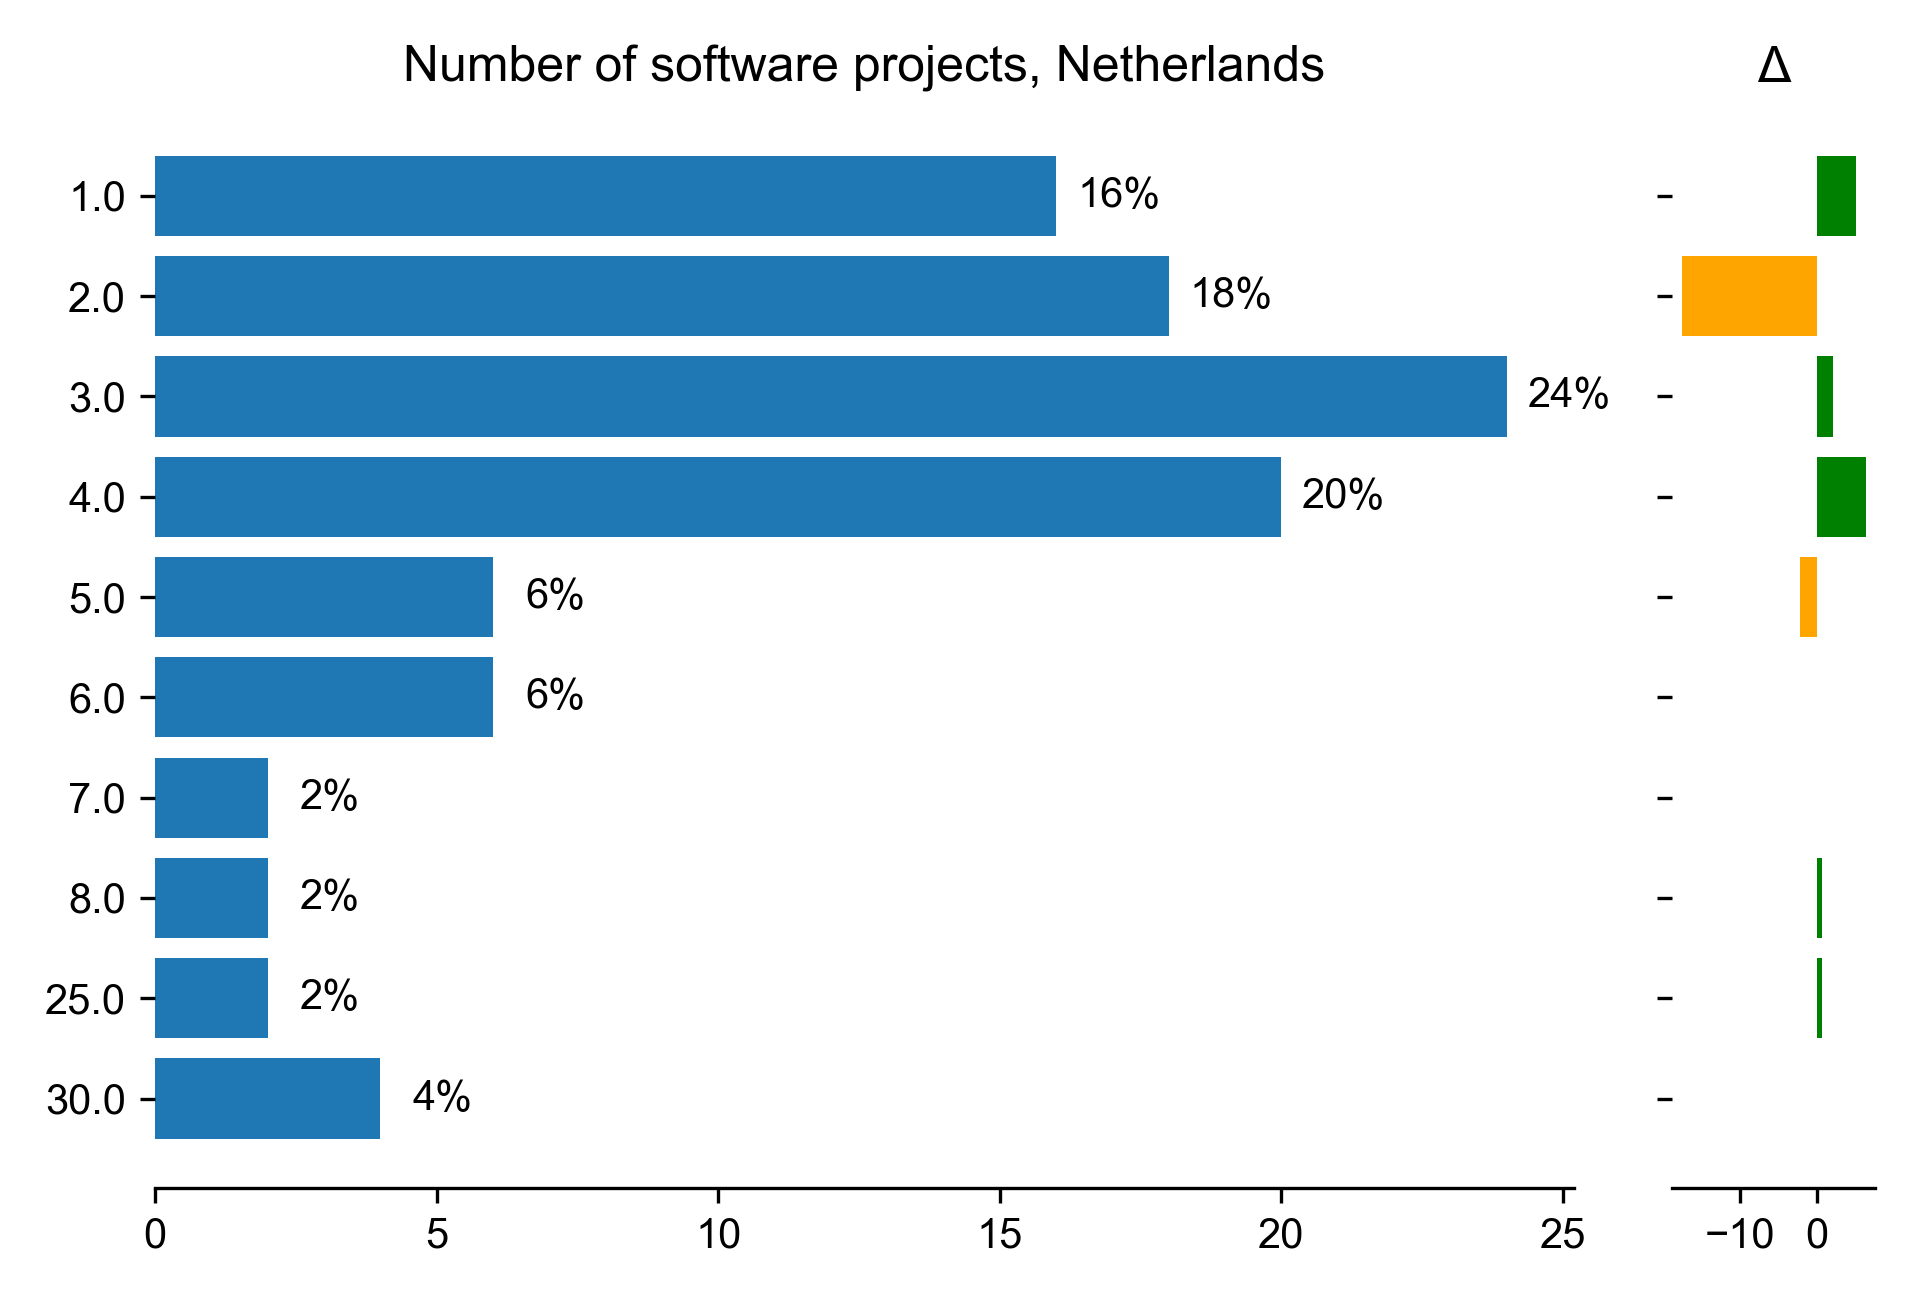
| Number of software projects for Netherlands |
Count |
Percentage |
Percentage in 2017 |
Difference with previous year |
| 1 |
8 |
16 |
10.9589 |
5.0411 |
| 2 |
9 |
18 |
35.6164 |
-17.6164 |
| 3 |
12 |
24 |
21.9178 |
2.08219 |
| 4 |
10 |
20 |
13.6986 |
6.30137 |
| 5 |
3 |
6 |
8.21918 |
-2.21918 |
| 6 |
3 |
6 |
nan |
nan |
| 7 |
1 |
2 |
nan |
nan |
| 8 |
1 |
2 |
1.36986 |
0.630137 |
| 25 |
1 |
2 |
1.36986 |
0.630137 |
| 30 |
2 |
4 |
nan |
nan |
Download CSV
PNG SVG
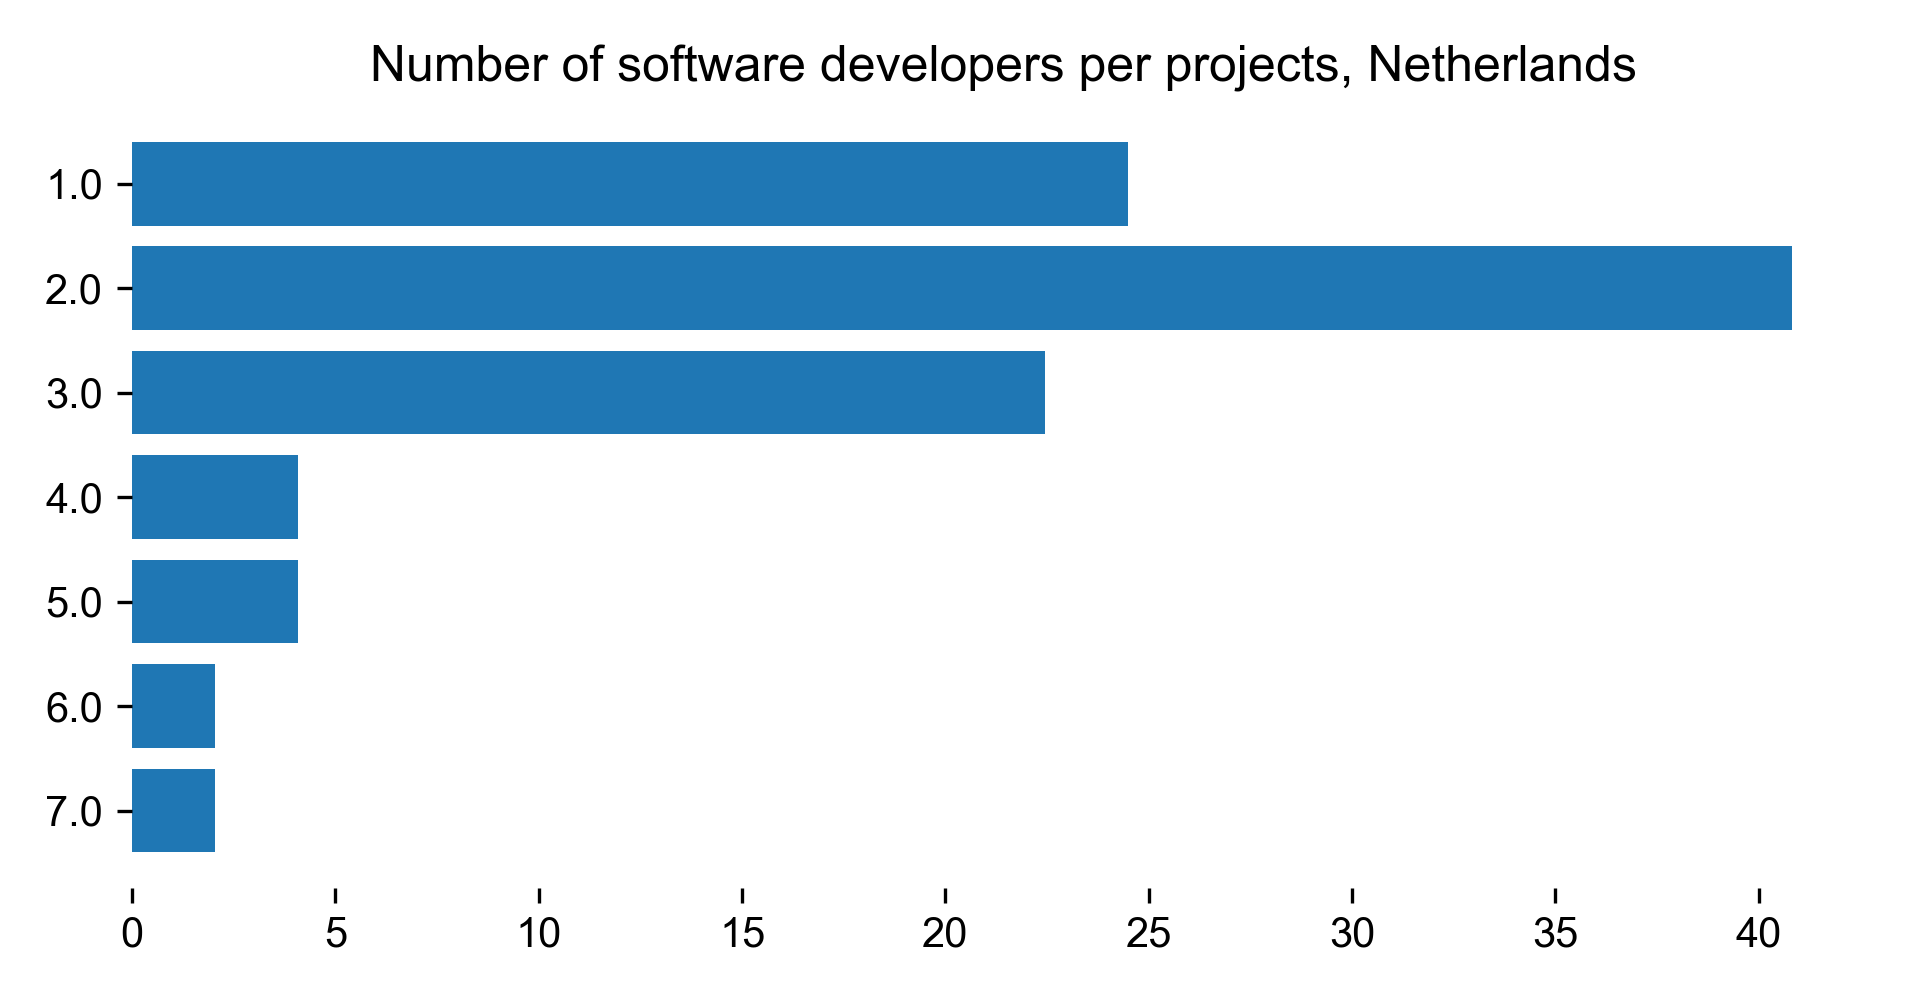
| Number of software developers per projects for Netherlands |
Count |
Percentage |
| 1 |
12 |
24.4898 |
| 2 |
20 |
40.8163 |
| 3 |
11 |
22.449 |
| 4 |
2 |
4.08163 |
| 5 |
2 |
4.08163 |
| 6 |
1 |
2.04082 |
| 7 |
1 |
2.04082 |
Download CSV
PNG SVG
Training
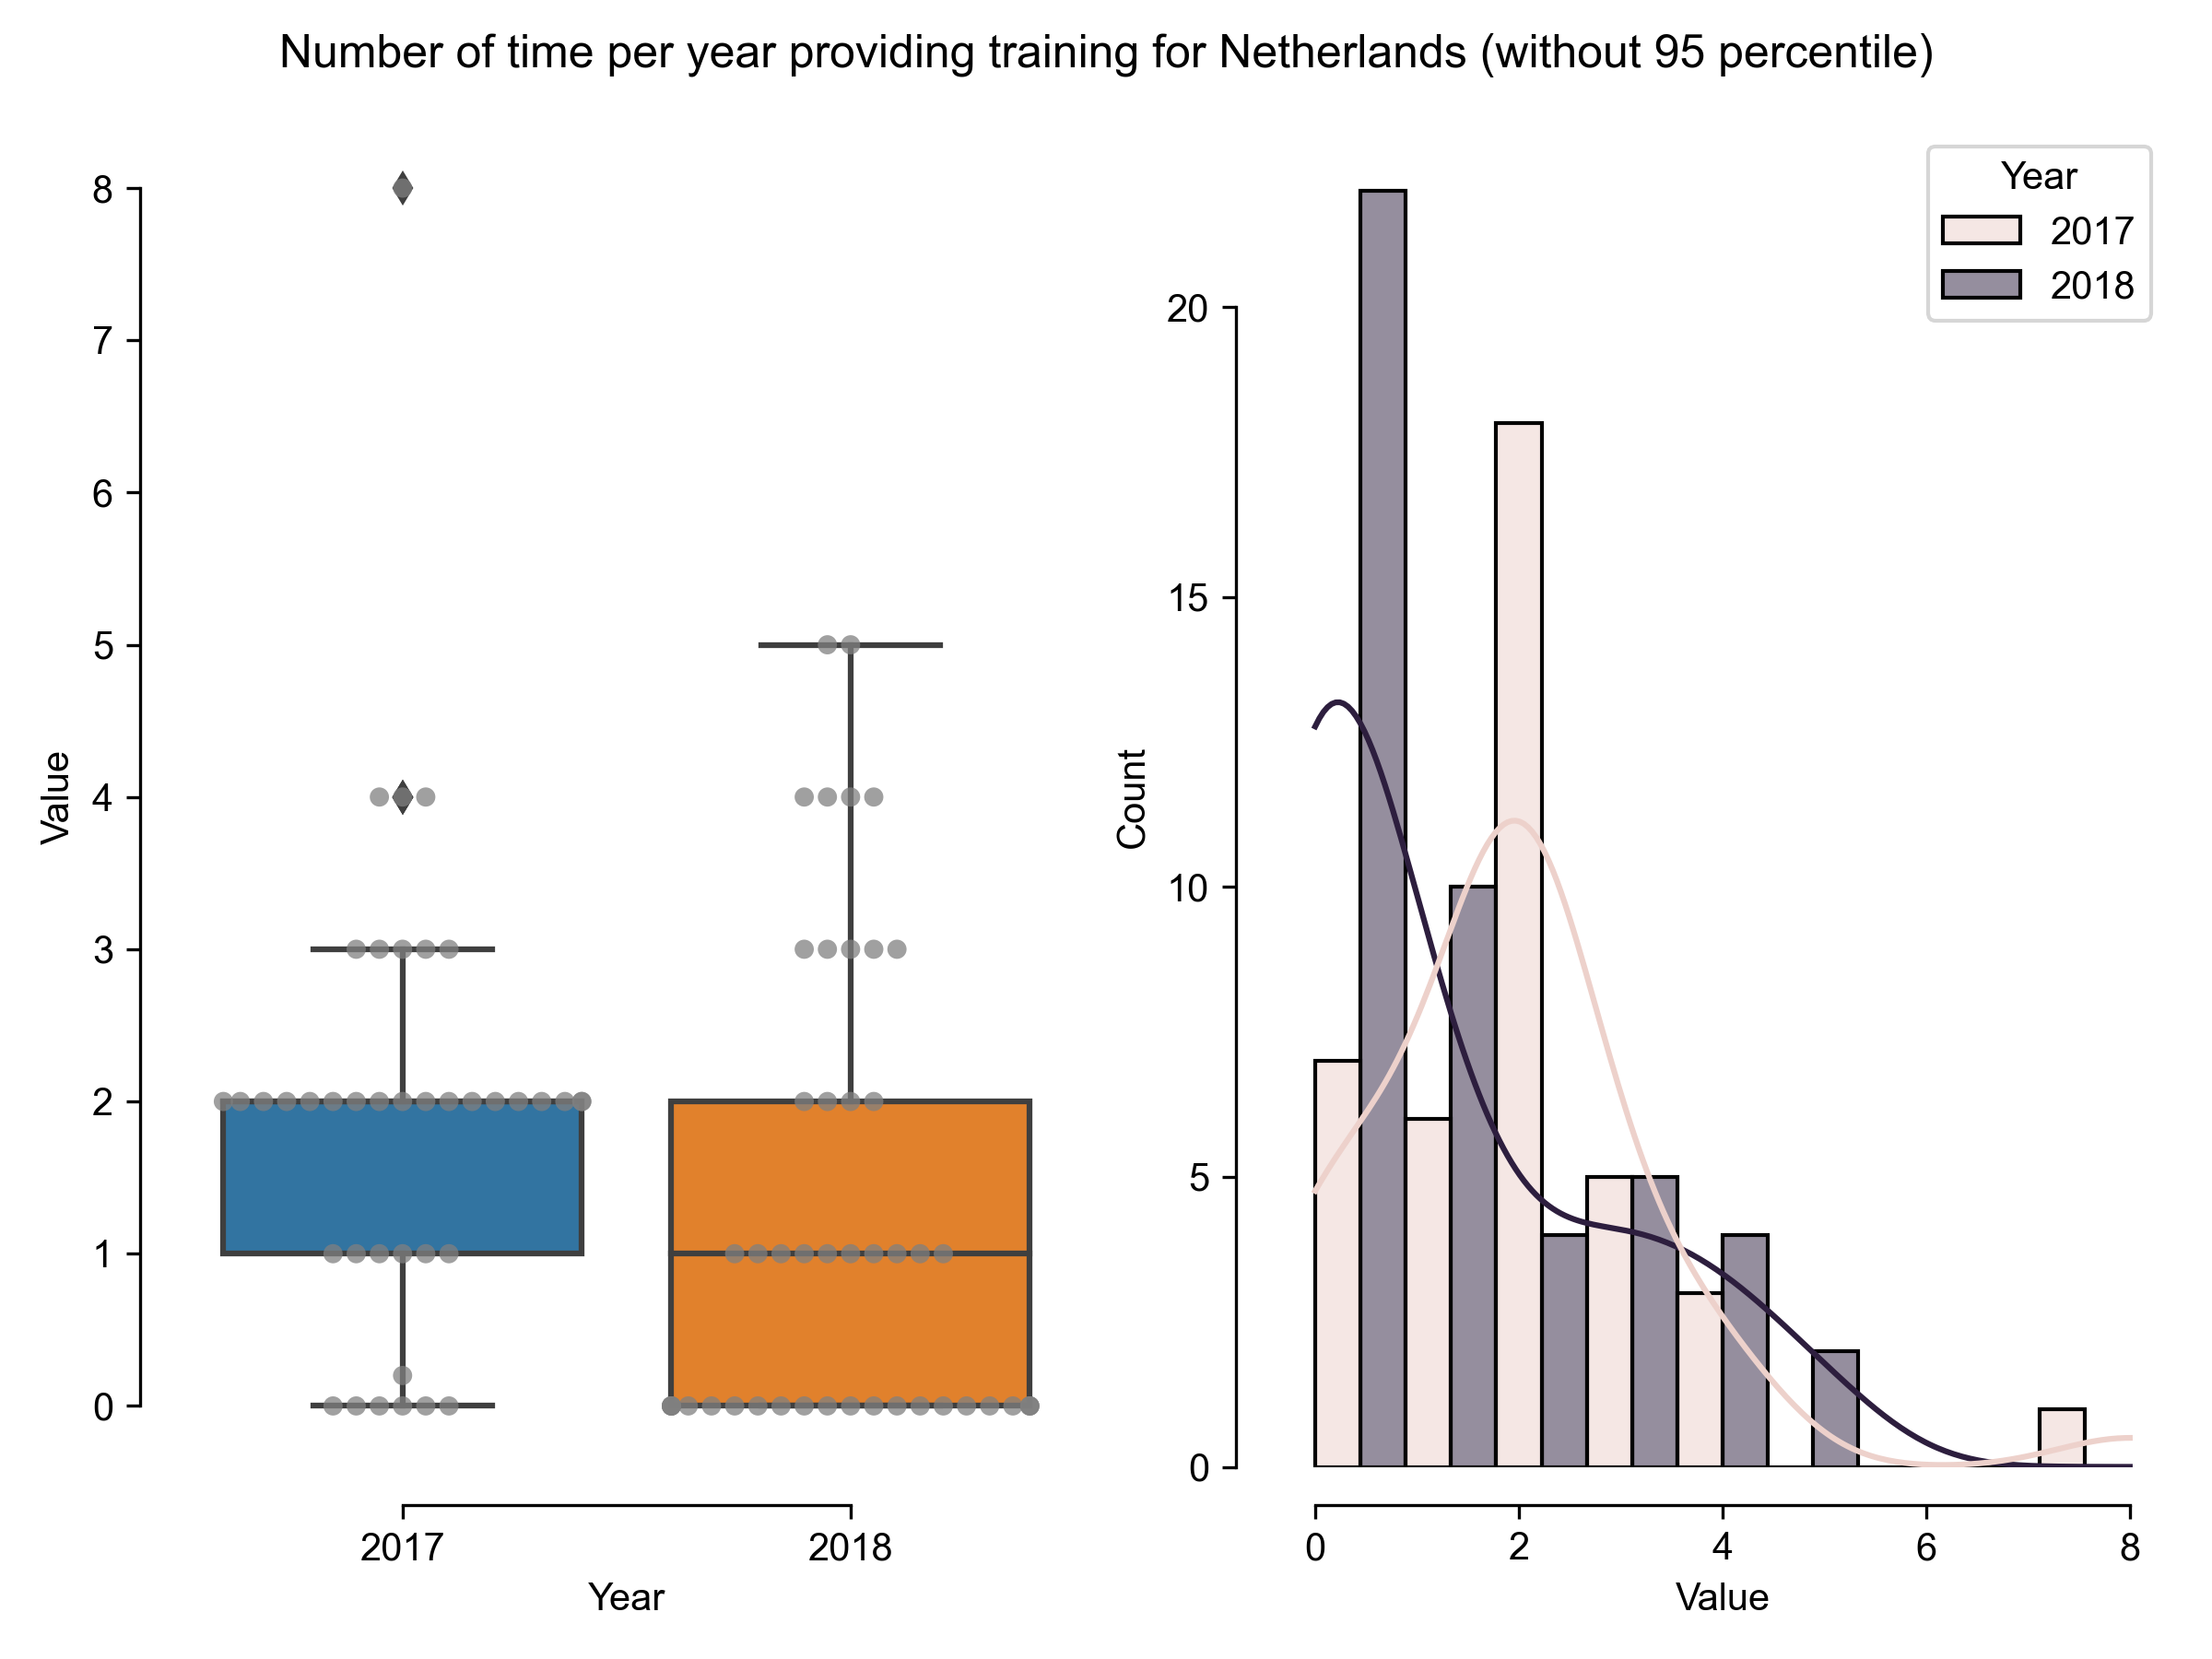
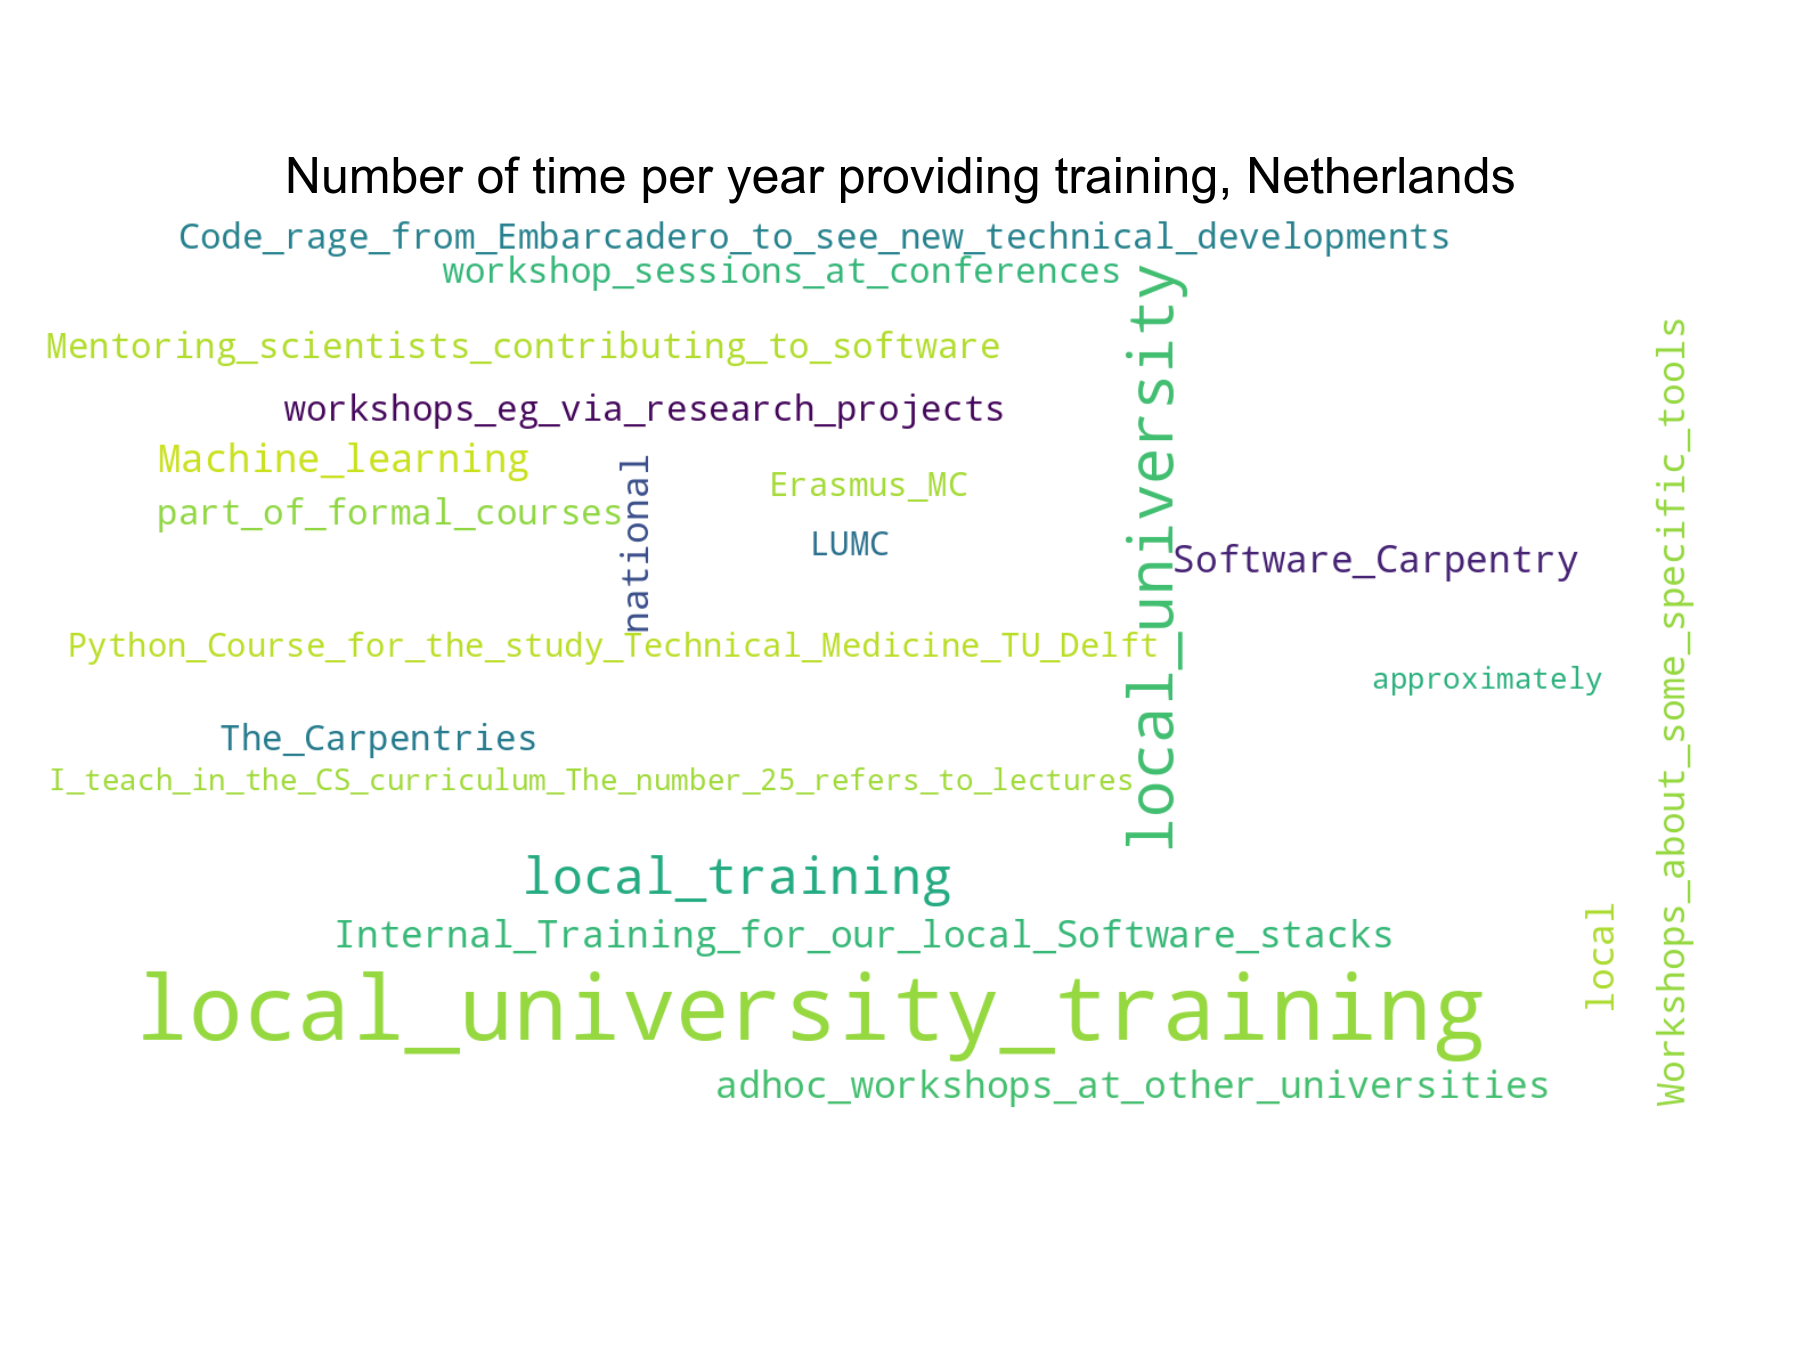
| Number of time per year providing training for Netherlands (without 95 percentile) |
Results in 2018 |
Results in 2017 |
| count |
47 |
40 |
| mean |
1.25532 |
1.93 |
| std |
1.55295 |
1.48535 |
| min |
0 |
0 |
| 25% |
0 |
1 |
| 50% |
1 |
2 |
| 75% |
2 |
2 |
| max |
5 |
8 |
Download CSV
PNG SVG
PNG SVG
New Zealand
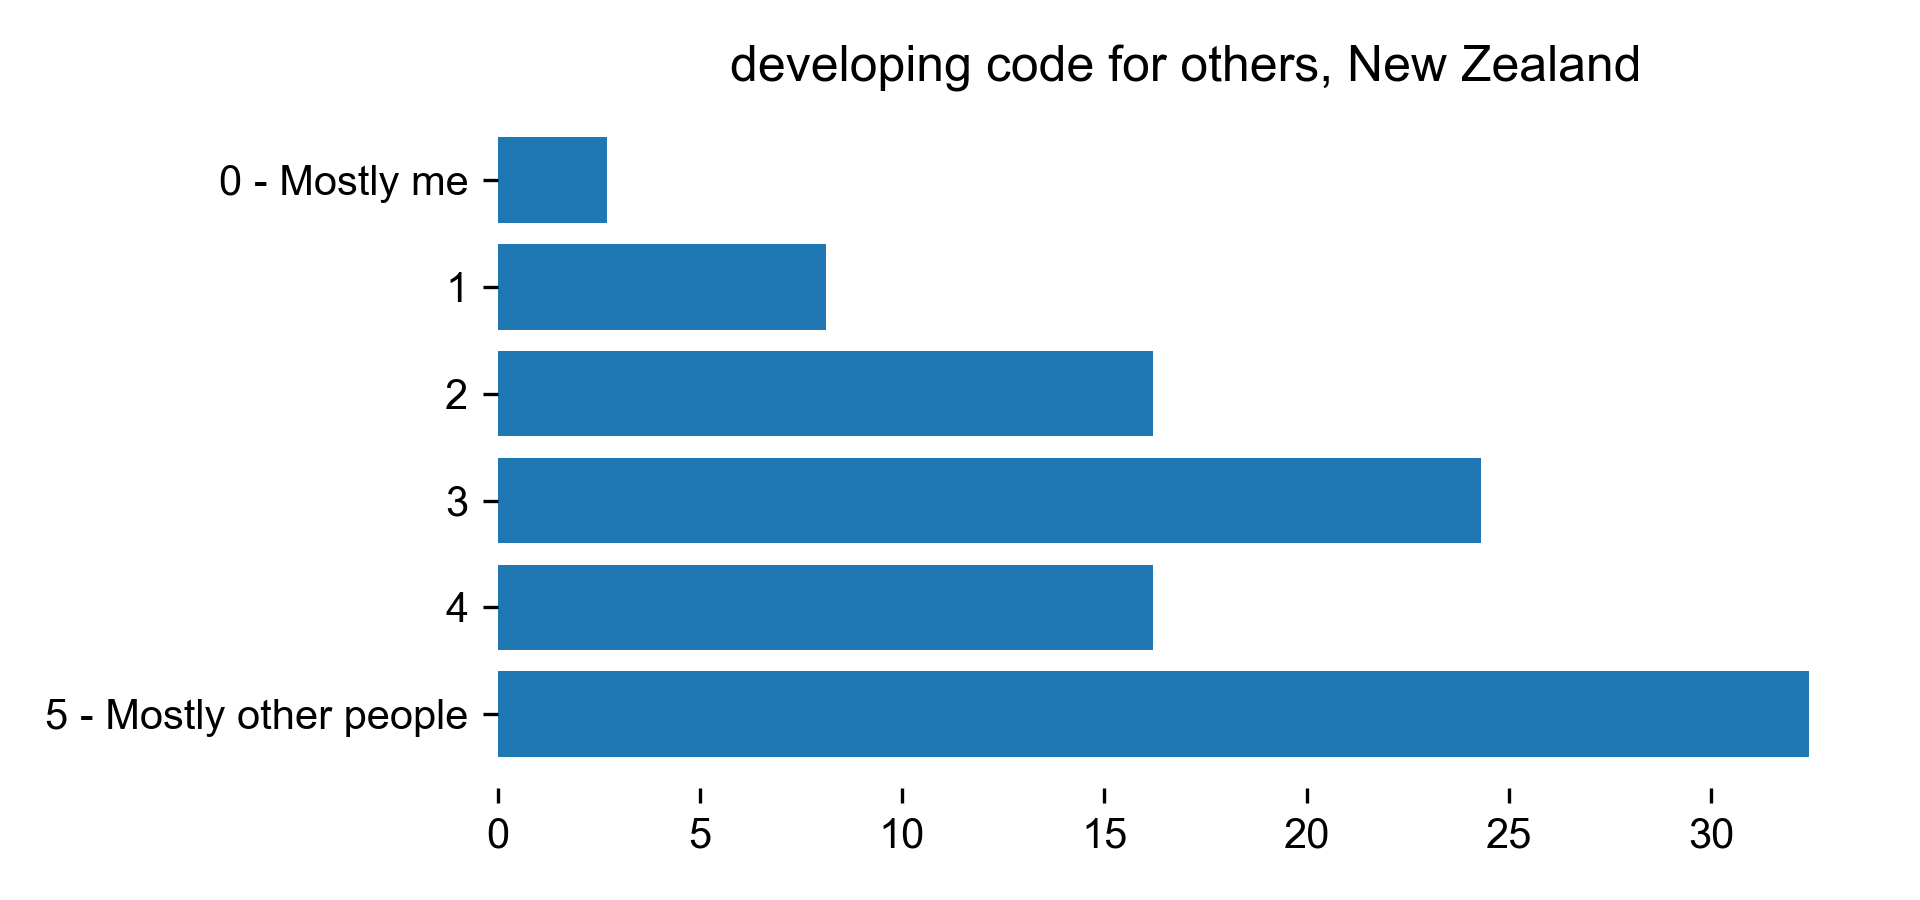
Developing code for others
| developing code for others for New Zealand |
Count |
Percentage |
| 0 - Mostly me |
1 |
2.7027 |
| 1 |
3 |
8.10811 |
| 2 |
6 |
16.2162 |
| 3 |
9 |
24.3243 |
| 4 |
6 |
16.2162 |
| 5 - Mostly other people |
12 |
32.4324 |
Download CSV
PNG SVG
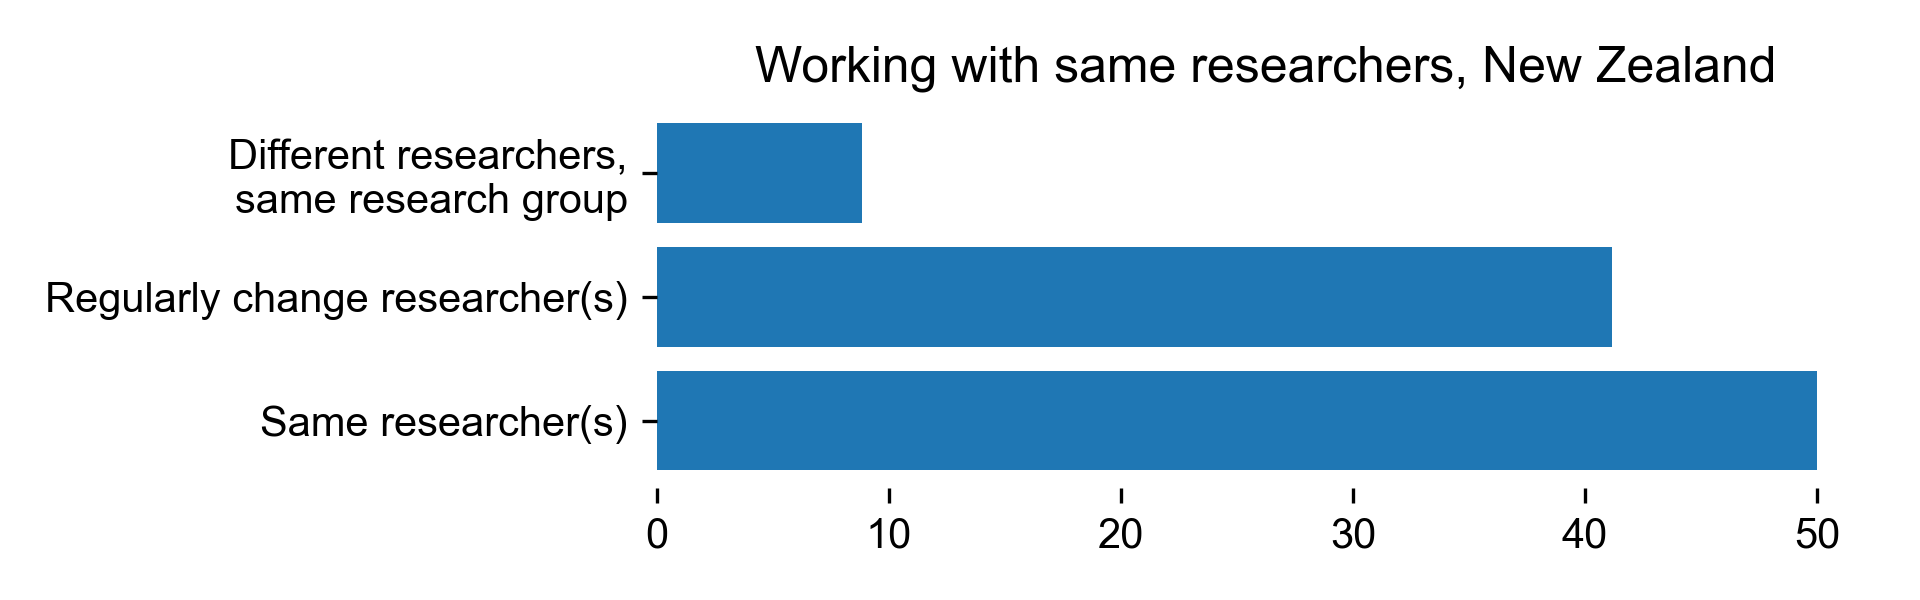
Working with same researchers
| Working with same researchers for New Zealand |
Count |
Percentage |
| Different researchers, same research group |
3 |
8.82353 |
| Regularly change researcher(s) |
14 |
41.1765 |
| Same researcher(s) |
17 |
50 |
Download CSV
PNG SVG
Part of dedicated group
| member of a dedicated group for New Zealand |
Count |
Percentage |
| No |
20 |
58.8235 |
| Yes |
14 |
41.1765 |
Download CSV
PNG SVG
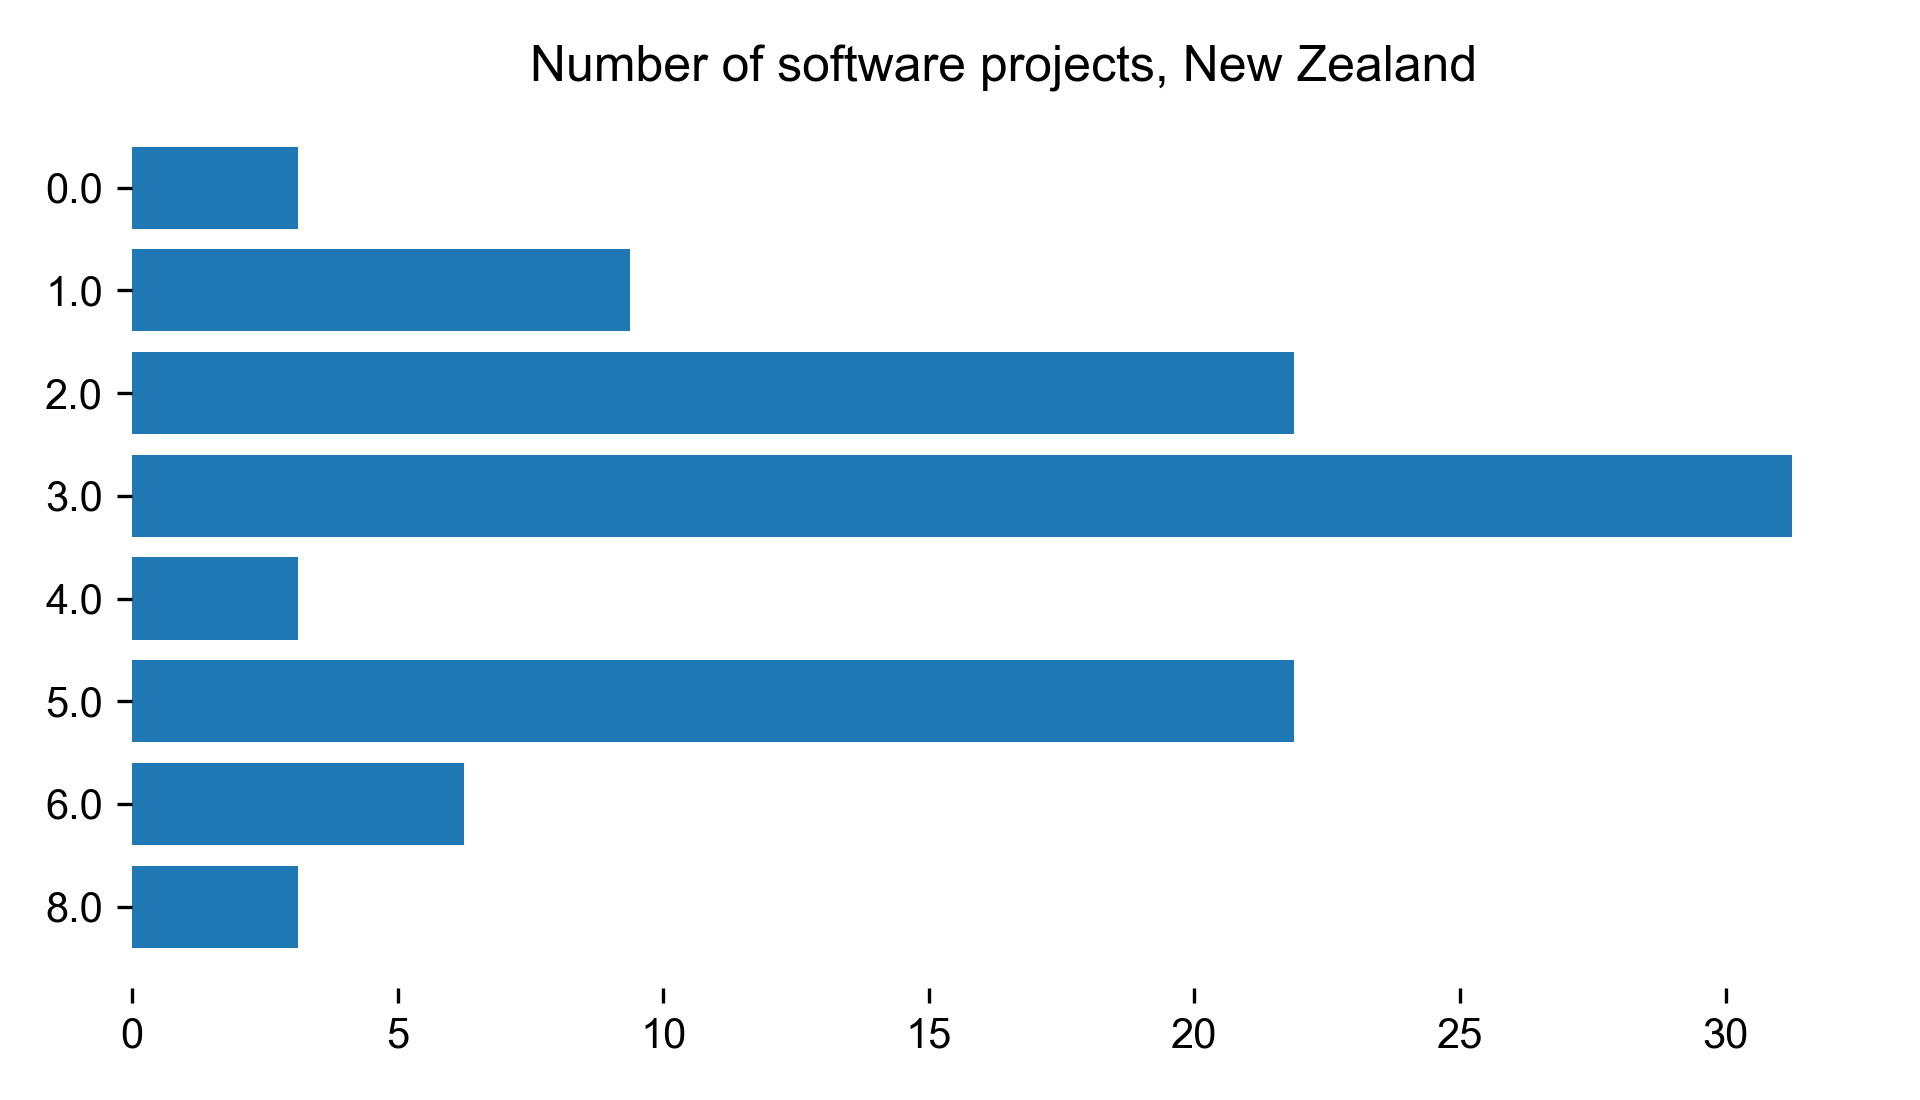
Number of projects
| Number of software projects for New Zealand |
Count |
Percentage |
| 0 |
1 |
3.125 |
| 1 |
3 |
9.375 |
| 2 |
7 |
21.875 |
| 3 |
10 |
31.25 |
| 4 |
1 |
3.125 |
| 5 |
7 |
21.875 |
| 6 |
2 |
6.25 |
| 8 |
1 |
3.125 |
Download CSV
PNG SVG
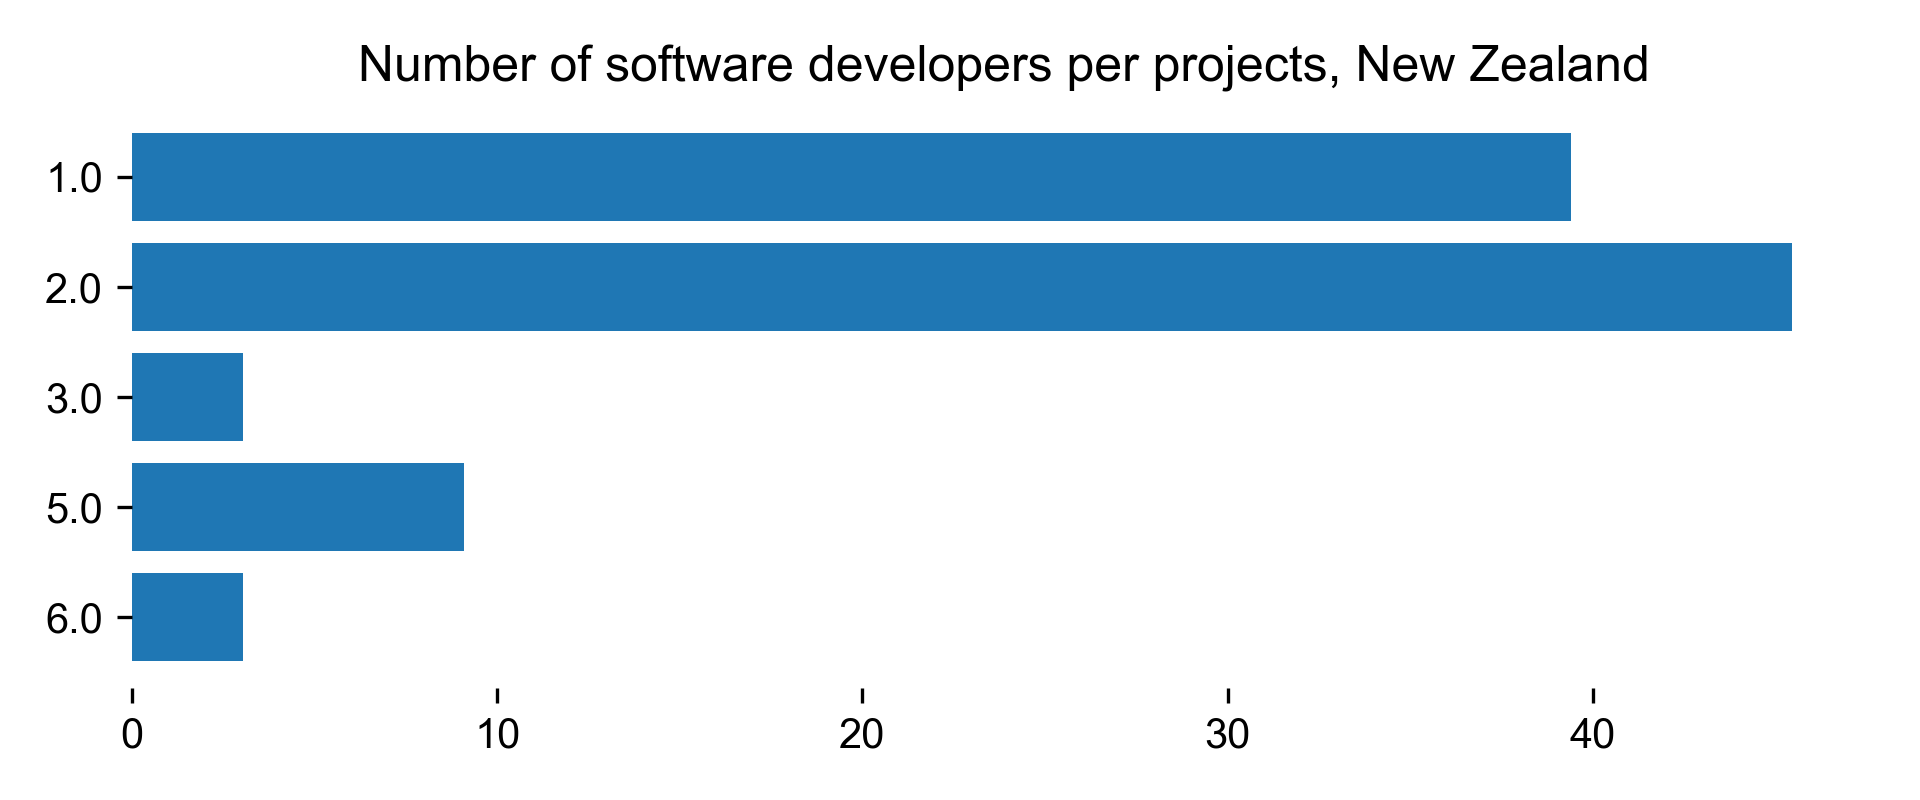
| Number of software developers per projects for New Zealand |
Count |
Percentage |
| 1 |
13 |
39.3939 |
| 2 |
15 |
45.4545 |
| 3 |
1 |
3.0303 |
| 5 |
3 |
9.09091 |
| 6 |
1 |
3.0303 |
Download CSV
PNG SVG
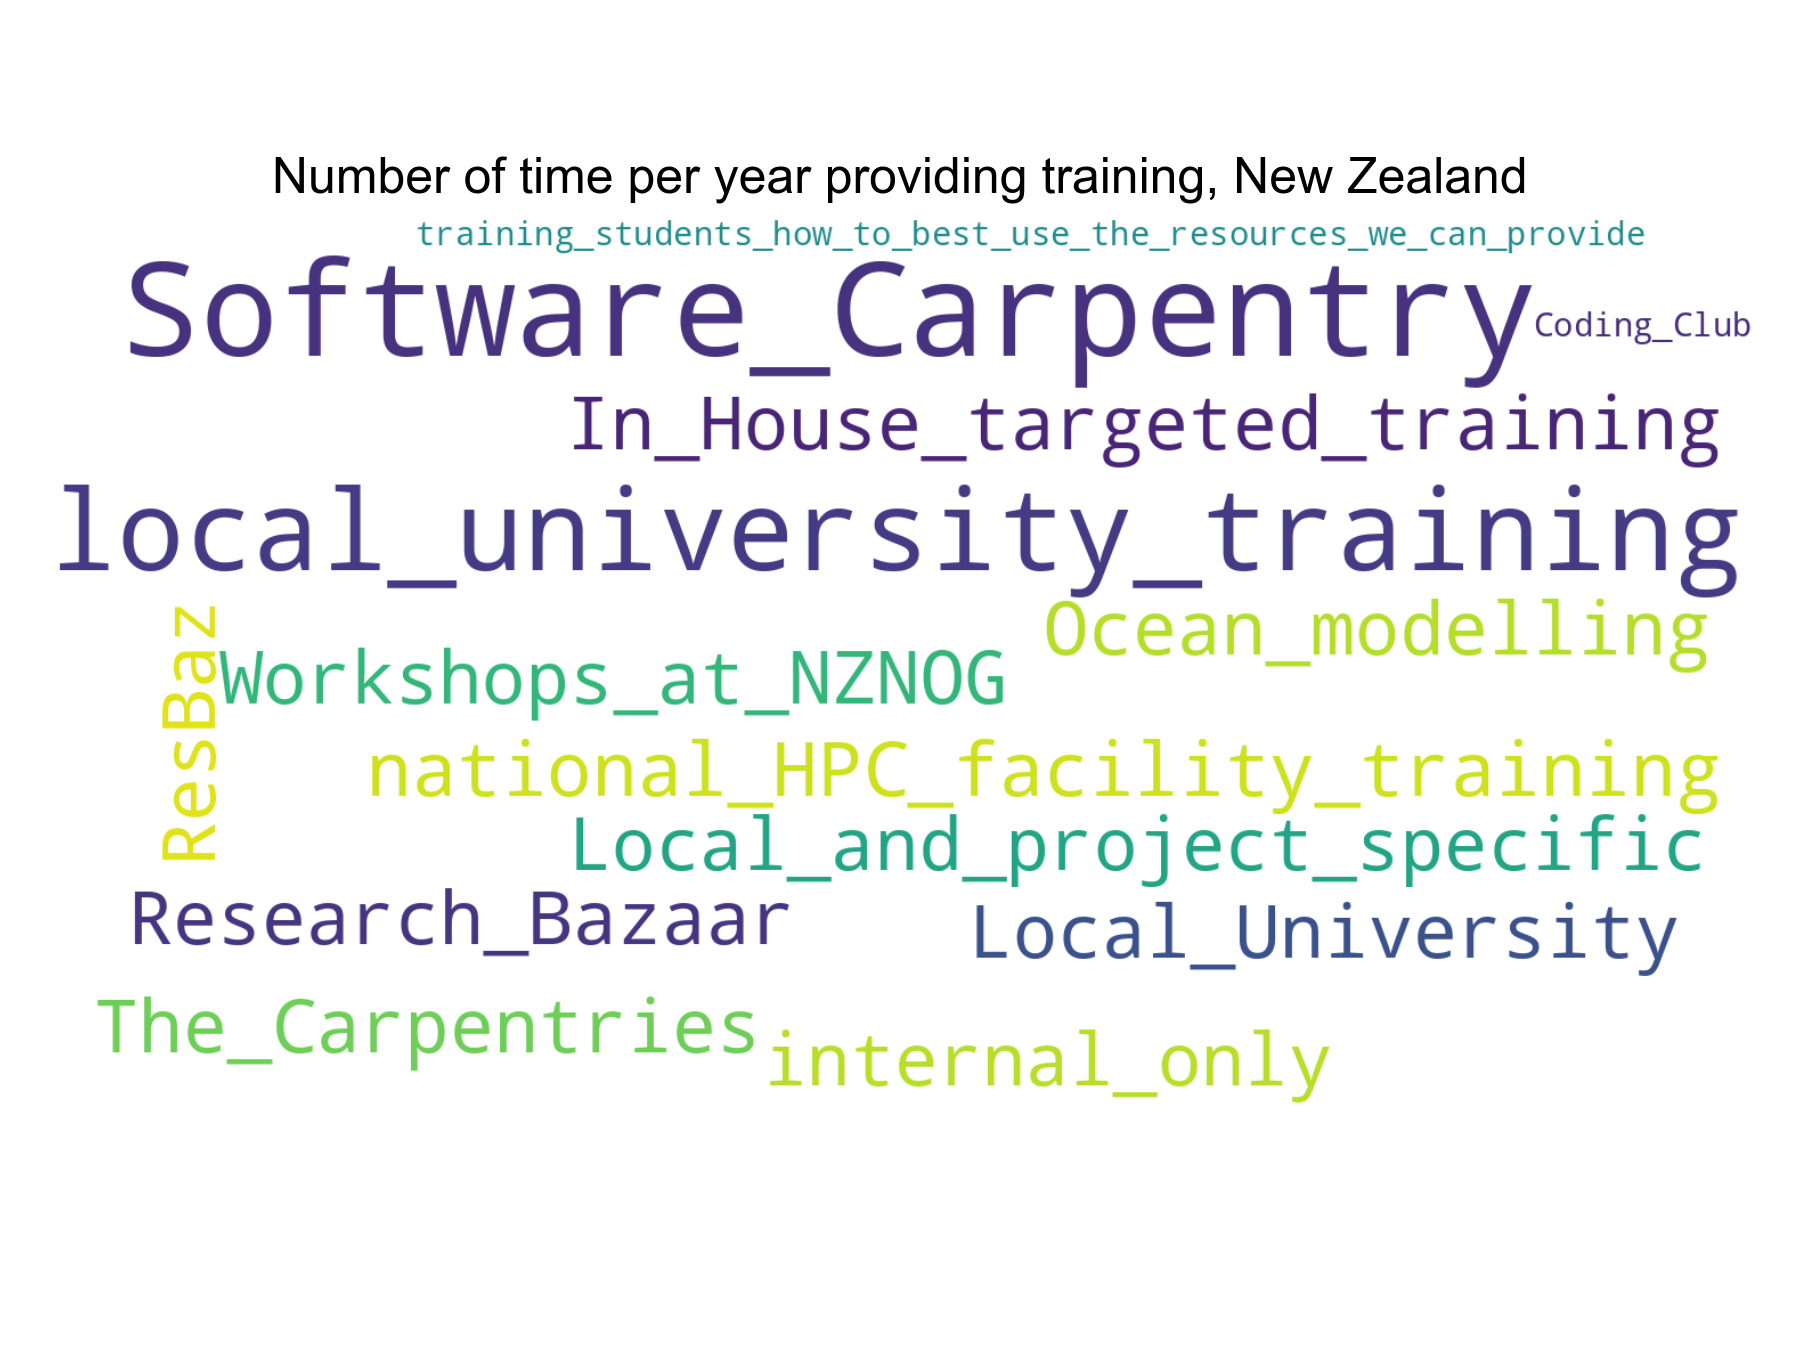
Training
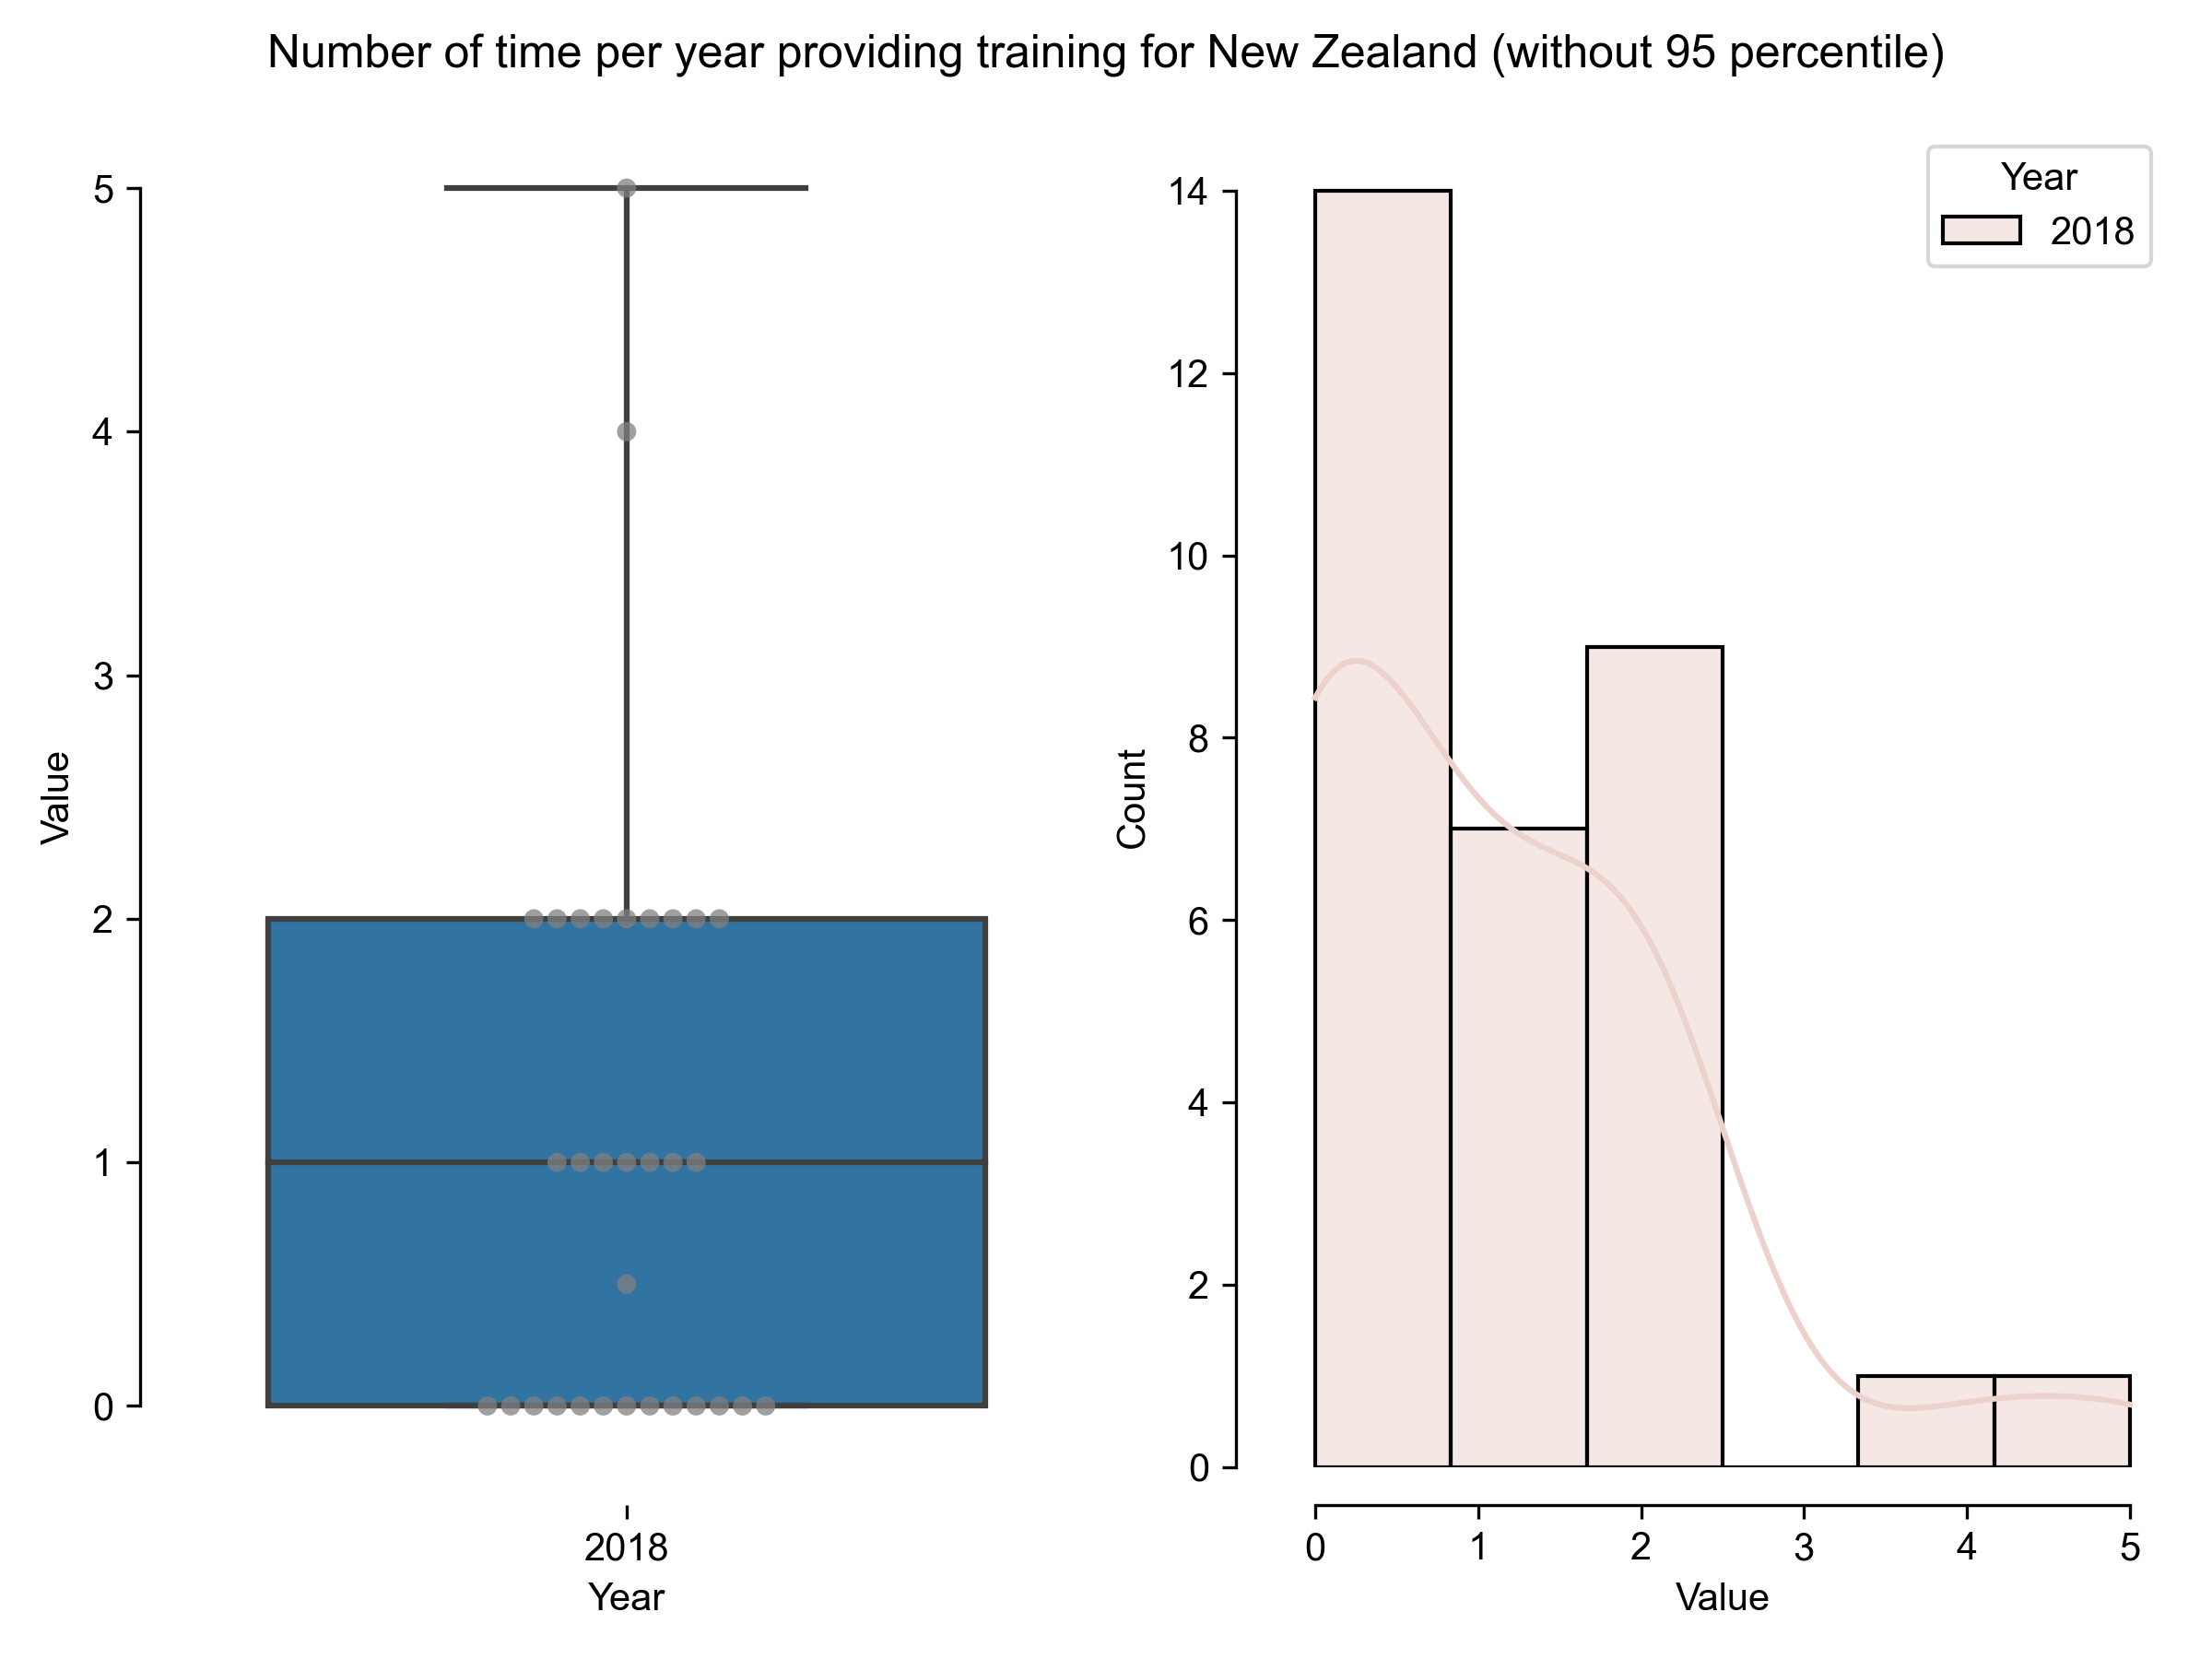
| Number of time per year providing training for New Zealand (without 95 percentile) |
Results in 2018 |
| count |
32 |
| mean |
1.07812 |
| std |
1.23203 |
| min |
0 |
| 25% |
0 |
| 50% |
1 |
| 75% |
2 |
| max |
5 |
Download CSV
PNG SVG
PNG SVG
South Africa
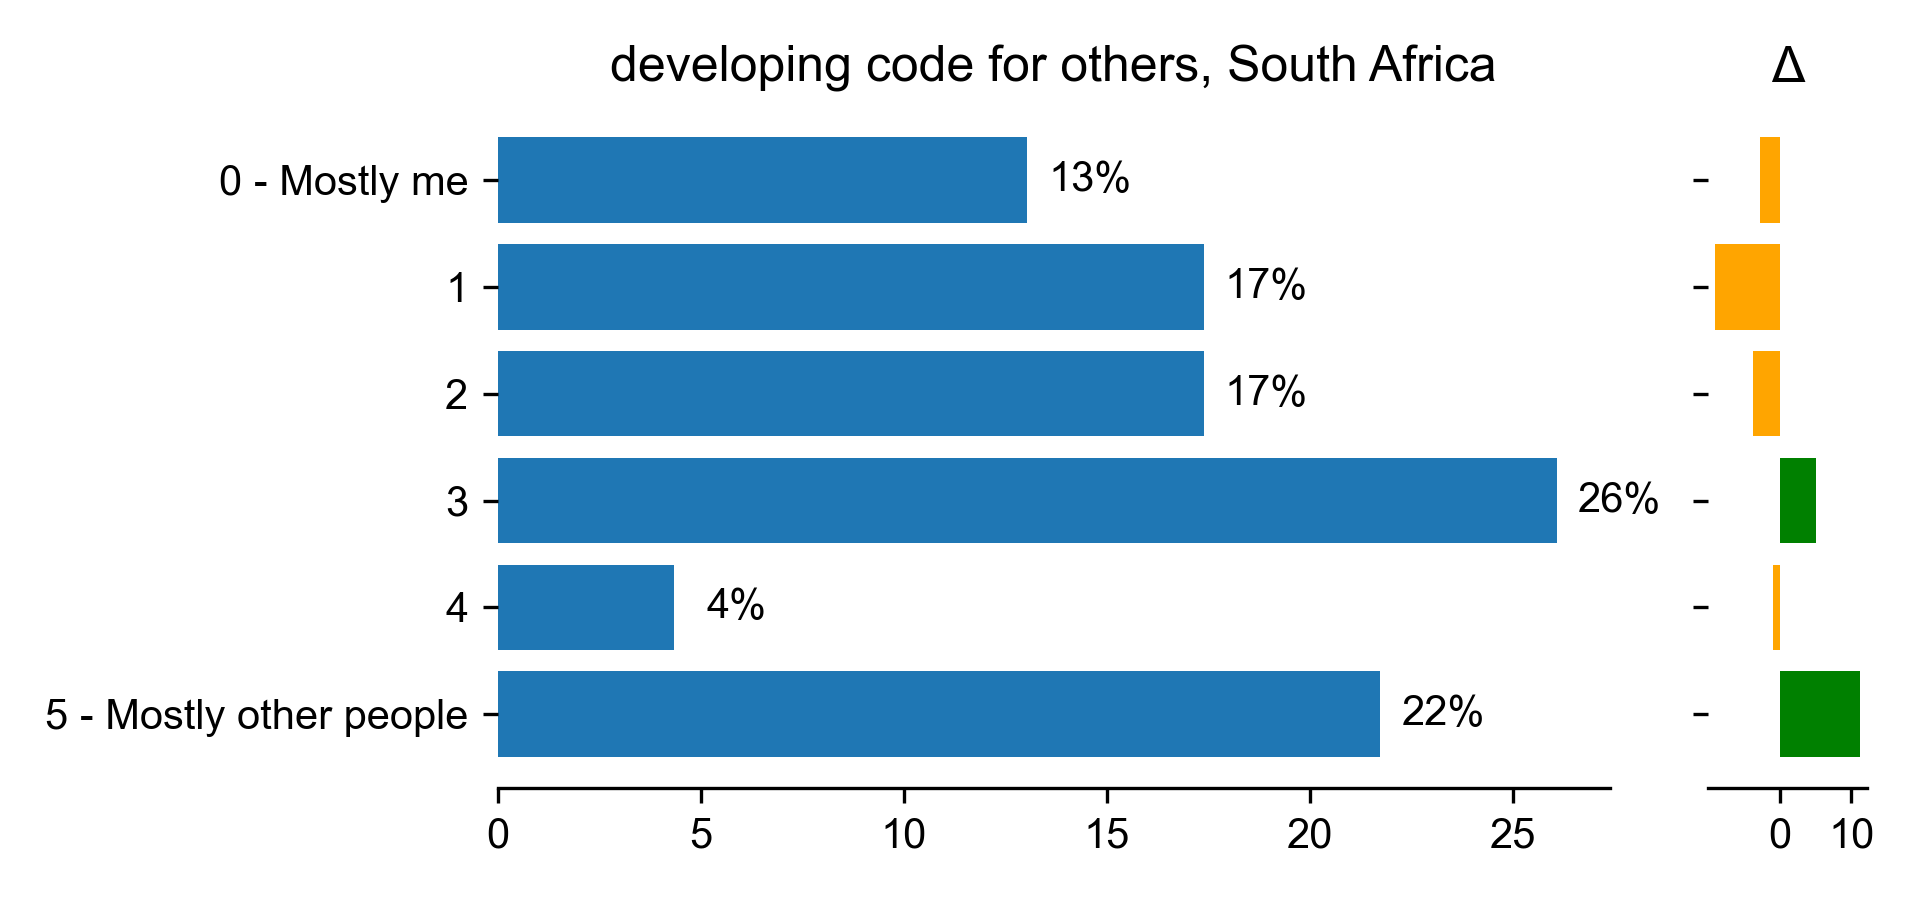
Developing code for others
| developing code for others for South Africa |
Count |
Percentage |
Percentage in 2017 |
Difference with previous year |
| 0 - Mostly me |
3 |
13.0435 |
15.7895 |
-2.746 |
| 1 |
4 |
17.3913 |
26.3158 |
-8.92449 |
| 2 |
4 |
17.3913 |
21.0526 |
-3.66133 |
| 3 |
6 |
26.087 |
21.0526 |
5.03432 |
| 4 |
1 |
4.34783 |
5.26316 |
-0.915332 |
| 5 - Mostly other people |
5 |
21.7391 |
10.5263 |
11.2128 |
Download CSV
PNG SVG
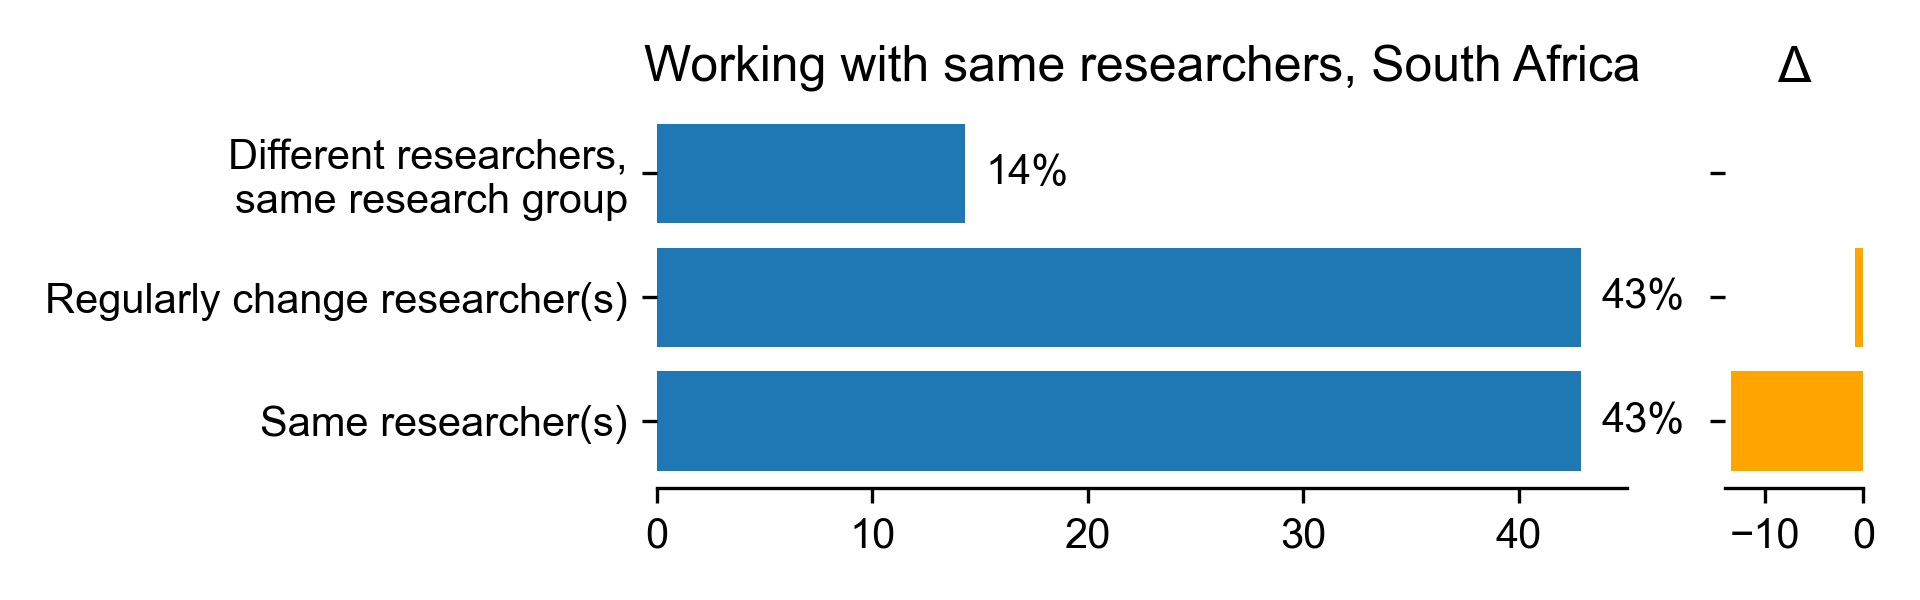
Working with same researchers
| Working with same researchers for South Africa |
Count |
Percentage |
Percentage in 2017 |
Difference with previous year |
| Different researchers, same research group |
3 |
14.2857 |
nan |
nan |
| Regularly change researcher(s) |
9 |
42.8571 |
43.75 |
-0.892857 |
| Same researcher(s) |
9 |
42.8571 |
56.25 |
-13.3929 |
Download CSV
PNG SVG
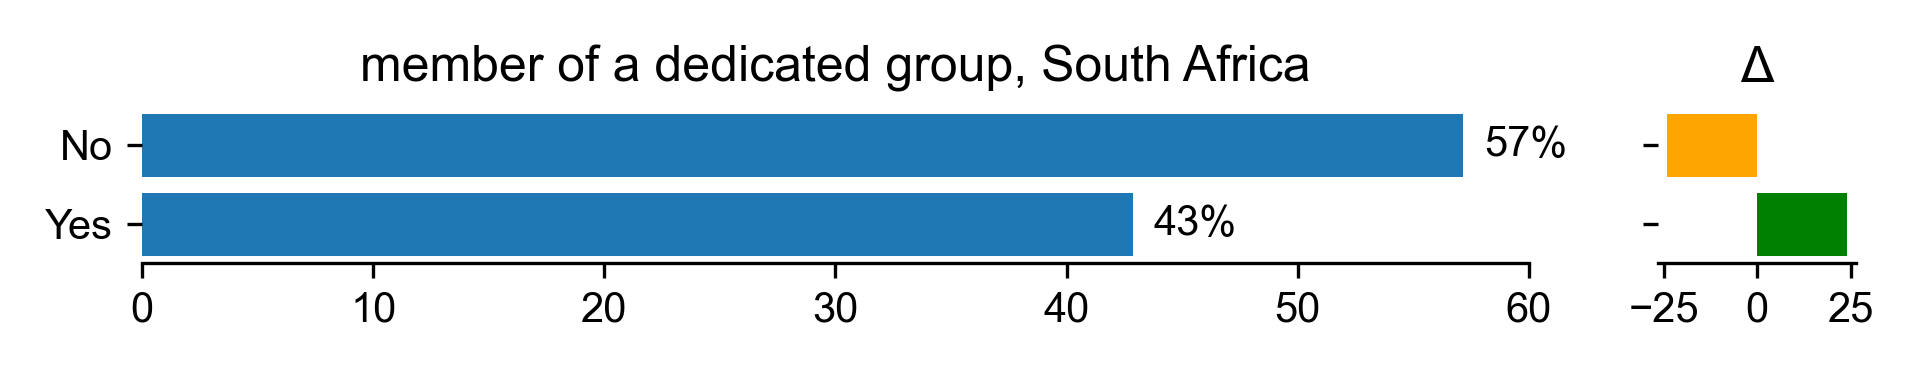
Part of dedicated group
| member of a dedicated group for South Africa |
Count |
Percentage |
Percentage in 2017 |
Difference with previous year |
| No |
12 |
57.1429 |
81.25 |
-24.1071 |
| Yes |
9 |
42.8571 |
18.75 |
24.1071 |
Download CSV
PNG SVG
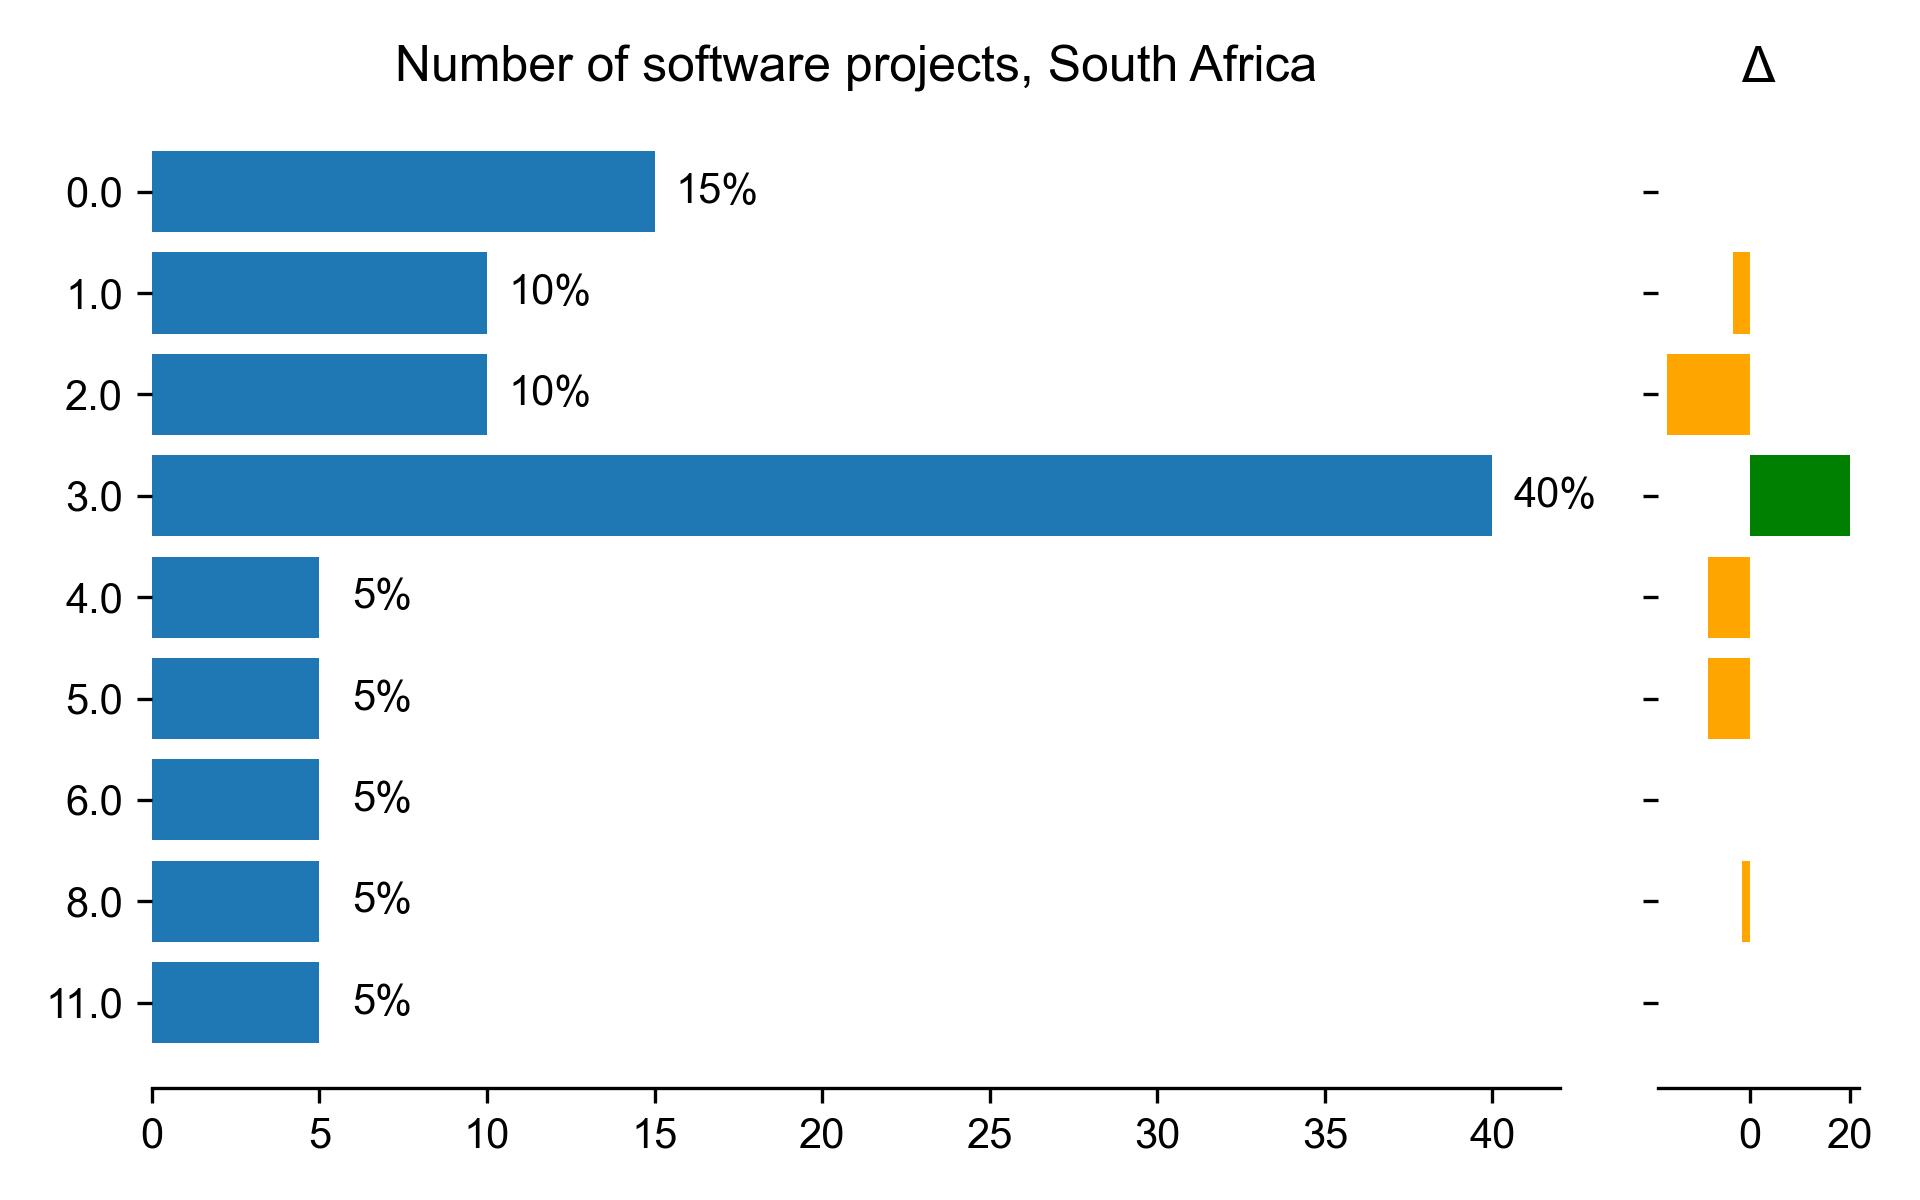
Number of projects
| Number of software projects for South Africa |
Count |
Percentage |
Percentage in 2017 |
Difference with previous year |
| 0 |
3 |
15 |
nan |
nan |
| 1 |
2 |
10 |
13.3333 |
-3.33333 |
| 2 |
2 |
10 |
26.6667 |
-16.6667 |
| 3 |
8 |
40 |
20 |
20 |
| 4 |
1 |
5 |
13.3333 |
-8.33333 |
| 5 |
1 |
5 |
13.3333 |
-8.33333 |
| 6 |
1 |
5 |
nan |
nan |
| 8 |
1 |
5 |
6.66667 |
-1.66667 |
| 11 |
1 |
5 |
nan |
nan |
Download CSV
PNG SVG
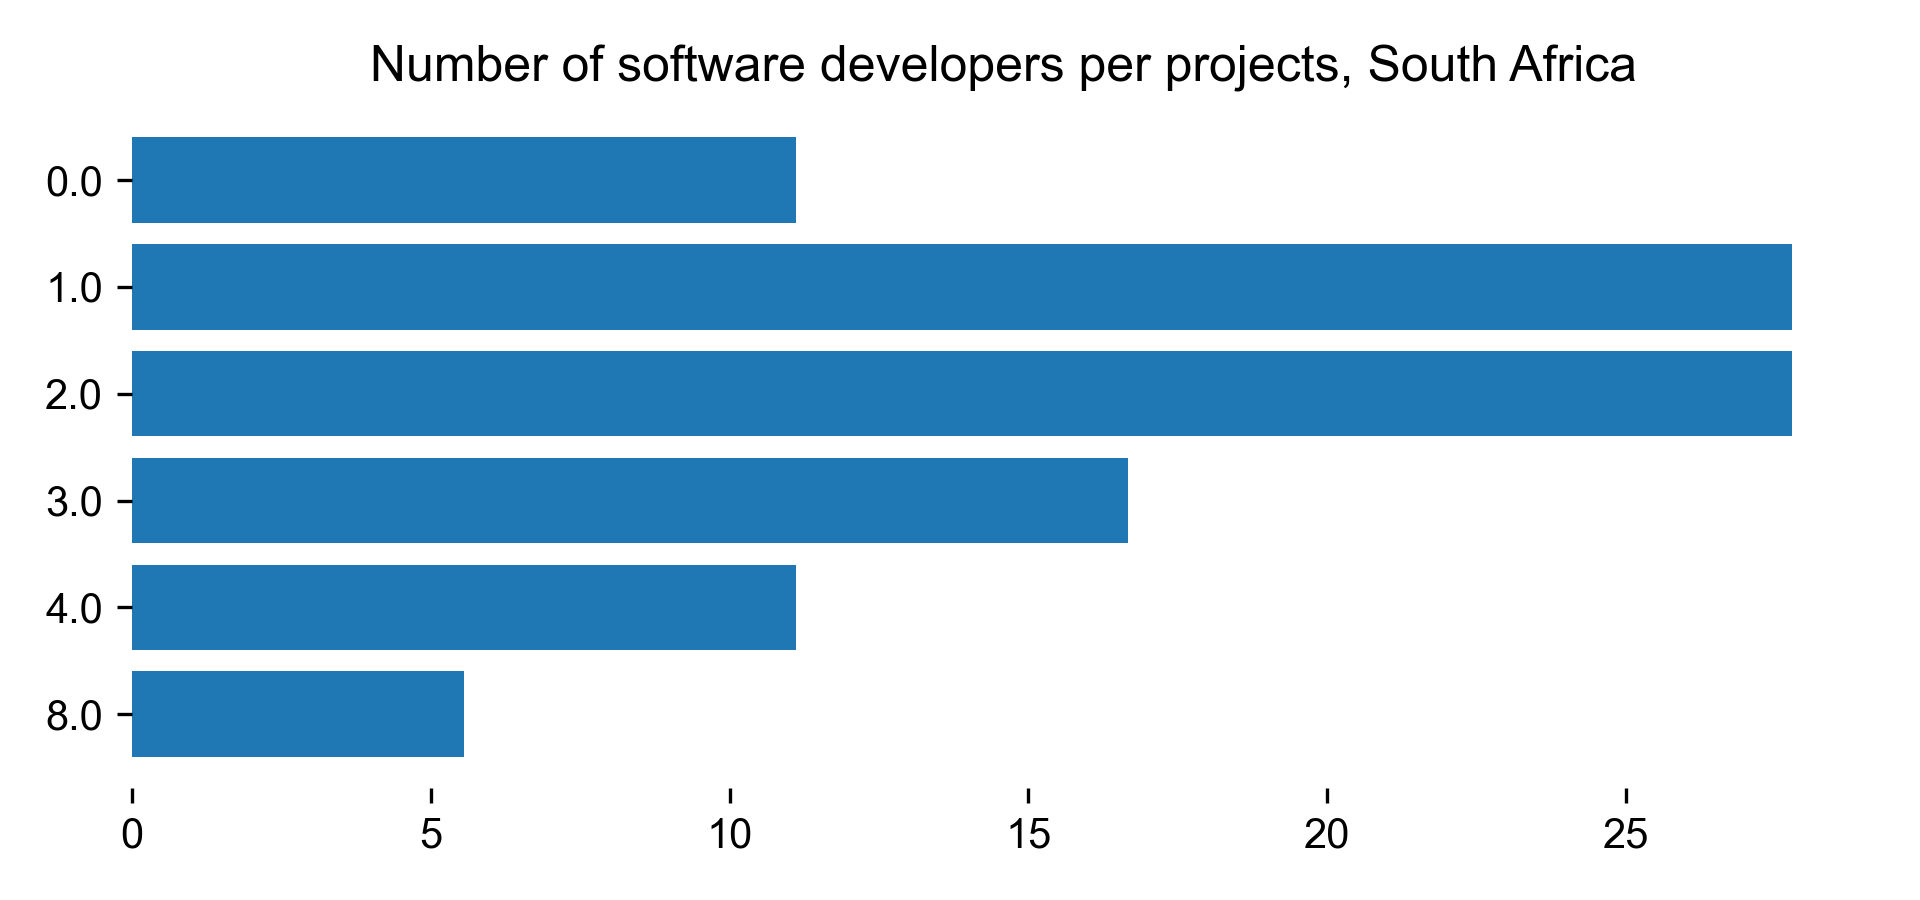
| Number of software developers per projects for South Africa |
Count |
Percentage |
| 0 |
2 |
11.1111 |
| 1 |
5 |
27.7778 |
| 2 |
5 |
27.7778 |
| 3 |
3 |
16.6667 |
| 4 |
2 |
11.1111 |
| 8 |
1 |
5.55556 |
Download CSV
PNG SVG
Training
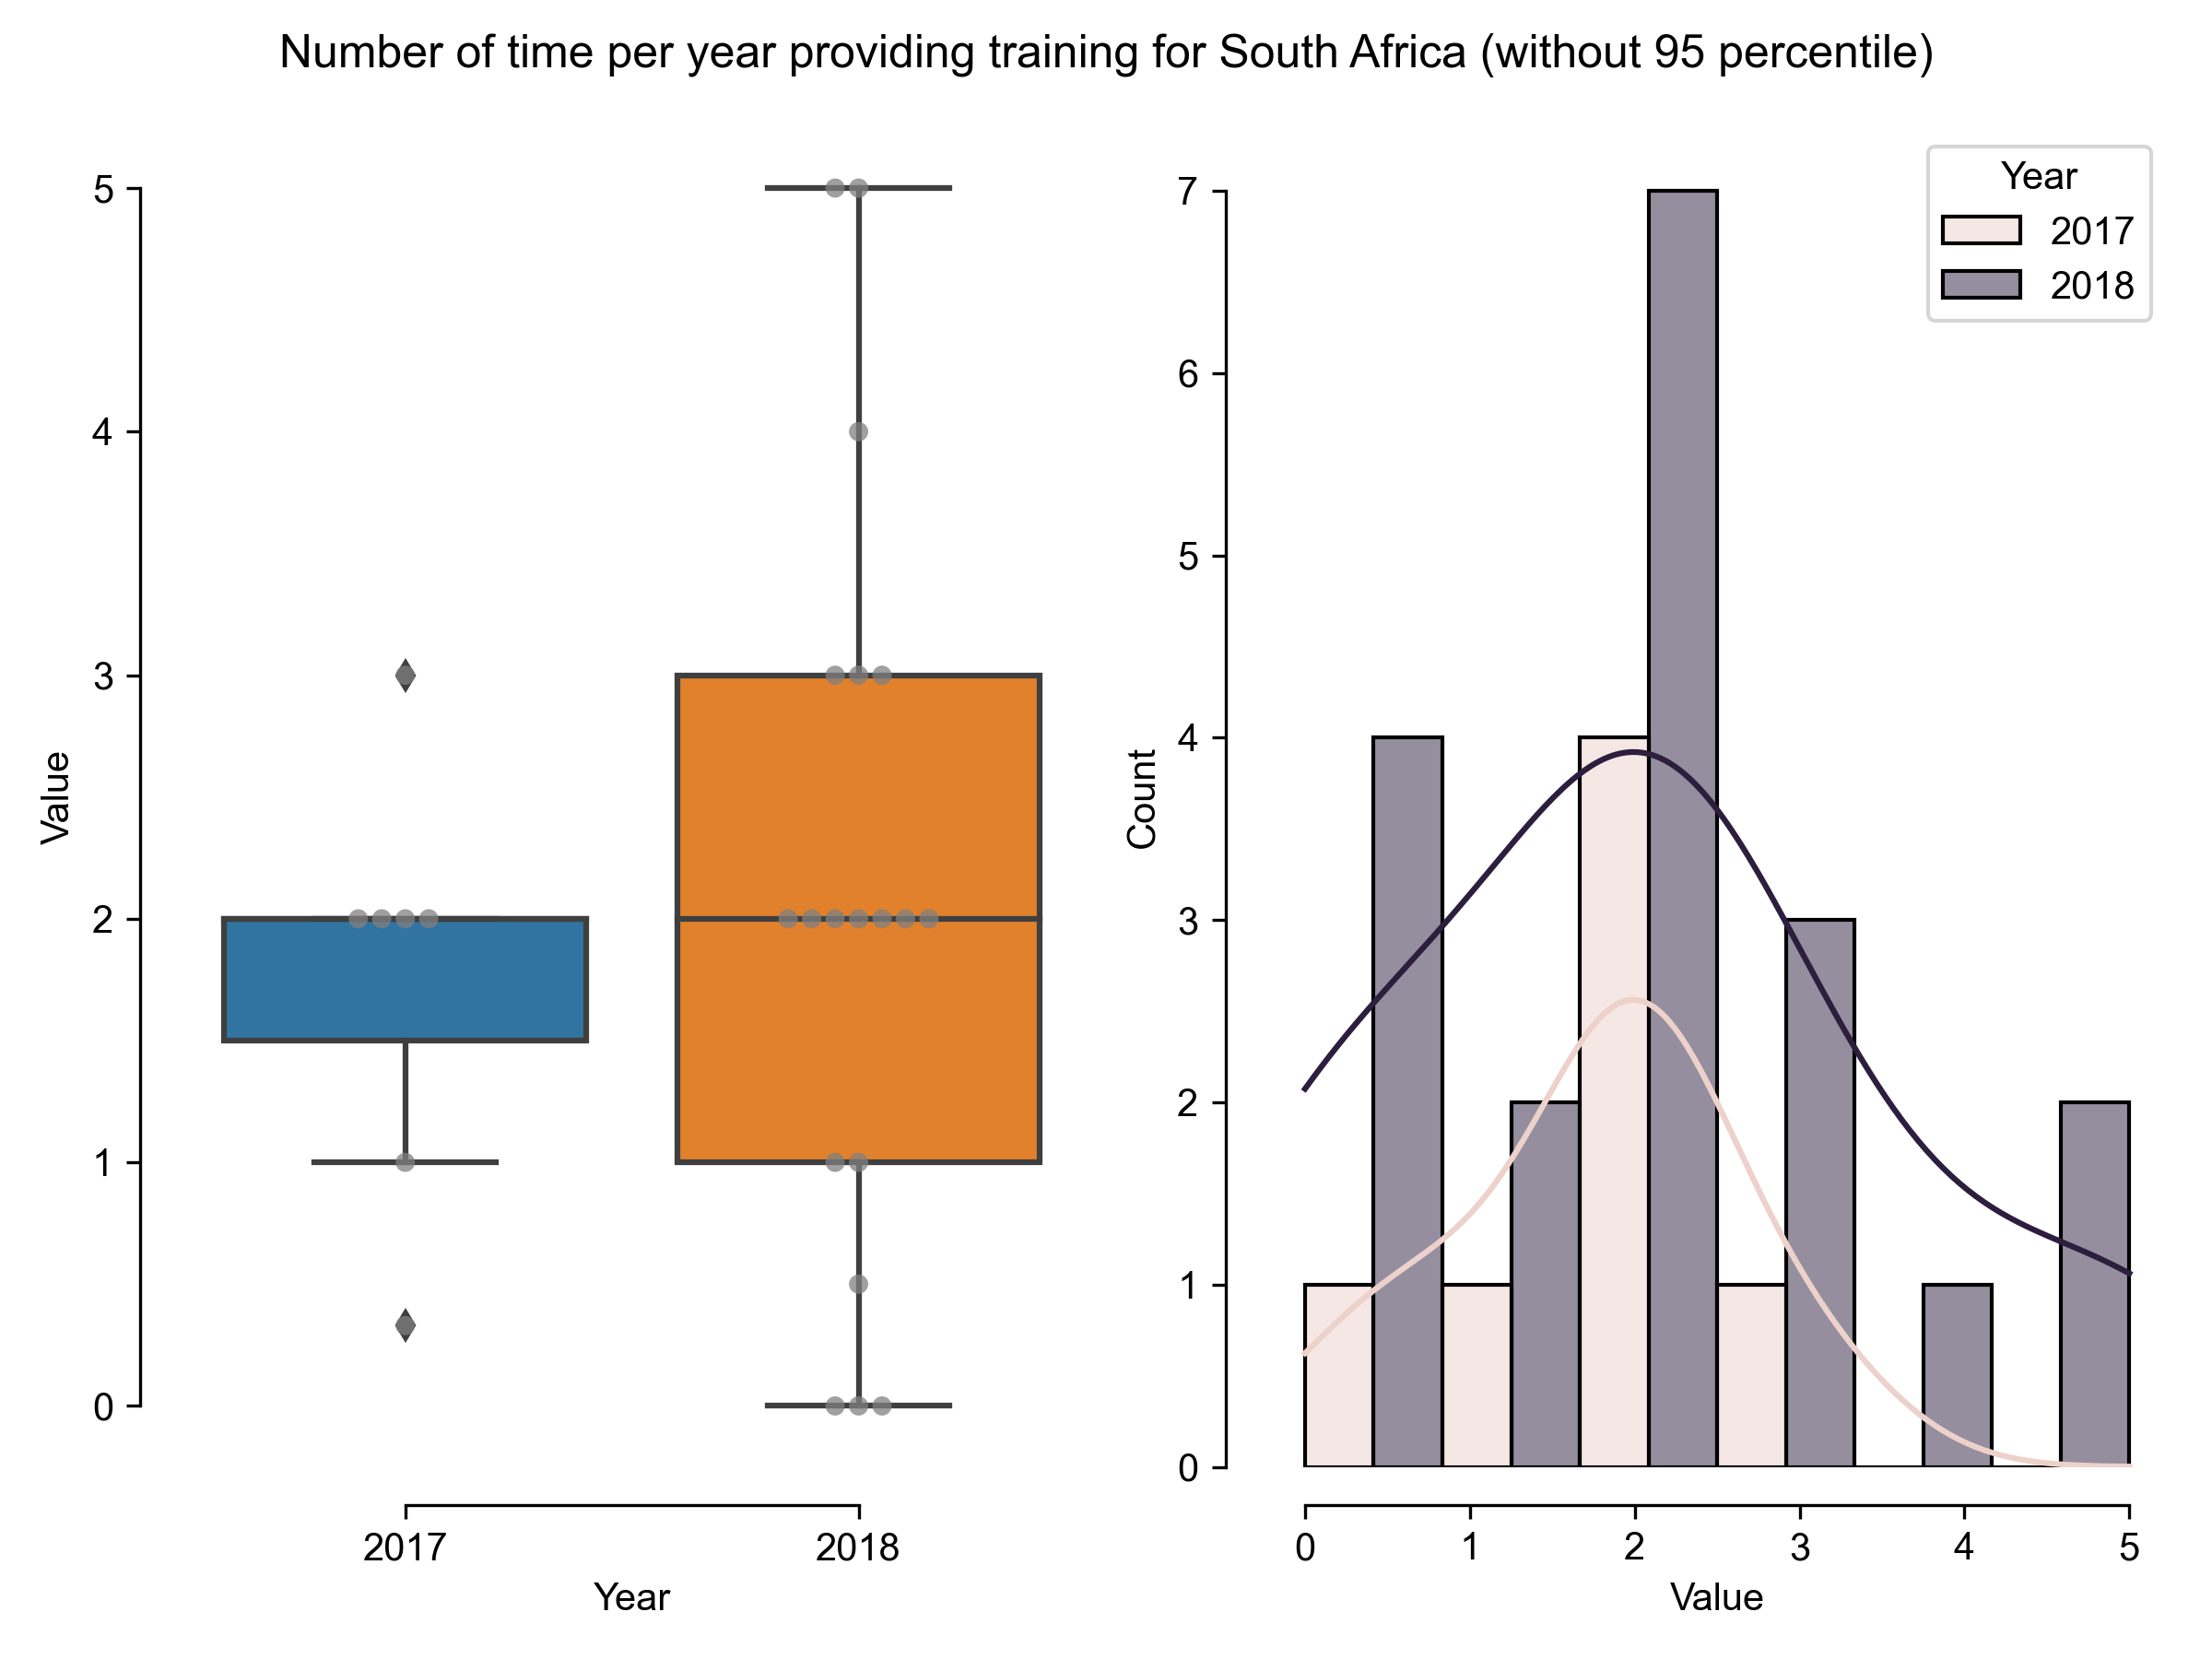
| Number of time per year providing training for South Africa (without 95 percentile) |
Results in 2018 |
Results in 2017 |
| count |
19 |
7 |
| mean |
2.07895 |
1.76143 |
| std |
1.51165 |
0.855422 |
| min |
0 |
0.33 |
| 25% |
1 |
1.5 |
| 50% |
2 |
2 |
| 75% |
3 |
2 |
| max |
5 |
3 |
Download CSV
PNG SVG
PNG SVG
United Kingdom
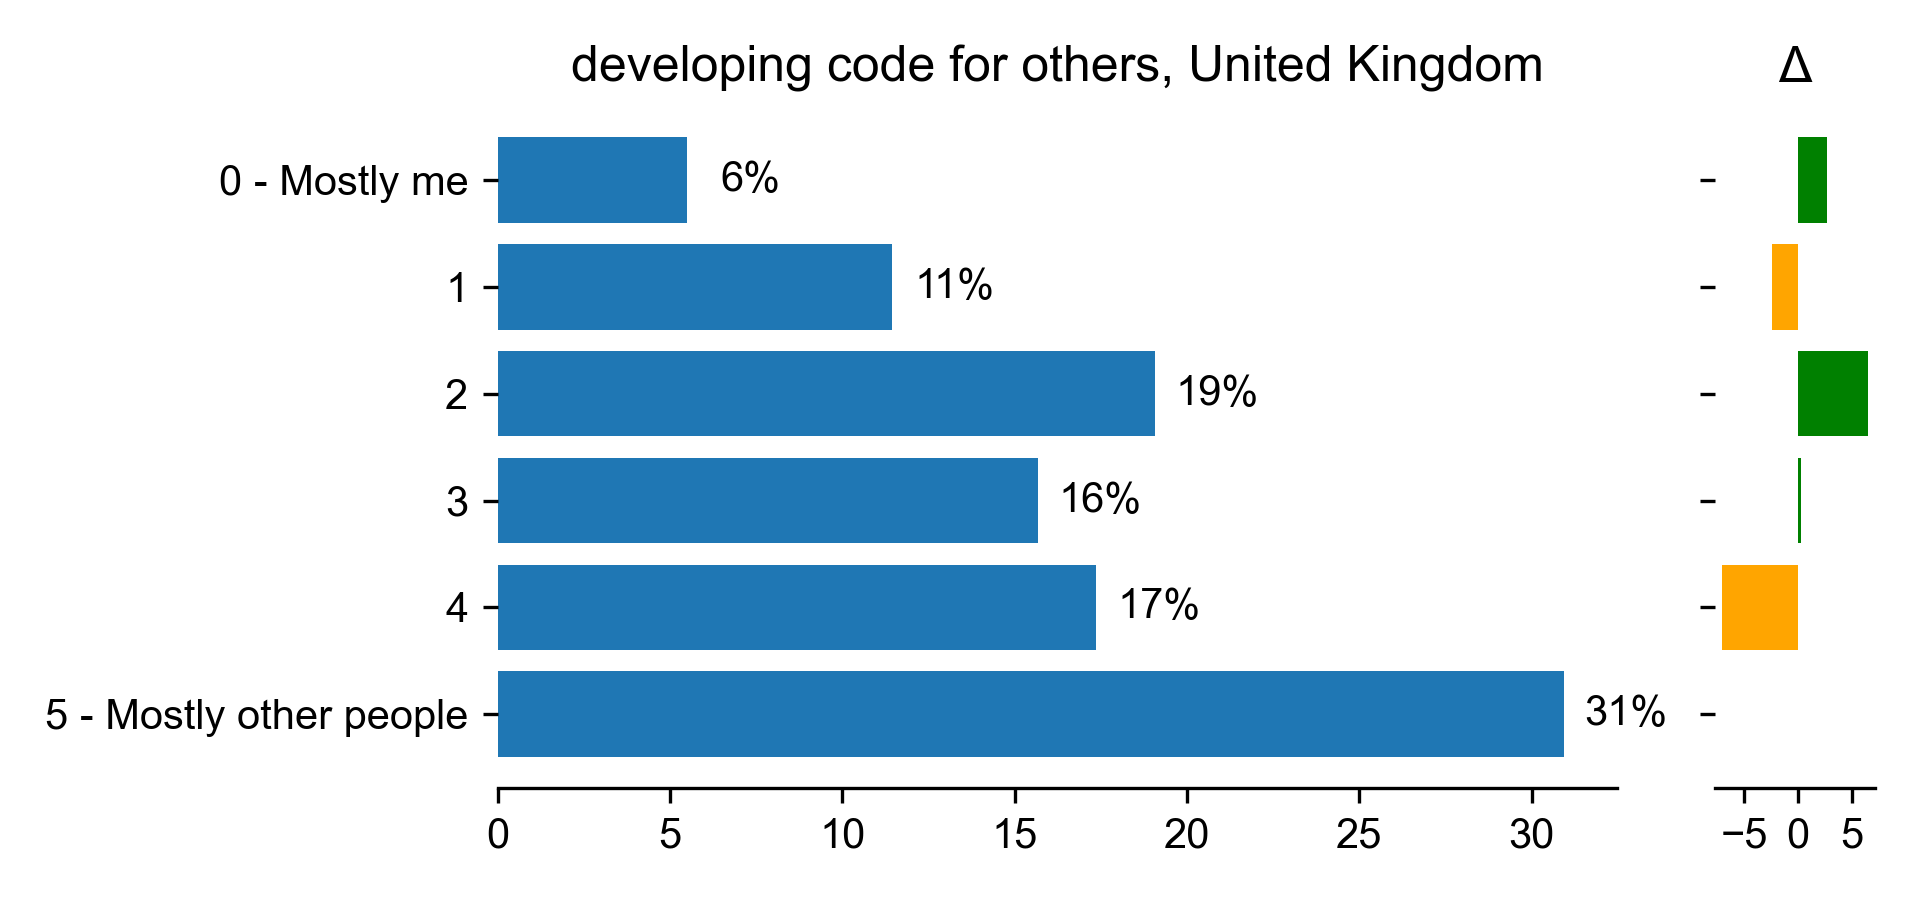
Developing code for others
| developing code for others for United Kingdom |
Count |
Percentage |
Percentage in 2017 |
Difference with previous year |
| 0 - Mostly me |
13 |
5.50847 |
2.84553 |
2.66295 |
| 1 |
27 |
11.4407 |
13.8211 |
-2.38046 |
| 2 |
45 |
19.0678 |
12.6016 |
6.46617 |
| 3 |
37 |
15.678 |
15.4472 |
0.230812 |
| 4 |
41 |
17.3729 |
24.3902 |
-7.01736 |
| 5 - Mostly other people |
73 |
30.9322 |
30.8943 |
0.0378944 |
Download CSV
PNG SVG
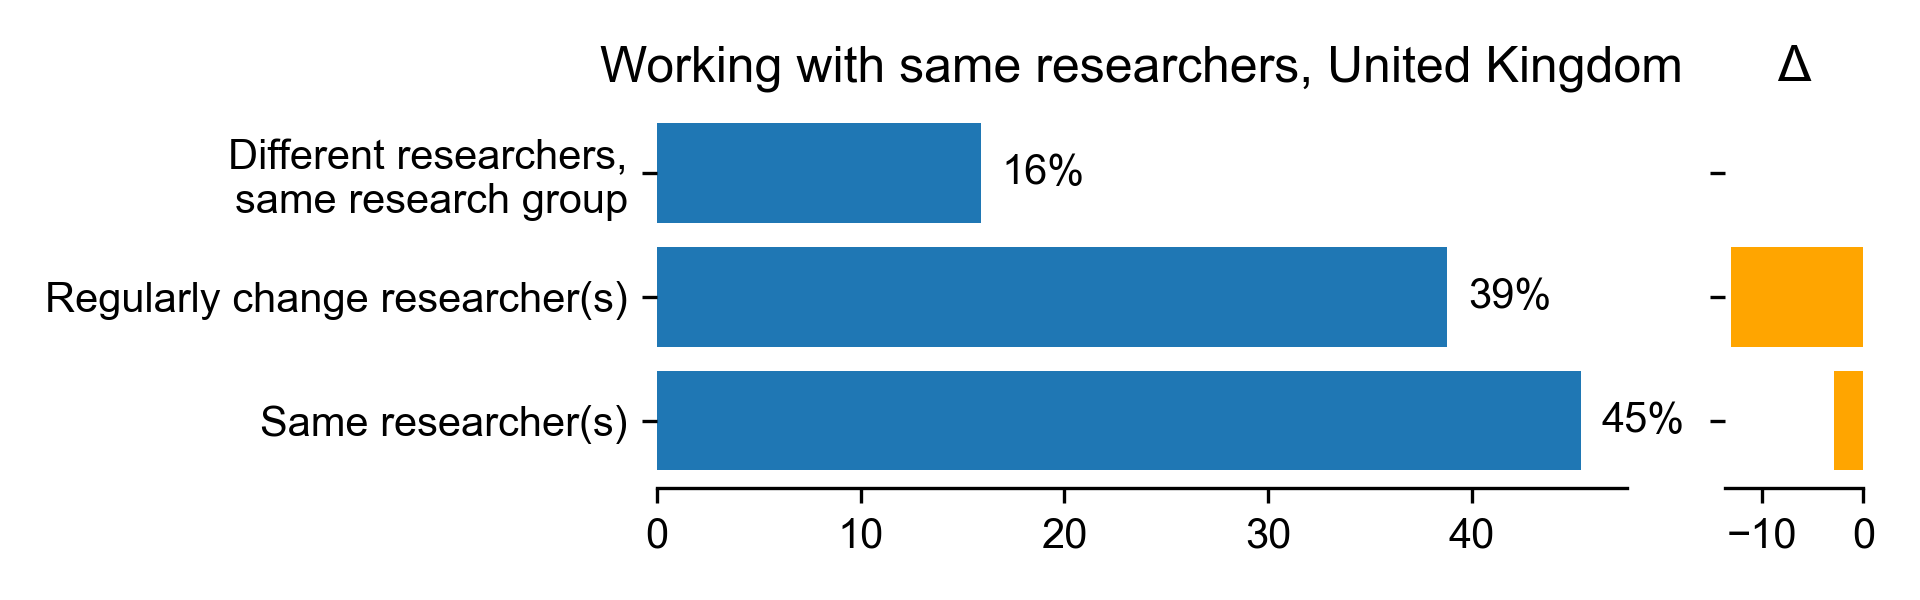
Working with same researchers
| Working with same researchers for United Kingdom |
Count |
Percentage |
Percentage in 2017 |
Difference with previous year |
| Different researchers, same research group |
34 |
15.8879 |
nan |
nan |
| Regularly change researcher(s) |
83 |
38.785 |
51.7391 |
-12.9541 |
| Same researcher(s) |
97 |
45.3271 |
48.2609 |
-2.93377 |
Download CSV
PNG SVG
Part of dedicated group
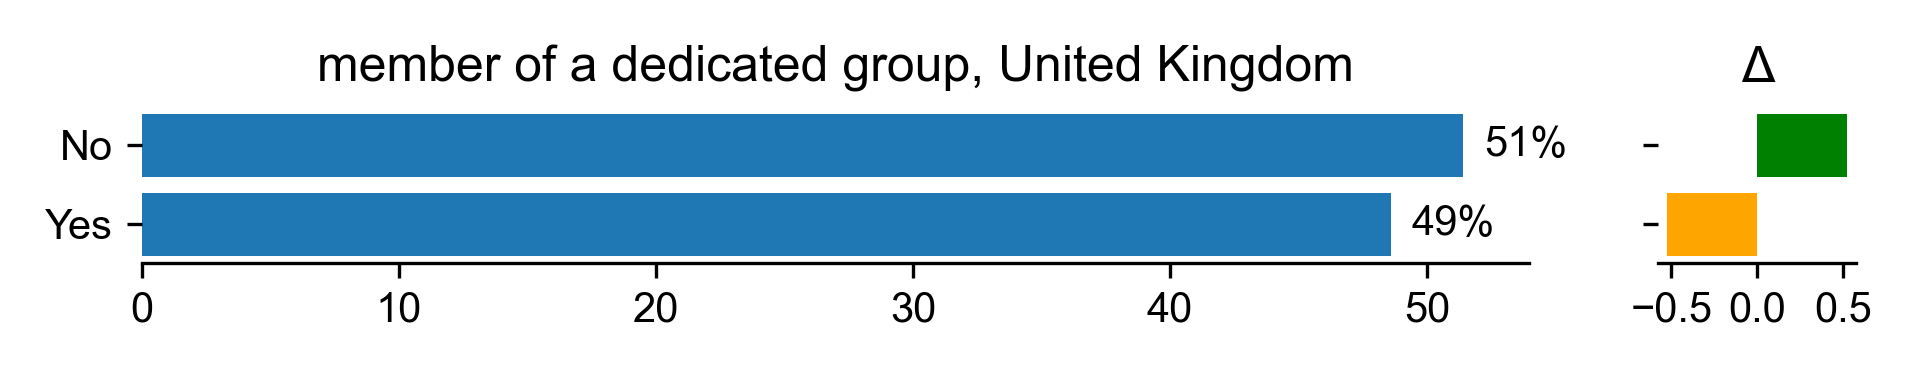
| member of a dedicated group for United Kingdom |
Count |
Percentage |
Percentage in 2017 |
Difference with previous year |
| No |
110 |
51.4019 |
50.8772 |
0.524676 |
| Yes |
104 |
48.5981 |
49.1228 |
-0.524676 |
Download CSV
PNG SVG
Number of projects
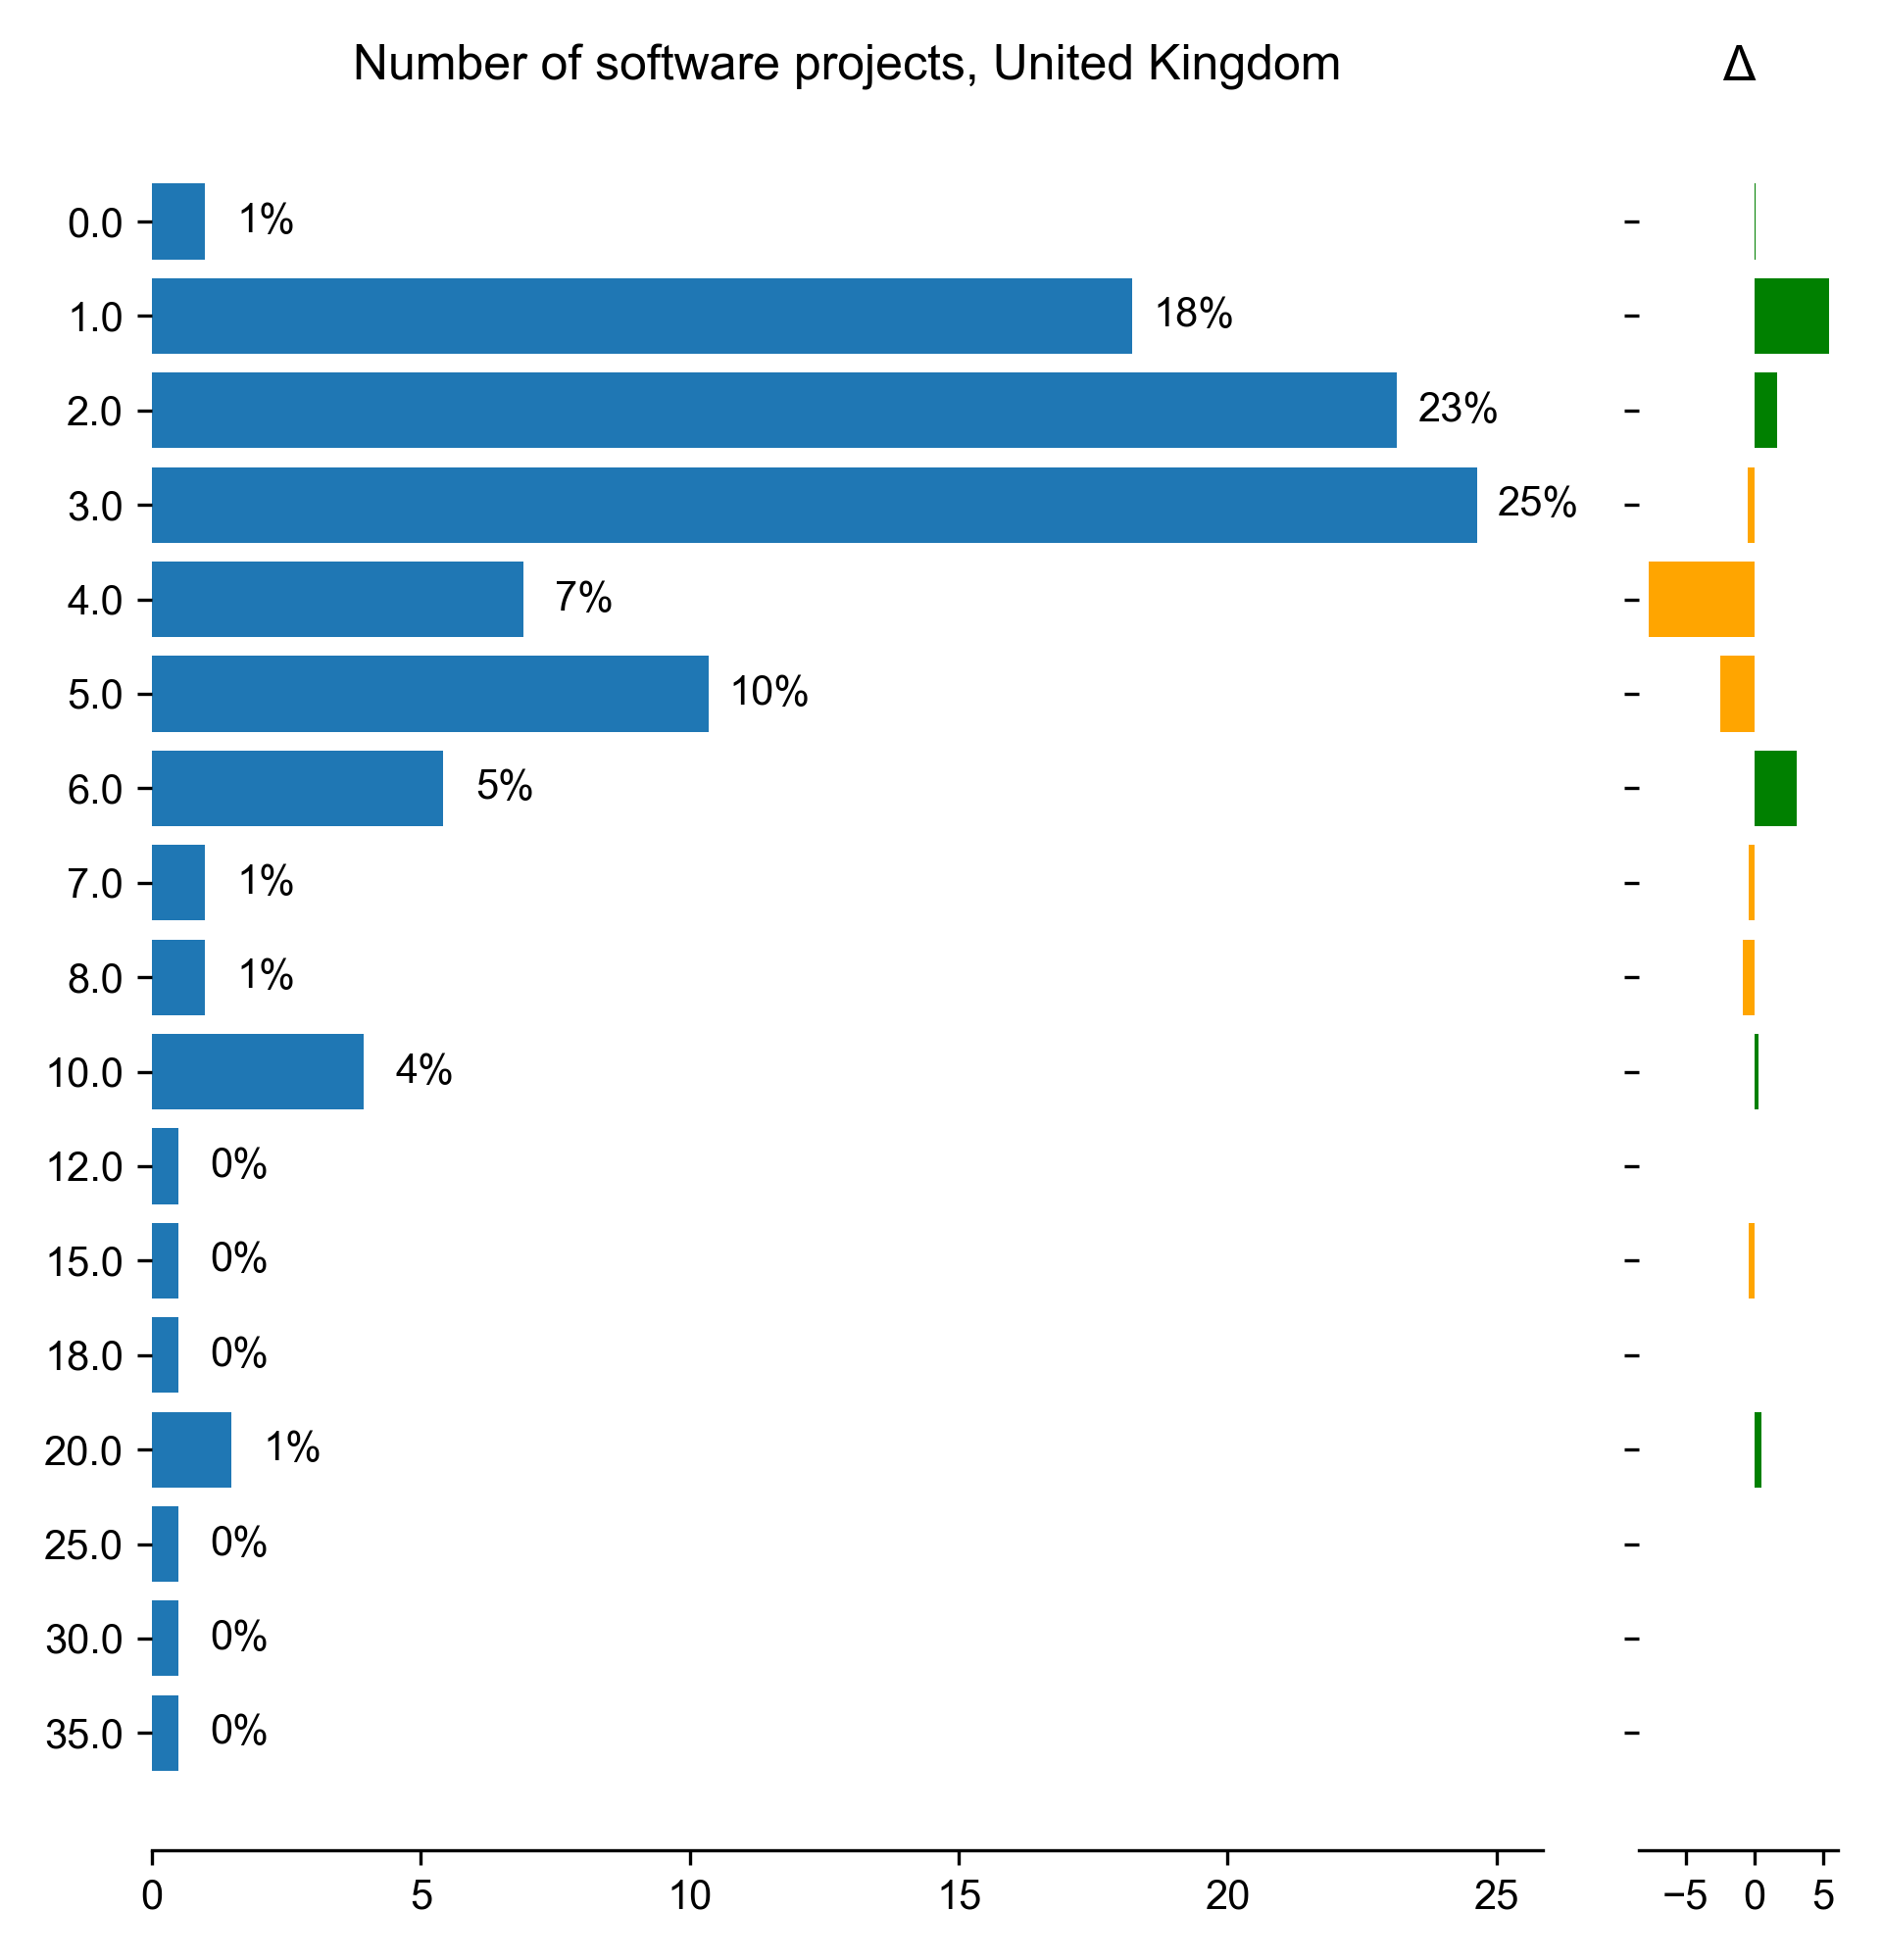
| Number of software projects for United Kingdom |
Count |
Percentage |
Percentage in 2017 |
Difference with previous year |
| 0 |
2 |
0.985222 |
0.913242 |
0.0719797 |
| 1 |
37 |
18.2266 |
12.7854 |
5.44121 |
| 2 |
47 |
23.1527 |
21.4612 |
1.69152 |
| 3 |
50 |
24.6305 |
25.1142 |
-0.483613 |
| 4 |
14 |
6.89655 |
14.6119 |
-7.71532 |
| 5 |
21 |
10.3448 |
12.7854 |
-2.44056 |
| 6 |
11 |
5.41872 |
2.28311 |
3.13561 |
| 7 |
2 |
0.985222 |
1.36986 |
-0.384641 |
| 8 |
2 |
0.985222 |
1.82648 |
-0.841262 |
| 10 |
8 |
3.94089 |
3.65297 |
0.287919 |
| 12 |
1 |
0.492611 |
0.456621 |
0.0359898 |
| 15 |
1 |
0.492611 |
0.913242 |
-0.420631 |
| 18 |
1 |
0.492611 |
nan |
nan |
| 20 |
3 |
1.47783 |
0.913242 |
0.564591 |
| 25 |
1 |
0.492611 |
nan |
nan |
| 30 |
1 |
0.492611 |
nan |
nan |
| 35 |
1 |
0.492611 |
nan |
nan |
Download CSV
PNG SVG
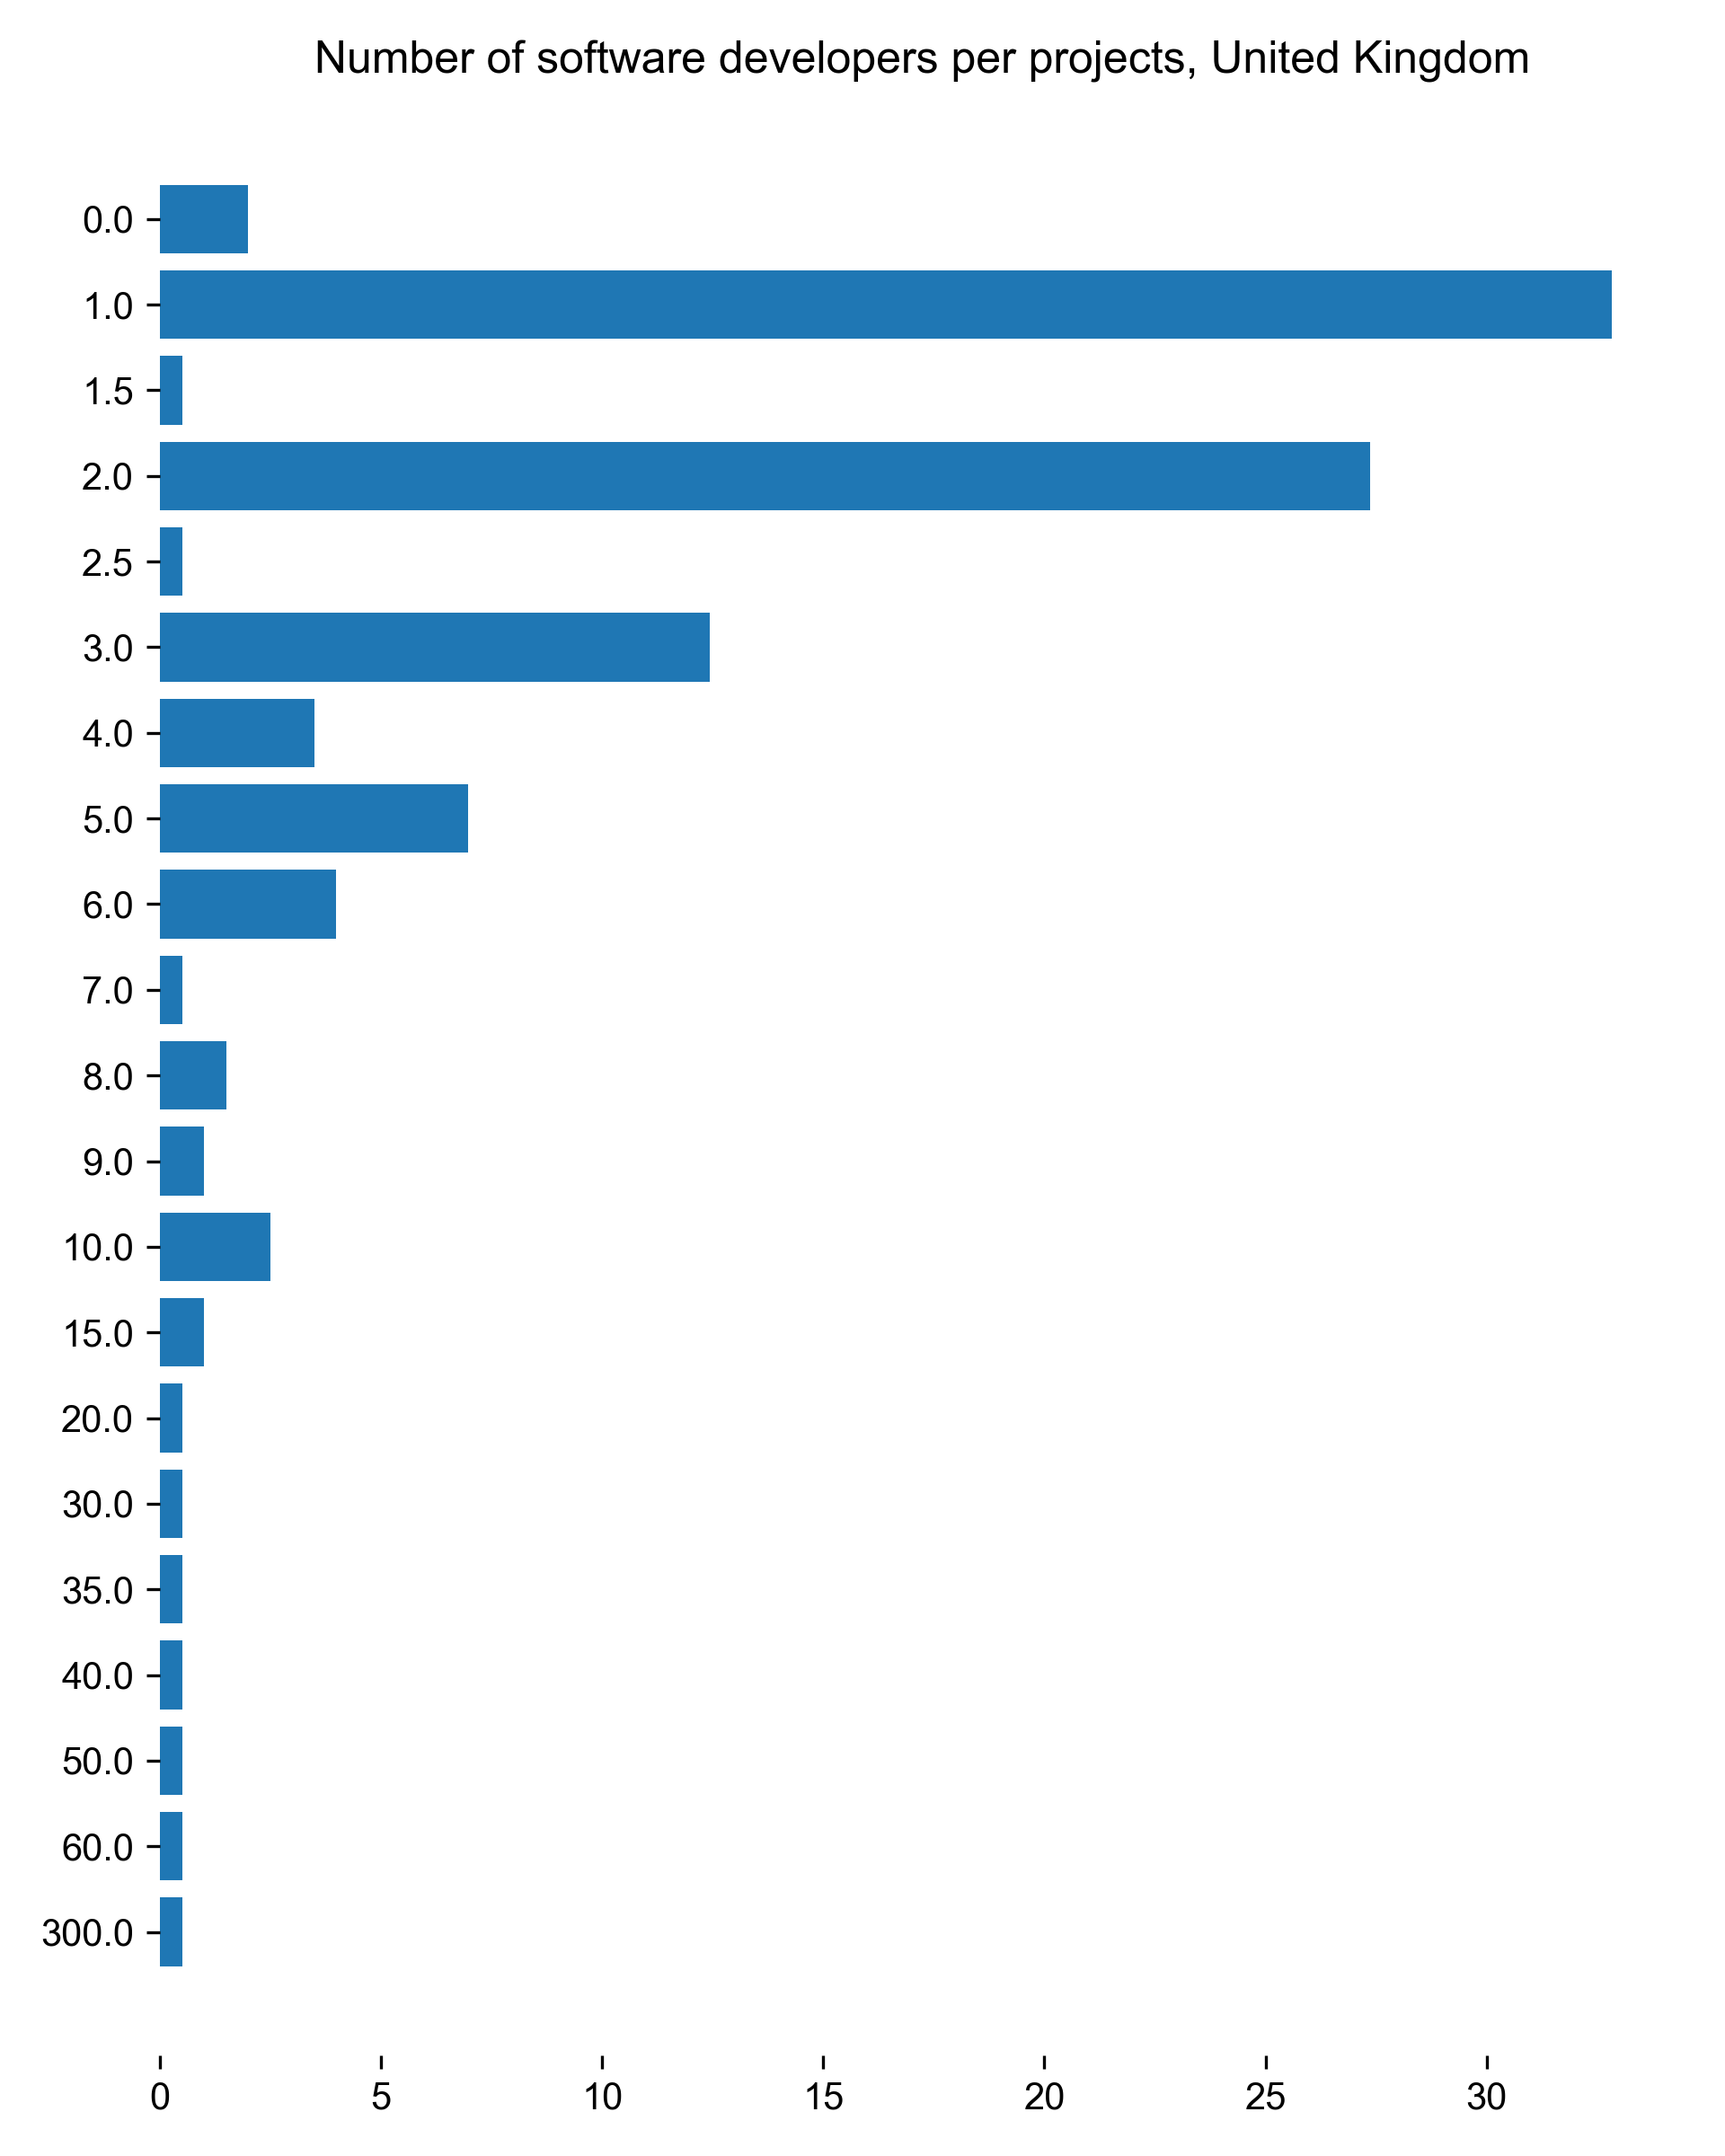
| Number of software developers per projects for United Kingdom |
Count |
Percentage |
| 0 |
4 |
1.99005 |
| 1 |
66 |
32.8358 |
| 1.5 |
1 |
0.497512 |
| 2 |
55 |
27.3632 |
| 2.5 |
1 |
0.497512 |
| 3 |
25 |
12.4378 |
| 4 |
7 |
3.48259 |
| 5 |
14 |
6.96517 |
| 6 |
8 |
3.9801 |
| 7 |
1 |
0.497512 |
| 8 |
3 |
1.49254 |
| 9 |
2 |
0.995025 |
| 10 |
5 |
2.48756 |
| 15 |
2 |
0.995025 |
| 20 |
1 |
0.497512 |
| 30 |
1 |
0.497512 |
| 35 |
1 |
0.497512 |
| 40 |
1 |
0.497512 |
| 50 |
1 |
0.497512 |
| 60 |
1 |
0.497512 |
| 300 |
1 |
0.497512 |
Download CSV
PNG SVG
Training
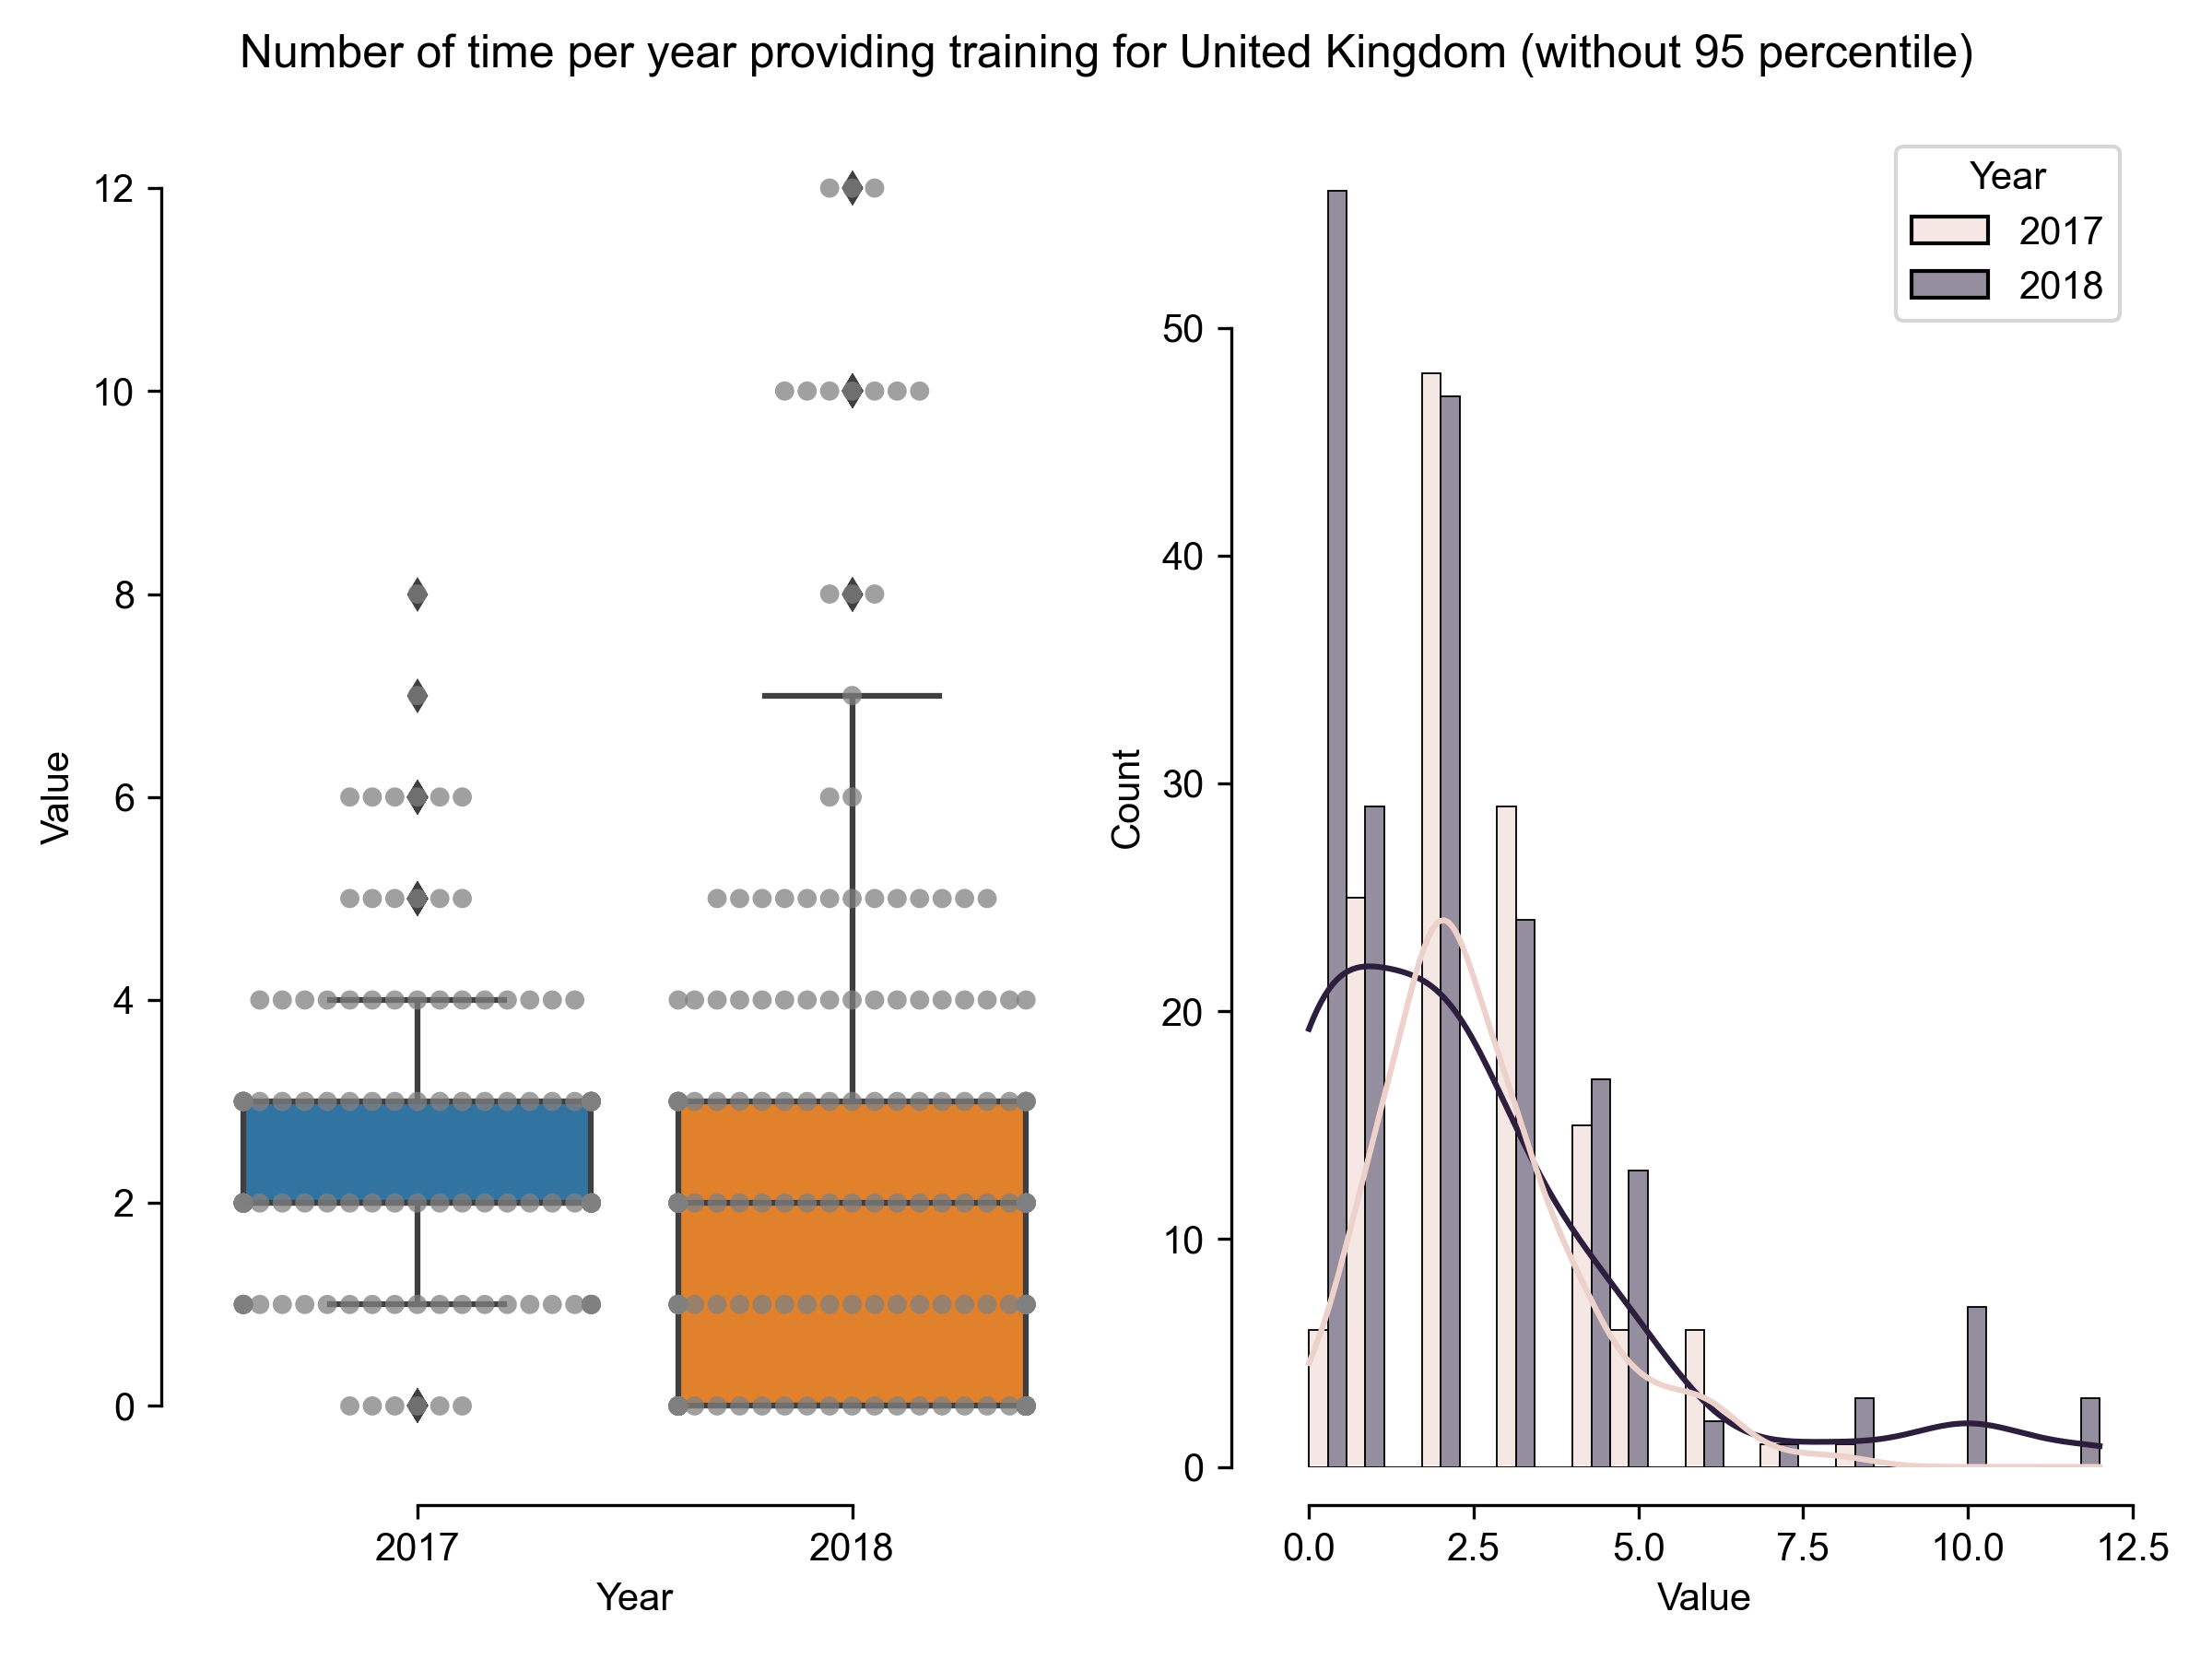
| Number of time per year providing training for United Kingdom (without 95 percentile) |
Results in 2018 |
Results in 2017 |
| count |
202 |
137 |
| mean |
2.36139 |
2.54745 |
| std |
2.59028 |
1.50475 |
| min |
0 |
0 |
| 25% |
0 |
2 |
| 50% |
2 |
2 |
| 75% |
3 |
3 |
| max |
12 |
8 |
Download CSV
PNG SVG
PNG SVG
United States
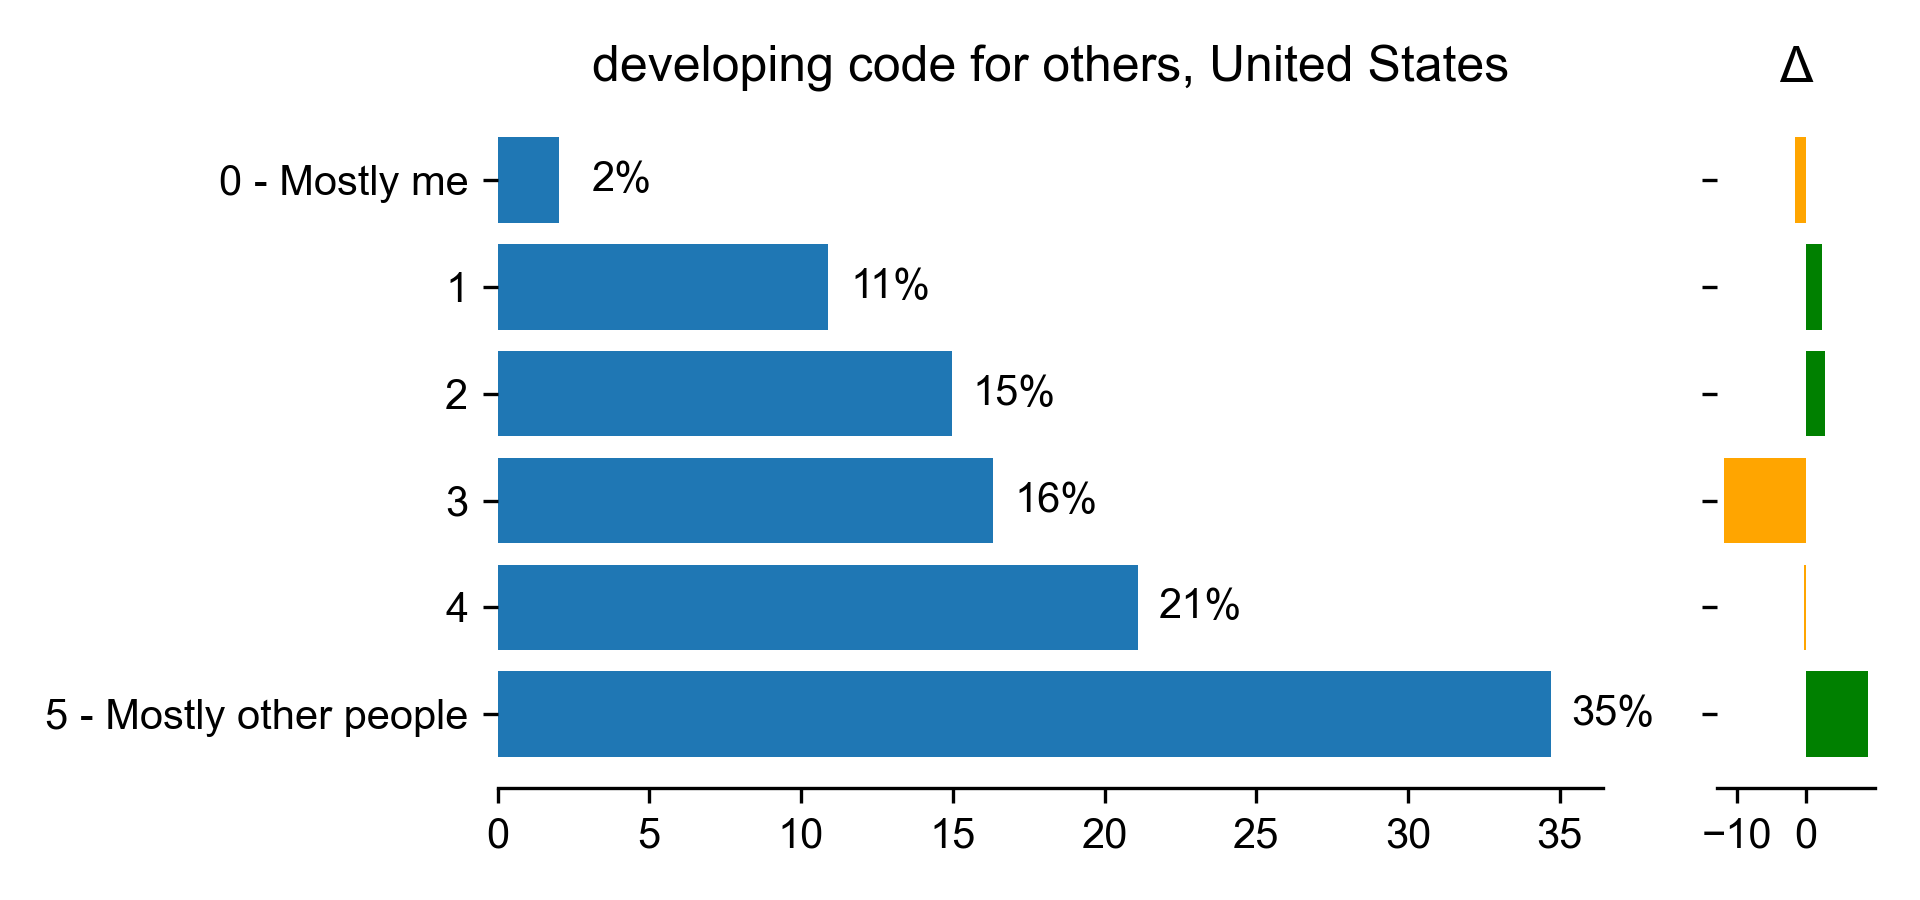
Developing code for others
| developing code for others for United States |
Count |
Percentage |
Percentage in 2017 |
Difference with previous year |
| 0 - Mostly me |
3 |
2.04082 |
3.68098 |
-1.64017 |
| 1 |
16 |
10.8844 |
8.58896 |
2.2954 |
| 2 |
22 |
14.966 |
12.2699 |
2.69605 |
| 3 |
24 |
16.3265 |
28.2209 |
-11.8943 |
| 4 |
31 |
21.0884 |
21.4724 |
-0.383957 |
| 5 - Mostly other people |
51 |
34.6939 |
25.7669 |
8.92701 |
Download CSV
PNG SVG
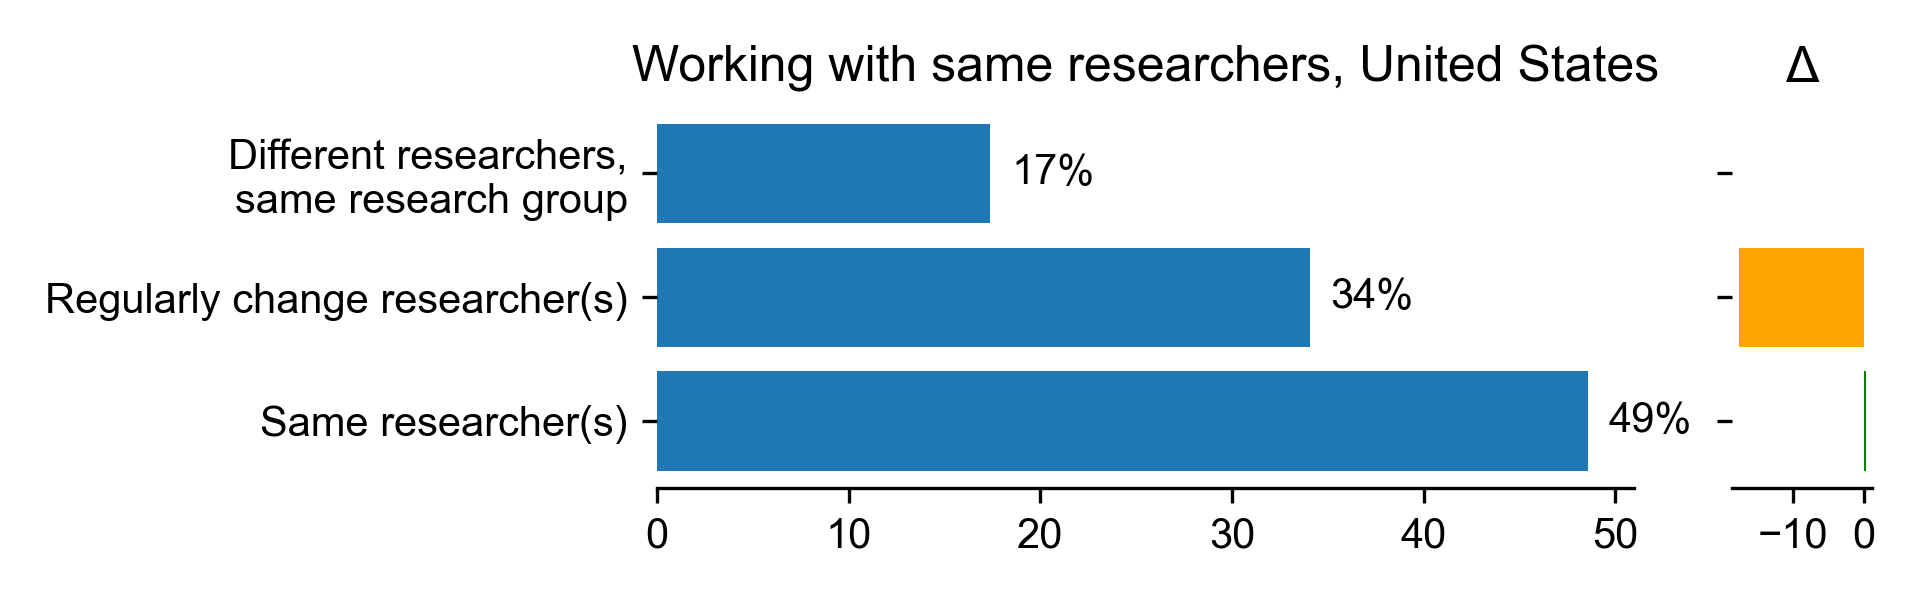
Working with same researchers
| Working with same researchers for United States |
Count |
Percentage |
Percentage in 2017 |
Difference with previous year |
| Different researchers, same research group |
24 |
17.3913 |
nan |
nan |
| Regularly change researcher(s) |
47 |
34.058 |
51.6556 |
-17.5977 |
| Same researcher(s) |
67 |
48.5507 |
48.3444 |
0.206354 |
Download CSV
PNG SVG
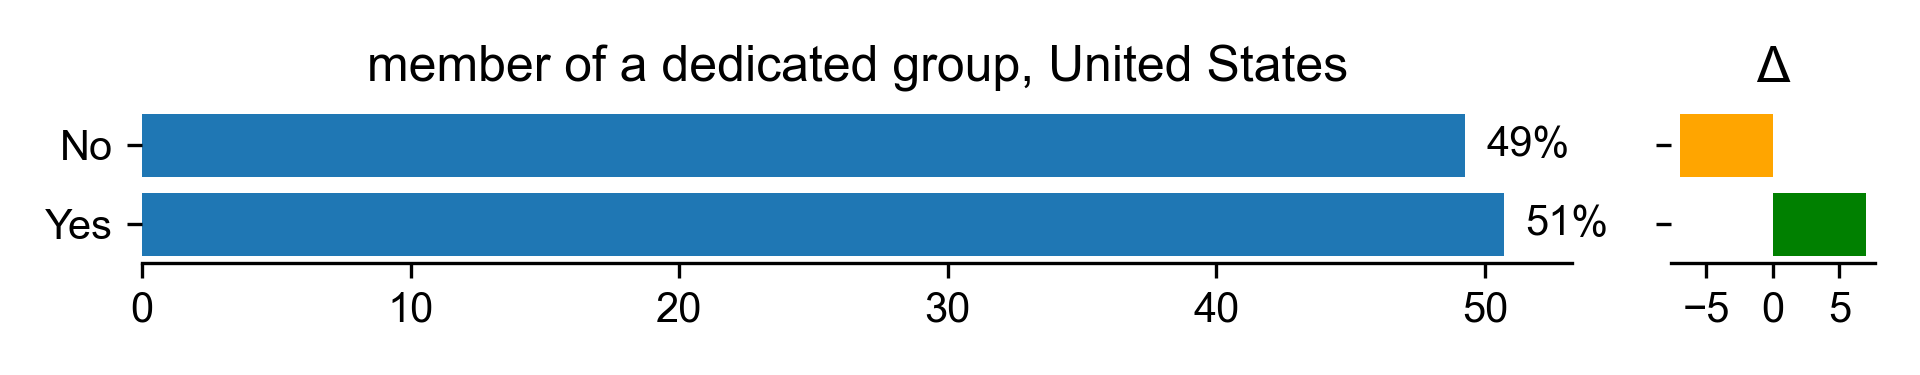
Part of dedicated group
| member of a dedicated group for United States |
Count |
Percentage |
Percentage in 2017 |
Difference with previous year |
| No |
68 |
49.2754 |
56.25 |
-6.97464 |
| Yes |
70 |
50.7246 |
43.75 |
6.97464 |
Download CSV
PNG SVG
Number of projects
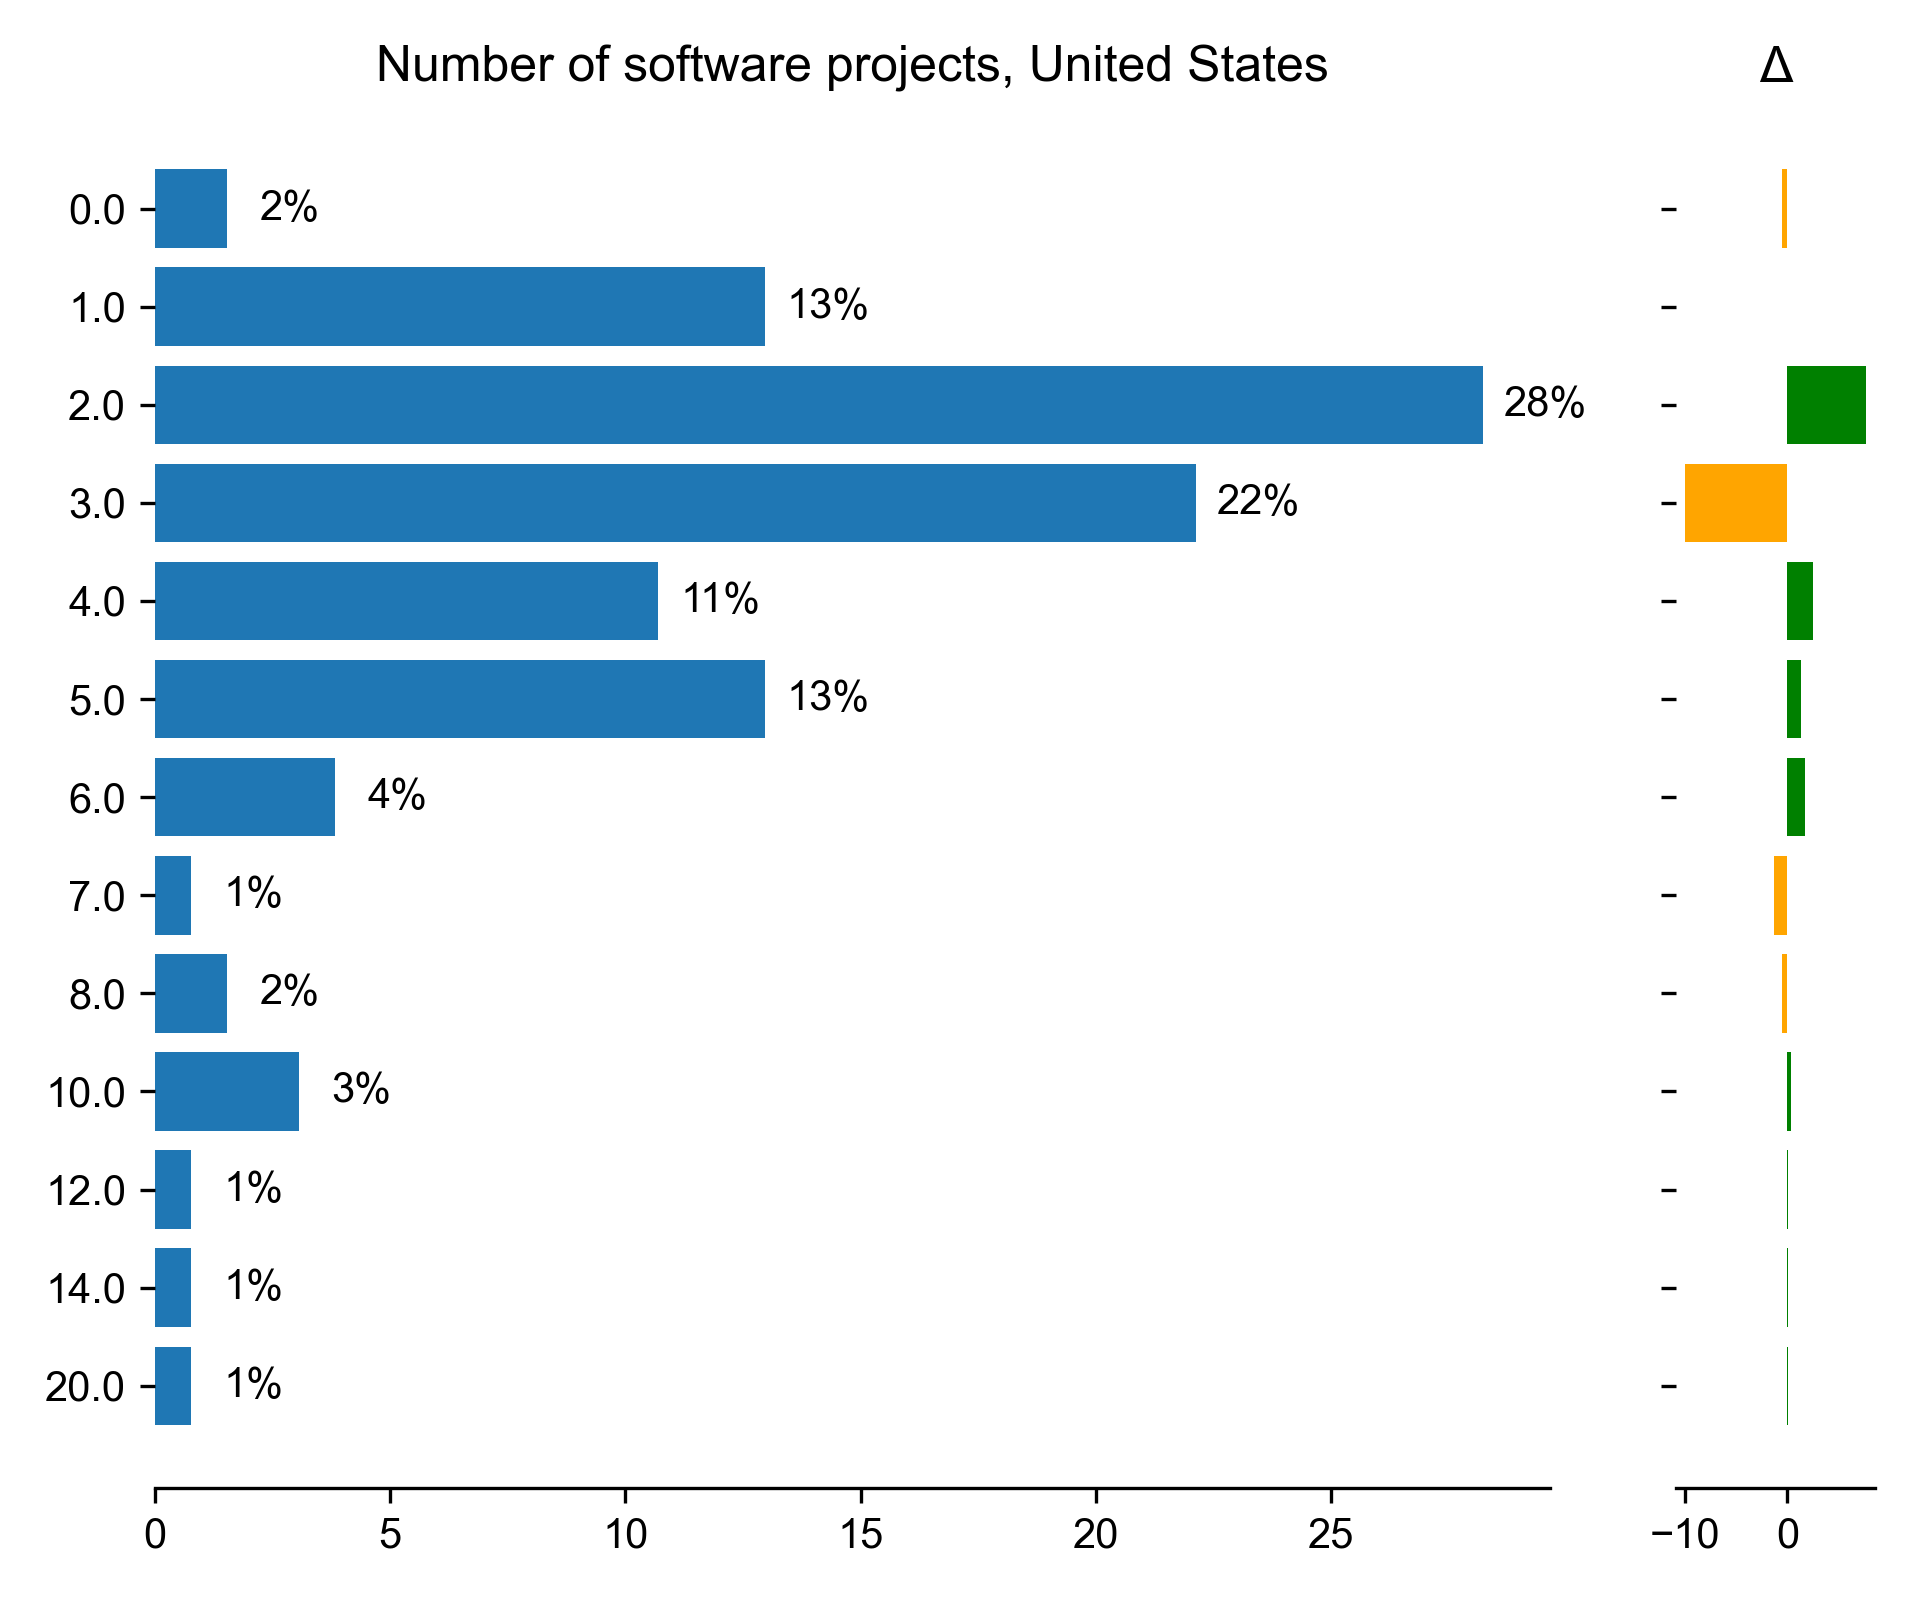
| Number of software projects for United States |
Count |
Percentage |
Percentage in 2017 |
Difference with previous year |
| 0 |
2 |
1.52672 |
2.05479 |
-0.528077 |
| 1 |
17 |
12.9771 |
13.0137 |
-0.0365994 |
| 2 |
37 |
28.2443 |
20.5479 |
7.69633 |
| 3 |
29 |
22.1374 |
32.1918 |
-10.0544 |
| 4 |
14 |
10.687 |
8.21918 |
2.46784 |
| 5 |
17 |
12.9771 |
11.6438 |
1.33326 |
| 6 |
5 |
3.81679 |
2.05479 |
1.762 |
| 7 |
1 |
0.763359 |
2.05479 |
-1.29144 |
| 8 |
2 |
1.52672 |
2.05479 |
-0.528077 |
| 10 |
4 |
3.05344 |
2.73973 |
0.313709 |
| 12 |
1 |
0.763359 |
0.684932 |
0.0784273 |
| 14 |
1 |
0.763359 |
0.684932 |
0.0784273 |
| 20 |
1 |
0.763359 |
0.684932 |
0.0784273 |
Download CSV
PNG SVG
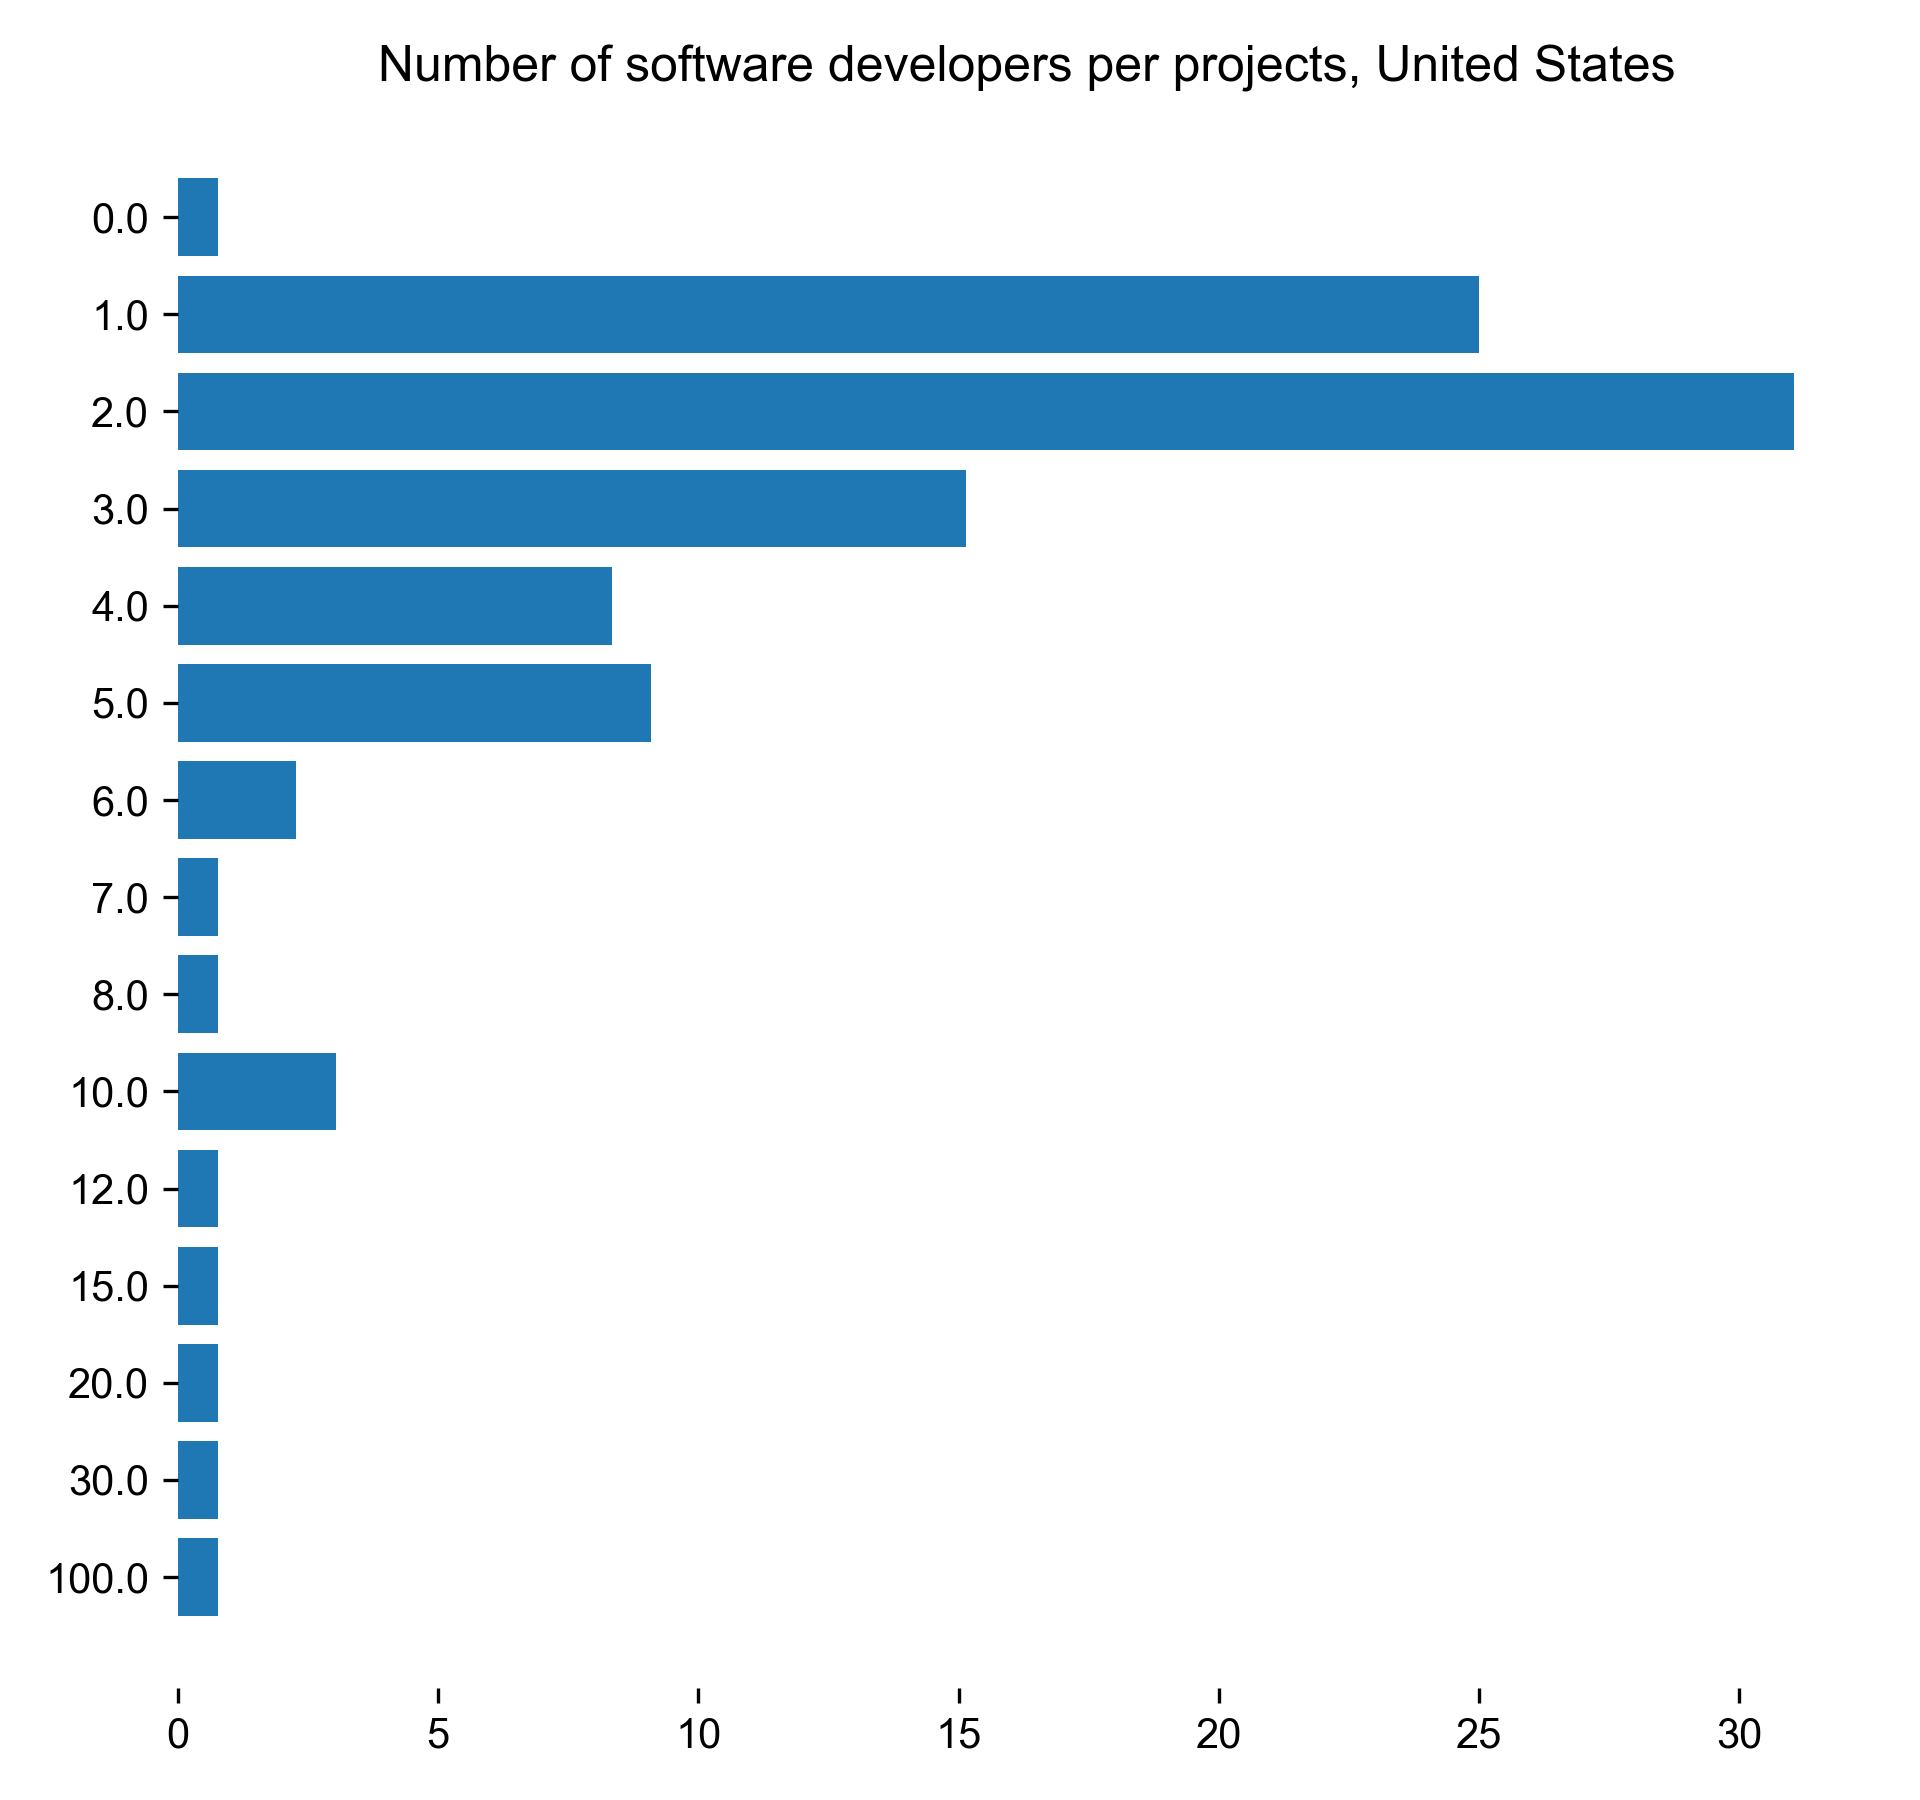
| Number of software developers per projects for United States |
Count |
Percentage |
| 0 |
1 |
0.757576 |
| 1 |
33 |
25 |
| 2 |
41 |
31.0606 |
| 3 |
20 |
15.1515 |
| 4 |
11 |
8.33333 |
| 5 |
12 |
9.09091 |
| 6 |
3 |
2.27273 |
| 7 |
1 |
0.757576 |
| 8 |
1 |
0.757576 |
| 10 |
4 |
3.0303 |
| 12 |
1 |
0.757576 |
| 15 |
1 |
0.757576 |
| 20 |
1 |
0.757576 |
| 30 |
1 |
0.757576 |
| 100 |
1 |
0.757576 |
Download CSV
PNG SVG
Training
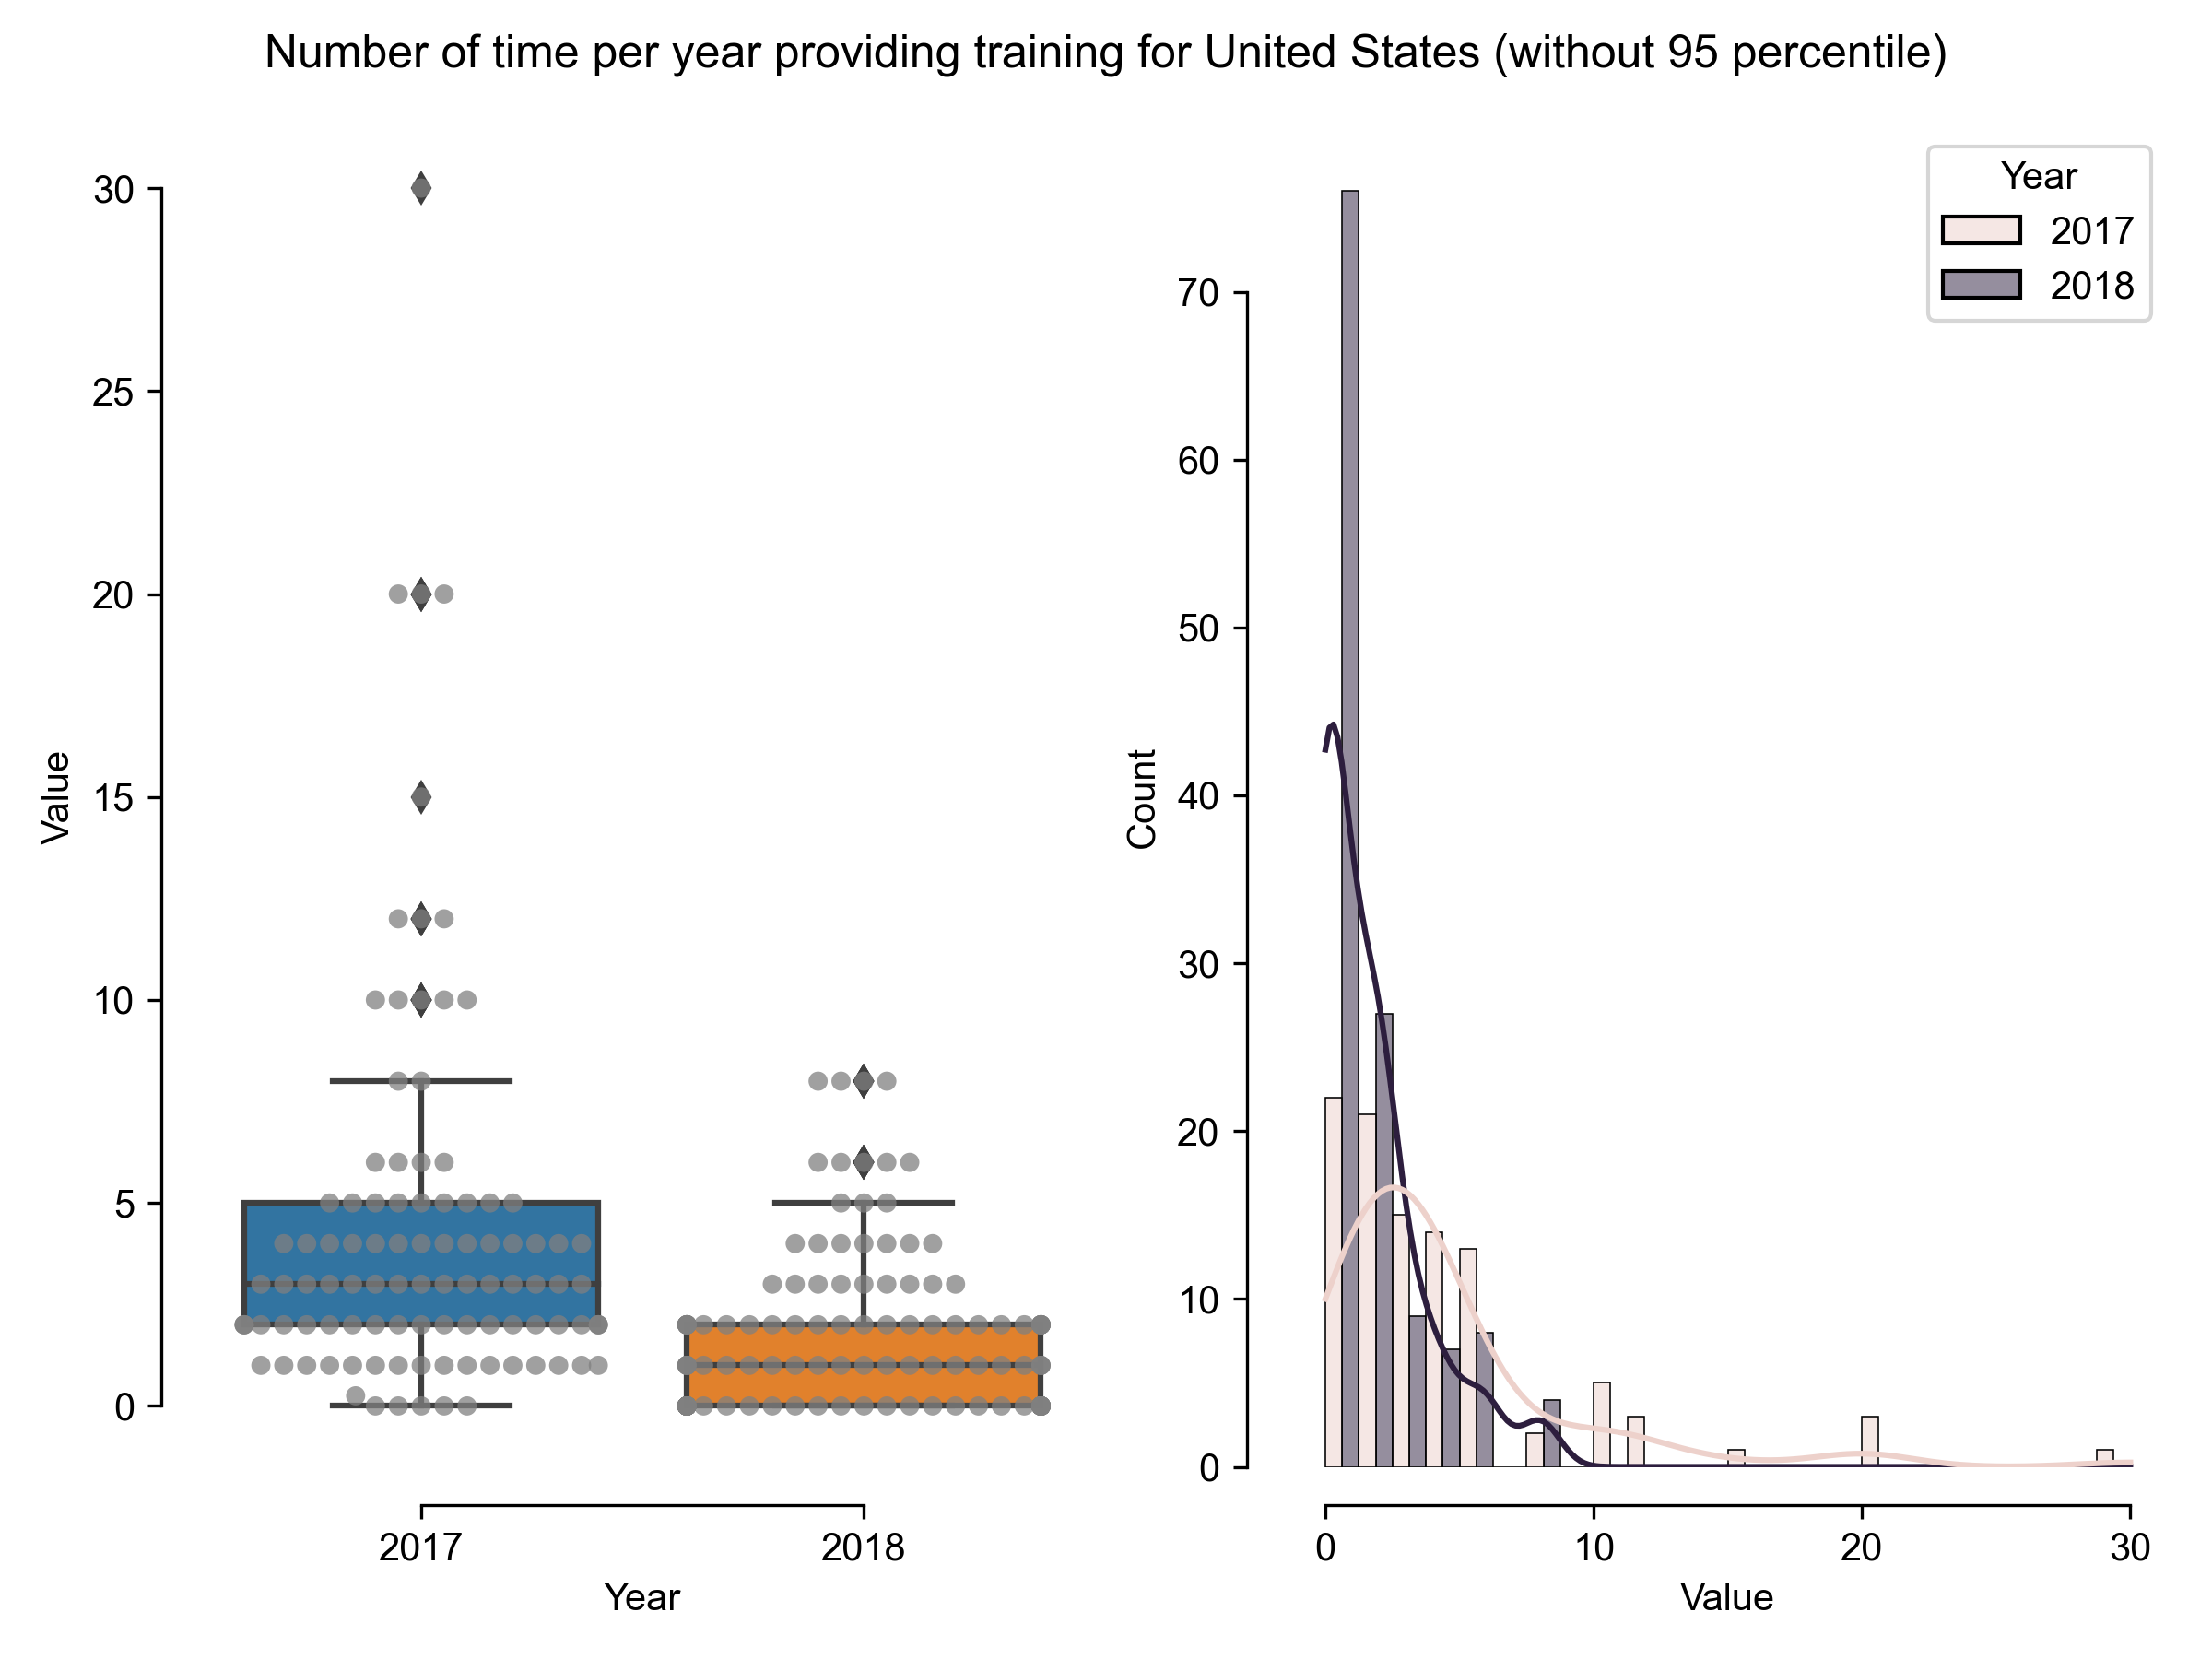
| Number of time per year providing training for United States (without 95 percentile) |
Results in 2018 |
Results in 2017 |
| count |
131 |
100 |
| mean |
1.58779 |
4.3525 |
| std |
1.96848 |
4.83948 |
| min |
0 |
0 |
| 25% |
0 |
2 |
| 50% |
1 |
3 |
| 75% |
2 |
5 |
| max |
8 |
30 |
Download CSV
PNG SVG
PNG SVG
World
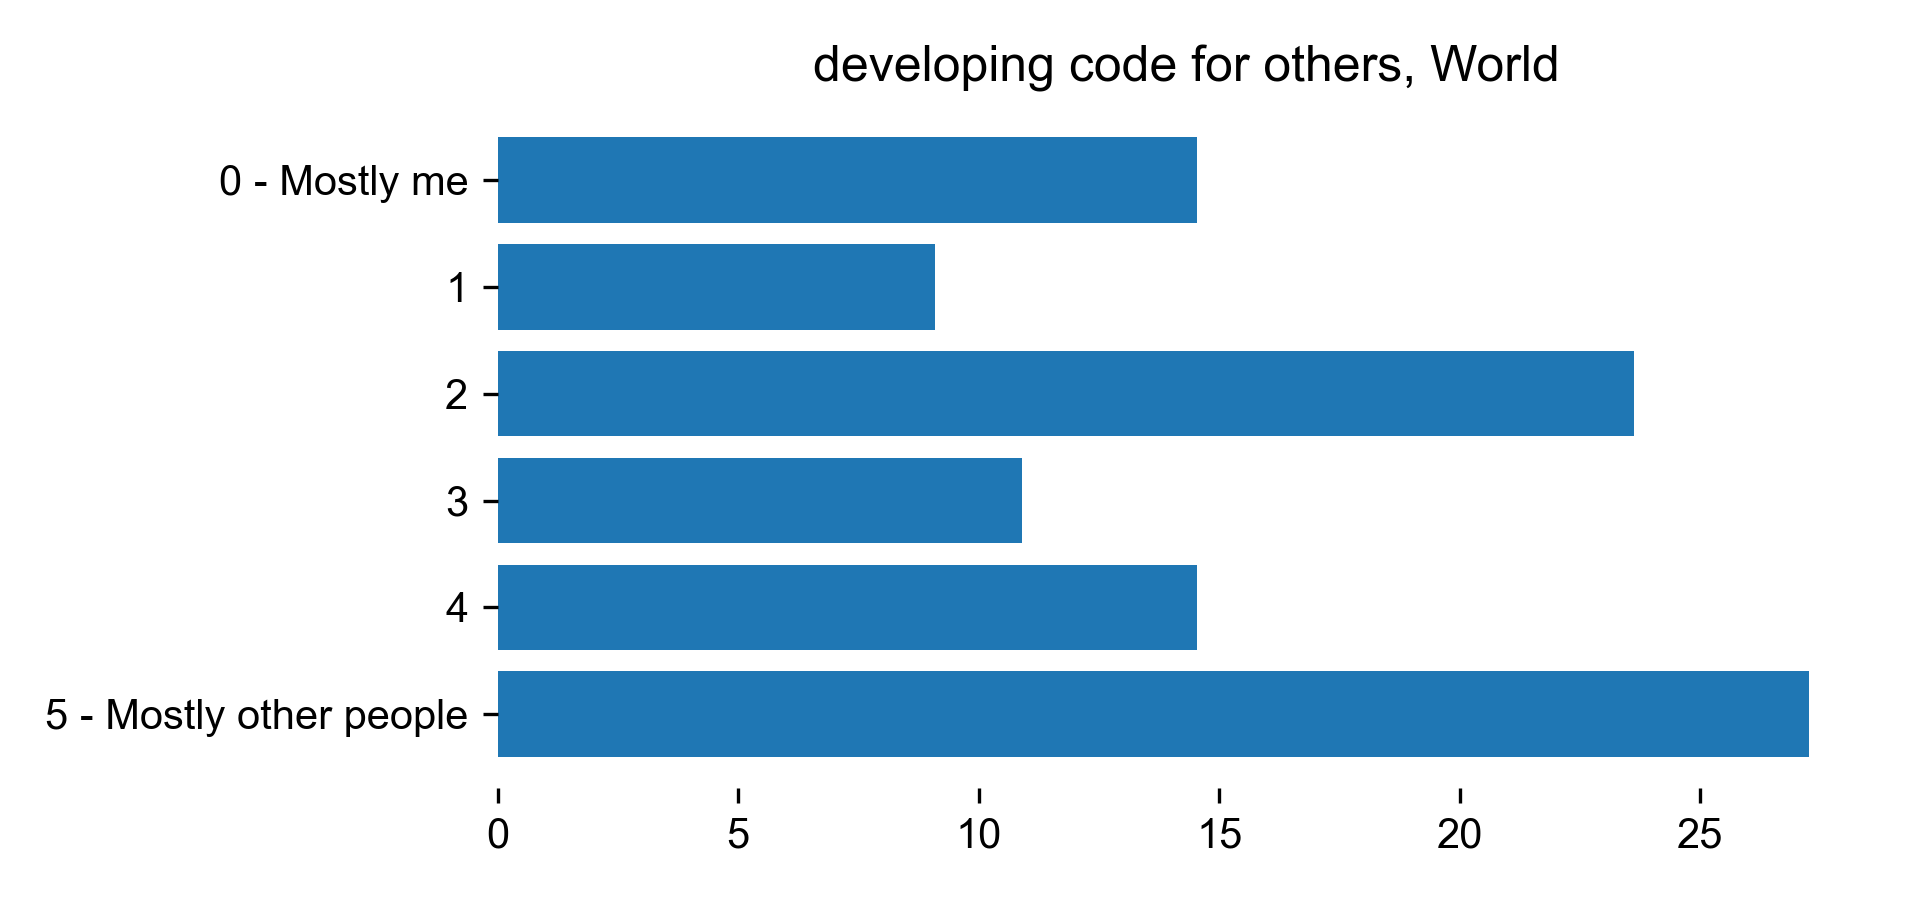
Developing code for others
| developing code for others for World |
Count |
Percentage |
| 0 - Mostly me |
8 |
14.5455 |
| 1 |
5 |
9.09091 |
| 2 |
13 |
23.6364 |
| 3 |
6 |
10.9091 |
| 4 |
8 |
14.5455 |
| 5 - Mostly other people |
15 |
27.2727 |
Download CSV
PNG SVG
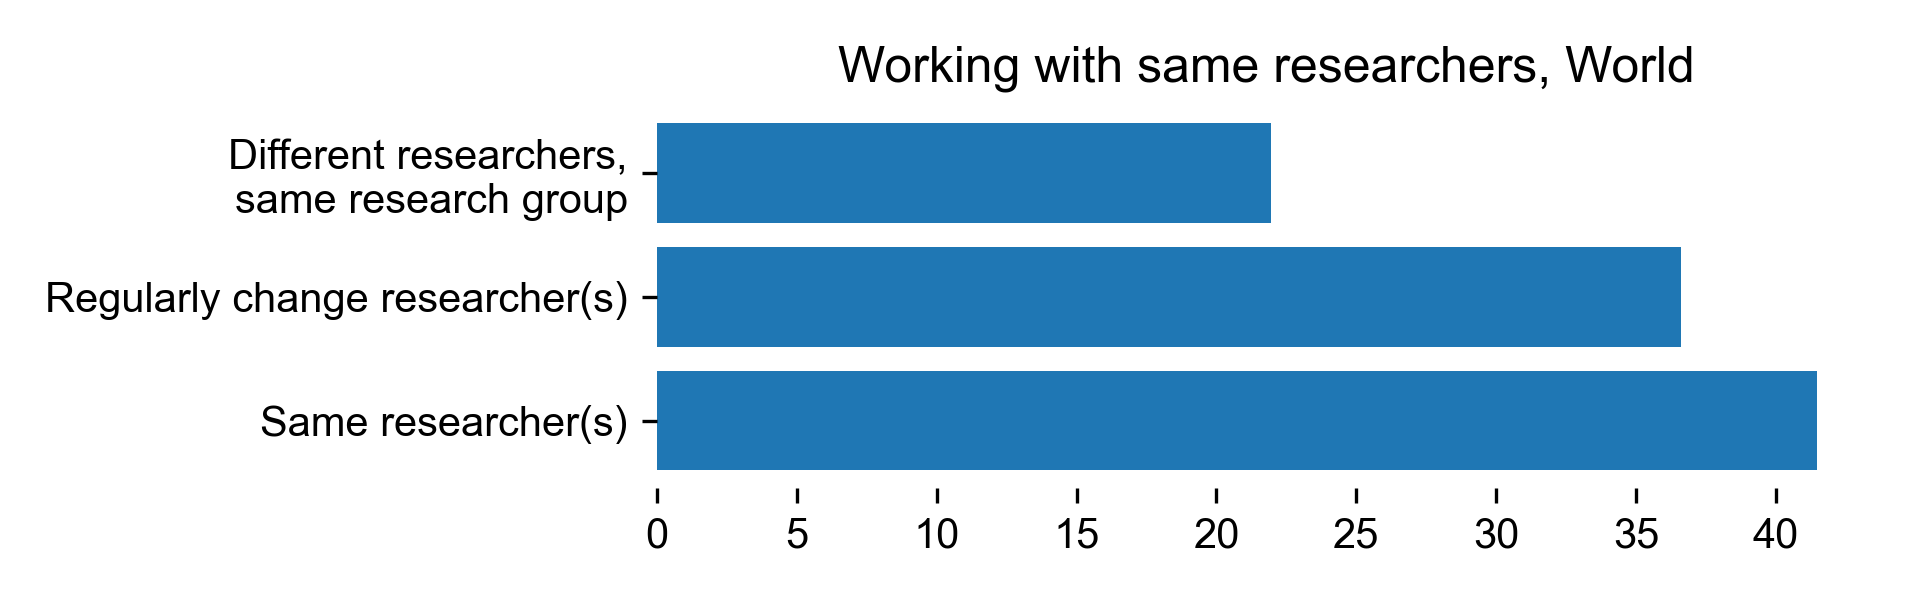
Working with same researchers
| Working with same researchers for World |
Count |
Percentage |
| Different researchers, same research group |
9 |
21.9512 |
| Regularly change researcher(s) |
15 |
36.5854 |
| Same researcher(s) |
17 |
41.4634 |
Download CSV
PNG SVG
Part of dedicated group
| member of a dedicated group for World |
Count |
Percentage |
| No |
24 |
58.5366 |
| Yes |
17 |
41.4634 |
Download CSV
PNG SVG
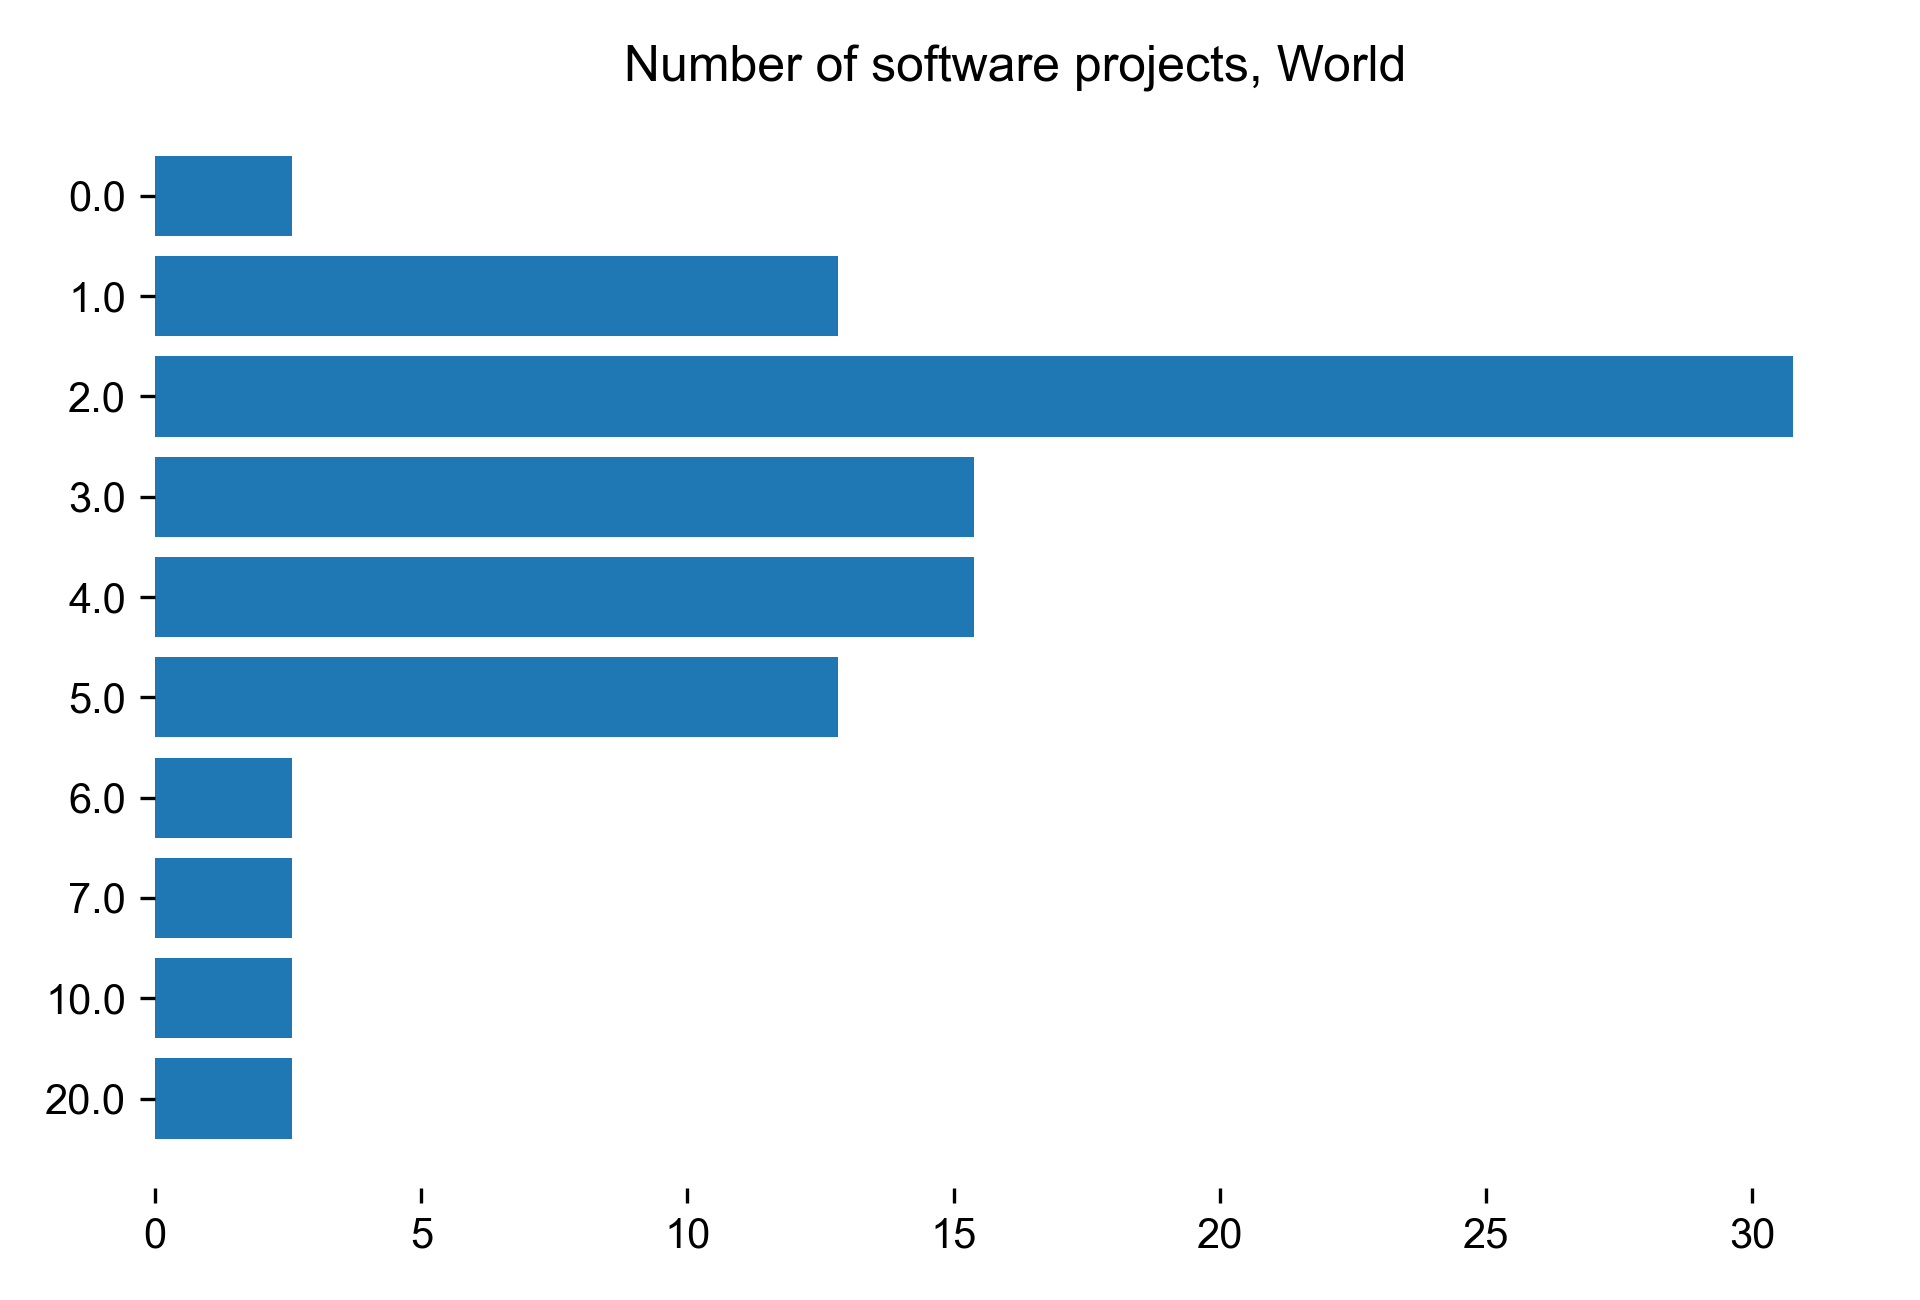
Number of projects
| Number of software projects for World |
Count |
Percentage |
| 0 |
1 |
2.5641 |
| 1 |
5 |
12.8205 |
| 2 |
12 |
30.7692 |
| 3 |
6 |
15.3846 |
| 4 |
6 |
15.3846 |
| 5 |
5 |
12.8205 |
| 6 |
1 |
2.5641 |
| 7 |
1 |
2.5641 |
| 10 |
1 |
2.5641 |
| 20 |
1 |
2.5641 |
Download CSV
PNG SVG
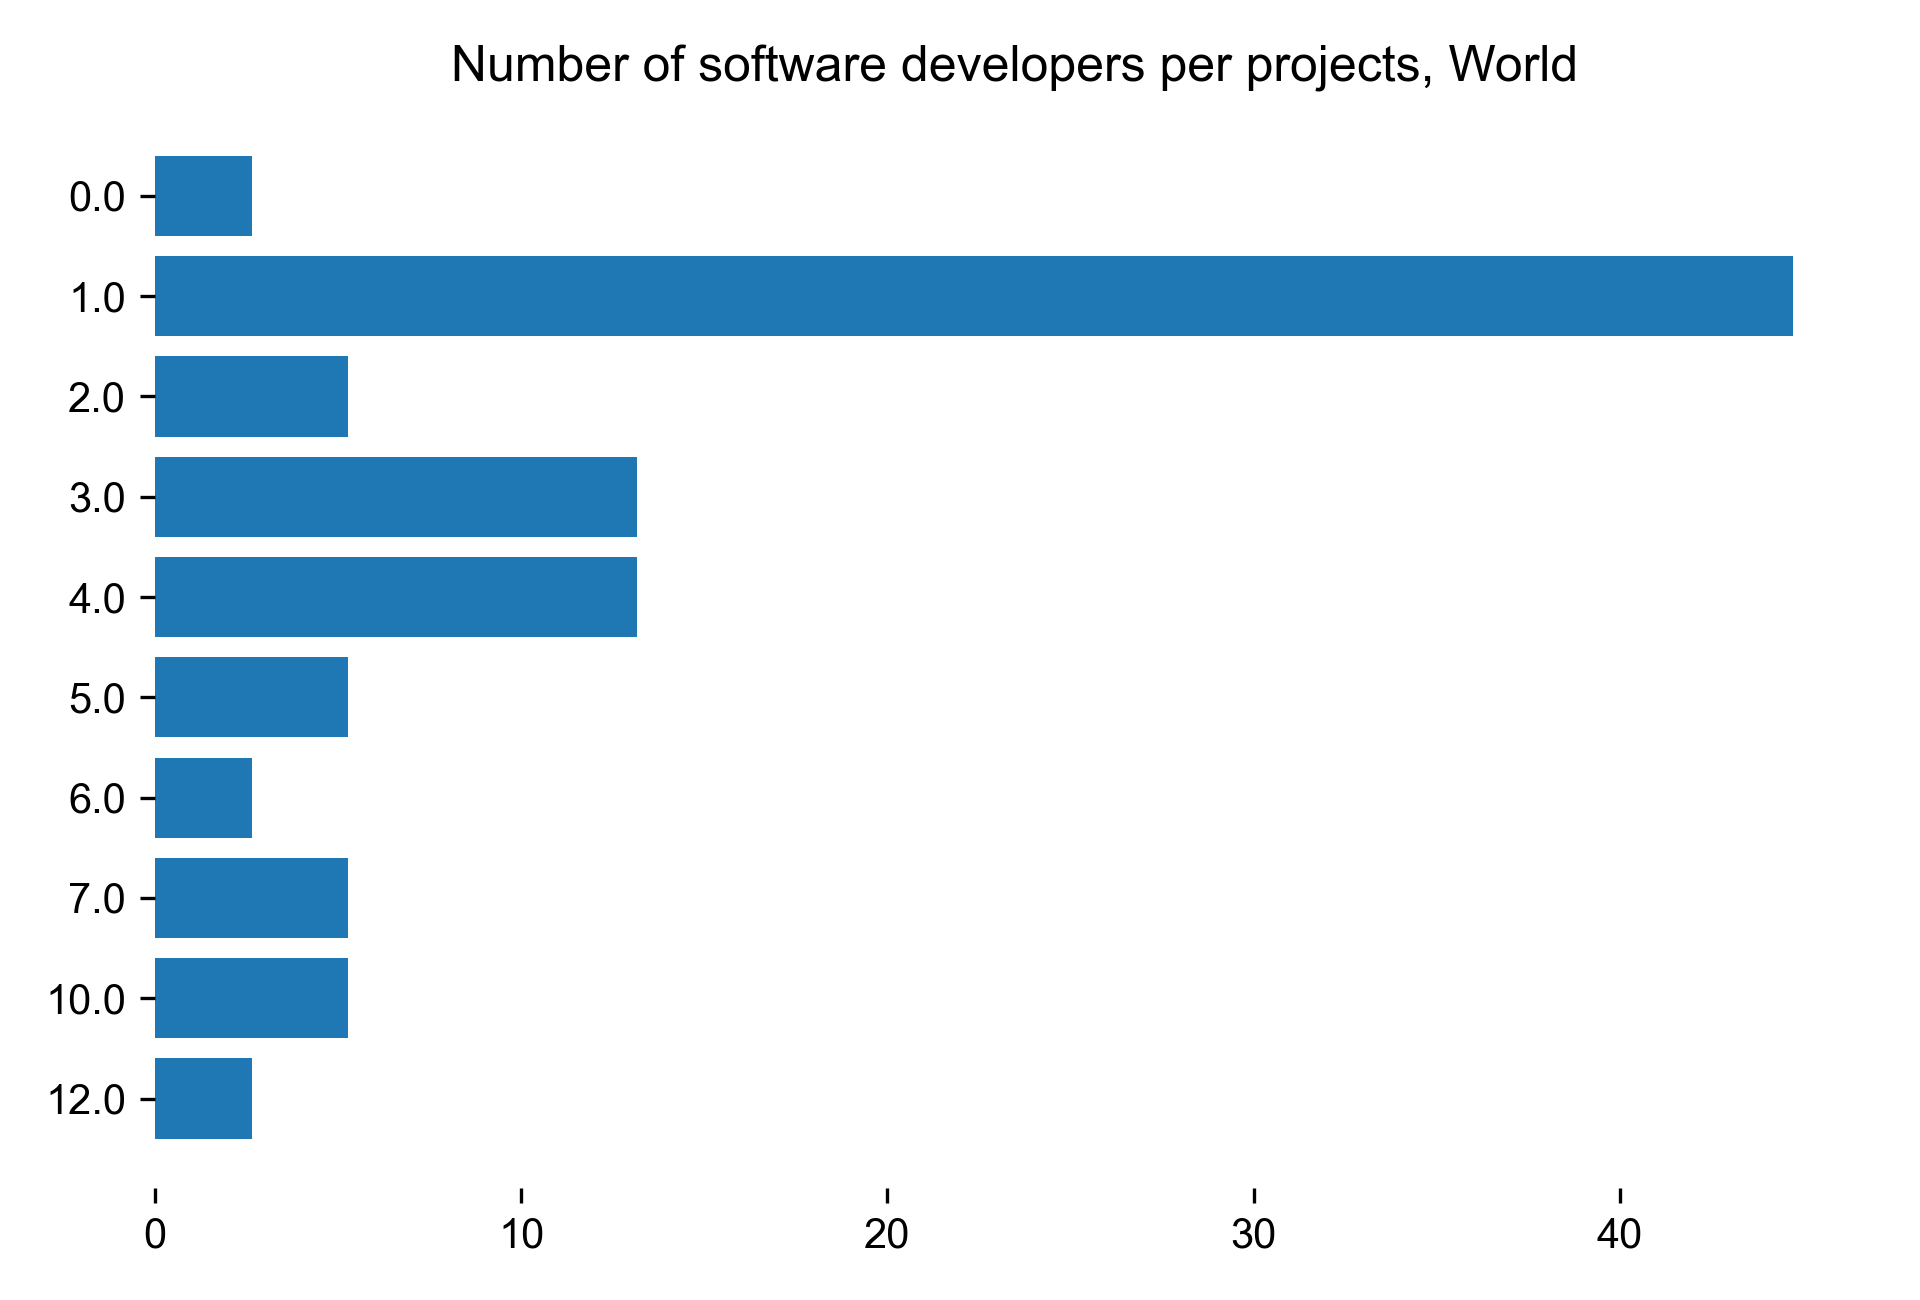
| Number of software developers per projects for World |
Count |
Percentage |
| 0 |
1 |
2.63158 |
| 1 |
17 |
44.7368 |
| 2 |
2 |
5.26316 |
| 3 |
5 |
13.1579 |
| 4 |
5 |
13.1579 |
| 5 |
2 |
5.26316 |
| 6 |
1 |
2.63158 |
| 7 |
2 |
5.26316 |
| 10 |
2 |
5.26316 |
| 12 |
1 |
2.63158 |
Download CSV
PNG SVG
Training
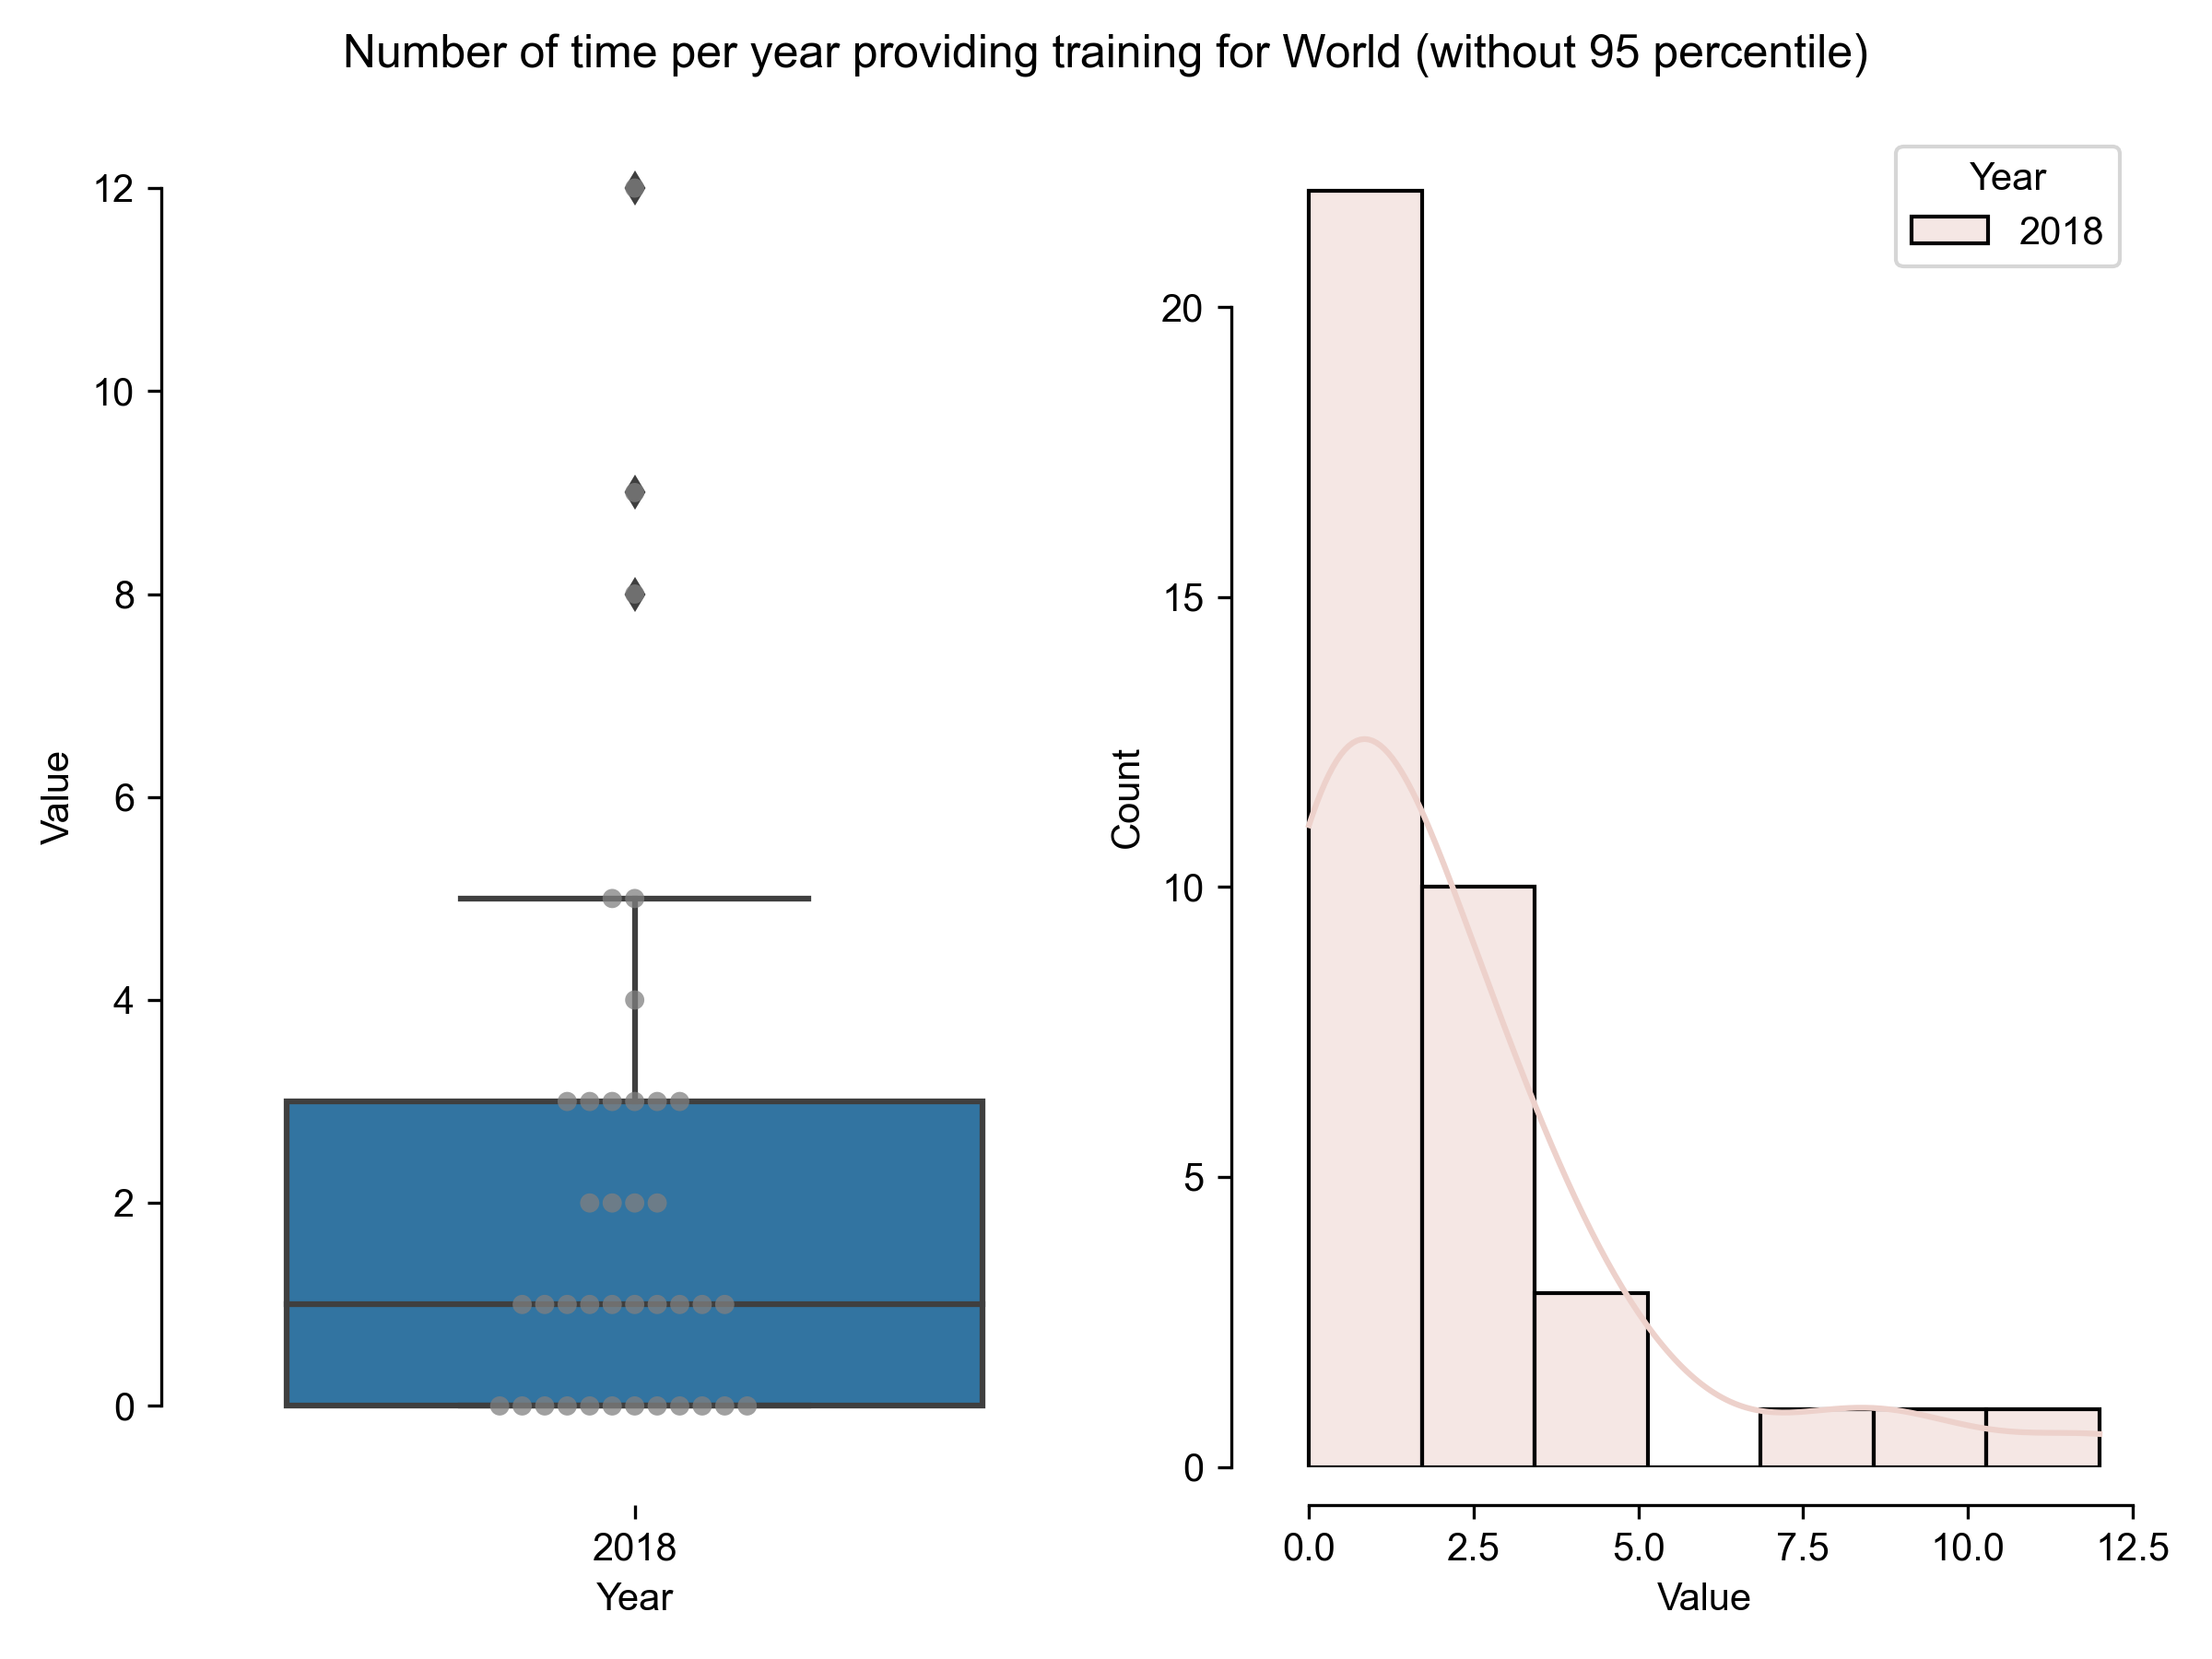
| Number of time per year providing training for World (without 95 percentile) |
Results in 2018 |
| count |
38 |
| mean |
2.07895 |
| std |
2.70517 |
| min |
0 |
| 25% |
0 |
| 50% |
1 |
| 75% |
3 |
| max |
12 |
Download CSV
PNG SVG
PNG SVG