How to read the plots Questions in this section Australia Germany Netherlands New Zealand South Africa United Kingdom United States World
RSE/RSE are supposed to be an hybrid role, compared to pure software developer.
They bring a knowledge from their field but also are developing software. To
capture this different tasks they may do during their work, we asked them how
they spend their time but also how they wish to spend their time to investigate
any difference between what they do and what they want to do.
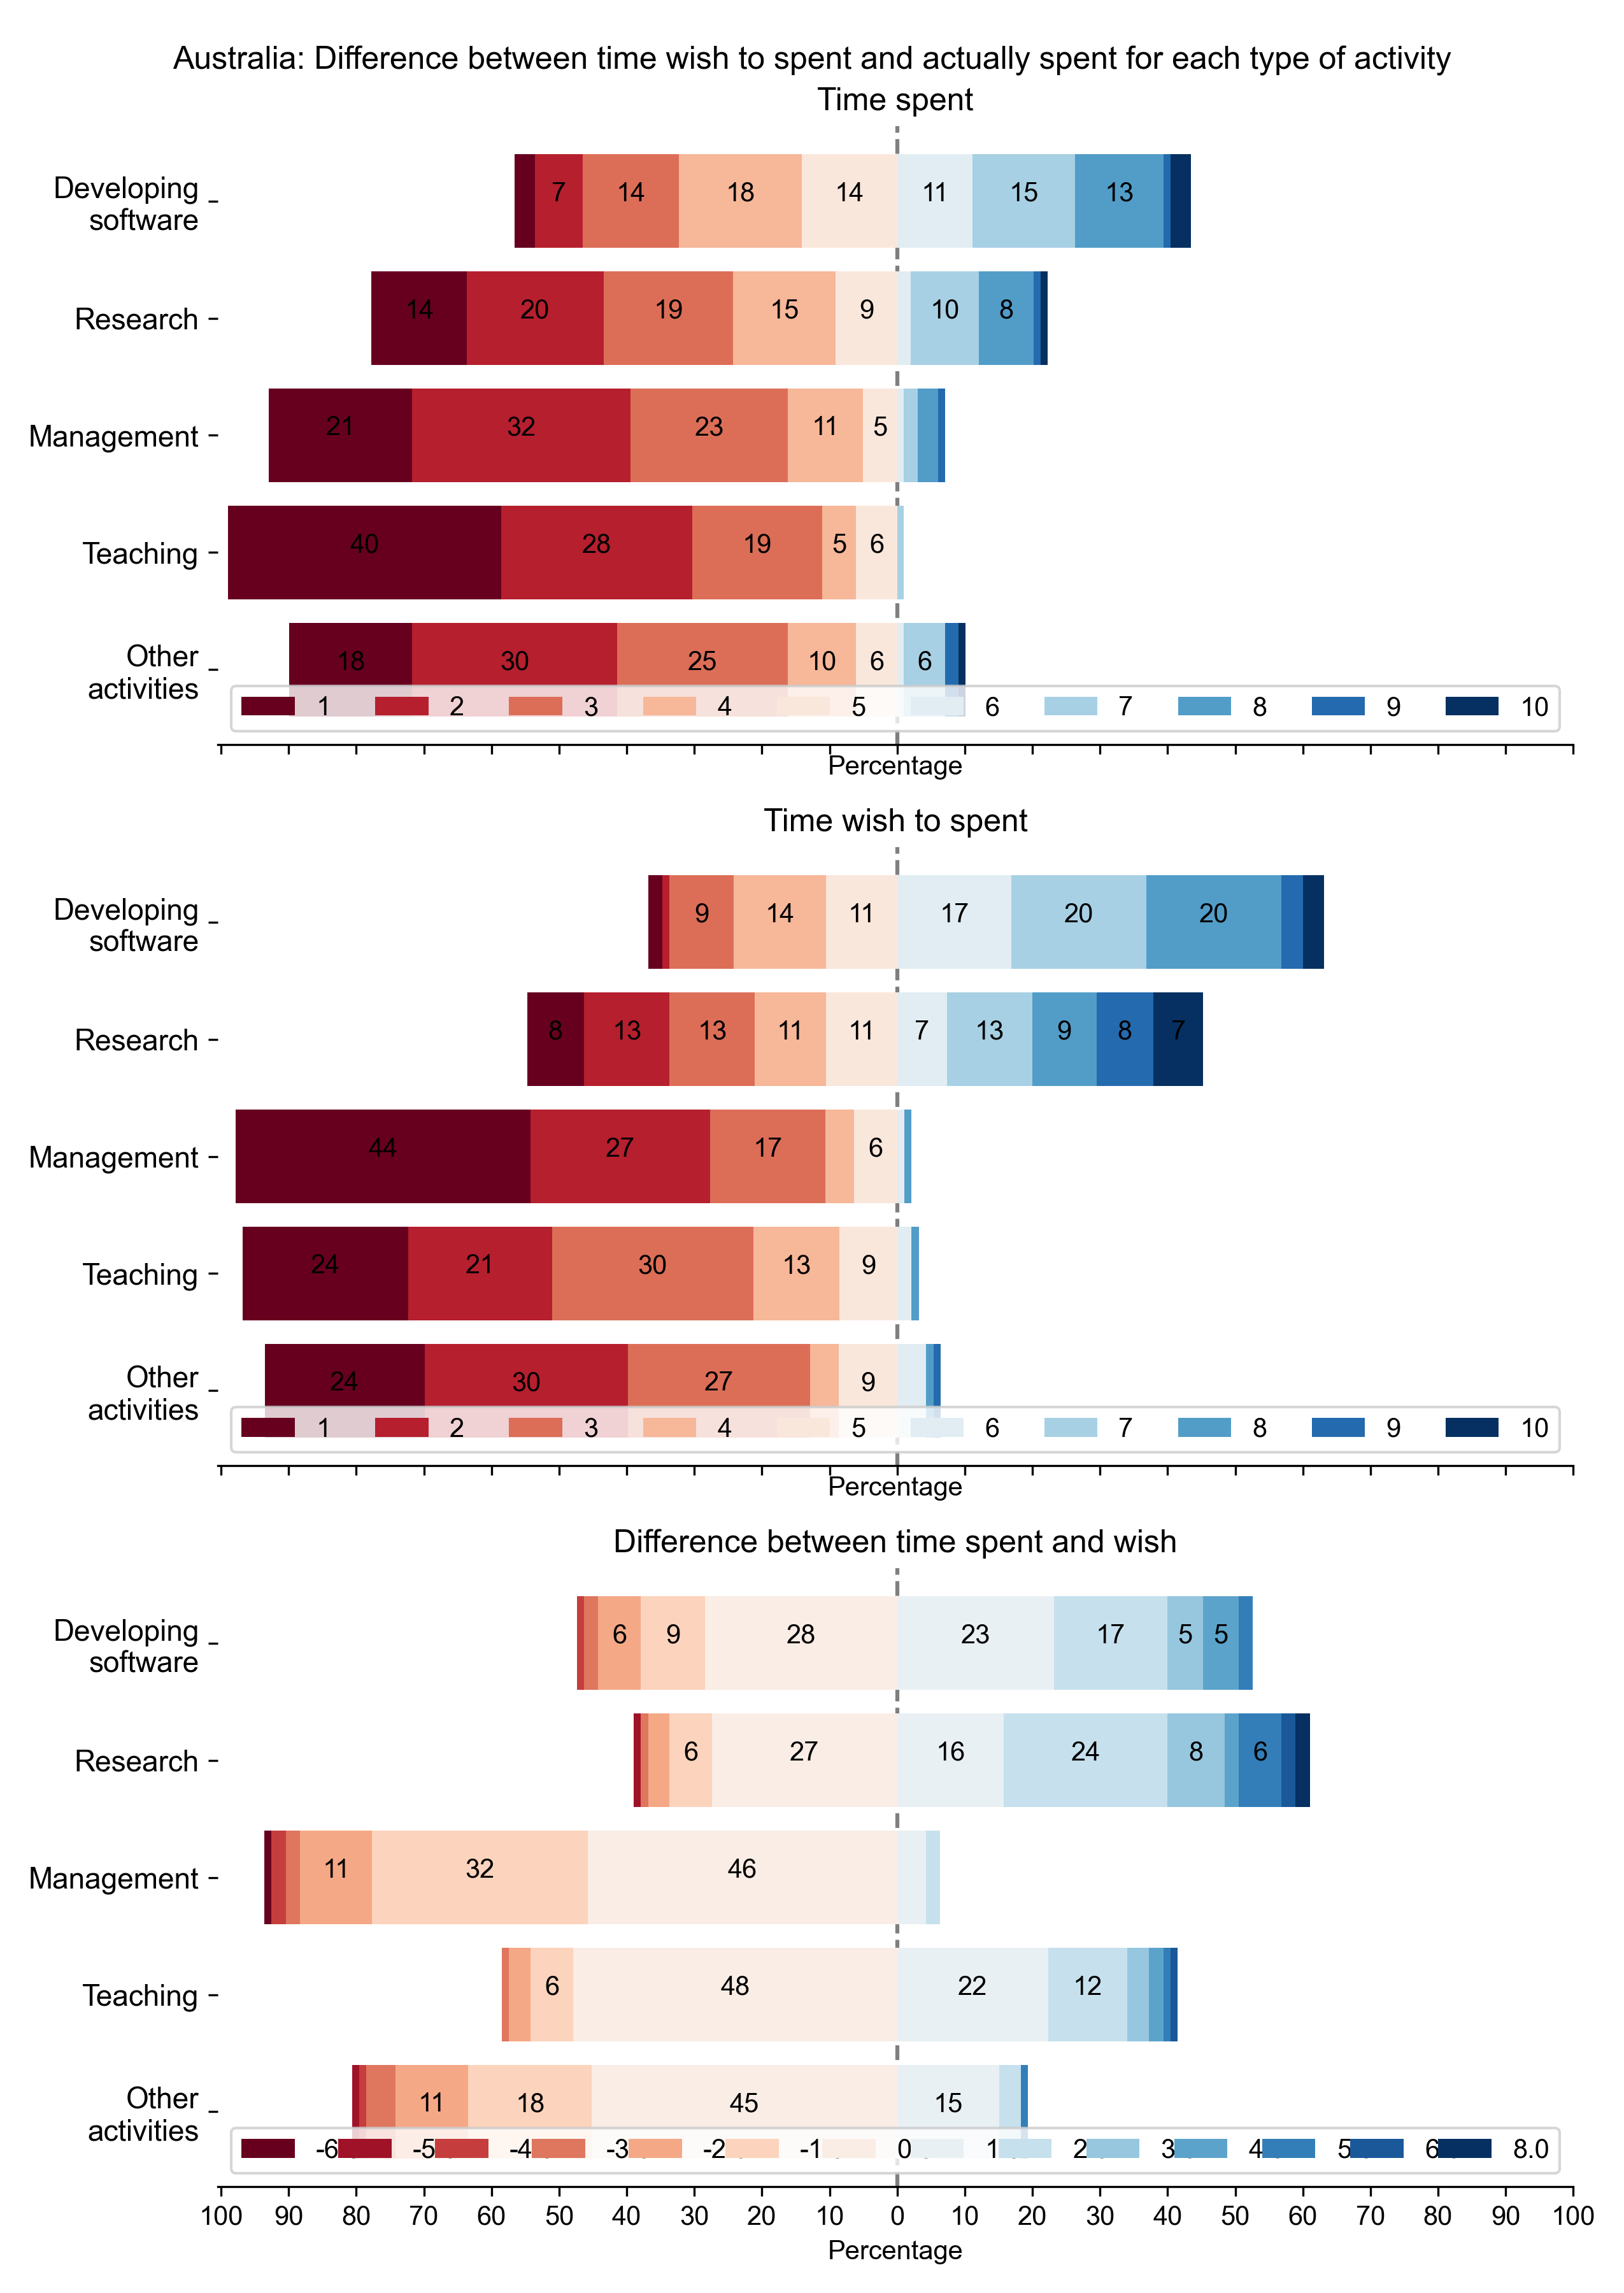
Respondents were asked how much time is spent in a particular activity using
a Likert scale from from 1 (None at all) to 10 (All my time) .
The same questions asked them how much time they wanted to spend on these
activities. With that it was possible to see if discrepancies exist between
what they actually do and what they want to do.
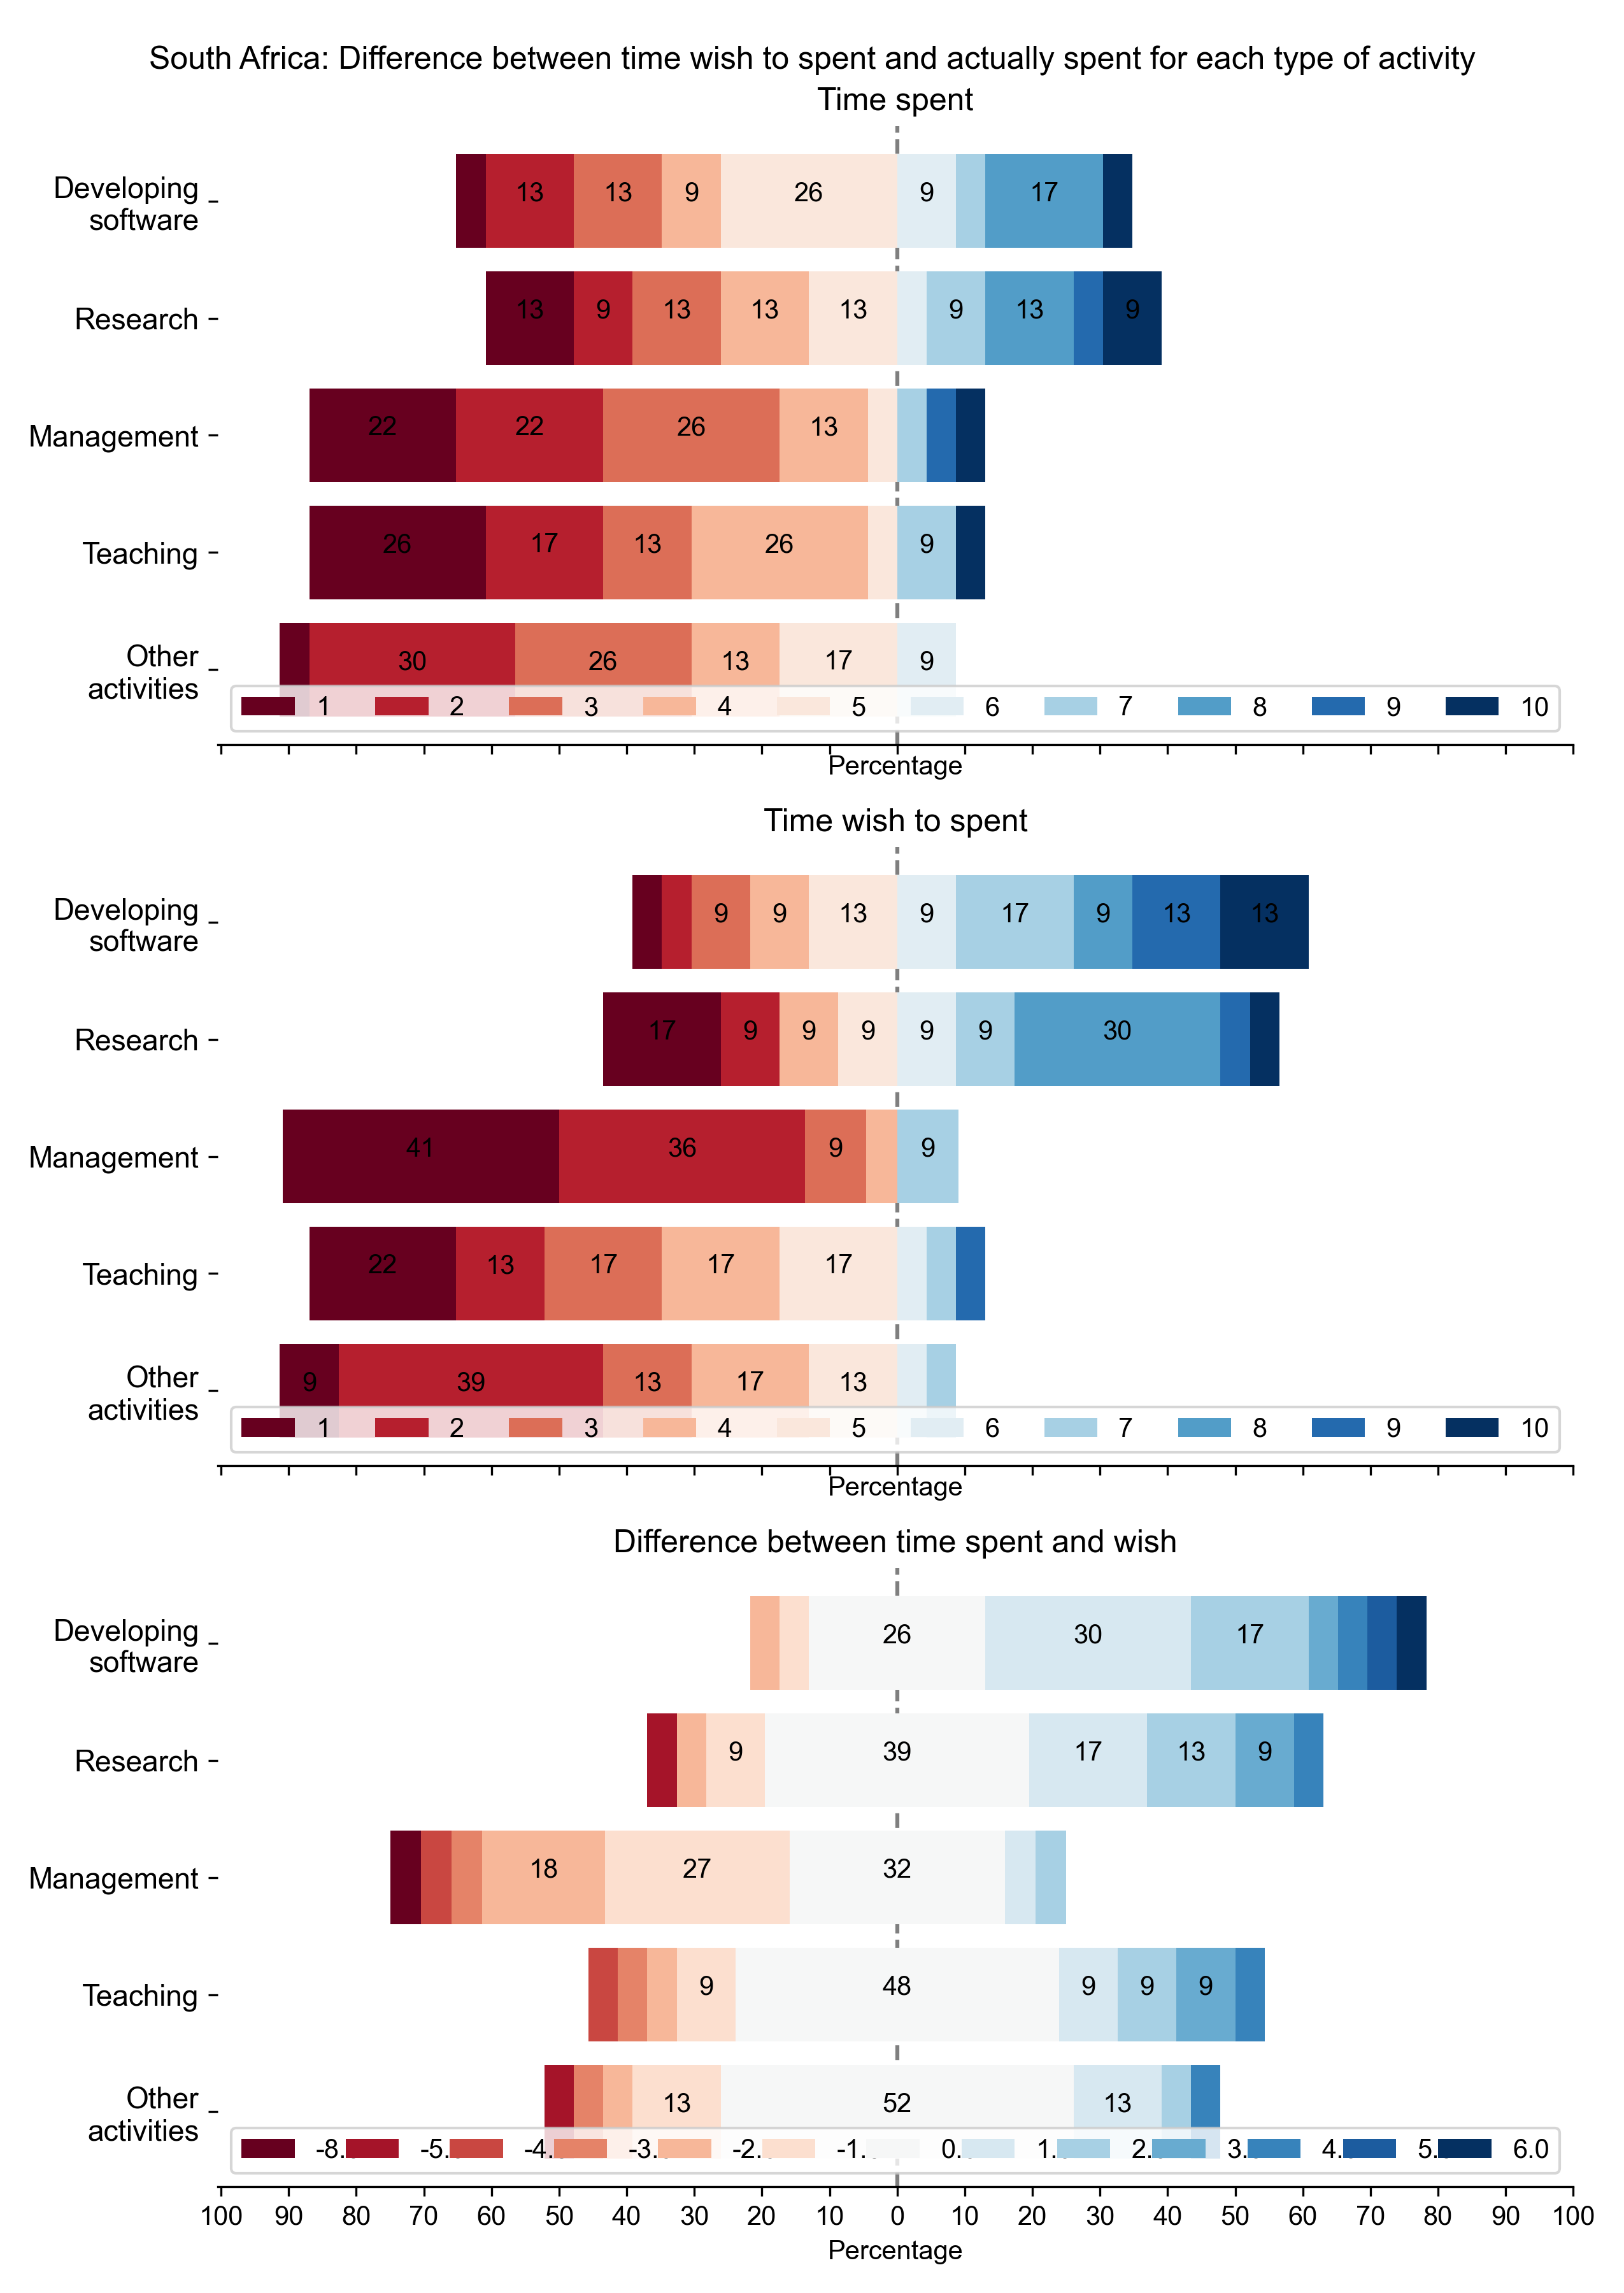
To read the results, when the bars shift to the right (in blue), it means they
reported positive values (from 6 to 10); when the bars are on the left (in
red), it means they reported more negative values (relative to the scale). Each
bar has a number that represents the percentage of participants that selected
that value. The total bar represents 100%.
To calculate the difference between what they want and what they do, we
subtract the answers to the the time that they wished to have spent from the
the answer to actual time spent . It is therefore possible to understand the
results as:
The result is zero : The time spent matches, they do as much as they want.
The result is negative : They wish to spend less time to do that activity
The result is positive : They wish to spend more time to do that activity
All questions were asked on a 1 to 10 Likert scale.
On average, how much of your time is spent developing software?
On average, how much of your time is spent on research?
On average, how much of your time is spent on management?
On average, how much of your time is spent on teaching?
On average, how much of your time is spent on other activities?
2021-08-04T21:03:25.168540
image/svg+xml
Matplotlib v3.4.2, https://matplotlib.org/
Percentage
Developing
software
Research
Management
Teaching
Other
activities
14
21
40
18
7
20
32
28
30
14
19
23
19
25
18
15
11
5
10
14
9
5
6
6
11
15
10
6
13
8
Time spent
1
2
3
4
5
6
7
8
9
10
Percentage
Developing
software
Research
Management
Teaching
Other
activities
8
44
24
24
13
27
21
30
9
13
17
30
27
14
11
13
11
11
6
9
9
17
7
20
13
20
9
8
7
Time wish to spent
1
2
3
4
5
6
7
8
9
10
100
90
80
70
60
50
40
30
20
10
0
10
20
30
40
50
60
70
80
90
100
Percentage
Developing
software
Research
Management
Teaching
Other
activities
6
11
11
9
6
32
6
18
28
27
46
48
45
23
16
22
15
17
24
12
5
8
5
6
Difference between time spent and wish
-6.0
-5.0
-4.0
-3.0
-2.0
-1.0
0.0
1.0
2.0
3.0
4.0
5.0
6.0
8.0
Australia: Difference between time wish to spent and actually spent for each type of activity
PNG SVG
2021-08-04T21:03:27.338326
image/svg+xml
Matplotlib v3.4.2, https://matplotlib.org/
Percentage
Developing
software
Research
Management
Teaching
Other
activities
6
15
51
11
17
33
26
34
19
22
18
13
22
13
17
11
14
14
12
8
11
12
8
5
18
9
13
Time spent
1
2
3
4
5
6
7
8
9
10
Percentage
Developing
software
Research
Management
Teaching
Other
activities
32
29
23
6
28
25
31
9
9
20
21
21
12
13
7
10
8
20
21
7
9
9
14
13
18
13
16
10
5
6
5
Time wish to spent
1
2
3
4
5
6
7
8
9
10
100
90
80
70
60
50
40
30
20
10
0
10
20
30
40
50
60
70
80
90
100
Percentage
Developing
software
Research
Management
Teaching
Other
activities
13
10
12
26
8
20
33
23
32
42
42
20
26
9
22
10
17
21
15
7
11
5
7
Difference between time spent and wish
-7.0
-6.0
-5.0
-4.0
-3.0
-2.0
-1.0
0.0
1.0
2.0
3.0
4.0
5.0
6.0
7.0
8.0
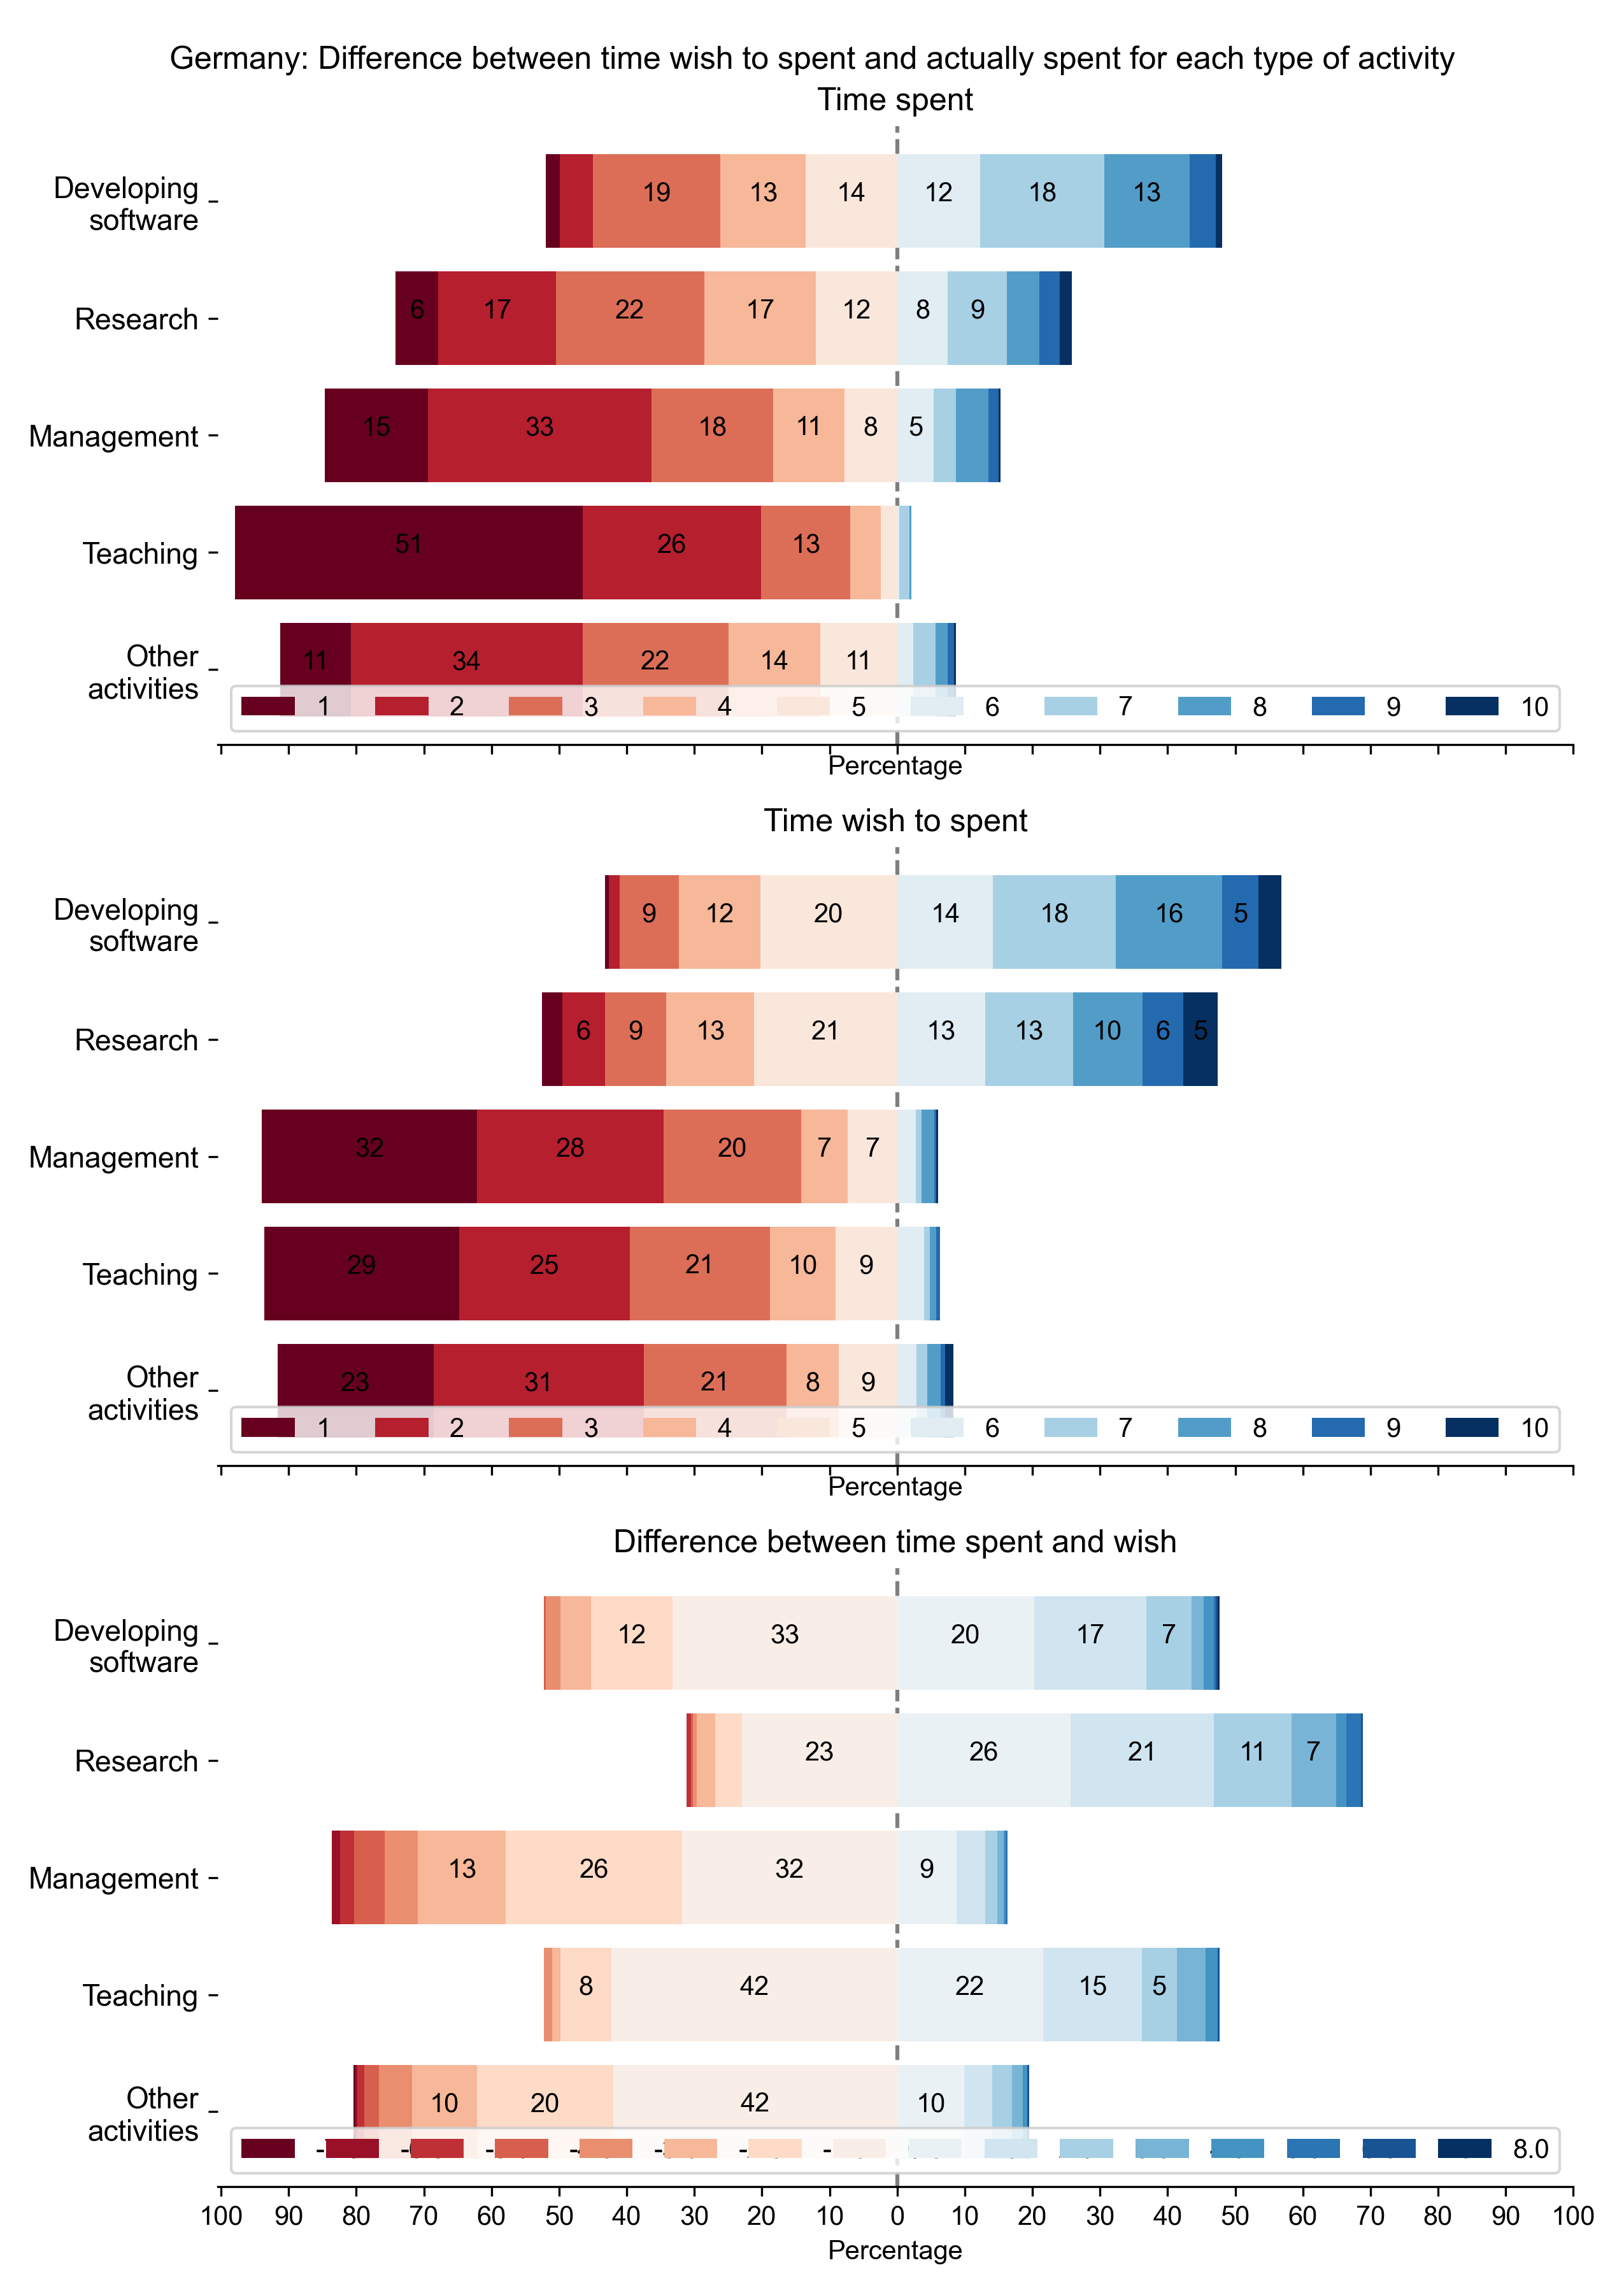
Germany: Difference between time wish to spent and actually spent for each type of activity
PNG SVG
2021-08-04T21:03:29.239816
image/svg+xml
Matplotlib v3.4.2, https://matplotlib.org/
Percentage
Developing
software
Research
Management
Teaching
Other
activities
13
22
41
7
13
35
39
26
33
15
11
17
15
35
17
13
11
11
15
9
7
6
6
17
7
6
11
9
9
9
Time spent
1
2
3
4
5
6
7
8
9
10
Percentage
Developing
software
Research
Management
Teaching
Other
activities
Time wish to spent
1
2
3
4
5
6
7
8
9
10
100
90
80
70
60
50
40
30
20
10
0
10
20
30
40
50
60
70
80
90
100
Percentage
Developing
software
Research
Management
Teaching
Other
activities
100
100
100
100
100
Difference between time spent and wish
nan
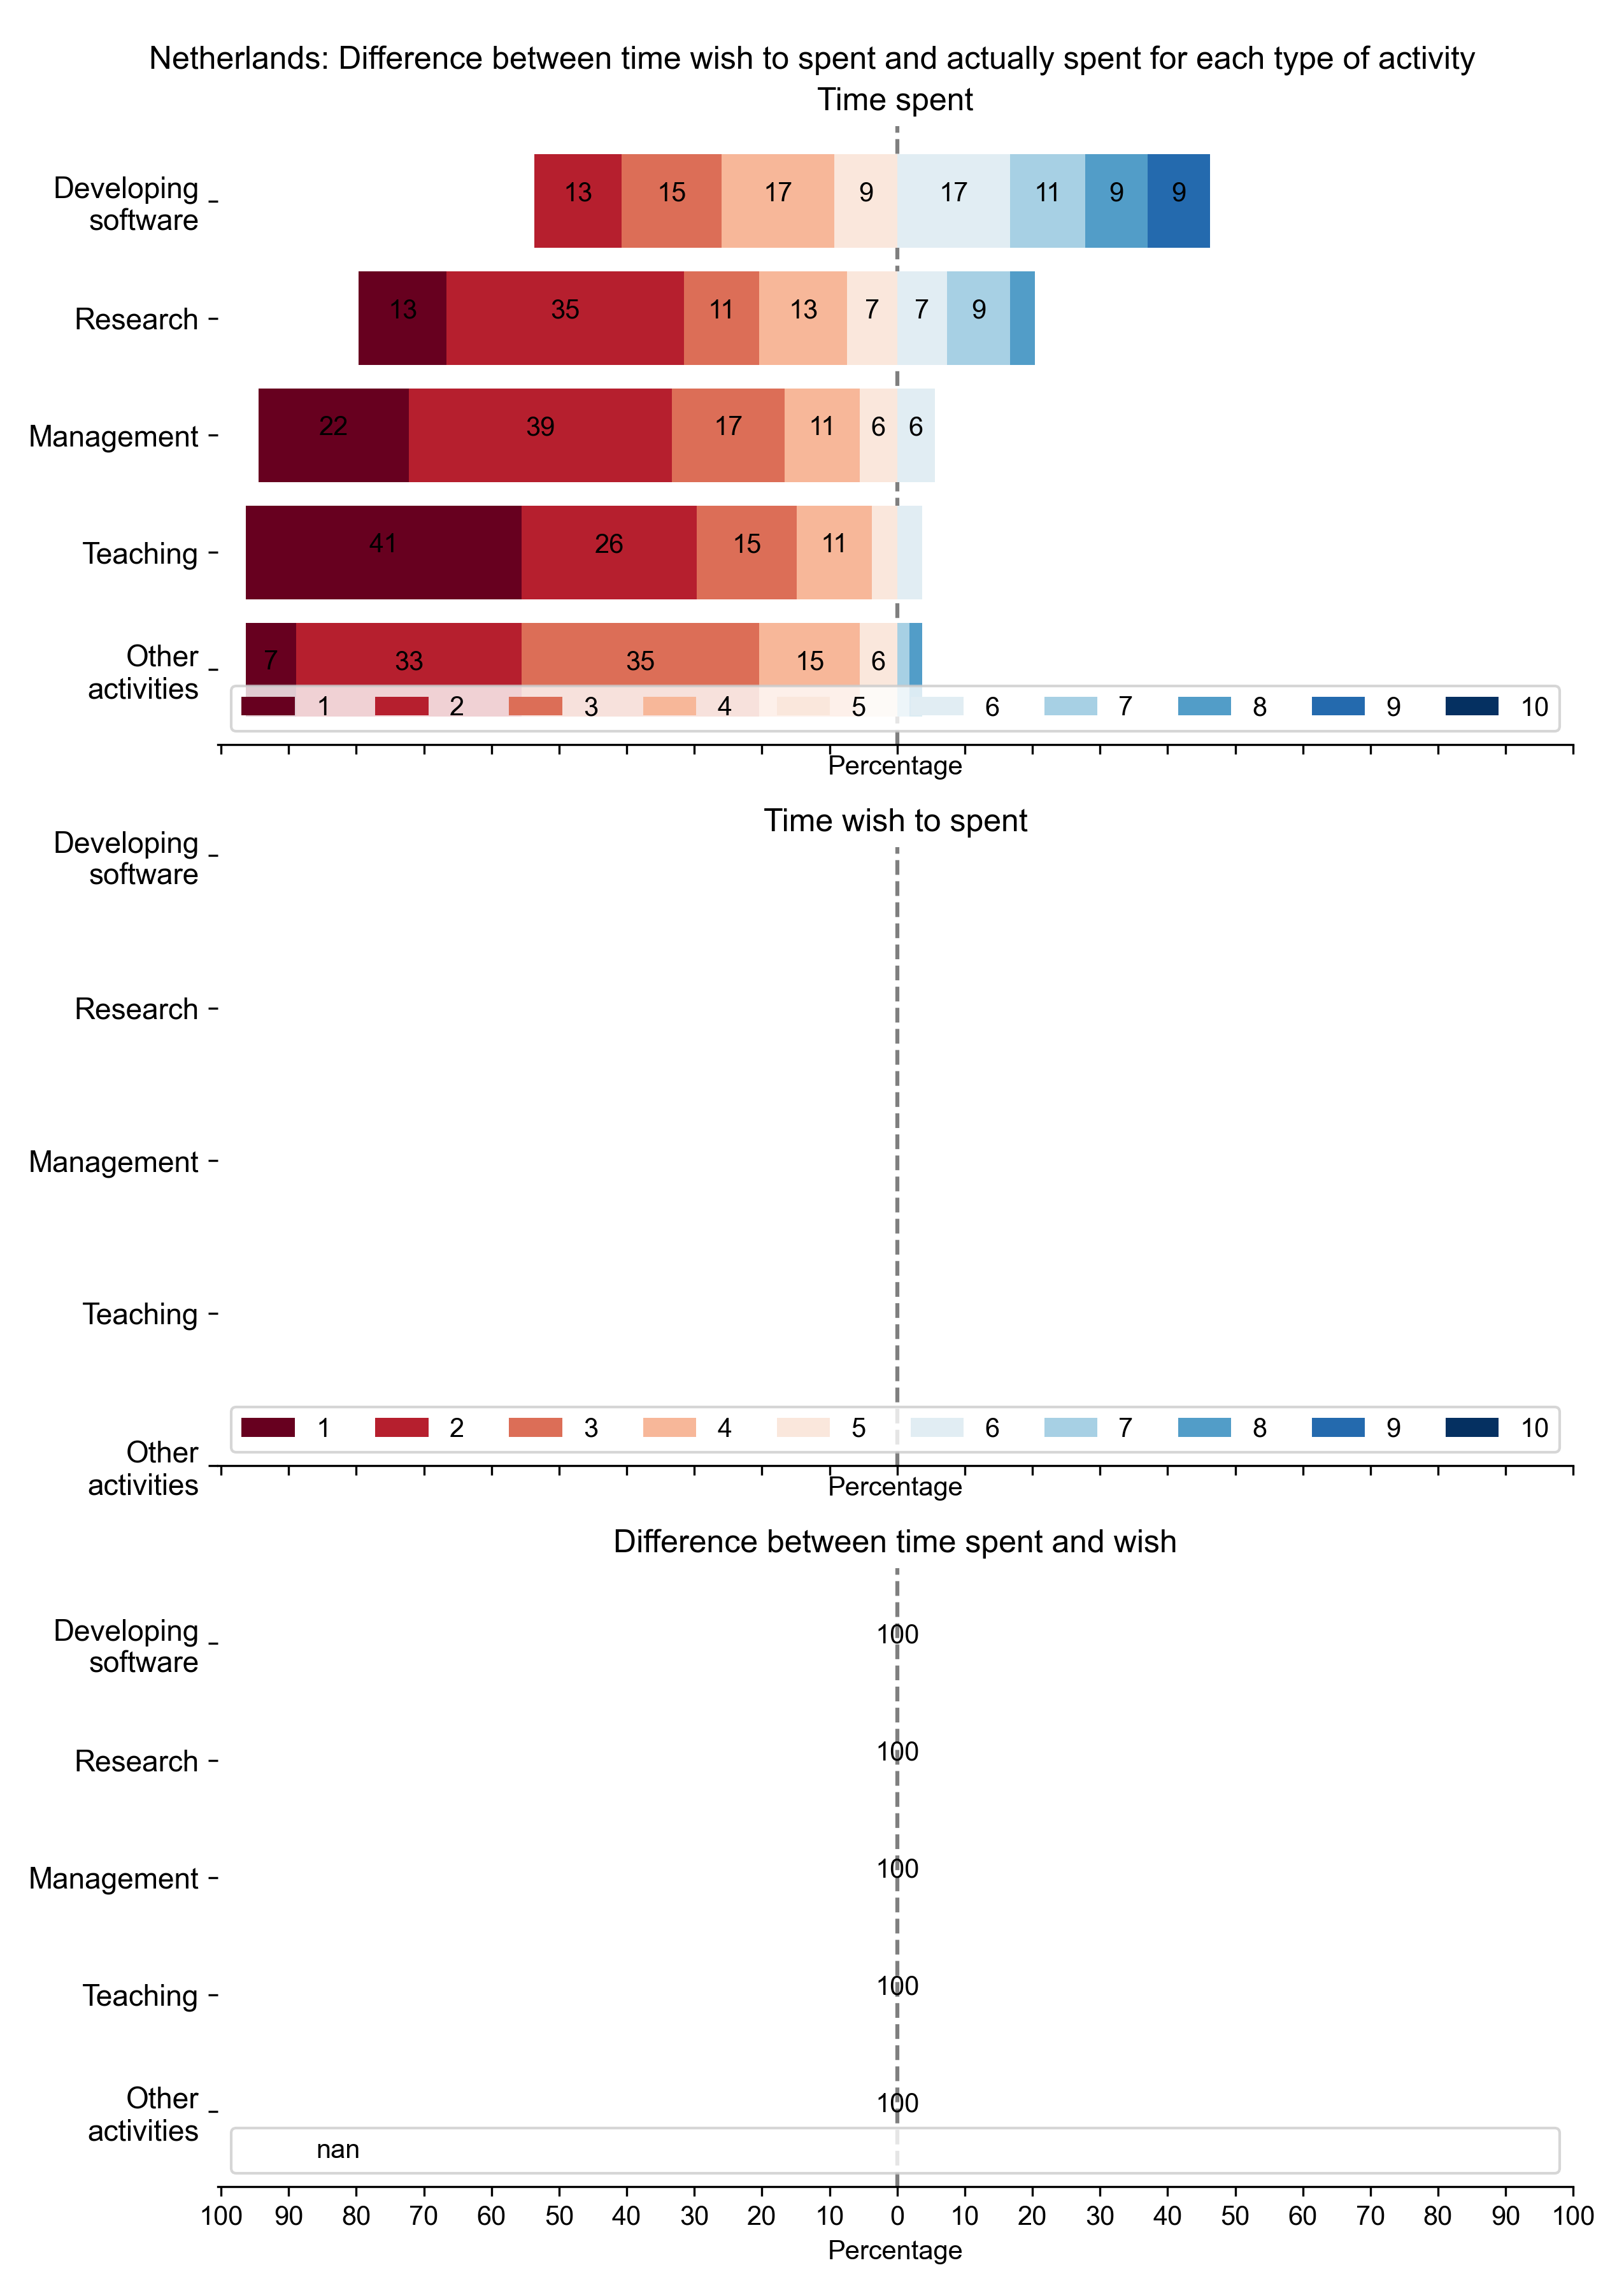
Netherlands: Difference between time wish to spent and actually spent for each type of activity
PNG SVG
2021-08-04T21:03:31.205560
image/svg+xml
Matplotlib v3.4.2, https://matplotlib.org/
Percentage
Developing
software
Research
Management
Teaching
Other
activities
11
27
68
14
5
19
46
22
35
8
27
16
8
27
8
8
8
14
8
19
5
16
5
5
14
22
5
16
Time spent
1
2
3
4
5
6
7
8
9
10
Percentage
Developing
software
Research
Management
Teaching
Other
activities
6
53
46
18
11
39
31
38
8
22
14
29
17
19
6
6
14
14
6
6
11
6
11
6
31
6
8
Time wish to spent
1
2
3
4
5
6
7
8
9
10
100
90
80
70
60
50
40
30
20
10
0
10
20
30
40
50
60
70
80
90
100
Percentage
Developing
software
Research
Management
Teaching
Other
activities
6
8
6
6
19
31
24
44
47
53
69
53
22
25
9
12
22
6
9
6
Difference between time spent and wish
-5.0
-3.0
-2.0
-1.0
0.0
1.0
2.0
3.0
4.0
5.0
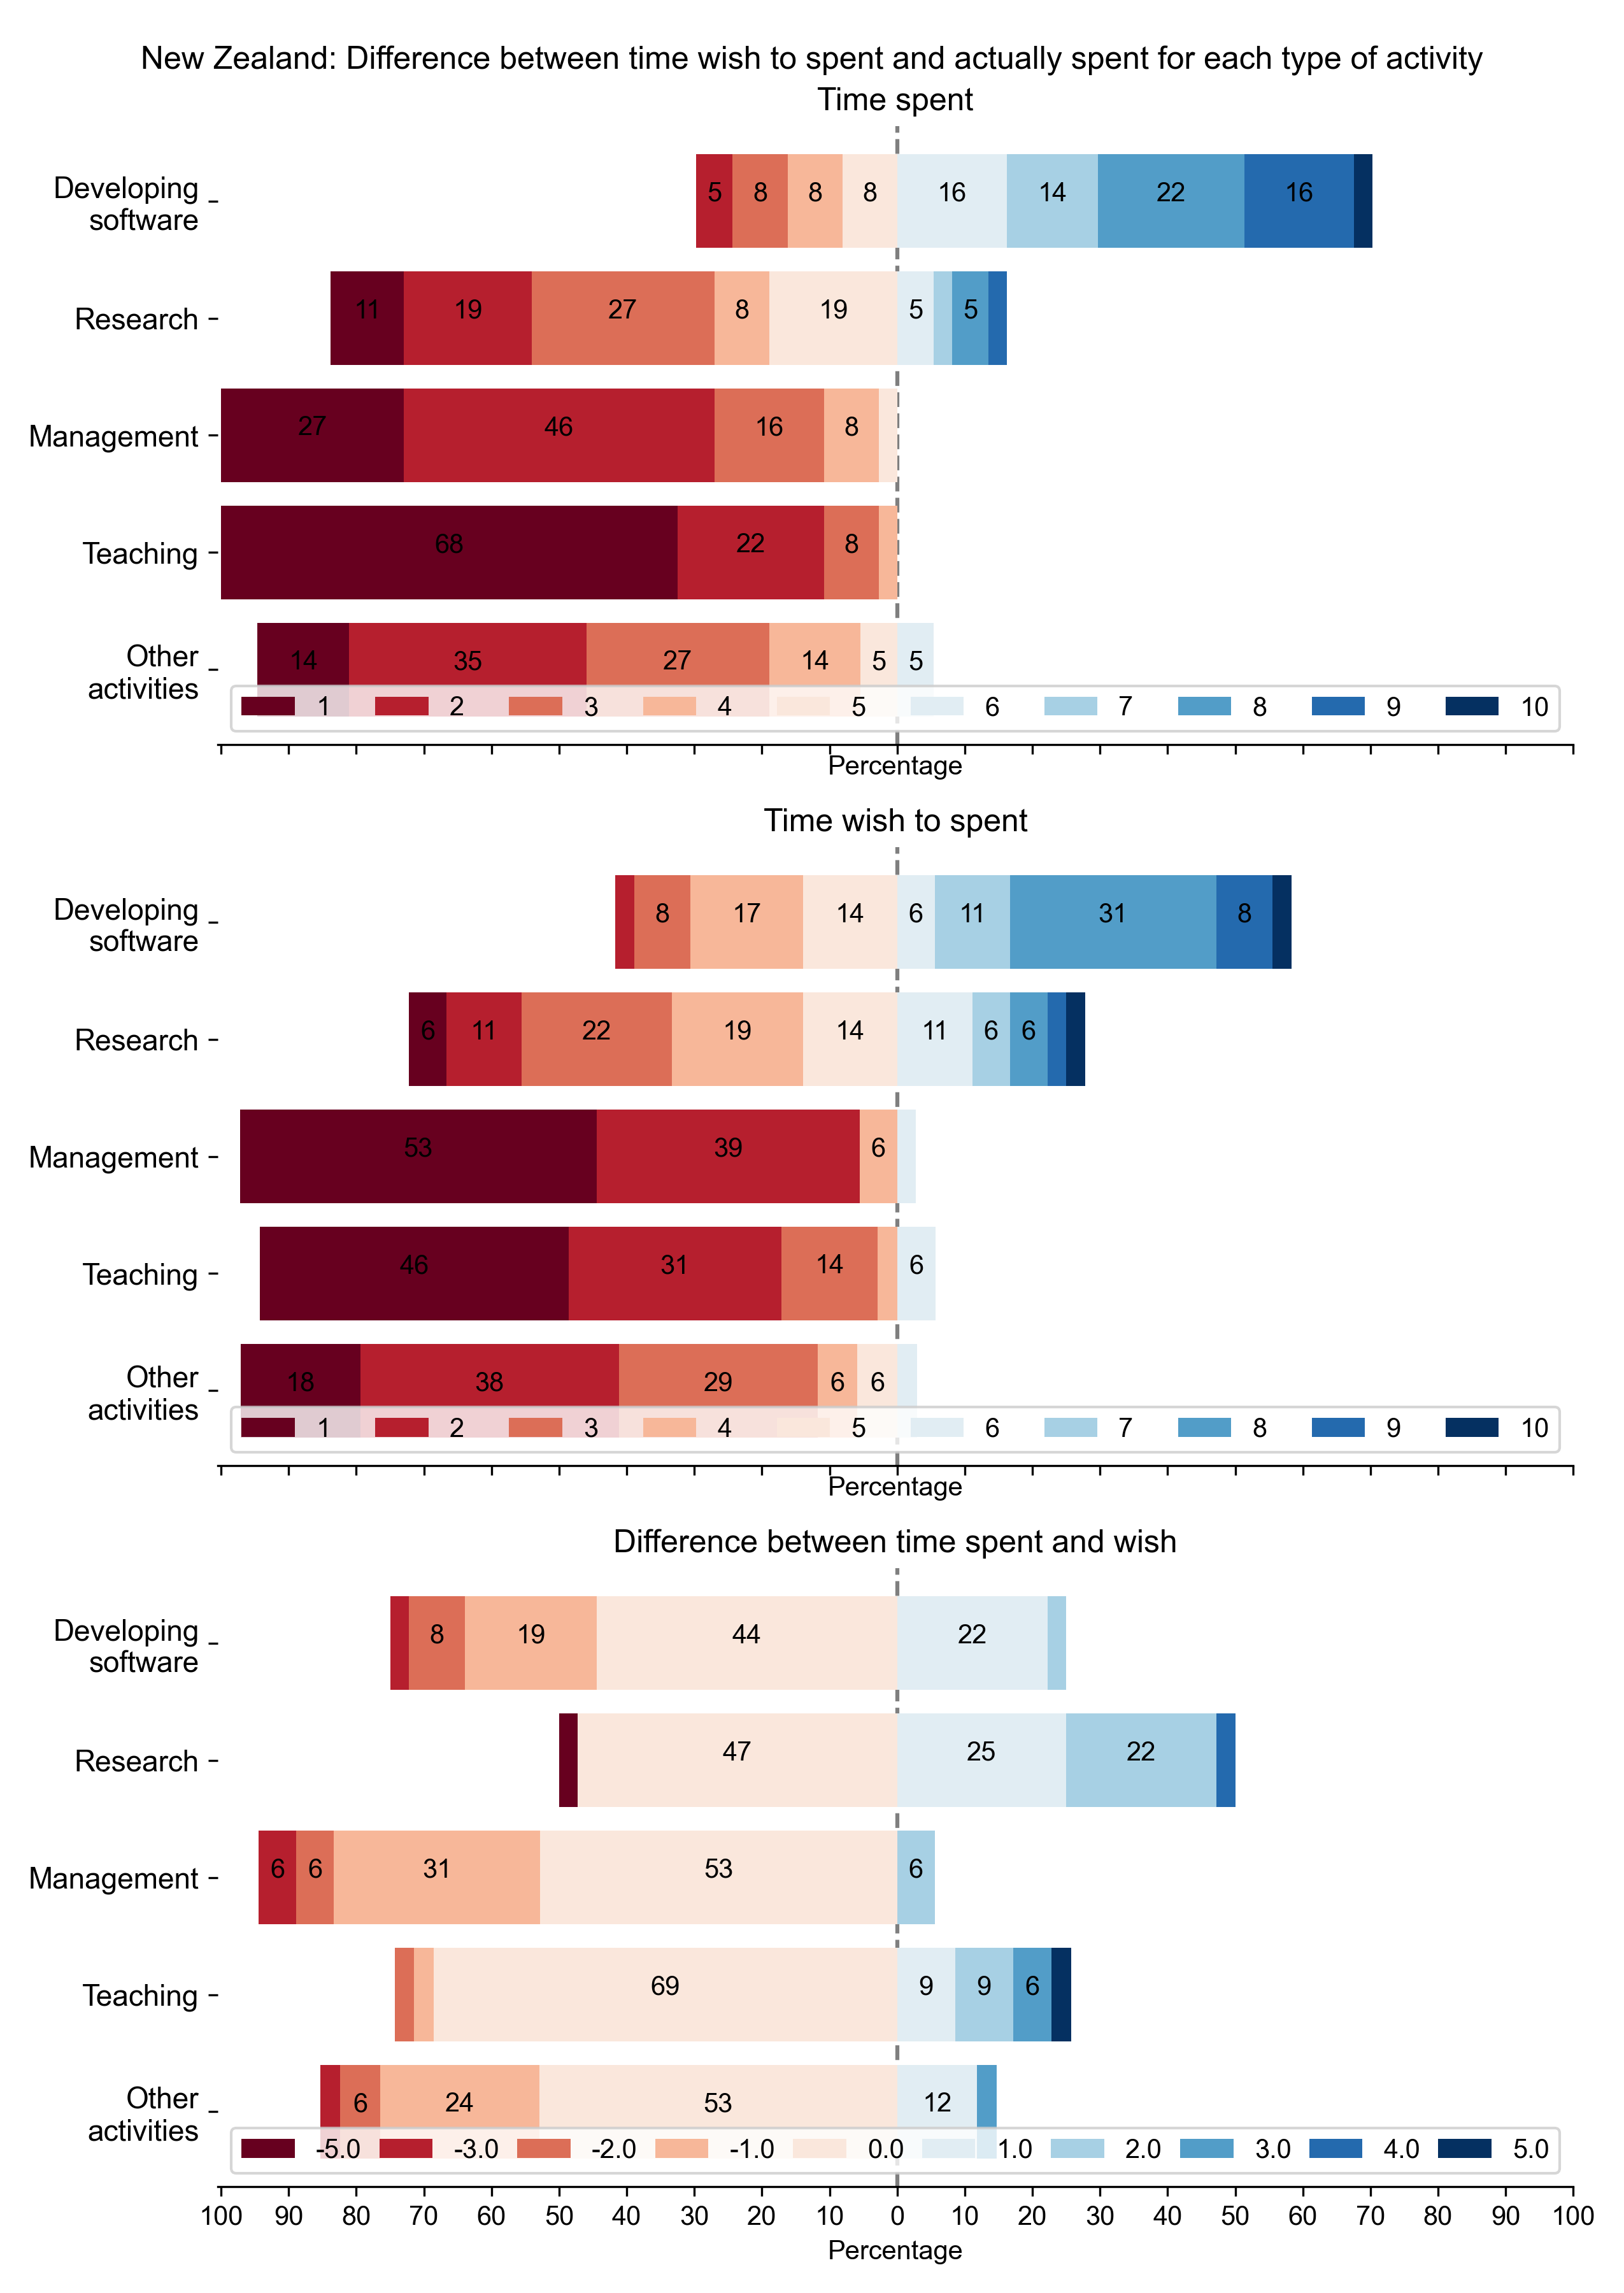
New Zealand: Difference between time wish to spent and actually spent for each type of activity
PNG SVG
2021-08-04T21:03:33.331892
image/svg+xml
Matplotlib v3.4.2, https://matplotlib.org/
Percentage
Developing
software
Research
Management
Teaching
Other
activities
13
22
26
13
9
22
17
30
13
13
26
13
26
9
13
13
26
13
26
13
17
9
9
9
9
17
13
9
Time spent
1
2
3
4
5
6
7
8
9
10
Percentage
Developing
software
Research
Management
Teaching
Other
activities
17
41
22
9
9
36
13
39
9
9
17
13
9
9
17
17
13
9
17
13
9
9
17
9
9
9
30
13
13
Time wish to spent
1
2
3
4
5
6
7
8
9
10
100
90
80
70
60
50
40
30
20
10
0
10
20
30
40
50
60
70
80
90
100
Percentage
Developing
software
Research
Management
Teaching
Other
activities
18
9
27
9
13
26
39
32
48
52
30
17
9
13
17
13
9
9
9
Difference between time spent and wish
-8.0
-5.0
-4.0
-3.0
-2.0
-1.0
0.0
1.0
2.0
3.0
4.0
5.0
6.0
South Africa: Difference between time wish to spent and actually spent for each type of activity
PNG SVG
2021-08-04T21:03:35.653141
image/svg+xml
Matplotlib v3.4.2, https://matplotlib.org/
Percentage
Developing
software
Research
Management
Teaching
Other
activities
16
28
38
11
6
23
32
30
33
13
15
15
17
25
14
14
11
8
16
13
11
8
12
22
6
15
Time spent
1
2
3
4
5
6
7
8
9
10
Percentage
Developing
software
Research
Management
Teaching
Other
activities
10
40
28
22
12
25
27
36
7
17
21
21
22
8
11
6
15
9
15
13
8
5
14
9
20
8
22
7
8
7
5
Time wish to spent
1
2
3
4
5
6
7
8
9
10
100
90
80
70
60
50
40
30
20
10
0
10
20
30
40
50
60
70
80
90
100
Percentage
Developing
software
Research
Management
Teaching
Other
activities
7
5
5
6
11
11
7
22
10
22
28
34
43
49
42
28
24
10
20
11
12
13
9
5
9
5
Difference between time spent and wish
-8.0
-6.0
-5.0
-4.0
-3.0
-2.0
-1.0
0.0
1.0
2.0
3.0
4.0
5.0
6.0
7.0
9.0
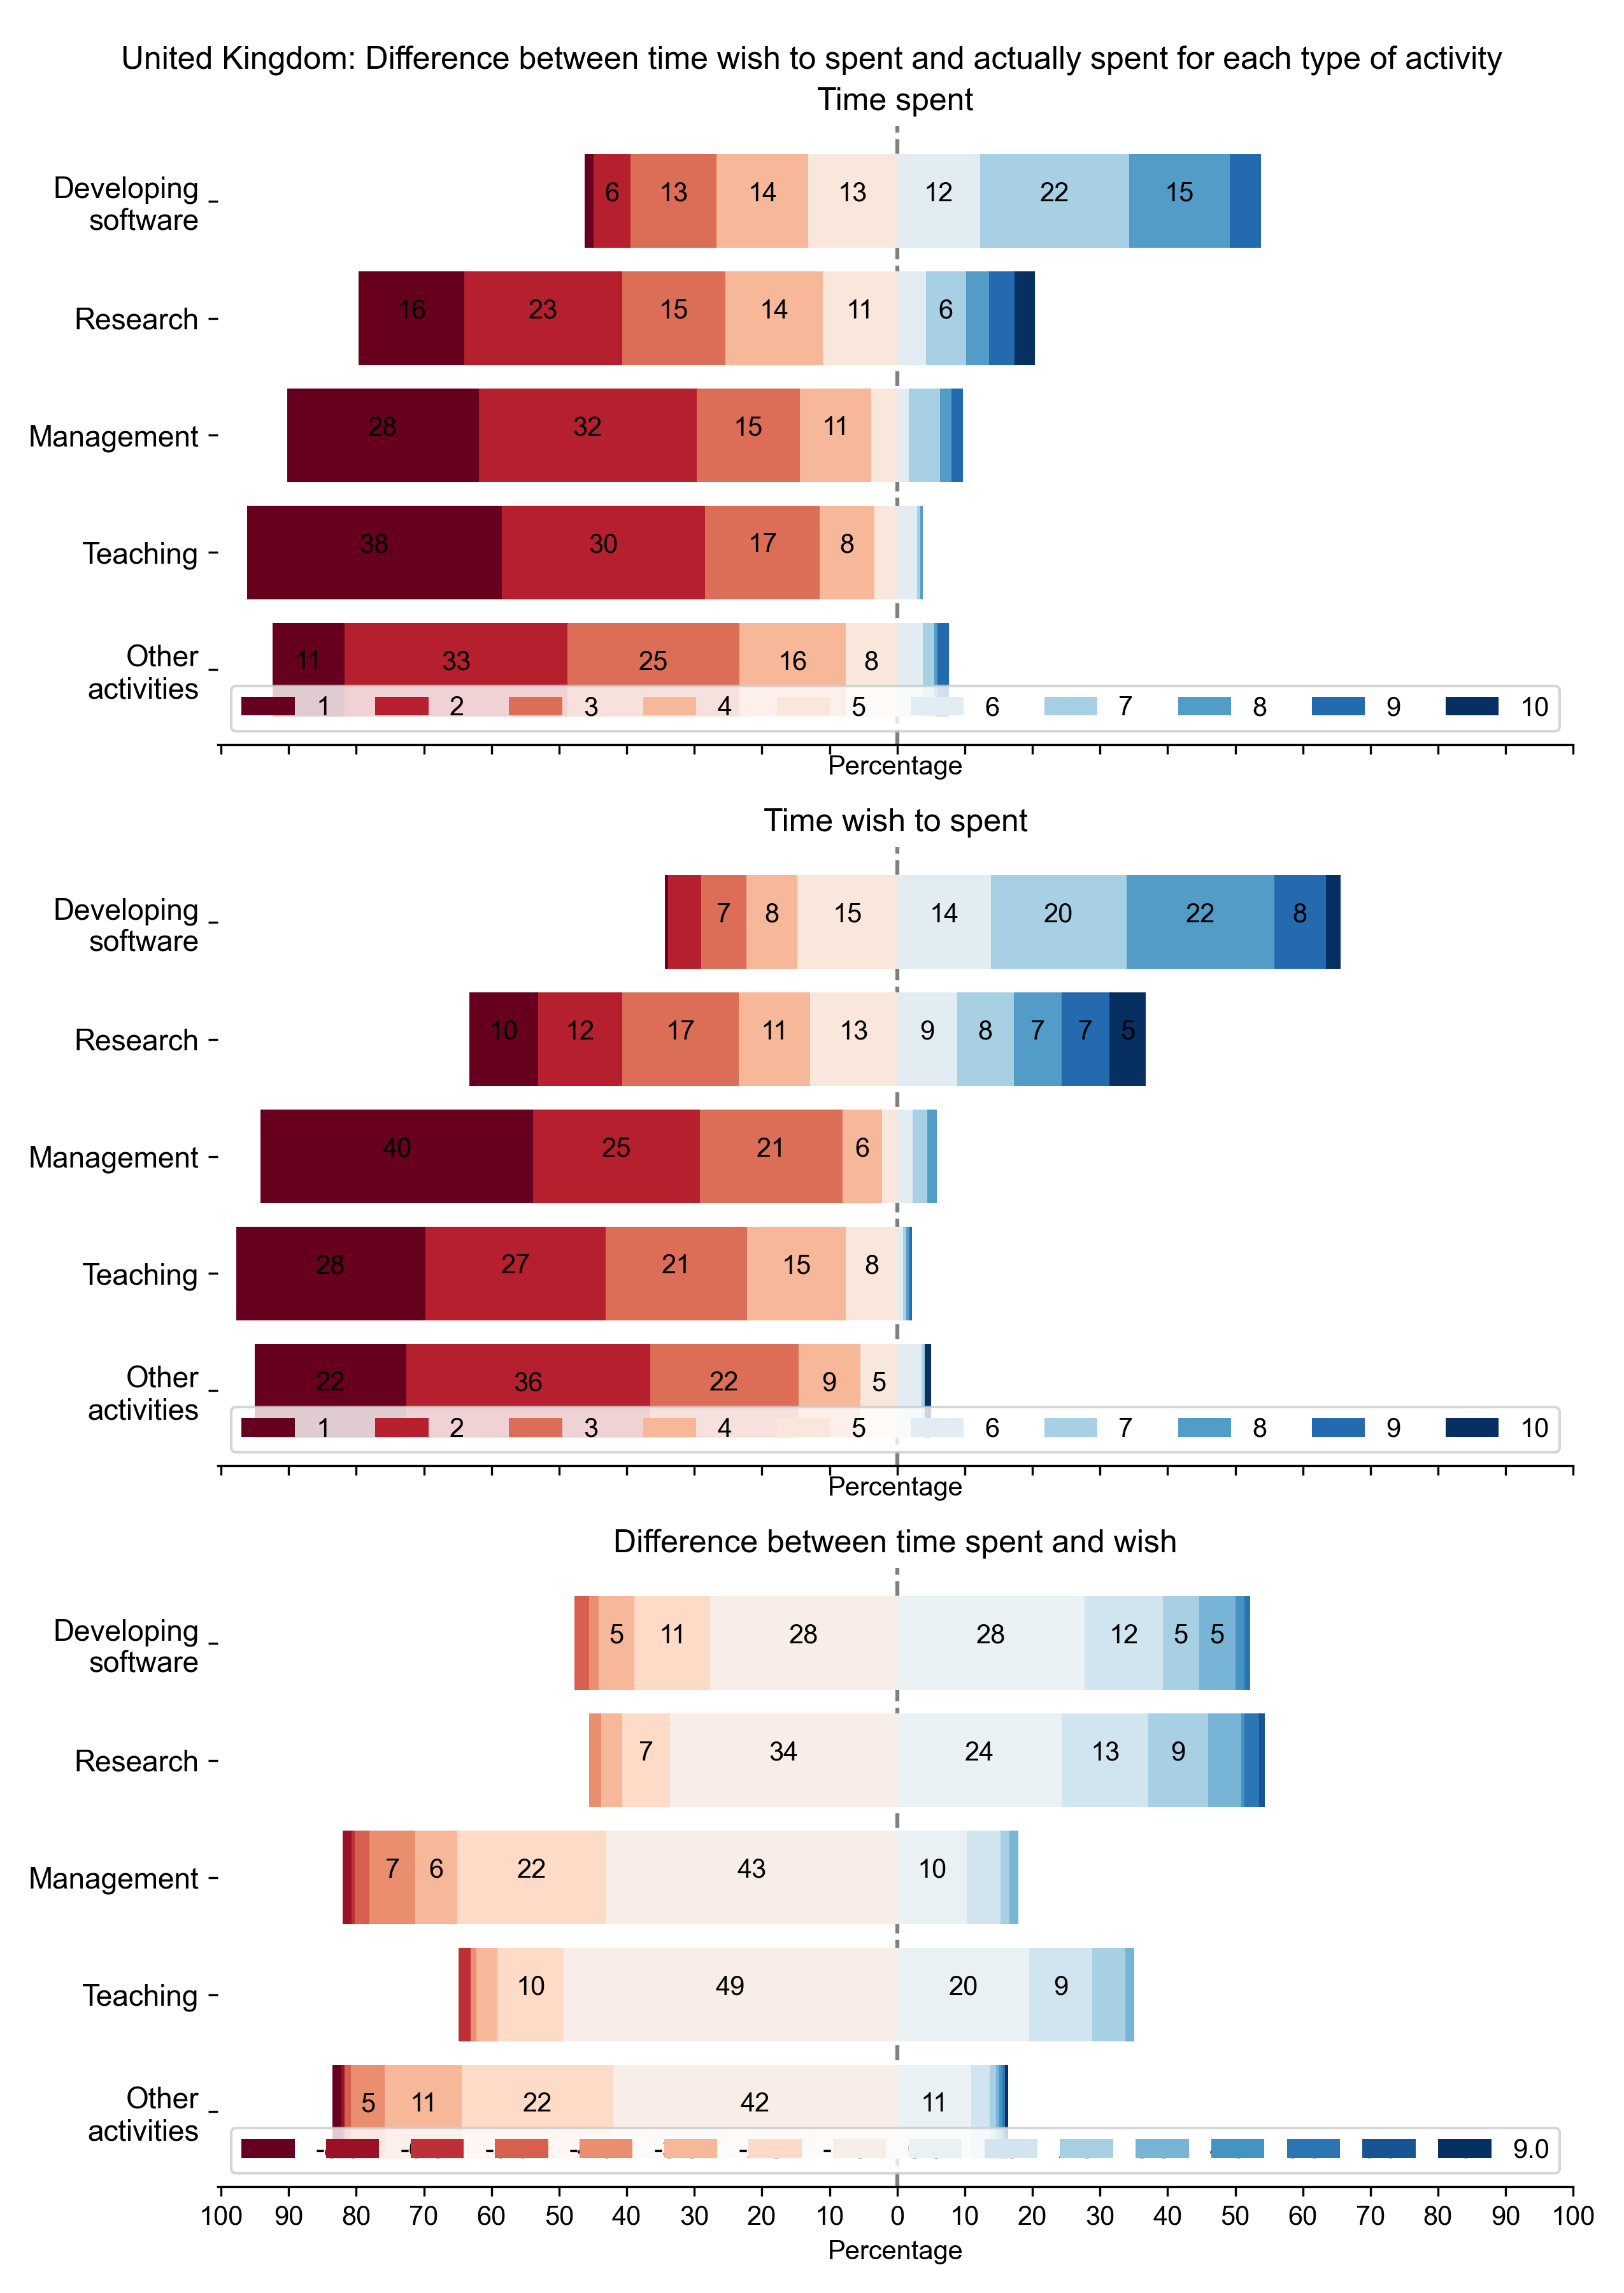
United Kingdom: Difference between time wish to spent and actually spent for each type of activity
PNG SVG
2021-08-04T21:03:37.881148
image/svg+xml
Matplotlib v3.4.2, https://matplotlib.org/
Percentage
Developing
software
Research
Management
Teaching
Other
activities
18
33
59
16
22
26
23
33
10
21
20
11
22
10
14
8
14
15
7
6
11
14
14
5
24
7
Time spent
1
2
3
4
5
6
7
8
9
10
Percentage
Developing
software
Research
Management
Teaching
Other
activities
10
42
37
26
17
33
21
32
18
12
18
24
10
11
5
14
10
11
13
6
6
16
6
20
13
23
6
8
Time wish to spent
1
2
3
4
5
6
7
8
9
10
100
90
80
70
60
50
40
30
20
10
0
10
20
30
40
50
60
70
80
90
100
Percentage
Developing
software
Research
Management
Teaching
Other
activities
6
13
10
14
20
6
25
35
37
50
48
44
20
29
18
13
8
11
6
14
8
6
6
Difference between time spent and wish
-6.0
-5.0
-4.0
-3.0
-2.0
-1.0
0.0
1.0
2.0
3.0
4.0
5.0
6.0
7.0
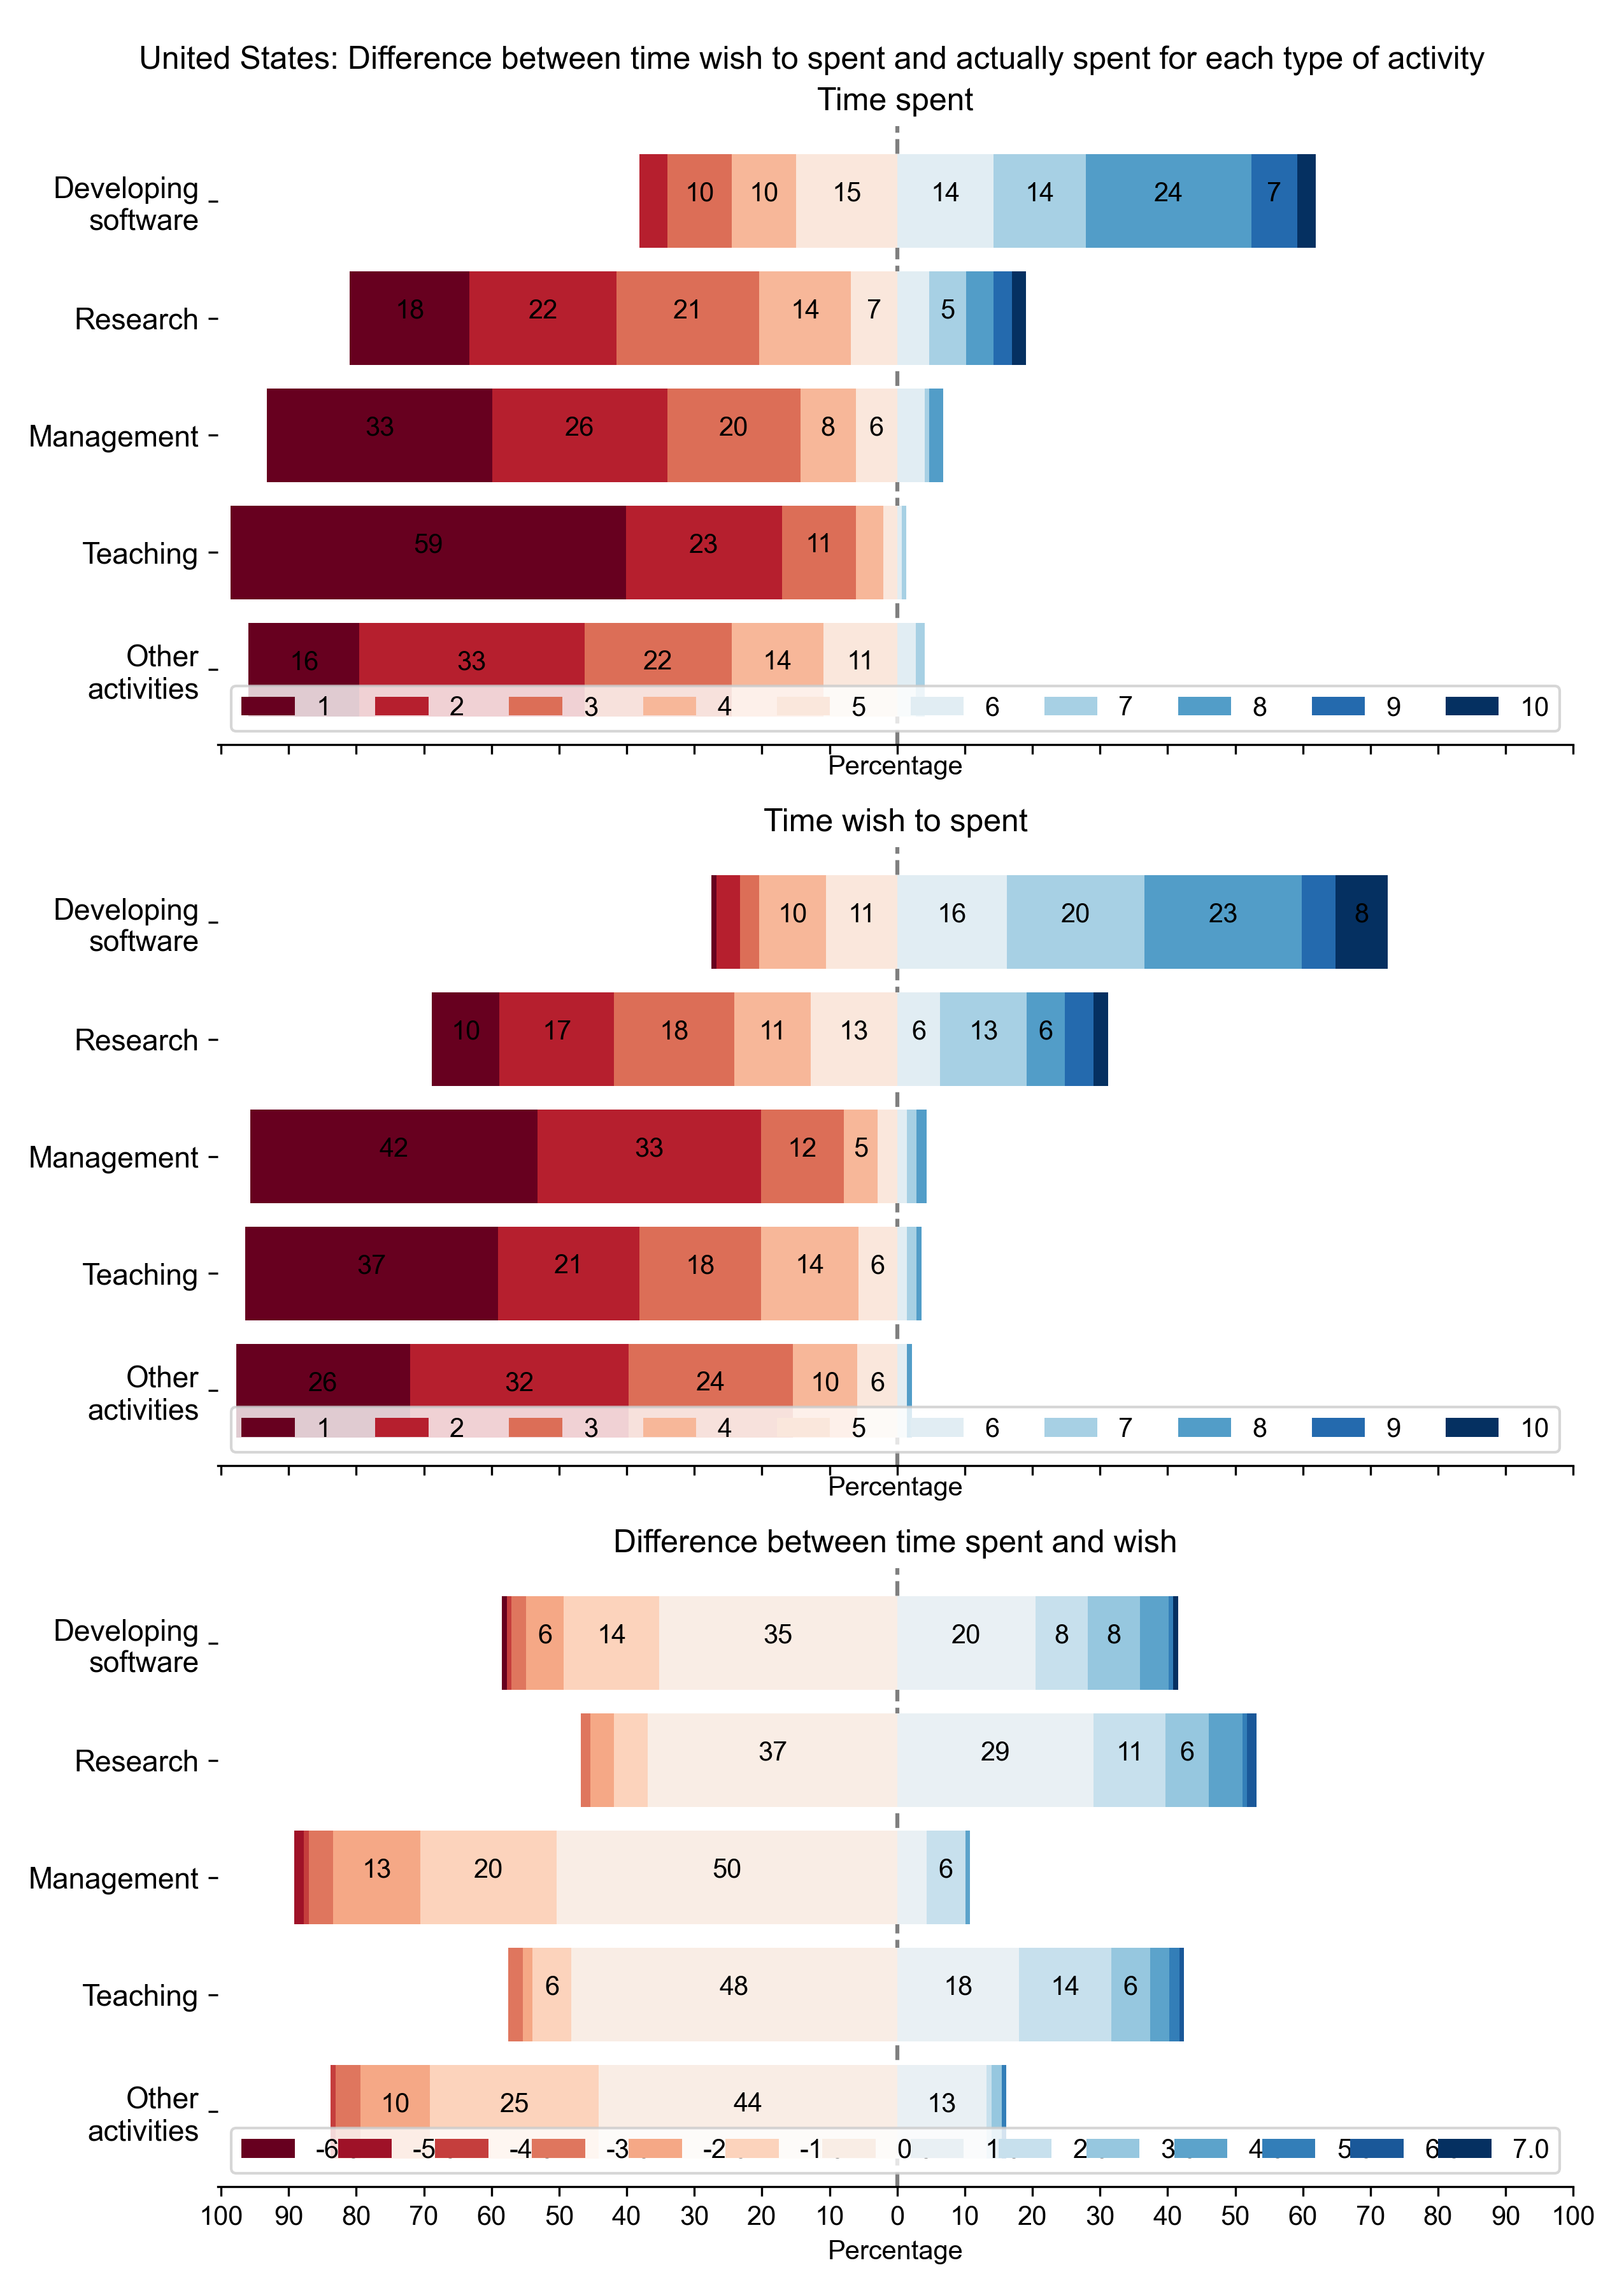
United States: Difference between time wish to spent and actually spent for each type of activity
PNG SVG
2021-08-04T21:03:40.184570
image/svg+xml
Matplotlib v3.4.2, https://matplotlib.org/
Percentage
Developing
software
Research
Management
Teaching
Other
activities
7
18
25
20
5
15
24
35
27
22
31
13
16
22
15
9
7
15
13
7
9
11
9
15
5
7
18
9
15
11
5
5
5
Time spent
1
2
3
4
5
6
7
8
9
10
Percentage
Developing
software
Research
Management
Teaching
Other
activities
6
31
14
22
8
27
25
29
6
6
16
18
16
12
20
8
20
6
19
16
16
14
14
8
17
18
19
8
15
8
8
Time wish to spent
1
2
3
4
5
6
7
8
9
10
100
90
80
70
60
50
40
30
20
10
0
10
20
30
40
50
60
70
80
90
100
Percentage
Developing
software
Research
Management
Teaching
Other
activities
8
10
8
12
8
6
22
6
20
31
33
39
39
37
25
18
14
24
20
12
22
8
22
6
10
8
Difference between time spent and wish
-7.0
-5.0
-4.0
-3.0
-2.0
-1.0
0.0
1.0
2.0
3.0
4.0
5.0
7.0
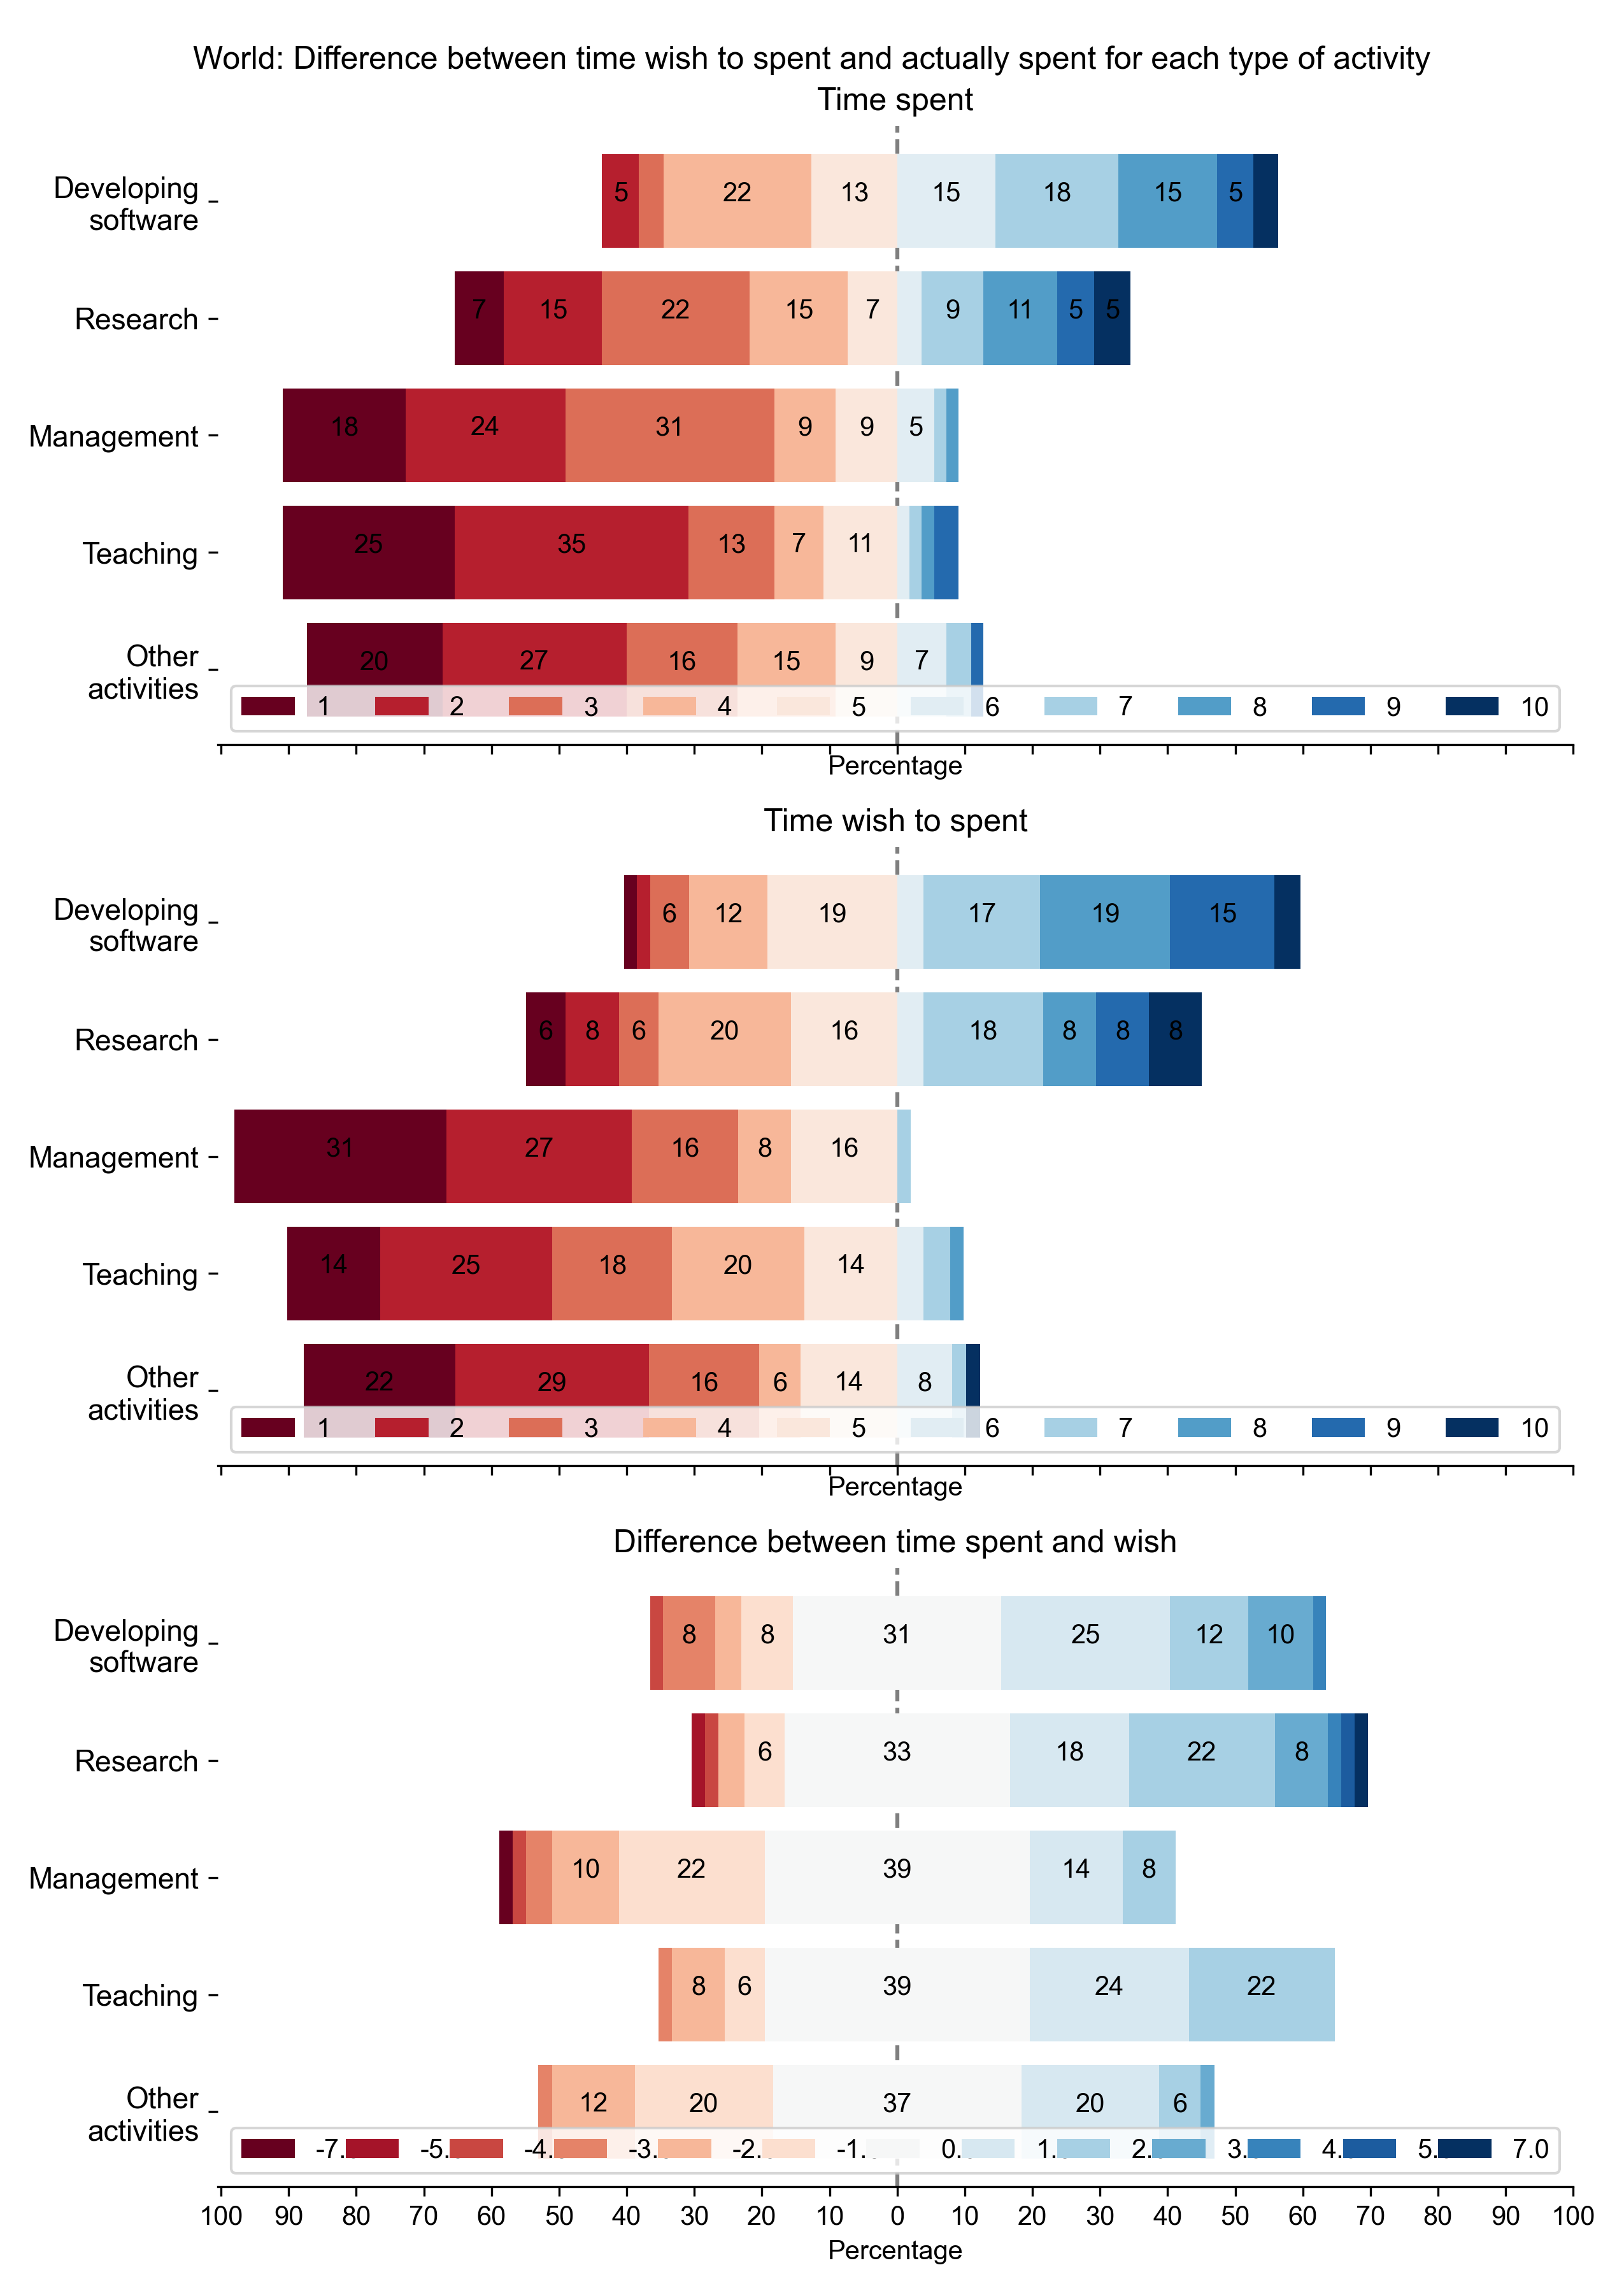
World: Difference between time wish to spent and actually spent for each type of activity
PNG SVG