Overview
- Total participants
- Repartition per country
- Visual representation of countries repartition
- Date of participation
- Difference with the previous year
- Subsetting
This page gives an overview of the participants per country. From where they come from and when they started the survey. It also gives the difference with the previous year for the countries that participated in 2017.
Alongside this information, it also subset the relevant participants for future analysis. Only the participants that have finished at least the first section and the ones that report to develop program for their work, or lead research developers, are kept.
Total participants
There were a total of 985 in the survey.
Repartition per country
We developed specific questions for the following countries:
- Australia
- Canada (but host their own version of the survey so they will not be analysed here)
- Germany
- Netherlands
- New Zealand
- South Africa
- United Kingdom
- United States
We can see the distribution of participants among the countries as follow:
| index | socio1. In which country do you work? |
|---|---|
| Germany | 333 |
| United Kingdom | 237 |
| United States | 147 |
| Australia | 99 |
| Netherlands | 54 |
| New Zealand | 37 |
| South Africa | 23 |
| Czech Republic | 6 |
| Norway | 6 |
| France | 5 |
| Italy | 4 |
| Spain | 4 |
| Belgium | 3 |
| Brazil | 3 |
| Denmark | 3 |
| Botswana | 2 |
| Ireland | 2 |
| Sweden | 2 |
| Switzerland | 2 |
| Benin | 1 |
| Ethiopia | 1 |
| Greece | 1 |
| India | 1 |
| Japan | 1 |
| Malawi | 1 |
| Mauritius | 1 |
| Nigeria | 1 |
| Poland | 1 |
| Portugal | 1 |
| Russian Federation | 1 |
| Saudi Arabia | 1 |
| Turkey | 1 |
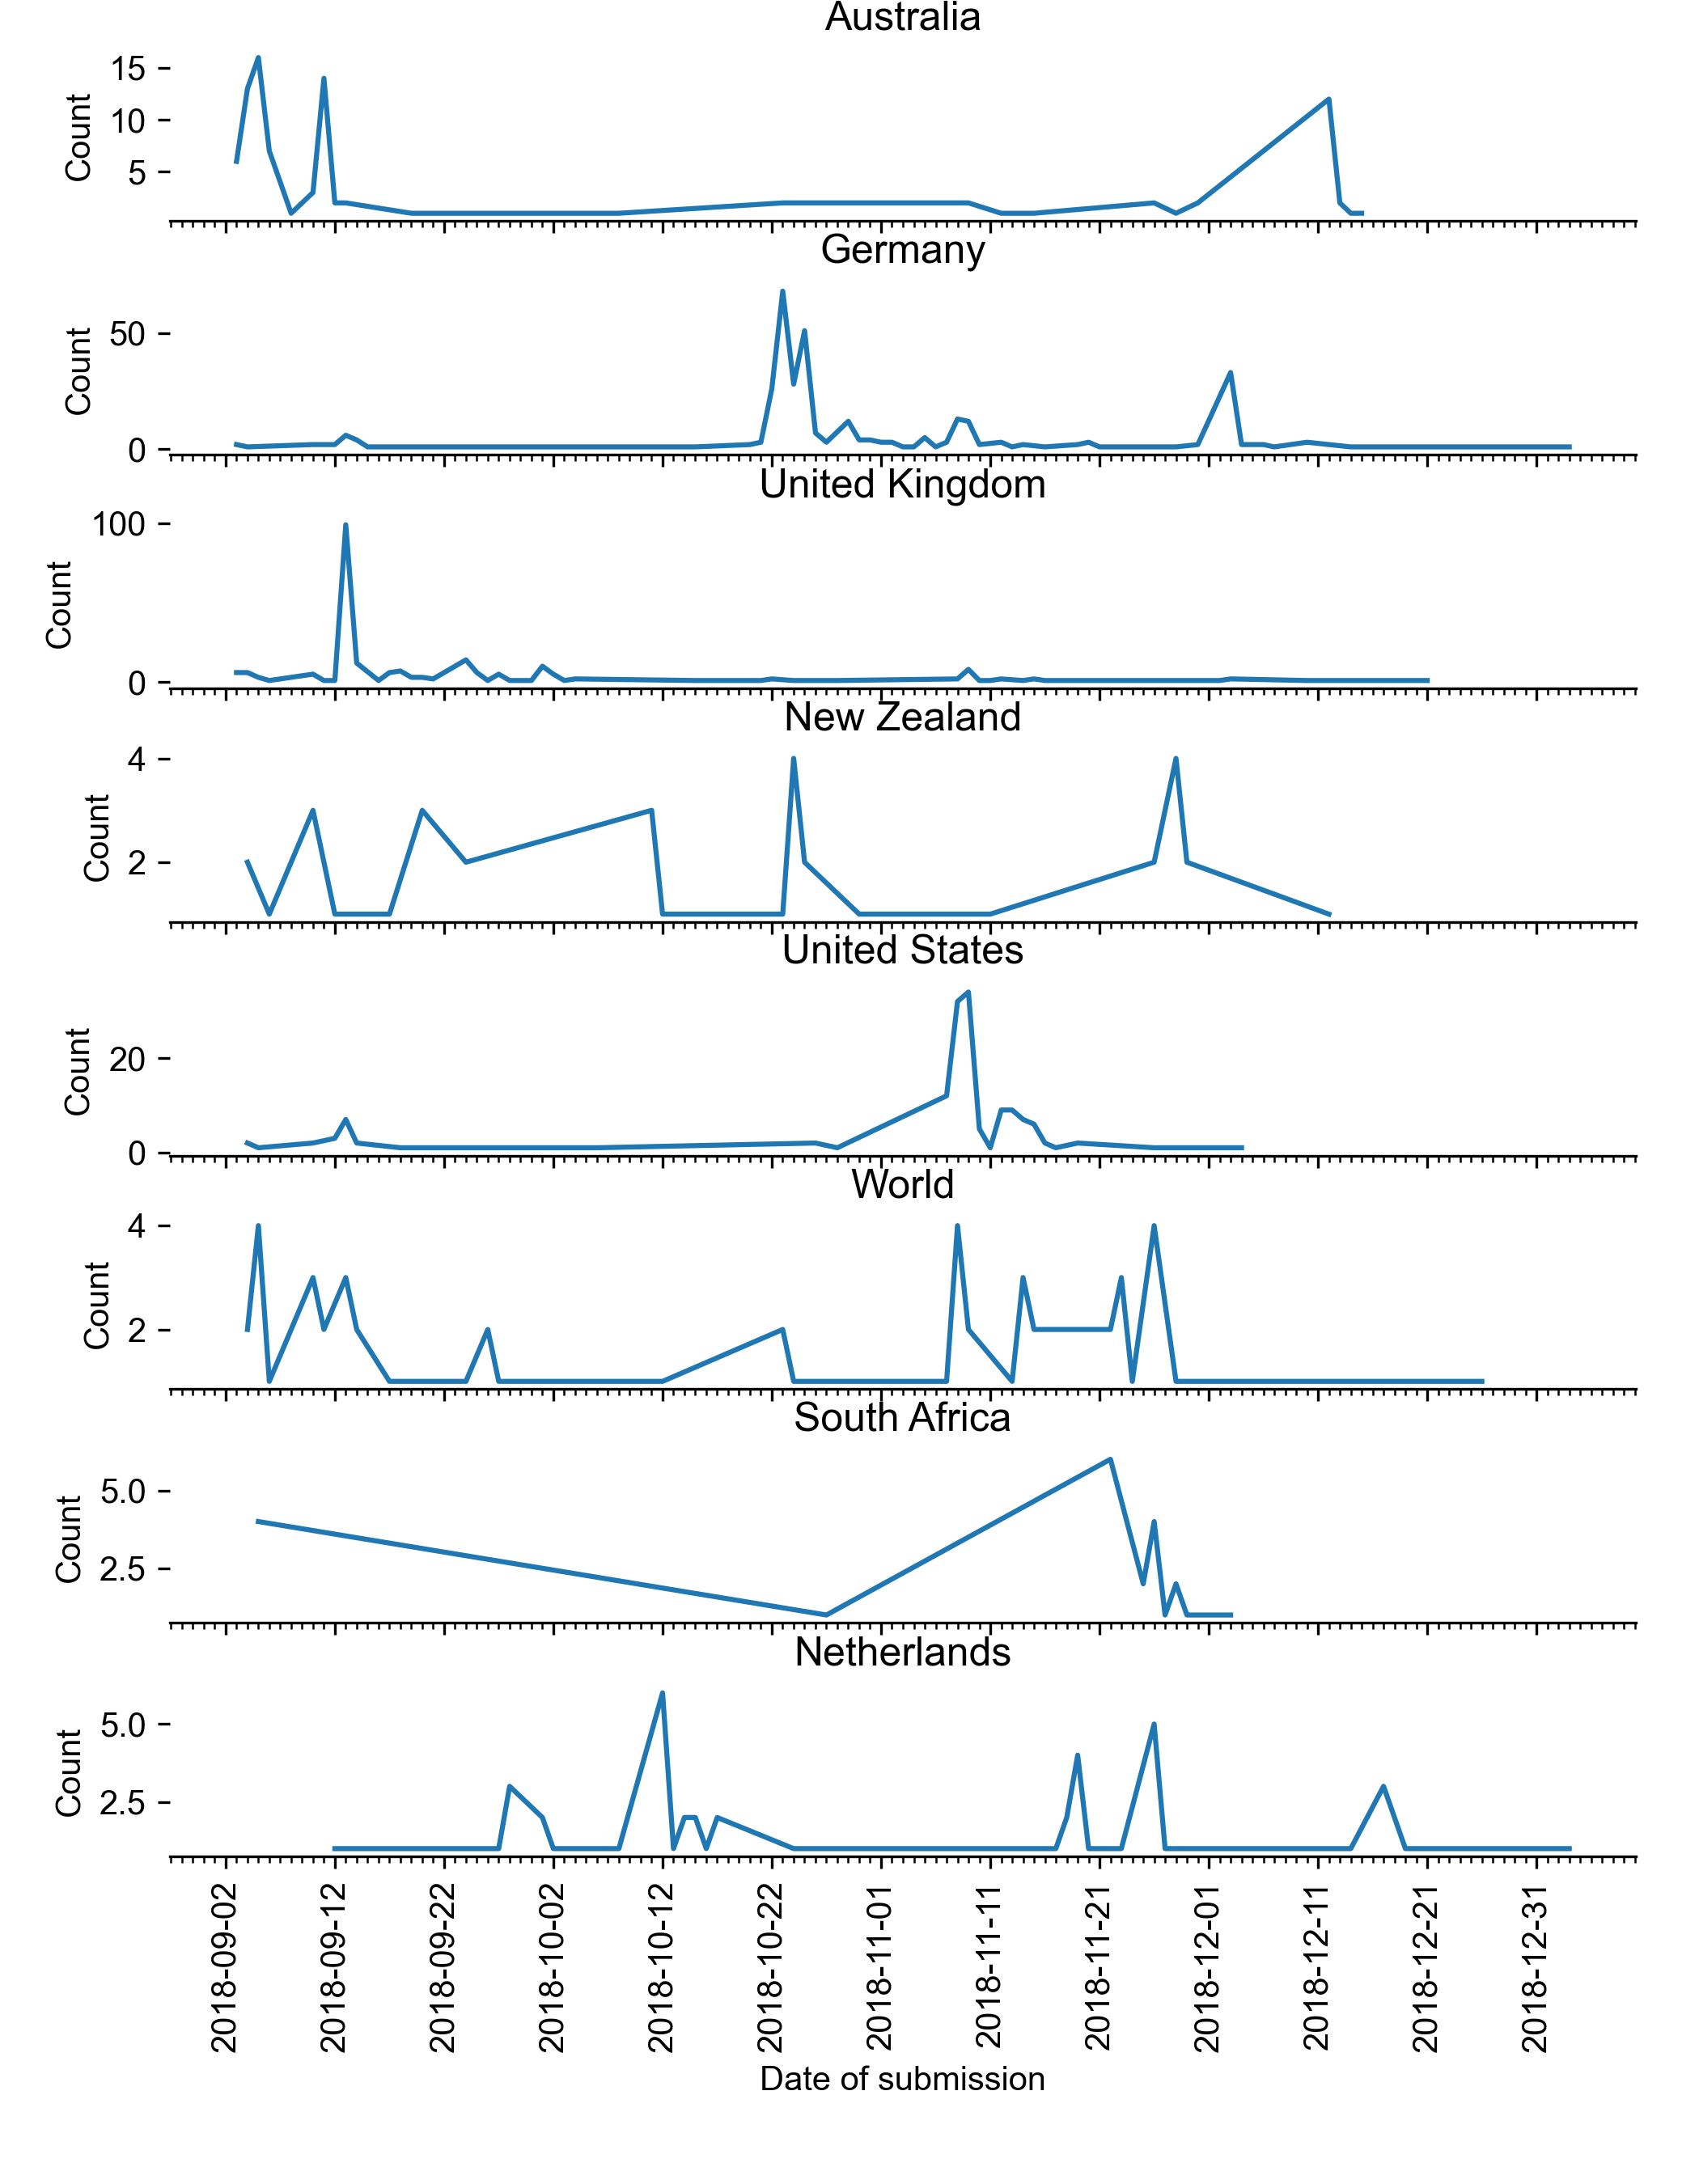
Visual representation of countries repartition
Date of participation
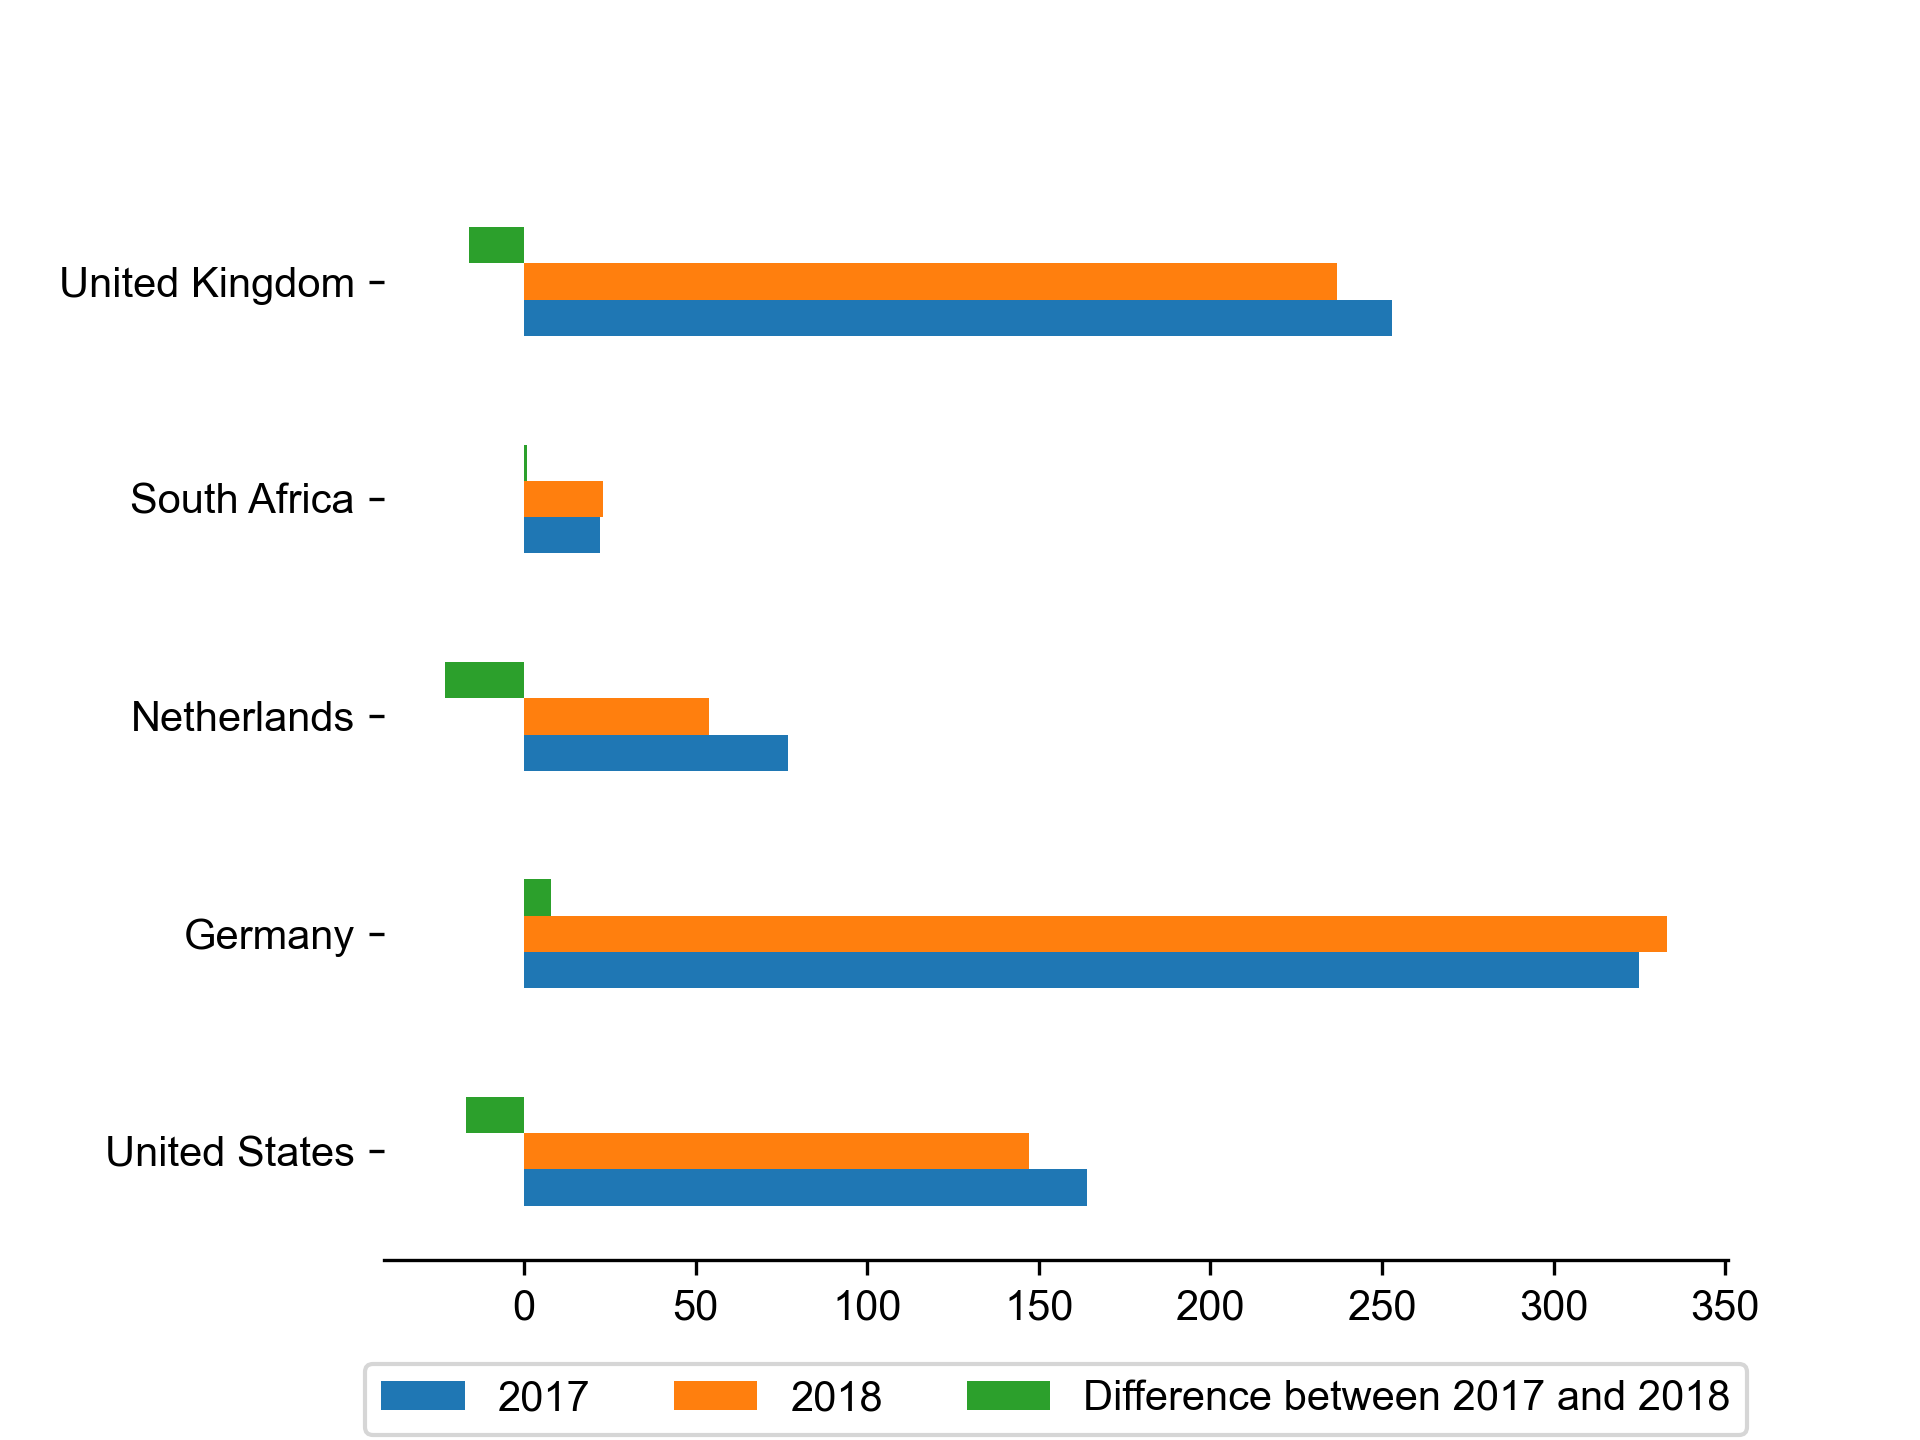
Difference with the previous year
Several countries did the survey last year, here a summary of the difference in the amount of participants.
| 2017 | 2018 | Difference between 2017 and 2018 | |
|---|---|---|---|
| United States | 164 | 147 | -17 |
| Germany | 325 | 333 | 8 |
| Netherlands | 77 | 54 | -23 |
| South Africa | 22 | 23 | 1 |
| United Kingdom | 253 | 237 | -16 |
Subsetting
Selecting valid participants only
On the total of participants, we only want the participants that code software during their work. We had a specific question for this purpose. We asked the participants if they are writing software or if they are leading a group of software developers. Each of these questions had the possibility of Yes/No answer. Here the exact wording of the questions:
- Do you write software for academic research as part of your job
- Does the majority of your role comprise leading a group of software developers or RSEs?
We will only select the participants who answered Yes to at least one question.
| Write software | Lead a team of software developers | At least one of the two | |
|---|---|---|---|
| (2017, ‘No’) | 27 | 149 | 13 |
| (2017, ‘Yes’) | 814 | 176 | 828 |
| (2018, ‘No’) | 40 | 787 | 1 |
| (2018, ‘Yes’) | 945 | 166 | 984 |
For any further analysis, we remove the participants that answered ‘No’ at both of the question to only keep the ones that have work involving software development for both year to ensure a proper comparison. This brings the number of participants analysed to:
| Participants in 2017 | Participants in 2018 | |
|---|---|---|
| 0 | 828 | 984 |